the psychology of preference elicitation - harvard university
TRANSCRIPT
The Psychology of Preference Elicitation
David Laibson
Harvard University
May, 2004

2
Building Decision-Making Aids
Five Step “Game” played between Agent and Expert
1. Expert elicits preferences from Agent
2. Expert aggregates information and calculates Advice
3. Expert transfers Advice to Agent
4. Agent makes Choice
5. Payoffs realized (and Evaluation)

3
Game
• Players: Agent and Expert
• Information:
–Agent has noisy information about own tastes, including idiosyncratic tastes
–Expert has aggregate knowledge of population tastes and computational resources
• Payoffs: Action/revelation/cognition costs and true preferences over outcome states
4
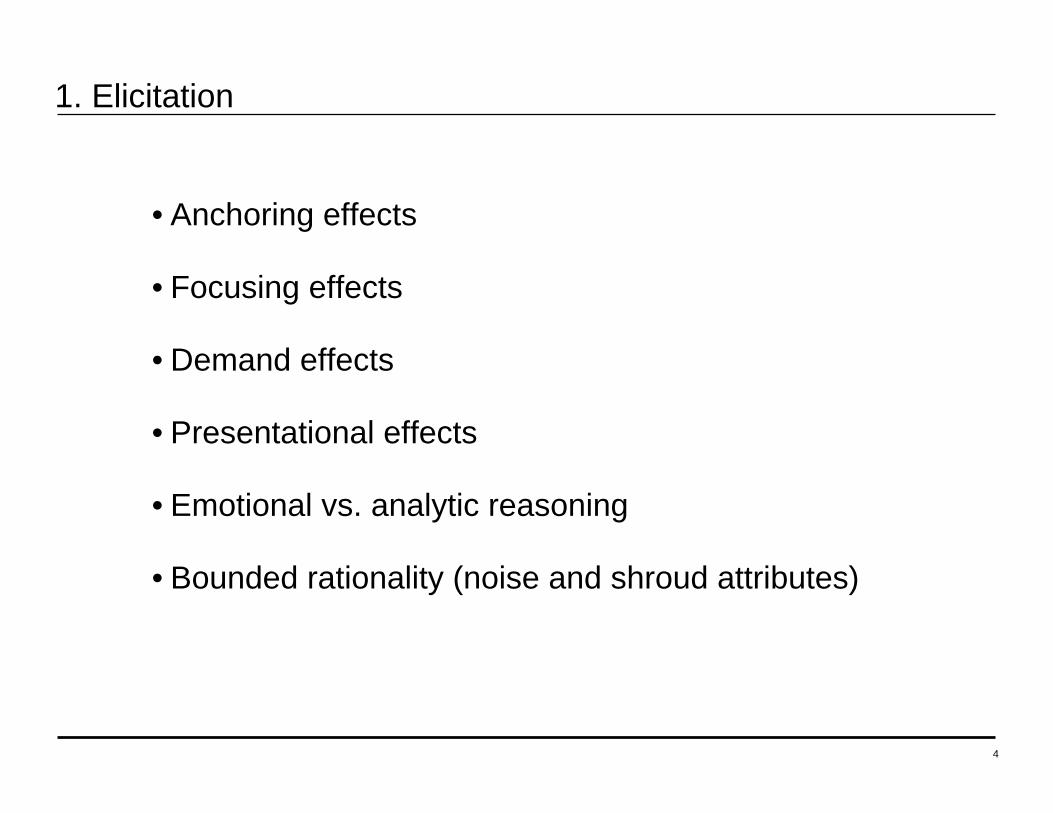
1. Elicitation
• Anchoring effects
• Focusing effects
• Demand effects
• Presentational effects
• Emotional vs. analytic reasoning
• Bounded rationality (noise and shroud attributes)

5
Dual process cognitionEmotional system
• limbic
• fast
• parallel
• affective
• unconscious
• experiential
• associationist
• connectionist
• analogical
Analytic system
• cortical
• slow
• serial
• logical
• conscious
• hypothetical
• creative
• forward-looking
• abstract

6
Shiv and Fedorikhin (1999)
• Cognitive/deliberative mental processing resources manipulated by having people keep a 2-digit or 7-digit number in mind as they walk from one room to another
• On the way, subjects face choice between piece of cake or fruit-salad
59%Low (remember 7 digits)
37%High (remember only 2 digits)
% choosing cakeFree processing resources
"Heart and Mind in Conflict: Interplay of Affect and Cognitionin Consumer Decision Making," Journal of Consumer Research, Vol. 26 (December 1999), 278-282.

7
McClure, Laibson, Loewenstein, and Cohen (2004)
• Do consumers think differently about immediate rewards and delayed rewards?
• Does immediacy have a special emotional drive/reward component?
• Subjects choose between two rewards:
– $15 gift certificate at t or $20 gift certificate at t`>t
• Look for differential brain activation when immediacy is present (i.e., when t=0).
8
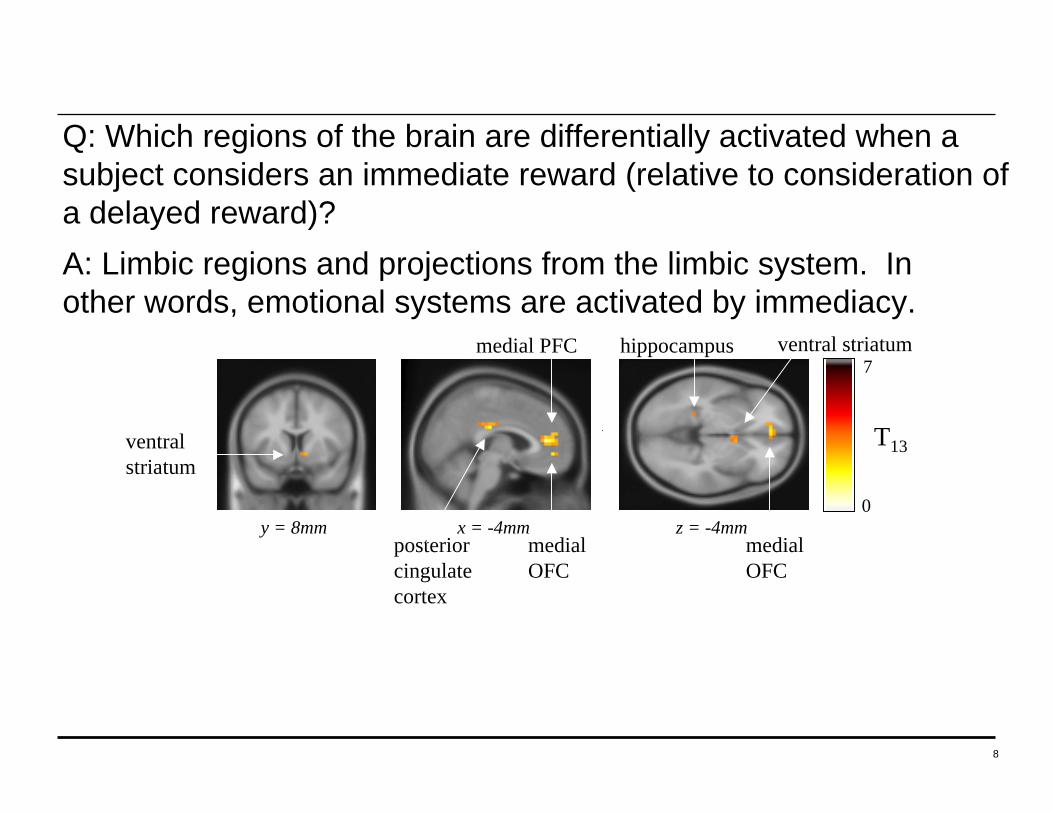
y = 8mm x = -4mm z = -4mm0
7
T13ventralstriatum
posteriorcingulatecortex
medial PFC
medialOFC
hippocampus
medial OFC
ventral striatum
Q: Which regions of the brain are differentially activated when a subject considers an immediate reward (relative to consideration of a delayed reward)?A: Limbic regions and projections from the limbic system. Inother words, emotional systems are activated by immediacy.

9
McClure, Laibson, Loewenstein, Cohen (2004)
y = 8mmx = -4mm z = -4mm0
7
T13
Offset = Today Offset = 2 weeks Offset = 1 month
A
B
0.2%
2s
VStr MOFC MPFC PCC

10
McClure, Laibson, Loewenstein, Cohen (2004)
x = 44mm
x = 0mm
Offset = Today Offset = 2 weeks Offset = 1 month
A B
0 15T13
VCtx
0.4%
2s
PMA RPar
DLPFC VLPFC LOFC

11
McClure, Laibson, Loewenstein, Cohen (2004)
DifficultEasy
VCtx RPar
DLPFC VLPFC LOFC
0.4%
2s
PMA
0%
25%
50%
75%
100%
1-3% 5-25% 35-50%
P(ch
oose
ear
ly)
A B
C
RT
(s)
2.5
3.0
3.5
4.0
4.5
DifficultEasy
12
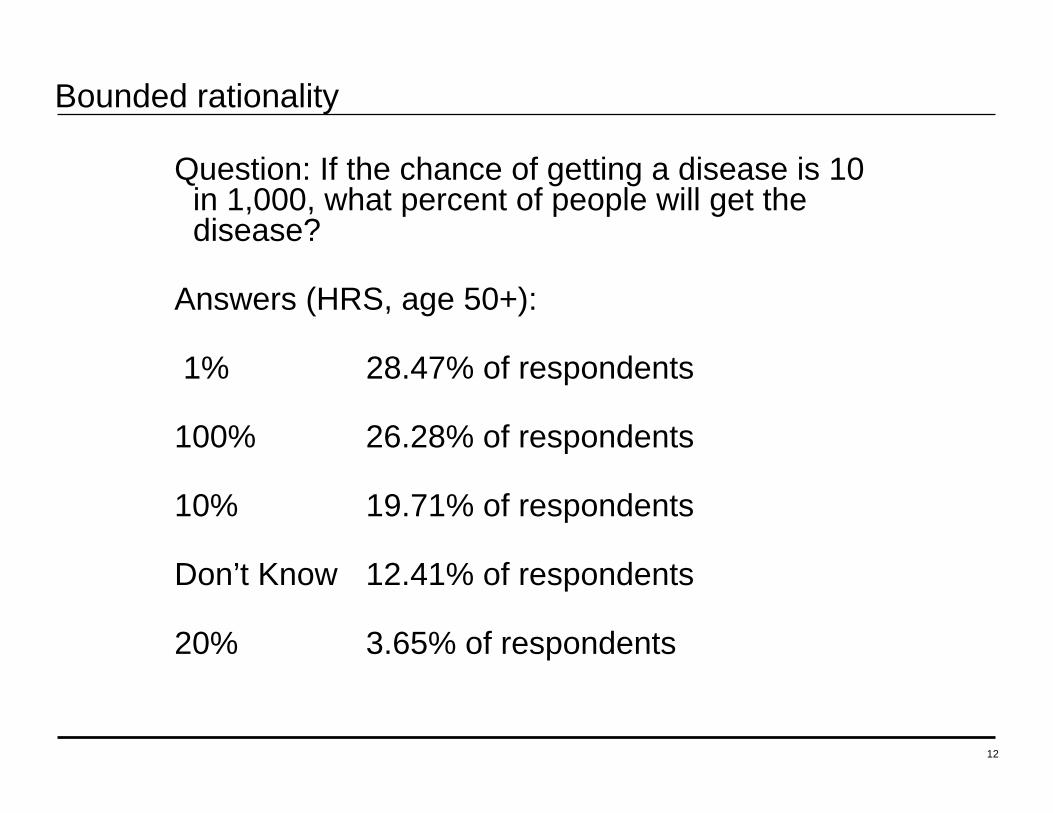
Bounded rationality
Question: If the chance of getting a disease is 10 in 1,000, what percent of people will get the disease?
Answers (HRS, age 50+):
1% 28.47% of respondents
100% 26.28% of respondents
10% 19.71% of respondents
Don’t Know 12.41% of respondents
20% 3.65% of respondents

13
Bounded Rationality
• 1/N asset allocation (Benartzi and Thaler 2002)
• Experiment (Choi, Gabaix, Laibson, and Madrian 2004)
–Subjects pick among 4 mutual funds (each with prospectus)
–1 of 36 subjects gets to keep upside of $10,000 investment
–One mutual fund charges 70 basis points less than others
–Only 25% of assets allocated to the low cost fund
–But 44% allocated to the low cost fund when subjects have an additional sheet that lists fund fees
14
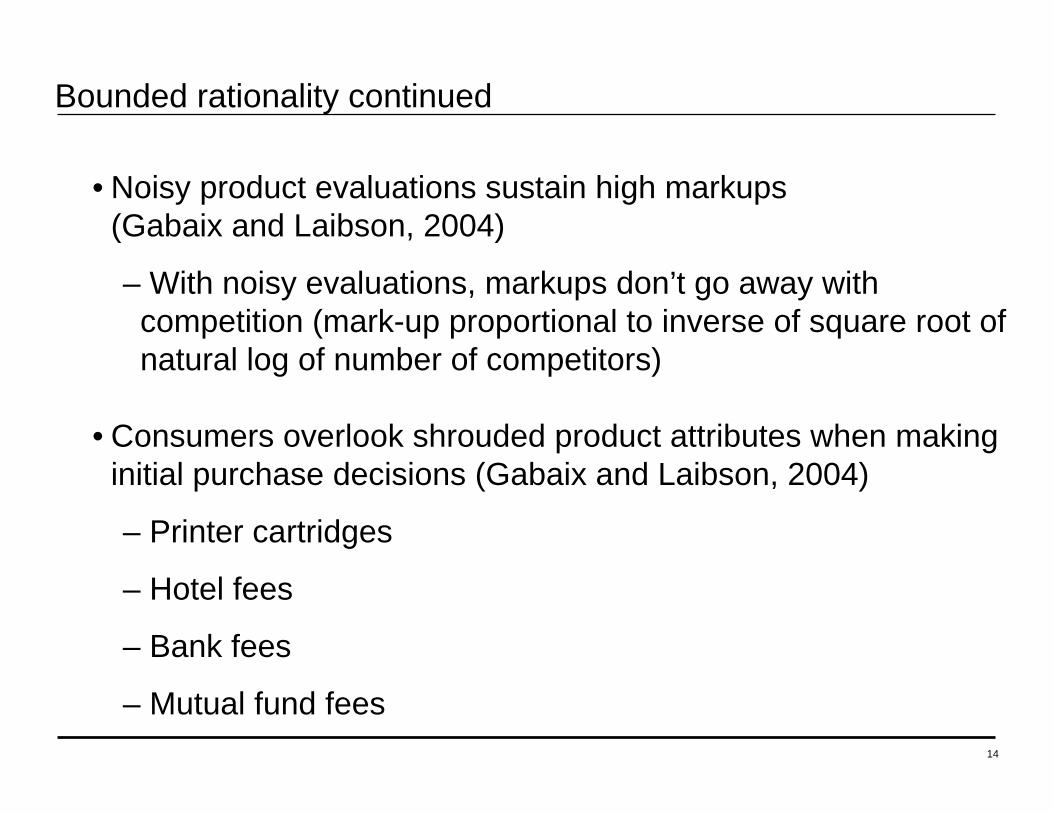
Bounded rationality continued
• Noisy product evaluations sustain high markups (Gabaix and Laibson, 2004)
– With noisy evaluations, markups don’t go away with competition (mark-up proportional to inverse of square root of natural log of number of competitors)
• Consumers overlook shrouded product attributes when making initial purchase decisions (Gabaix and Laibson, 2004)
– Printer cartridges
– Hotel fees
– Bank fees
– Mutual fund fees

15
Choi, Laibson, Madrian (2004)
• Employer match is an instantaneous, riskless return on investment
• Particularly appealing if you are over 59½ years old
–Have the most experience, so should be savviest
–Retirement is close, so should be thinking about saving
–Can withdraw money from 401(k) without penalty, so contribution is liquid
• We study seven companies and find that on average, 39% of employees over 59½ years old are not fully exploiting their employer match
–Average loss is $460 every year, or 1.6% of salary

16
2. Aggregation and Computation
Expert adds three things.
1. Aggregate preference knowledge (facilitates signal-noise extraction and collaborative filtering)
2. Expertise (personal printers have a shrouded cost $40;)
3. Maximization algorithms and CPU

17
3. Advice
Advice can come in many forms:
• Recommendation (ranking of n items)
• Default choice
• Active decision
• Education
• Salience manipulation

18
Motivating the problem: Choi, Laibson, Madrian, Metrick (2002) Knowing what to do is not enough.
• Survey
–Mailed to 590 employees (random sample)
–195 usable responses
–Matched to administrative data on actual savings behavior
• Consider a population of 100 employees
–68 report saving too little
–24 of 68 plan to raise 401(k) contribution rate in next 2 months
–Only 3 of 24 actually do so in the next 4 months

19
Standard enrollmentMost companies require employees to initiate 401(k) enrollment themselves.
• Welcome to the company
• If you want to enroll in the 401(k), call this phone number
• If you don’t do anything, you will not be enrolled in the 401(k)

20
Automatic enrollmentAutomatic enrollment signs employees up for the 401(k) plan unless they opt out.
• Welcome to the company
• If you don’t do anything
–You are automatically enrolled in the 401(k) at a 2% savings rate
–Your contributions will go into a money market fund
• Call this phone number to opt out of enrollment or change your investment allocations
21
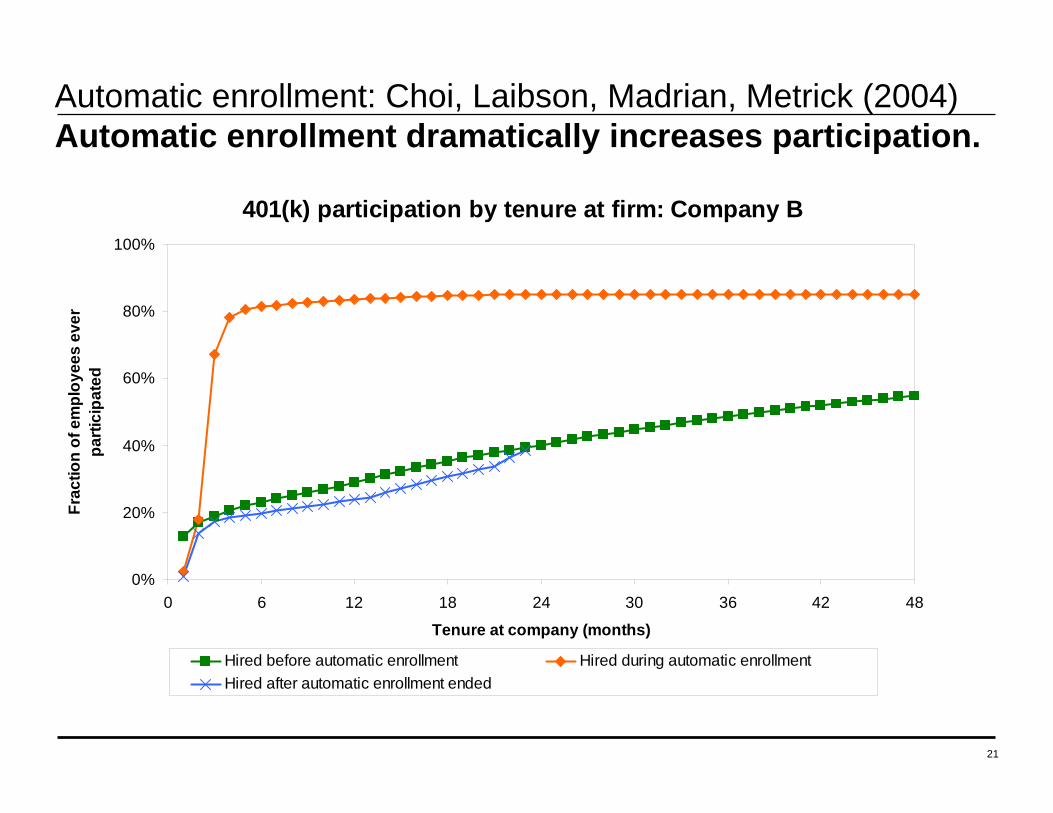
Automatic enrollment: Choi, Laibson, Madrian, Metrick (2004) Automatic enrollment dramatically increases participation.
401(k) participation by tenure at firm: Company B
0%
20%
40%
60%
80%
100%
0 6 12 18 24 30 36 42 48
Tenure at company (months)
Frac
tion
of e
mpl
oyee
s ev
er
parti
cipa
ted
Hired before automatic enrollment Hired during automatic enrollment Hired after automatic enrollment ended
22
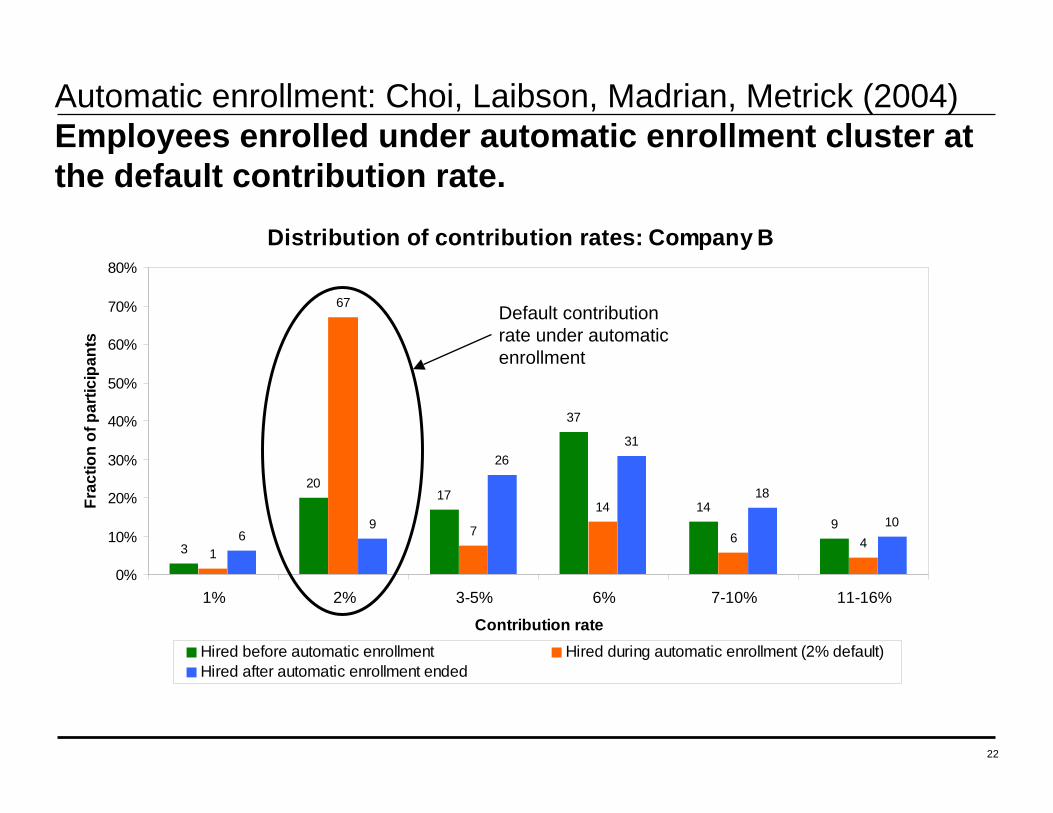
Distribution of contribution rates: Company B
3
2017
37
149
1
67
7
14
6 469
2631
18
10
0%
10%
20%
30%
40%
50%
60%
70%
80%
1% 2% 3-5% 6% 7-10% 11-16%
Contribution rate
Frac
tion
of p
artic
ipan
ts
Hired before automatic enrollment Hired during automatic enrollment (2% default) Hired after automatic enrollment ended
Automatic enrollment: Choi, Laibson, Madrian, Metrick (2004) Employees enrolled under automatic enrollment cluster at the default contribution rate.
Default contributionrate under automaticenrollment

23
Persistence of defaults: Choi, Laibson, Madrian, Metrick (2004) Participants stay at the automatic enrollment defaults for a long time.
Fraction of participants hired during automatic enrollmentat both default contribution rate and asset allocation
0%
20%
40%
60%
80%
100%
0 6 12 18 24 30 36 42 48
Tenure at company (months)
Frac
tion
of p
artic
ipan
ts
Company B Company C Company D

24
Automatic enrollment: Conclusions
• Automatic enrollment dramatically increases 401(k) participation
• Participants hired under automatic enrollment tend to stay at the automatic enrollment defaults
• Bottom line: Employers need to choose defaults that facilitate retirement savings goals of employees who follow the path of least resistance. Possibilities:
–Higher initial default contribution rates
–Contribution rates that ratchet up with tenure by default
–More aggressive default funds
–Defaults tailored to each employee
–Defaults that kick in with a delay

25
Active decisions: Choi, Laibson, Madrian, Metrick (2004) Active decision mechanisms require employees to make an active choice about 401(k) participation.
• Welcome to the company
• You are required to submit this form within 30 days of hire, regardless of your 401(k) participation choice
• If you don’t want to participate, indicate that decision on the form and submit it
• If you want to participate, indicate your contribution rate and asset allocation on form and submit it
• Being passive is not an option

26
Active decision:: Choi, Laibson, Madrian, Metrick (2004) 401(k) participation increases substantially when employees are not allowed to be passive about savings.
401(k) participation by tenure: Company E
0%
20%
40%
60%
80%
100%
0 6 12 18 24 30 36 42 48 54Tenure at company (months)
Frac
tion
of e
mpl
oyee
s ev
er
parti
cipa
ted
Active decision cohort Standard enrollment cohort
27
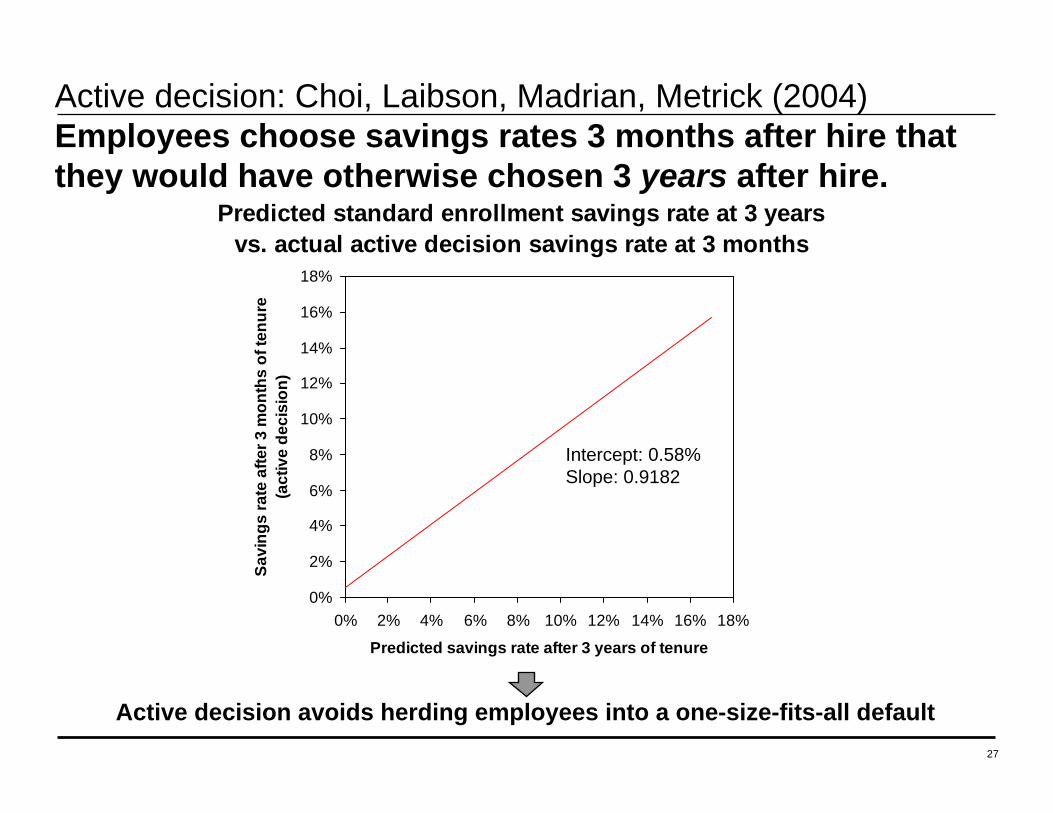
Active decision: Choi, Laibson, Madrian, Metrick (2004) Employees choose savings rates 3 months after hire that they would have otherwise chosen 3 years after hire.
Predicted standard enrollment savings rate at 3 years vs. actual active decision savings rate at 3 months
0%
2%
4%
6%
8%
10%
12%
14%
16%
18%
0% 2% 4% 6% 8% 10% 12% 14% 16% 18%
Predicted savings rate after 3 years of tenure
Savi
ngs
rate
afte
r 3 m
onth
s of
tenu
re
(act
ive
deci
sion
)
Intercept: 0.58%Slope: 0.9182
Active decision avoids herding employees into a one-size-fits-all default

28
Active decision: Conclusions
• Active decision significantly raises 401(k) participation, but not as much as automatic enrollment
• Active decision doesn’t induce clustering of choices around defaults
• Under active decision, employees choose savings rates that they otherwise would have taken three years to get to
• Because active decision requires that passivity not be an option, it is important that the deadline for indicating a decision is enforced
• Extension: Can require employees to make an active decision about their 401(k) every year rather than just at hire (e.g. during open enrollment period for other benefits)
• Bottom line: Active decision is an attractive alternative to defaults. At the end of this presentation, we will discuss when one is more appropriate than the other.
29
Employer match threshold and contribution ratesWe present a case study of a company that changed its employer match threshold.
• Matching at Company G
–Through 12/31/1996-50% match rate-Matched contributions up to 6% of salary (5% if unionized)
–Increased match threshold on 1/1/1997-50% match rate-Matched contributions up to 8% of salary (7% if unionized)
30
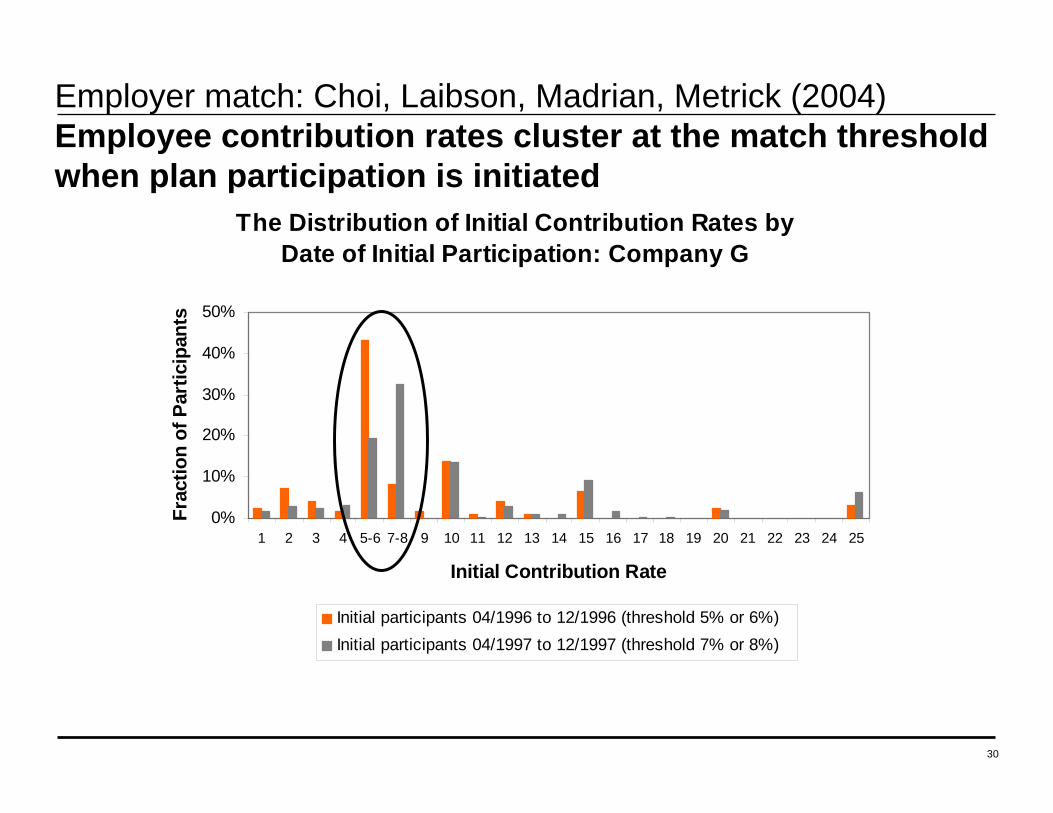
Employer match: Choi, Laibson, Madrian, Metrick (2004) Employee contribution rates cluster at the match threshold when plan participation is initiated
The Distribution of Initial Contribution Rates by Date of Initial Participation: Company G
0%
10%
20%
30%
40%
50%
1 2 3 4 5-6 7-8 9 10 11 12 13 14 15 16 17 18 19 20 21 22 23 24 25
Initial Contribution Rate
Frac
tion
of P
artic
ipan
ts
Initial participants 04/1996 to 12/1996 (threshold 5% or 6%) Initial participants 04/1997 to 12/1997 (threshold 7% or 8%)
31
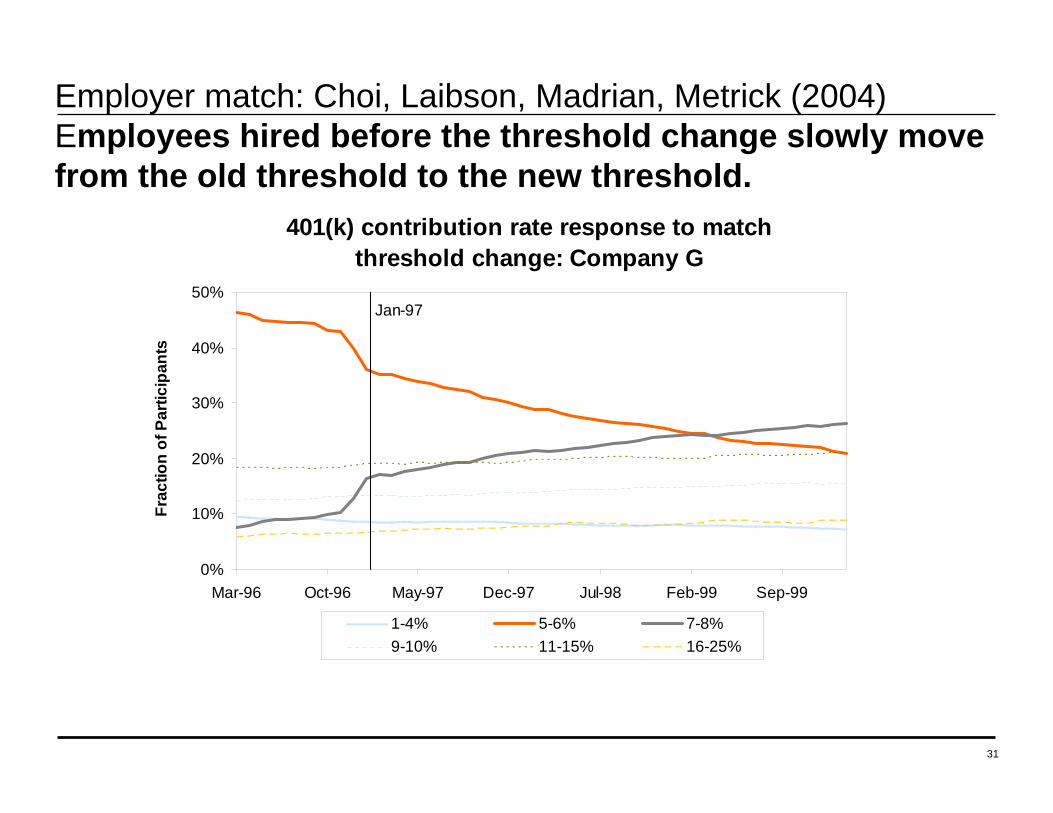
Employer match: Choi, Laibson, Madrian, Metrick (2004) Employees hired before the threshold change slowly move from the old threshold to the new threshold.
401(k) contribution rate response to match threshold change: Company G
0%
10%
20%
30%
40%
50%
Mar-96 Oct-96 May-97 Dec-97 Jul-98 Feb-99 Sep-99
Frac
tion
of P
artic
ipan
ts
1-4% 5-6% 7-8%9-10% 11-15% 16-25%
Jan-97

32
Other examples of passive decision-making
• Cash distributions at separation (Choi et al 2004)
• Automatic savings escalators increase savings rates (Benartziand Thaler)
• 401(k) participants often randomly pick mutual funds from their plan menu and allocate money equally among them (Benartziand Thaler)
• Employer matches made into company stock tend not to get moved into other investments, even when there are no restrictions on diversification
33
Financial education: Choi, Laibson, Madrian, Metrick (2004) Can financial education help overcome passivity?
• Problems with most studies of financial education effects:
–Education is not randomly assigned. Oserved effect may reflect selective attendance by only those people who were going to make good decisions anyway.
–Effect measured by asking people either what they remember doing, or what they plan on doing-People have very bad memories-People are not very good at following through on their savings plans
34
Financial education: Choi, Laibson, Madrian, Metrick (2004) Company E offered financial education to its employees.
• Seminars presented by a financial education company
• Curriculum: Setting savings goals, asset allocation, managing credit and debt, insurance against financial risks
• Seminars offered throughout 2000
• Linked data on individual employees’ seminar attendance to administrative data on actual savings behavior before and after seminar

35
Financial education: Choi, Laibson, Madrian, Metrick (2004) The difference in behavior between attendees and non-attendees is positive but small.
6%10%36%Change asset allocation
10%15%47%Change fund selection
5%8%28%Increase contribution rate
Those already in 401(k) plan
7%14%100%Enroll in 401(k) Plan
Those not in 401(k) plan
% actually made
change
% actually made
change
% planning to make change
Non-attendeesSeminar attendees

36
Financial education: Conclusions
• Financial education does affect 401(k) savings behavior
• BUT the effects are not large
• Seminar attendees have good intentions to change their 401(k) savings behavior, but most do not follow through
• Bottom line: financial education alone will not dramatically improve the quality of 401(k) savings outcomes
• We have also studied the effect of the Enron/Worldcom/Global Crossing scandals on employer stock holdings
–We find minimal diversification out of employer stock in reaction to these news stories

37
Building Decision-Making Aids
Five Step “Game”
1. Expert elicits preferences from Agent
2. Expert aggregates information and calculates Advice
3. Expert transfers advice to Agent
4. Agent makes Choice
5. Payoffs realized (and Evaluation)

38
Further readingThis presentation is based on the following papers.
Choi, Gabaix, Laibson, and Madrian (2004). “Noise in the Market for Mutual Funds.” Harvard University mimeo.
Choi, Laibson, and Madrian (2004). “$100 Bills on the Sidewalk: Violations of No-Arbitrage in 401(k) Plans.” Harvard University mimeo.
Choi, Laibson, Madrian, and Metrick (2004). “Active Decisions: A Natural Experiment in Savings.” Harvard University mimeo.
Choi, Laibson, Madrian, and Metrick (2003). “Optimal Defaults.” American Economic Review 93, pp. 180-185.
Choi, Laibson, Madrian, and Metrick (2002). “Defined Contribution Pensions: Plan Rules, Participant Choices, and the Path of Least Resistance.” In James Poterba, editor, Tax Policy and the Economy 16, pp. 67-114.
Choi, Laibson, Madrian, and Metrick (2001). “For Better or For Worse: Default Effects and 401(k) Savings Behavior.” In David Wise, editor, Perspectives in the Economics of Aging, forthcoming.