the properties and mathematics of data transport quality
TRANSCRIPT

Delivering “Quality”Quality Attenuation
Exploiting the Understanding
The Properties and Mathematics ofData Transport Quality
A Brief Introduction to ’Quality’ in Data Networks; its Interactionwith End User Experience, its Conservation, Propagation, and
how it can be Traded, Costed and Managed.
Neil Davies
Predictable Network Solutions [email protected]
Ofcom, Riverside House5th February 2009
Neil Davies Properties of Data Transport Quality – an Introduction(c) 2009 Predictable Network Solutions Ltd

Delivering “Quality”Quality Attenuation
Exploiting the Understanding
Outline
1 Delivering “Quality”Layered Viewpoint“Would you Like Quality with that, Sir?”Relationship with End User Experience
2 Quality AttenuationFundamental PropertiesRepresentation and MeasurementCompositional Properties
3 Exploiting the UnderstandingApplying it to the Application(s)Applying it to the Network(s)Applying it to the Economics
Neil Davies Properties of Data Transport Quality – an Introduction(c) 2009 Predictable Network Solutions Ltd

Delivering “Quality”Quality Attenuation
Exploiting the Understanding
Layered Viewpoint“Would you Like Quality with that, Sir?”Relationship with End User Experience
Delivering QualityLayered View
For an end-user to achieve a certain quality of experience, anapplication interacts (with a server or another application) acrossthe network.
For any particular application, the quality the user experiences willdepend on how quickly the application can interact (with theremote peer) across the network.
Neil Davies Properties of Data Transport Quality – an Introduction(c) 2009 Predictable Network Solutions Ltd

Delivering “Quality”Quality Attenuation
Exploiting the Understanding
Layered Viewpoint“Would you Like Quality with that, Sir?”Relationship with End User Experience
Delivering QualityNot Just Quantity – Some Frequently Asked Questions:
1 Doesn’t it depend on the specific application? Yes and no.Badly designed or written applications can make things worse,however the delivered end-to-end quality is now typicallydominating the delivered quality of experience.
2 Isn’t more bandwidth more quality? No.It doesn’t matter how much bandwidth you deliver, if the delayis large (or rapidly varying) enough or the loss rate is highenough then the application will fail.
3 So why do people keep on talking about adding bandwidth asthe answer? Adding more resources may resolve some issuesunder limited circumstances. We’ll return to this point later.
Any given application’s effectiveness depends on end-to-end qualitybeing available in sufficient quantity – no more, no less.
Neil Davies Properties of Data Transport Quality – an Introduction(c) 2009 Predictable Network Solutions Ltd

Delivering “Quality”Quality Attenuation
Exploiting the Understanding
Layered Viewpoint“Would you Like Quality with that, Sir?”Relationship with End User Experience
Outline
1 Delivering “Quality”Layered Viewpoint“Would you Like Quality with that, Sir?”Relationship with End User Experience
2 Quality AttenuationFundamental PropertiesRepresentation and MeasurementCompositional Properties
3 Exploiting the UnderstandingApplying it to the Application(s)Applying it to the Network(s)Applying it to the Economics
Neil Davies Properties of Data Transport Quality – an Introduction(c) 2009 Predictable Network Solutions Ltd

Delivering “Quality”Quality Attenuation
Exploiting the Understanding
Layered Viewpoint“Would you Like Quality with that, Sir?”Relationship with End User Experience
The ’Just Add Quality’ MythWhat has Silence, Cold, Dark and Quality all got in common?
You can no more ’add quality’ to a network than you can ’addsilence’ to a noisy room.Just as silence is the absence of noise, what is colloquiallycalled ’quality’ in data networking is really the absence ofsomething.Every network element attenuates the quality - introducesdelay and (the potential for) loss – every transmission line,switch, router etc.People may talk about quality and even desire it, but qualityattenuation is the physical property we have to work with.
This is a key concept – having introduced quality attenuation wecan start re-framing the issues in a coherent framework.
Neil Davies Properties of Data Transport Quality – an Introduction(c) 2009 Predictable Network Solutions Ltd
Delivering “Quality”Quality Attenuation
Exploiting the Understanding
Layered Viewpoint“Would you Like Quality with that, Sir?”Relationship with End User Experience
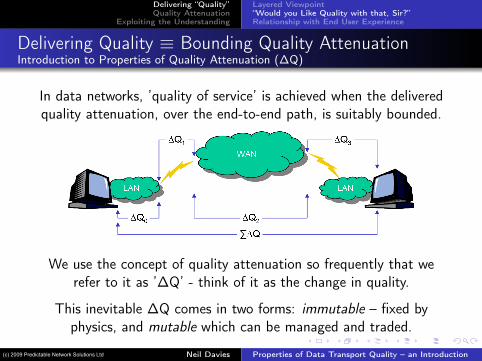
Delivering Quality ≡ Bounding Quality AttenuationIntroduction to Properties of Quality Attenuation (∆Q)
In data networks, ’quality of service’ is achieved when the deliveredquality attenuation, over the end-to-end path, is suitably bounded.
We use the concept of quality attenuation so frequently that werefer to it as ’∆Q’ - think of it as the change in quality.
This inevitable ∆Q comes in two forms: immutable – fixed byphysics, and mutable which can be managed and traded.
Neil Davies Properties of Data Transport Quality – an Introduction(c) 2009 Predictable Network Solutions Ltd

Delivering “Quality”Quality Attenuation
Exploiting the Understanding
Layered Viewpoint“Would you Like Quality with that, Sir?”Relationship with End User Experience
Outline
1 Delivering “Quality”Layered Viewpoint“Would you Like Quality with that, Sir?”Relationship with End User Experience
2 Quality AttenuationFundamental PropertiesRepresentation and MeasurementCompositional Properties
3 Exploiting the UnderstandingApplying it to the Application(s)Applying it to the Network(s)Applying it to the Economics
Neil Davies Properties of Data Transport Quality – an Introduction(c) 2009 Predictable Network Solutions Ltd

Delivering “Quality”Quality Attenuation
Exploiting the Understanding
Layered Viewpoint“Would you Like Quality with that, Sir?”Relationship with End User Experience
Examples – 1What Bounded Quality Attenuation Delivers
You want to assure someaverage performance fortypical (10kb) HTTPweb page access – Whatd∆Qe should you aspireto deliver?
What is thedependency on theone-way delay?What is thedependency on theloss rate?
The dependency is onboth delay and loss,not delay or loss
Neil Davies Properties of Data Transport Quality – an Introduction(c) 2009 Predictable Network Solutions Ltd

Delivering “Quality”Quality Attenuation
Exploiting the Understanding
Layered Viewpoint“Would you Like Quality with that, Sir?”Relationship with End User Experience
Examples – 2Applies to Real-time Services As Well
You want to assure someperceived quality for aG.711 VoIP call – whatd∆Qe should you aspireto deliver?
What is thedependency on theone-way delay?What is thedependency on theloss rate?
The dependency is onboth delay and loss,not delay or loss
Neil Davies Properties of Data Transport Quality – an Introduction(c) 2009 Predictable Network Solutions Ltd

Delivering “Quality”Quality Attenuation
Exploiting the Understanding
Fundamental PropertiesRepresentation and MeasurementCompositional Properties
Outline
1 Delivering “Quality”Layered Viewpoint“Would you Like Quality with that, Sir?”Relationship with End User Experience
2 Quality AttenuationFundamental PropertiesRepresentation and MeasurementCompositional Properties
3 Exploiting the UnderstandingApplying it to the Application(s)Applying it to the Network(s)Applying it to the Economics
Neil Davies Properties of Data Transport Quality – an Introduction(c) 2009 Predictable Network Solutions Ltd
Delivering “Quality”Quality Attenuation
Exploiting the Understanding
Fundamental PropertiesRepresentation and MeasurementCompositional Properties
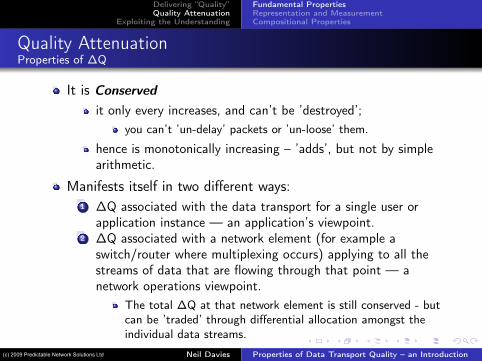
Quality AttenuationProperties of ∆Q
It is Conservedit only every increases, and can’t be ’destroyed’;
you can’t ’un-delay’ packets or ’un-loose’ them.
hence is monotonically increasing – ’adds’, but not by simplearithmetic.
Manifests itself in two different ways:1 ∆Q associated with the data transport for a single user or
application instance — an application’s viewpoint.2 ∆Q associated with a network element (for example a
switch/router where multiplexing occurs) applying to all thestreams of data that are flowing through that point — anetwork operations viewpoint.
The total ∆Q at that network element is still conserved - butcan be ’traded’ through differential allocation amongst theindividual data streams.
Neil Davies Properties of Data Transport Quality – an Introduction(c) 2009 Predictable Network Solutions Ltd

Delivering “Quality”Quality Attenuation
Exploiting the Understanding
Fundamental PropertiesRepresentation and MeasurementCompositional Properties
Outline
1 Delivering “Quality”Layered Viewpoint“Would you Like Quality with that, Sir?”Relationship with End User Experience
2 Quality AttenuationFundamental PropertiesRepresentation and MeasurementCompositional Properties
3 Exploiting the UnderstandingApplying it to the Application(s)Applying it to the Network(s)Applying it to the Economics
Neil Davies Properties of Data Transport Quality – an Introduction(c) 2009 Predictable Network Solutions Ltd

Delivering “Quality”Quality Attenuation
Exploiting the Understanding
Fundamental PropertiesRepresentation and MeasurementCompositional Properties
Representing Quality Attenuation – 1Observing and Predicting Outcomes
From a performance / ∆Q point of view; the interest is in outcomes.
If event A should lead to Boccurring, the measure is:
how frequently Bactually occurs
the time intervalbetween B and A.
We can express both theaspiration (here 50% out-comes occurring within 3s,95% within 10s - the bluestepped line) and what wasdelivered (the black line).
As the delivered curve is always to the left and above the aspiration curve —the aspiration was met and ’quality’ delivered.
Neil Davies Properties of Data Transport Quality – an Introduction(c) 2009 Predictable Network Solutions Ltd

Delivering “Quality”Quality Attenuation
Exploiting the Understanding
Fundamental PropertiesRepresentation and MeasurementCompositional Properties
Representing Quality Attenuation – 2Focusing on the ’Tail’
It is the tail of distributions that is of most interest1
These graphs represent the same outcome: 50% delivered with54ms; 90% within 82ms; 99% within 91ms; with 0.5% packet loss.
1Maths Note: This a Cumulative Distribution Function (CDF), technicallythey are improper CDFs as P 6→ 1 as t →∞.
Neil Davies Properties of Data Transport Quality – an Introduction(c) 2009 Predictable Network Solutions Ltd

Delivering “Quality”Quality Attenuation
Exploiting the Understanding
Fundamental PropertiesRepresentation and MeasurementCompositional Properties
Representing Quality Attenuation – 3Comparing What is Actually Delivered
Compare the previousslide’s delivered ∆Q:
50% within 54ms;90% within 82ms;99% within 91ms;d105mse - 0.5%loss.
with this graph.
50% within 43ms;90% within 60ms;95% within 70ms;d2000mse - 2% loss.
Same ISP, same applica-tion, same two end points,just different time of day.
Neil Davies Properties of Data Transport Quality – an Introduction(c) 2009 Predictable Network Solutions Ltd
Delivering “Quality”Quality Attenuation
Exploiting the Understanding
Fundamental PropertiesRepresentation and MeasurementCompositional Properties
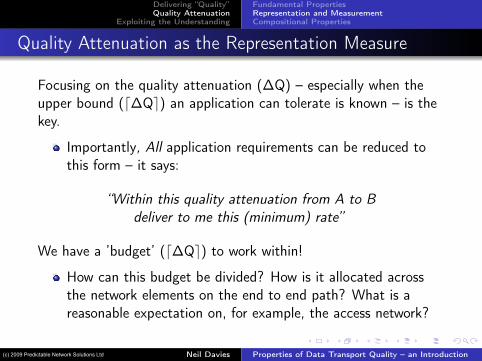
Quality Attenuation as the Representation Measure
Focusing on the quality attenuation (∆Q) – especially when theupper bound (d∆Qe) an application can tolerate is known – is thekey.
Importantly, All application requirements can be reduced tothis form – it says:
“Within this quality attenuation from A to Bdeliver to me this (minimum) rate”
We have a ’budget’ (d∆Qe) to work within!
How can this budget be divided? How is it allocated acrossthe network elements on the end to end path? What is areasonable expectation on, for example, the access network?
Neil Davies Properties of Data Transport Quality – an Introduction(c) 2009 Predictable Network Solutions Ltd
Delivering “Quality”Quality Attenuation
Exploiting the Understanding
Fundamental PropertiesRepresentation and MeasurementCompositional Properties
Outline
1 Delivering “Quality”Layered Viewpoint“Would you Like Quality with that, Sir?”Relationship with End User Experience
2 Quality AttenuationFundamental PropertiesRepresentation and MeasurementCompositional Properties
3 Exploiting the UnderstandingApplying it to the Application(s)Applying it to the Network(s)Applying it to the Economics
Neil Davies Properties of Data Transport Quality – an Introduction(c) 2009 Predictable Network Solutions Ltd

Delivering “Quality”Quality Attenuation
Exploiting the Understanding
Fundamental PropertiesRepresentation and MeasurementCompositional Properties
Quality Attenuation BudgetsHow Aspects of the End to End Path Contribute
The contribution of any network element can be broken down intothree components:
G - dependent on geographical and other fixed factors.S - dependent on the packet size and the transmission media.V - the variability; dependent on many factors, see below.
1 G is a constant for a given path, incorporates factors such propagationdelay and residual error rates for transmission media. It is immutable.
2 S is fixed for a given packet size over a particular path (given that path isfixed) - it captures the delay of processing packets. It is immutable.
3 V is the effects of the rest of the network on this traffic - this is mutableand often highly variable - it is this component that requires management.
These ’sum’ (convolve) component-wise for each network elementtraversed.
Neil Davies Properties of Data Transport Quality – an Introduction(c) 2009 Predictable Network Solutions Ltd

Delivering “Quality”Quality Attenuation
Exploiting the Understanding
Fundamental PropertiesRepresentation and MeasurementCompositional Properties
Composing ∆Q
If it helps you can think of:
G as being the time for a packet of zero length to get from Ato B (a packet that pays no serialisation/de-serialisationoverhead but has to gain access to the transmission medium).
ADSL that would be [0–1.5ms]2 (256k) + propagation time;UMTS that would be [0–10ms] + propagation time.
S being the time to transmit a packet of a given size, this isdependent on packet size and the level-2 networkingtechnology overheads (e.g. quantisation for ATM, frametransmission time in wireless) and incorporates any time that ittakes the transmission medium to become available for thenext packet/frame (inter-frame gap)
This gap is 0 for ADSL and UMTS but a fixed 9.6µs for10mbps Ethernet.
2Uniform distribution between the boundsNeil Davies Properties of Data Transport Quality – an Introduction(c) 2009 Predictable Network Solutions Ltd
Delivering “Quality”Quality Attenuation
Exploiting the Understanding
Fundamental PropertiesRepresentation and MeasurementCompositional Properties
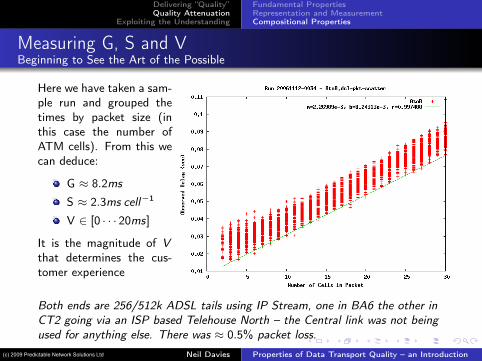
Measuring G, S and VBeginning to See the Art of the Possible
Here we have taken a sam-ple run and grouped thetimes by packet size (inthis case the number ofATM cells). From this wecan deduce:
G ≈ 8.2ms
S ≈ 2.3ms cell−1
V ∈ [0 · · · 20ms]
It is the magnitude of Vthat determines the cus-tomer experience
Both ends are 256/512k ADSL tails using IP Stream, one in BA6 the other inCT2 going via an ISP based Telehouse North – the Central link was not beingused for anything else. There was ≈ 0.5% packet loss.
Neil Davies Properties of Data Transport Quality – an Introduction(c) 2009 Predictable Network Solutions Ltd

Delivering “Quality”Quality Attenuation
Exploiting the Understanding
Fundamental PropertiesRepresentation and MeasurementCompositional Properties
Compositional Properties – Taking Stock
1 Got the tools to measure and analyse where ∆Q is accruing.
or alternately divide up a d∆Qe budget and allocate to theelements of the network
2 Know that high quality services are feasible (there can be areasonable bound on ∆Q in access networks)
3 Key to delivering quality is managing and controlling V
can’t eliminate V ; it comes with using statistical multiplexing
How do we ’tame’ V ?
Need to look a little more deeply into some other properties of∆Q.
Neil Davies Properties of Data Transport Quality – an Introduction(c) 2009 Predictable Network Solutions Ltd

Delivering “Quality”Quality Attenuation
Exploiting the Understanding
Fundamental PropertiesRepresentation and MeasurementCompositional Properties
Why ∆Q, not ’Delay and Loss’Two Degrees of Freedom
Every queue has two degrees of freedom.
Fix two parameters and you’vefixed the third
Fix one parameter and youestablish a relationship between theother two
Can’t choose any arbitrary threevalues at will
For a fixed load, if you want to reduceloss you have to increase delay; For a fixedloss, as load increases delay must increase;and so on
Neil Davies Properties of Data Transport Quality – an Introduction(c) 2009 Predictable Network Solutions Ltd

Delivering “Quality”Quality Attenuation
Exploiting the Understanding
Fundamental PropertiesRepresentation and MeasurementCompositional Properties
That ’Question’Why do People See Bandwidth as the Answer?
“So why do people keep on talking about adding bandwidth as the answer?”
1 Providers are not managing V , they are taking what ’emerges’ from theday-to-day operation of their network.
We’ll come to what that means for the consumer and the operator shortly2 The V they deliver to their customers is an arbitrary and un-manged
relationship between delay and loss
2◦ of freedom along with the offered load creeping up day by day3 Their customers complain because their applications are not ’delivering sufficient
Quality of Experience’
The delay and loss, ∆Q, they are delivering to their customers is too high(over the application’s implicit budget)
4 They increase the capacity of links/network to reduce the offered load
while the physics allows and they can afford it5 Because of (1) they return to step (2) and iterate
Hence ISP — the Internet (in-)Solvency Problem
Neil Davies Properties of Data Transport Quality – an Introduction(c) 2009 Predictable Network Solutions Ltd
Delivering “Quality”Quality Attenuation
Exploiting the Understanding
Fundamental PropertiesRepresentation and MeasurementCompositional Properties
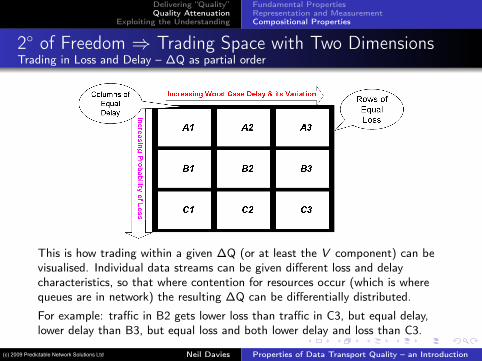
2◦ of Freedom ⇒ Trading Space with Two DimensionsTrading in Loss and Delay – ∆Q as partial order
This is how trading within a given ∆Q (or at least the V component) can bevisualised. Individual data streams can be given different loss and delaycharacteristics, so that where contention for resources occur (which is wherequeues are in network) the resulting ∆Q can be differentially distributed.
For example: traffic in B2 gets lower loss than traffic in C3, but equal delay,lower delay than B3, but equal loss and both lower delay and loss than C3.
Neil Davies Properties of Data Transport Quality – an Introduction(c) 2009 Predictable Network Solutions Ltd

Delivering “Quality”Quality Attenuation
Exploiting the Understanding
Fundamental PropertiesRepresentation and MeasurementCompositional Properties
Quality Trading in Data LinksMore Properly: Quality Attenuation Trading
The properties described above have many interesting consequences on what ispossible, or more valuable, what is not possible with data networks.
One of the more interesting consequences is that any ’pipe’ (a path overwhich data can be delivered within a bounded ∆Q) can carry multiple,differentiated, data transport services even though the ’pipe’ itself doesn’tsupport differentiation.
Alternately, given a multiple data streams the characteristics of the ’pipe’needed can be calculated, so that the collected set of traffic can becarried with that all their individual ∆Q constraints met.
This means that a ’differentiated service’ network can be built on top of anexisting ’single service’ network — if you understand the characteristics andconstraints properly.
This offers an incremental (hopefully lower cost) route to deliveringdifferentiated services. Which is useful as differentiated services are essential forthe long term economic viability of data networks
Neil Davies Properties of Data Transport Quality – an Introduction(c) 2009 Predictable Network Solutions Ltd

Delivering “Quality”Quality Attenuation
Exploiting the Understanding
Applying it to the Application(s)Applying it to the Network(s)Applying it to the Economics
Outline
1 Delivering “Quality”Layered Viewpoint“Would you Like Quality with that, Sir?”Relationship with End User Experience
2 Quality AttenuationFundamental PropertiesRepresentation and MeasurementCompositional Properties
3 Exploiting the UnderstandingApplying it to the Application(s)Applying it to the Network(s)Applying it to the Economics
Neil Davies Properties of Data Transport Quality – an Introduction(c) 2009 Predictable Network Solutions Ltd

Delivering “Quality”Quality Attenuation
Exploiting the Understanding
Applying it to the Application(s)Applying it to the Network(s)Applying it to the Economics
Delivering QualityThere is No Quality in Averages
Averages are dangerous.People do not remember’averages’ they rememberextremes.
So delivering qualityto users is aboutmaking badexperiences rare.
This is the graph of the95% centile of time tocomplete the same 10KbHTTP transfer presentedearlier.
This imposes morestringent limitationson d∆Qe
Neil Davies Properties of Data Transport Quality – an Introduction(c) 2009 Predictable Network Solutions Ltd

Delivering “Quality”Quality Attenuation
Exploiting the Understanding
Applying it to the Application(s)Applying it to the Network(s)Applying it to the Economics
Establishing the Relationship Between QoE and d∆QeSo what is the quantity of quality that is needed to achieve sometask? There are three basic ways of establishing this:3
1 Emulate ∆Q: Connected the parts of the application together through asuitable ’Network Degrader’
Expensive, tedious, can be difficult to reproduce faults – howevershould be part of any validation process
2 Simulate both the application and the network (simulating everything)
Expensive, often restricted by computation, supplied libraries (fornetwork protocols) often don’t behave the same way as realimplementations
3 Analytically. Mathematically model behaviour and ∆Q — solveanalytically or numerically
Cheaper, used to show feasibility and trends. Can be used toformulate hypotheses to be tested by method (1) or (2).
3Note for the unwary: most of the tools out there do not work properly -they will introduce loss and delay, but not in the same way a real network will
Neil Davies Properties of Data Transport Quality – an Introduction(c) 2009 Predictable Network Solutions Ltd

Delivering “Quality”Quality Attenuation
Exploiting the Understanding
Applying it to the Application(s)Applying it to the Network(s)Applying it to the Economics
An ExampleLoading Google’s Front Page
This is a DNS look up followed by small HTTP transfer, withallowance for server response times.
Would have a median/75% centile/95% centile time tocomplete of 0.73s, 0.76s and 0.81s; given the round trip timewas in the range 125ms to 200ms.This rises to 2.33s, 2.69s, 3.17s if the round trip range was125ms to 1000ms
The downstream rates need to support this ’quality’ vary from34.3kbps to 10.8kpbs; the same amount of data over a longer time.
This shows there can be an advantage (to the provider) ingiving ’bad’ quality — it reduces the instantaneous offeredload — conversely ’good’ quality can increase both the peakoffered load and its variability.
Neil Davies Properties of Data Transport Quality – an Introduction(c) 2009 Predictable Network Solutions Ltd

Delivering “Quality”Quality Attenuation
Exploiting the Understanding
Applying it to the Application(s)Applying it to the Network(s)Applying it to the Economics
Outline
1 Delivering “Quality”Layered Viewpoint“Would you Like Quality with that, Sir?”Relationship with End User Experience
2 Quality AttenuationFundamental PropertiesRepresentation and MeasurementCompositional Properties
3 Exploiting the UnderstandingApplying it to the Application(s)Applying it to the Network(s)Applying it to the Economics
Neil Davies Properties of Data Transport Quality – an Introduction(c) 2009 Predictable Network Solutions Ltd

Delivering “Quality”Quality Attenuation
Exploiting the Understanding
Applying it to the Application(s)Applying it to the Network(s)Applying it to the Economics
Nature of ’The Service’ in Current NetworksSpecifically Access Networks
Current access networks only offer a single service – the service is not one thatthey ’specified’, it is what ’emerges’ during operation. In this service anapplication’s data traffic has:
1 No isolation from the effects of other traffic flowing to/from that end user2 No isolation from the effects of other traffic flowing to/from other end
users (or even ISPs)
Which leads to:1 People shutting down all their applications and disconnecting other
computers so that they can play an interactive game, make a VoIP call orstream some video.
2 Really annoys people as there is nothing they can do about it.
Access network providers do try to do something about (2) — BT uniformlyshares bandwidth at their BRAS’s, ComCast buckets ’heavy’ users into aconstrained service class.What consumers need is assured bounds on quality attenuation for someportions of their traffic — then the application that is wish to use will deliverwhat they require.
Neil Davies Properties of Data Transport Quality – an Introduction(c) 2009 Predictable Network Solutions Ltd

Delivering “Quality”Quality Attenuation
Exploiting the Understanding
Applying it to the Application(s)Applying it to the Network(s)Applying it to the Economics
UK is Well PositionedThough More by Accident than Design (or Good Engineering Principles Win Through)
These comments are specifically about IP Stream. It is the only access networkwith sufficient data about its design and operation in the public domain to beable to draw reliable conclusions.BT’s planning rule for capacity between a BRAS and a DSLAM isthat an end user should be able to achieve 2Mbps during the busyperiod, 90% of the time4.
This is the specification of an outcome and, as you will nowknow, there must be an associated delivered d∆Qe.The equivalent d∆Qe corresponds to delivering 97%+ ofpackets with a low delay variation (15ms to 20ms)
Thus, in the UK, over the national data infrastructure, we alreadyhave ’pipes’ with sufficiently known, and good, properties into
which multiple differentiated services can be multiplexed.4the same planning rules have been proposed for 21CN
Neil Davies Properties of Data Transport Quality – an Introduction(c) 2009 Predictable Network Solutions Ltd
Delivering “Quality”Quality Attenuation
Exploiting the Understanding
Applying it to the Application(s)Applying it to the Network(s)Applying it to the Economics
Outline
1 Delivering “Quality”Layered Viewpoint“Would you Like Quality with that, Sir?”Relationship with End User Experience
2 Quality AttenuationFundamental PropertiesRepresentation and MeasurementCompositional Properties
3 Exploiting the UnderstandingApplying it to the Application(s)Applying it to the Network(s)Applying it to the Economics
Neil Davies Properties of Data Transport Quality – an Introduction(c) 2009 Predictable Network Solutions Ltd

Delivering “Quality”Quality Attenuation
Exploiting the Understanding
Applying it to the Application(s)Applying it to the Network(s)Applying it to the Economics
Why Single Service Networks Are Bad NewsWhy to Remain Tenable Broadband Needs to Move to Multiple Services
1 Citizens, Consumers, Commerce and the Government want toget more out of Broadband.
2 Many of the services people want will require stronger upperbounds on quality attenuation.
for example video conferencing or highly interactiveapplications.
3 But a single service network can, at best, only have a qualityattenuation bound — therein lies the problem.
No industry can afford to structure its business to deliver all itsservices at the cost point only a few would be willing to pay.
Having data traffic with differing quality requirements is needed tomake optimal use of the infrastructure, with the savings thatimplies.
Neil Davies Properties of Data Transport Quality – an Introduction(c) 2009 Predictable Network Solutions Ltd

Delivering “Quality”Quality Attenuation
Exploiting the Understanding
Applying it to the Application(s)Applying it to the Network(s)Applying it to the Economics
Differentiated Service Access NetworkSo, Who Gets to Decide Which Traffic Gets Treated Which Way?
Simple, the End User.Only they know the importance of the applications quality ofexperience to their requirements.
The same application can take on different roles, requiringdifferent bounds on the quality attenuation at different times.
There should be a differential price (though that may not mean adifferential charge) for different qualities
This creates the appropriate economic feedback to make arational market.
Most important is need for a ’scavenger’ style class — one wherethere are no published bounds on ∆Q, a ’below normal’ servicewhere the delivered rate can be reduced to a trickle for peak periods— would make a substantial difference to the economics ofBroadband delivery
The price/charge differential would need to be reasonably highto persuade end users to engage.
Neil Davies Properties of Data Transport Quality – an Introduction(c) 2009 Predictable Network Solutions Ltd

Delivering “Quality”Quality Attenuation
Exploiting the Understanding
Applying it to the Application(s)Applying it to the Network(s)Applying it to the Economics
Costing Differential ServicesExploiting the Two Dimensional Nature of the Trading Space
The two dimensional nature of the ∆Q trading space has one otherinteresting property. It can be used to calculate a the cost ofdelivering of quality, using an opportunity cost argument.
1 At any point (network element) in the network there is some∆Q, that ∆Q is conserved. Giving ’less’ ∆Q to some trafficmeans that the remaining traffic must experienceproportionately more.
E.g. more traffic in the A1 box means that B2 traffic mustexperience a greater ∆Q in proportion.
2 So the B2 traffic is not just reduced by the volume in A1, butas some of the ∆Q budget has already been ’consumed’, evenless volume of traffic can be carried in B2 and meet thebudget.
Neil Davies Properties of Data Transport Quality – an Introduction(c) 2009 Predictable Network Solutions Ltd

Delivering “Quality”Quality Attenuation
Exploiting the Understanding
Applying it to the Application(s)Applying it to the Network(s)Applying it to the Economics
Conclusions
We’ve come at the ’quality’ issue in several different ways — all those’quality’ issues can represented in terms of ∆Q — Quality Attenuation.∆Q, its conservation and 2◦ of freedom is the underlying physicalproperty of statistically multiplexed data networks.
Any policy, regulation, service specification, network design,application design, etc, etc has to work within its constraints.
This is good news, it helps define the ’Art of the Possible’, partially byshowing what is not possible, and partially by∆Q bringing a quantitative basis to many of the contentious issues thatsurround data networking today, like
How to specify requirements, predict performance, manage largescale networks through creating d∆Qe budgets, describe serviceagreements, and cost proposed services.
It has been (and being) used to design new network elements, createnovel services over existing infrastructure and make distributed computersystem safer and more reliable.
Neil Davies Properties of Data Transport Quality – an Introduction(c) 2009 Predictable Network Solutions Ltd