the private equity economic impact
DESCRIPTION
TRANSCRIPT
The Private Equity Economic Impact
Javier Echarri,EVCA Secretary General
Bratislava,
20th September 2005

Agenda
Current size and activity levels
Economic impact on companies
Economic impact on European economies
Recommendations

Introduction to EVCA
Established in 1983 and based in Brussels
Represents the European private equity and venture capital industry (PE/VC) and promotes the asset class both within Europe and throughout the World
Well over 900 members, mainly European
PE/VC fund management companies
Institutional investors (banks, pension funds, insurance companies...)
Professional advisors (lawyers, placement agents, investment bankers...)
National (European) Trade Associations

Current size and activity levels
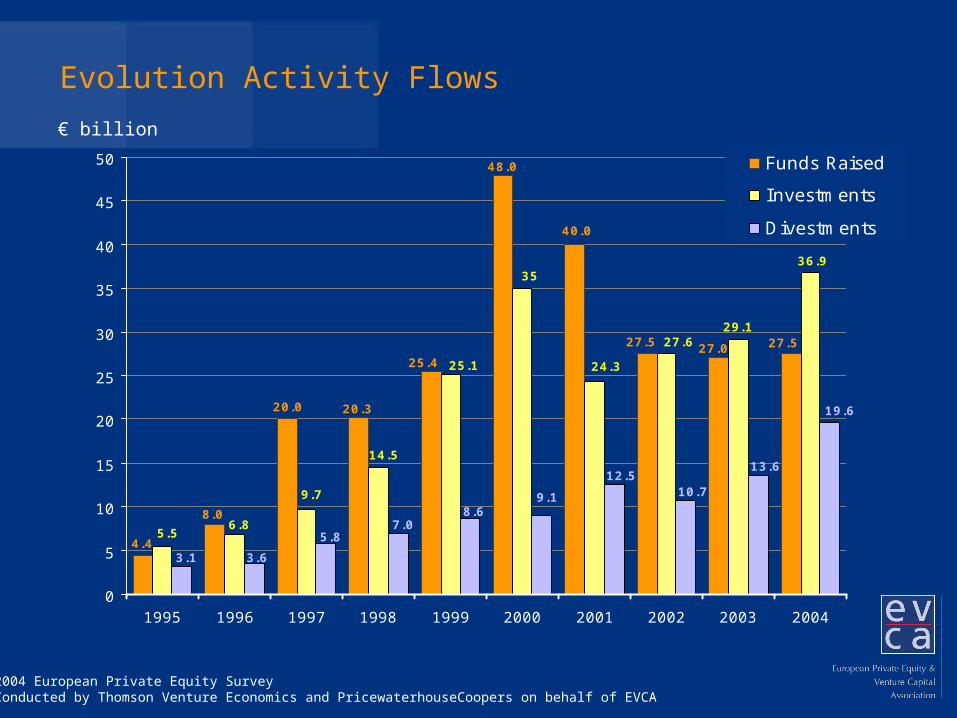
Evolution Activity Flows
48.0
40.0
20.320.0
8.0
27.027.5
25.4
4.4
27.5
36.9
27.6
24.3
35
25.1
14.5
6.8
9.7
5.5
29.1
3.63.1
5.8
19.6
7.08.6
9.1
12.513.6
10.7
0
5
10
15
20
25
30
35
40
45
50
1995 1996 1997 1998 1999 2000 2001 2002 2003 2004
Funds Raised
Investments
Divestments
€ billion
2004 European Private Equity SurveyConducted by Thomson Venture Economics and PricewaterhouseCoopers on behalf of EVCA

Sources of New Funds Raised
Corporate Investors7.0%
Private Individuals7.6%
Academic Institutions
1.5%
Capital Markets2.2%
Other9.2%
Fund of Funds13.5%
Insurance Companies
12.0%
Pension Funds19.3%
Banks21.7%
Government Agencies
6.1%
2004 2003
Corporate Investors4.8%
Private Individuals3.2%
Government Agencies
6.8%
Other17.3%
Capital Markets0.3%
Academic Institutions
1.5%Banks21.5%
Pension Funds19.4%
Fund of Funds16.4%
Insurance Companies
8.7%
2004 European Private Equity SurveyConducted by Thomson Venture Economics and PricewaterhouseCoopers on behalf of EVCA

2004: €37 Billion Invested. Record Level
3.65.6
8.5
14.4 15.312.1
17.920.7
26.6
2.63.2
4.1
6.0
10.7
19.6
12.2
9.8
8.4
10.3
2.90
5
10
15
20
25
30
35
40
1995 1996 1997 1998 1999 2000 2001 2002 2003 2004
€ billion
Venture Capital
Buyout
2004 European Private Equity SurveyConducted by Thomson Venture Economics and PricewaterhouseCoopers on behalf of EVCA

Stage Distribution of InvestmentsAmount Invested
Buyout63.4%
Replacement Capital7.9%
Expansion21.4%
Seed0.5% Start-up
6.8%
Buyout69.7%
Replacement Capital2.5%
Expansion21.4%
Start-up6.0%
Seed0.4%
2004 European Private Equity SurveyConducted by Thomson Venture Economics and PricewaterhouseCoopers on behalf of EVCA
2004 2003
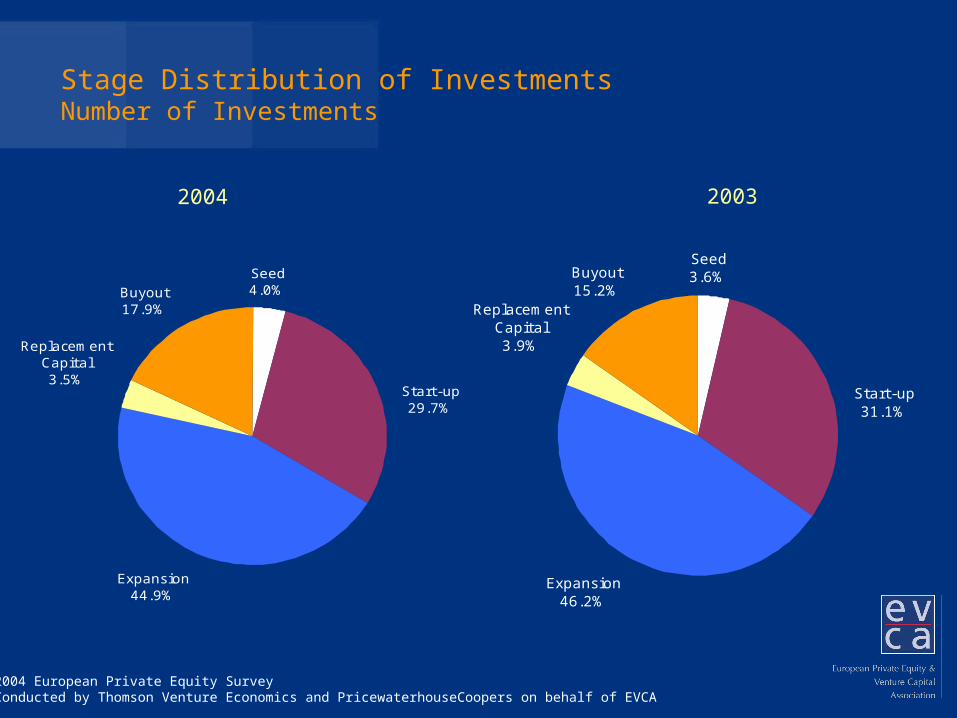
Stage Distribution of InvestmentsNumber of Investments
Buyout17.9%
Replacement Capital3.5%
Expansion44.9%
Start-up29.7%
Seed4.0%
Buyout15.2%
Replacement Capital3.9%
Expansion46.2%
Start-up31.1%
Seed3.6%
2004 European Private Equity SurveyConducted by Thomson Venture Economics and PricewaterhouseCoopers on behalf of EVCA
2004 2003

2004 Investment as % of GDP – Investments by Country of Management
0.00
30.
013
0.02
30.
042
0.06
00.
066
0.09
30.
105
0.11
00.
119
0.11
90.
149
0.15
40.
173
1.10
3
0.58
5
0.36
3
0.35
6
0.35
4
0.24
6
0.20
3
UK
Swed
en
Fran
ce
Nethe
rland
s
Euro
pe
Spain
Denm
ark
Germ
any
Norway
Finl
and
Portu
gal
Hunga
ryItaly
Belg
ium
Switz
erland
Poland
Aust
ria
Irel
and
Czec
h Re
publ
ic
Slov
ak R
epub
lic
Greec
e
2004 European Private Equity SurveyConducted by Thomson Venture Economics and PricewaterhouseCoopers on behalf of EVCA

Economic Impact on Companies

Without venture capital, my company…
would have developed
faster (0.8% )
would have developed in
the same way (4.7% )
could not have existed or
would have developed
more slowly (94.5% )
Impact of the investment on the creation, survival and growth of the company – all responding companies
Source: NUBS/EVCA
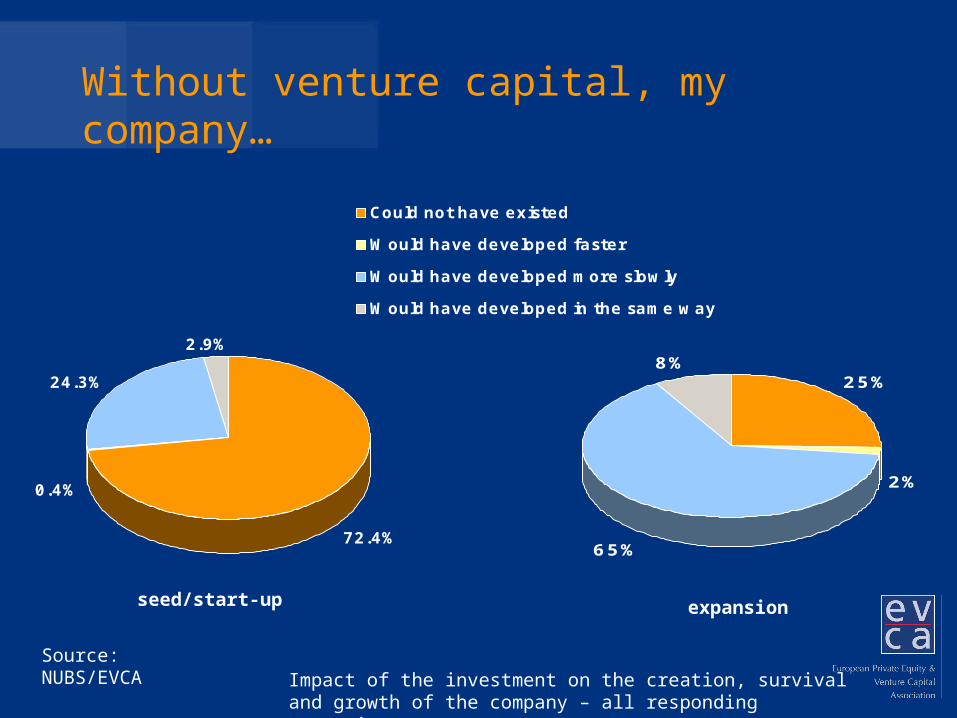
Without venture capital, my company…
72.4%
0.4%
24.3%
2.9%
Could not have existed
Would have developed faster
Would have developed more slowly
Would have developed in the same way
25%
2%
65%
8%
seed/start-up expansion
Impact of the investment on the creation, survival and growth of the company – all responding companies
Source: NUBS/EVCA
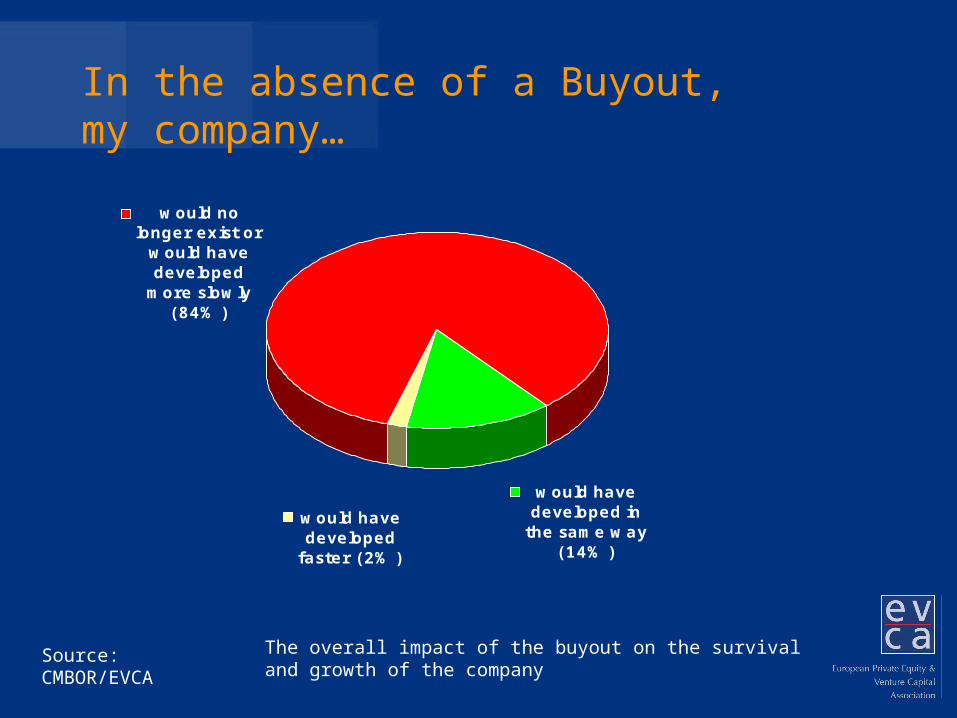
In the absence of a Buyout, my company…
would have developed in
the same way (14% )
would have developed
faster (2% )
would no longer exist or
would have developed
more slowly (84% )
The overall impact of the buyout on the survival and growth of the company
Source: CMBOR/EVCA
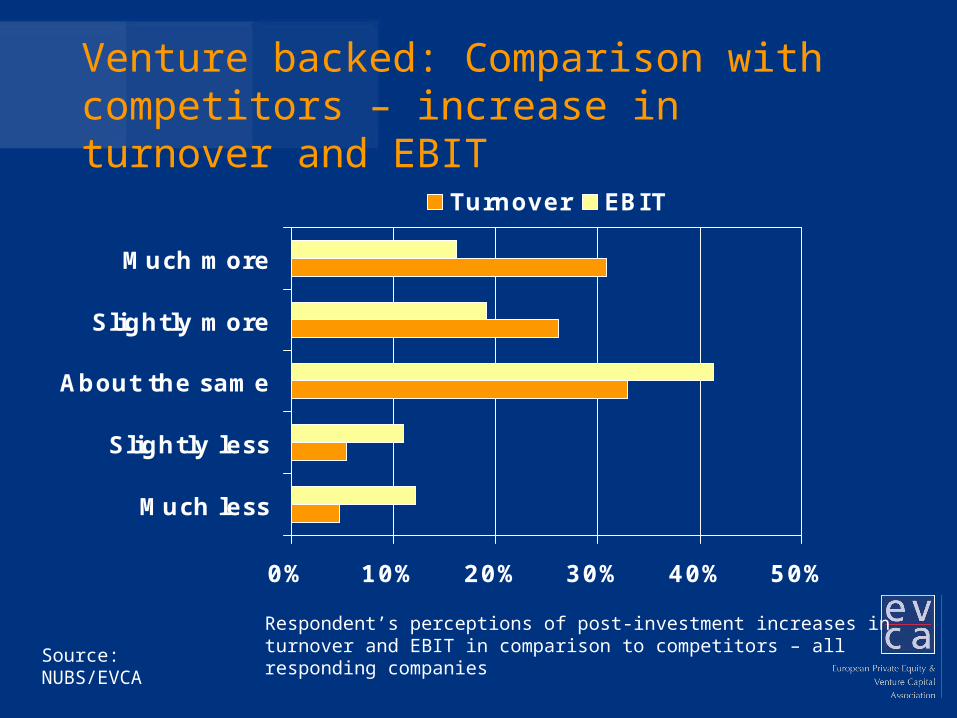
Venture backed: Comparison with competitors – increase in turnover and EBIT
0% 10% 20% 30% 40% 50%
Much less
Slightly less
About the same
Slightly more
Much more
Turnover EBIT
Source: NUBS/EVCA
Respondent’s perceptions of post-investment increases in turnover and EBIT in comparison to competitors – all responding companies

Post buyout increases in turnover and Post buyout increases in turnover and EBIT in comparison to competitors: EBIT in comparison to competitors: respondents’ perceptionsrespondents’ perceptions
0.00% 10.00% 20.00% 30.00% 40.00%
Much less
Slightly less
About the same
Slightly more
Much more
Turnover EBIT
Source: CMBOR/EVCA

Percentage increase in expenditure between the time of the initial investment and the time of the survey
0% 200% 400% 600% 800% 1000% 1200% 1400% 1600%
Research andDevelopment
MarketingExpenditure
CapitalExpenditure
Training
Mean Median
0% 100% 200% 300% 400% 500% 600% 700%
Seed/start-up stage companies Expansion stage companies
Source: NUBS/EVCA

Expenditure in four areas as a percentage of sales before and after the buyout
0% 1% 2% 3% 4% 5% 6% 7%
Research &Development
Marketingexpenditure
Capitalexpenditure
Training
At time of buyout Last Year
Source: CMBOR/EVCA

Impact on European Economies
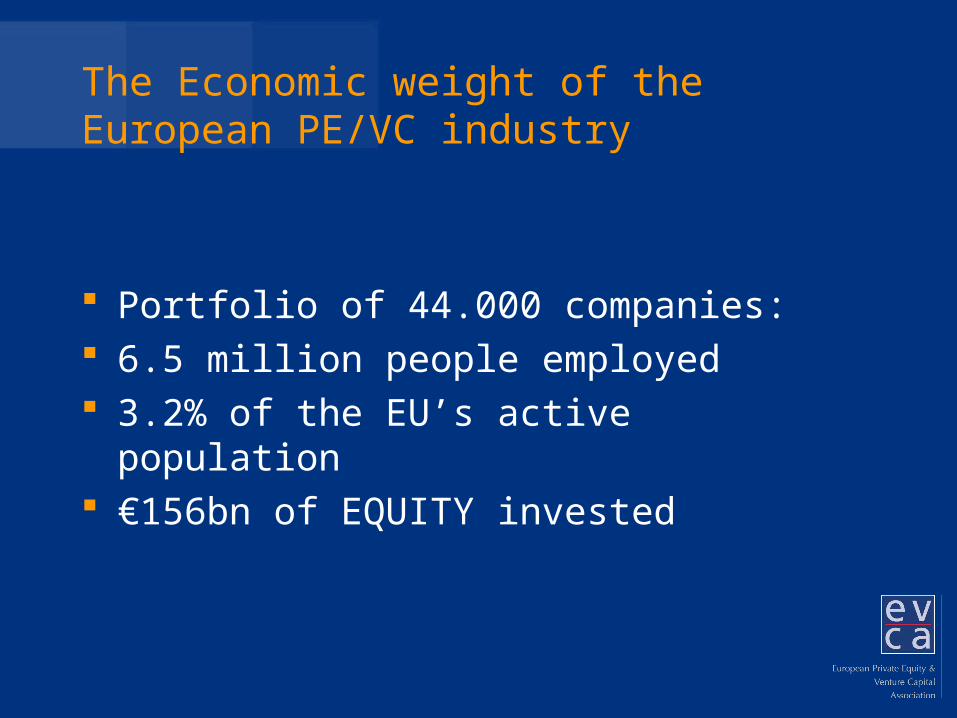
The Economic weight of the European PE/VC industry
Portfolio of 44.000 companies: 6.5 million people employed 3.2% of the EU’s active population €156bn of EQUITY invested

The Economic weight of the European PE/VC industry
Between 1999 and 2003: Created 1.1 million jobs 585.000 in Early stage companies 450.000 in Later stage companies

Recommendations

Competitiveness of the Economies
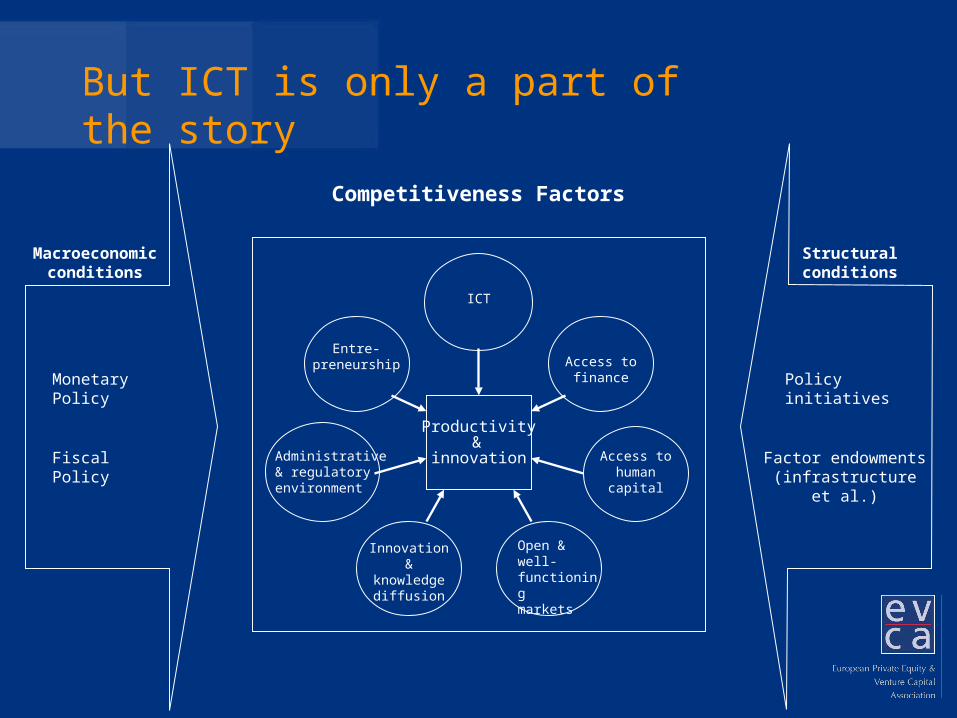
Competitiveness Factors
Macroeconomic conditions
Monetary Policy
Fiscal Policy
Policy initiatives
Factor endowments(infrastructure
et al.)
ICT
Access tofinance
Entre-preneurship
Productivity&
innovationAdministrative& regulatoryenvironment
Structuralconditions
Access tohumancapital
Innovation&
knowledgediffusion
Open &well-functioningmarkets
But ICT is only a part of the story

A need to boost entrepreneurship in Europe
Total Entrepreneurial activity by advanced economies 2000-2003
Source: EVCA based on Global Entrepreneurship Monitor - 2003 Executive Report and International Monetary Fund
Country Ranking Country Ranking
Korea 1 Greece 14
New Zealand 2 Israël 15
Australia 3 United Kingdom 16
United States 4 Spain 17
Iceland 5 Germany 18
Canada 6 Singapore 19
Ireland 7 Sweden 20
Norway 8 The Netherlands
21
Italy 9 France 22
Switzerland 10 Taiwan 23
Portugal 11 Belgium 24
Denmark 12 Japan 25
Finland 13 Hong Kong 26

Both in Europe and in the US, finance is an obstacle in setting up a business. Red tape is more an European obstacle
0% 10% 20% 30% 40% 50% 60% 70% 80%
It is difficult to obtainsufficient information on how
to start a business
One should not start abusiness if there is a risk it
might fail
The current economic climateis not favourable for peoplewho want to start their own
business
It is difficult to start one'sown business due to thecomplex administrative
procedures
It is difficult to start one'sown business due to a lack
of available financial support
USA EU 25
Source: Flash Eurobarometer – Entrepreneurship 2004
Do you … with the following opinions?% Agree (Strongly + Agree)
Current problems
Difficult to finance a project
Difficult to establish a company Difficult to run a new company

Policy Measures: More efforts should be targeted at entrepreneurship in education and the reduction of red tape
Typology of objectives Share in percentage
Fostering and Innovation Culture 29.9
Including: Education & Training 5.8
Establishing a Framework conducive to Innovation 20.7
Including: Administrative Simplification 0.9
Including: Legal and Regulatory Environment 0.6
Including: Financing 14.2
Gearing Research to Innovation 49.2
Including: Start-up of technology-based companies 11.5
Including: Co-operation Research/Universities/Companies 14.4
Other Objectives 0.3
Total 100.0
Share of the respective objectives of policy measures % of total number of policie measures targeting innovation in the EU-15
Source: TrendChart/European Commission / note: information as of 2004
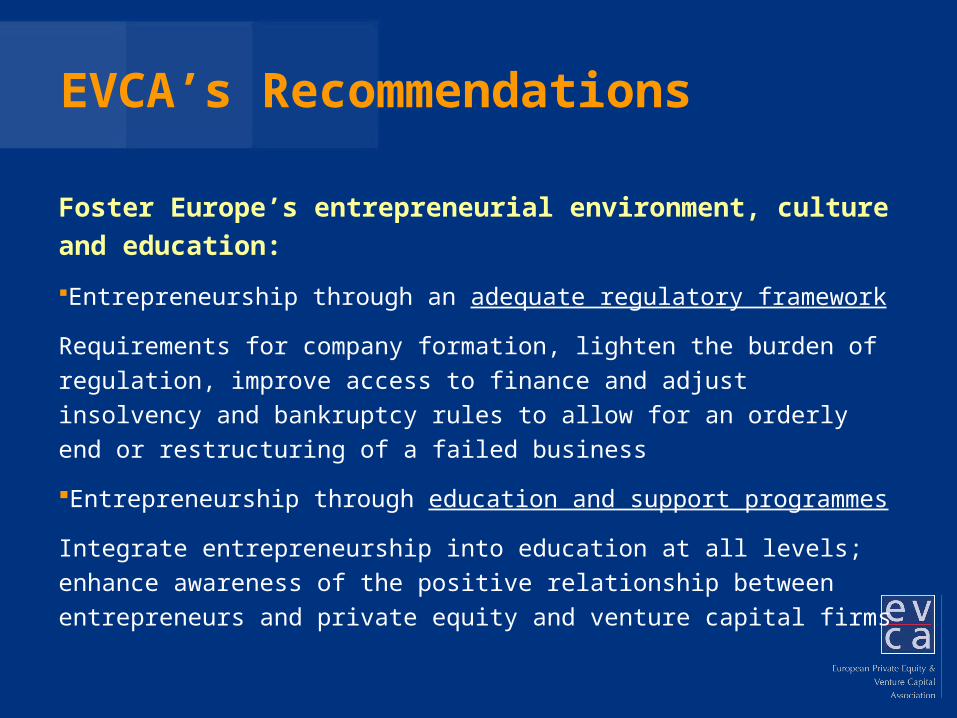
EVCA’s Recommendations
Foster Europe’s entrepreneurial environment, culture and education:
Entrepreneurship through an adequate regulatory framework
Requirements for company formation, lighten the burden of regulation, improve access to finance and adjust insolvency and bankruptcy rules to allow for an orderly end or restructuring of a failed business
Entrepreneurship through education and support programmes
Integrate entrepreneurship into education at all levels; enhance awareness of the positive relationship between entrepreneurs and private equity and venture capital firms

The Private Equity Ecosystem and Virtuous Cycle

The virtuous financing cycle of private equity and venture capital investment
repayments+ capital gains
commitments
divestments
pensions savings
savings and pensions
investments
Private Equity Funds
High-potential companies
Institutional investors(Insurance companies,
pension funds, banks…)
Private Equity Funds
Institutional investors(Insurance companies,
pension funds, banks…)
Saving accounts, Pension plans,
Insurance contracts…

repayments+ capital gains
commitments
divestments
pensions savings
savings and pensions
investments
Private Equity Funds
High-growth companies
Institutional investors(Insurance companies,
pension funds, banks…)
Private Equity Funds
Institutional investors(Insurance companies,
pension funds, banks…)
Saving accounts, Pension plans,
Insurance contracts…
Legal vehicle
Young innovative companies, family companies,
development potential, …High Growth Markets, trade sales,… who is buying?
Long term investment plans: Pension Funds
(Prudent Man Rule), Banks, Insurance
companies, …
Double Taxation
Permanent establishment
The virtuous financing cycle of private equity and venture capital investment

Thank You