the pressure to recognise foreign medical qualifications ... · pdf filethe pressure to...
TRANSCRIPT

The Pressure to Recognise Foreign Medical
Qualifications –
Emerging Global Trends
Lesleyanne Hawthorne
Professor – International Health Workforce
Faculty of Medicine, Dentistry and Health Sciences
International Association of Medical Regulatory Authorities Conference 2014
11th International Conference on Medical Regulation
London (9-12 September 2014)

Transformation of Global Skilled Migration -
Future Impact on Regulation?
1. Demographic contraction:
OECD and select other countries (eg Singapore, Japan)
2. Prioritisation of skilled migration:
Up to 68% of permanent intakes to Canada, Australia and New Zealand
3. 21st century mobility patterns: Transformed!
Hypermobility (eg India Gulf S Africa NZ Australia)
New directions (eg pan-Asian)
Scale of temporary flows
Individual agency (+ migration factored into career choice)
4. Migration pathways: Permanent versus temporary versus international student flows
What level of regulation is appropriate/ required?
‘One size fits all’ or alternative recognition pathways?

International medical graduates (IMGs) –
1. Bilateral/multilateral agreements (eg EU, Trans-Tasman)
2. International students (study-migration pathway)
3. Temporary sponsored migrants
4. Permanent skilled migrants
5. Partners of skilled migrants
6. Family and Humanitarian category migrants
Key Medical Migration Pathways -
Which Regulation Requirements?

Issue 1 -
Diversification of IMG Source Countries/ Regions
Challenges:
Training variability
Technological ‘fit’
Language and clinical communication skills
CASE STUDY 1: Chinese IMGs in OECD countries
CASE STUDY 2: QA and the Philippines

Growing Reliance on Migrant Professionals:
Australia (2001 & 2011) Compared to Canada (2001)
Occupation 2011 % Overseas-Born
In Australia
2001 % Overseas-Born
In Australia (compared to
Canada)
Engineering 62% 48% (50%) Computing 57% 48% (51%) Medicine 48% 46% (35%) Science 37% (36%) Commerce/ business 43% 36% (27%) Architecture 36% (49%) Accountancy 53% 36% (35%) Arts/ humanities 31% (24%) Nursing 29% 24% (23%) Education 24% 20% (15%) Source: 2001 and 2011 Census data analysis, Australia and Canada; The Impact of Economic Selection Policy on Labour Market Outcomes for Degree-Qualified Migrants in Canada and Australia, L Hawthorne, Institute for Research on Public Policy, Vol 14 No 5, 2008, Ottawa, 50pp

Growth in Permanent Medical Migration:
Australia 2006-11 (Compared to 2001-05) PLUS Temporary IMGs
Field
2001-2005 Arrivals
2006-2011 Arrivals
Medicine 7,241 12,696
Nursing 8,584 19,746
Pharmacy 1,798 3,005 Physiotherapy 755 1,556
Dentistry 1,063 2,343
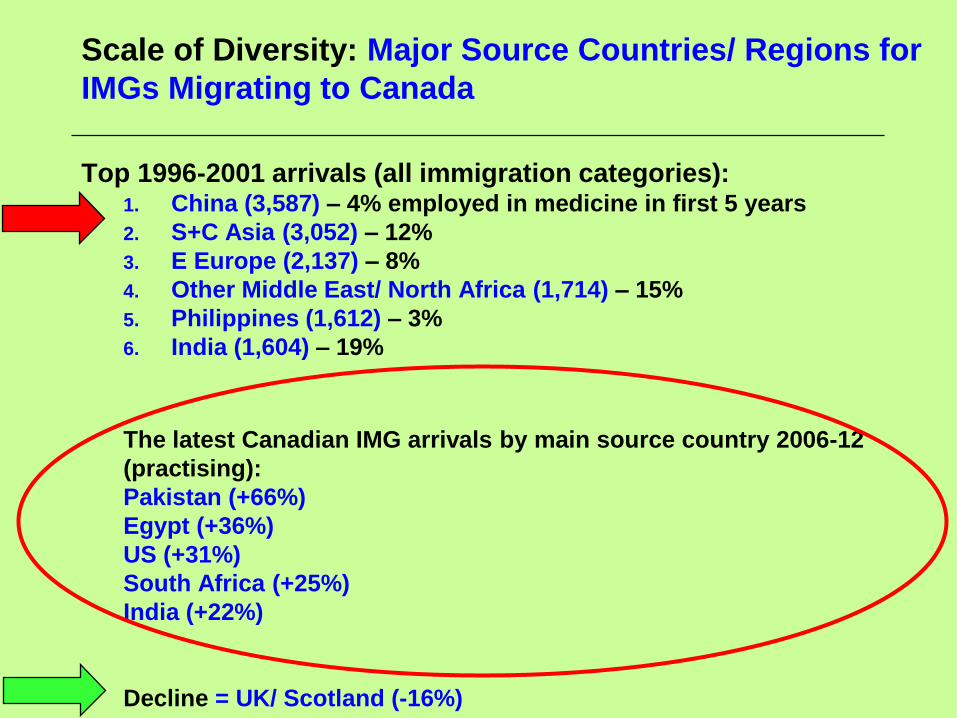
Scale of Diversity: Major Source Countries/ Regions for
IMGs Migrating to Canada
Top 1996-2001 arrivals (all immigration categories): 1. China (3,587) – 4% employed in medicine in first 5 years
2. S+C Asia (3,052) – 12%
3. E Europe (2,137) – 8%
4. Other Middle East/ North Africa (1,714) – 15%
5. Philippines (1,612) – 3%
6. India (1,604) – 19%
The latest Canadian IMG arrivals by main source country 2006-12
(practising):
Pakistan (+66%)
Egypt (+36%)
US (+31%)
South Africa (+25%)
India (+22%)
Decline = UK/ Scotland (-16%)
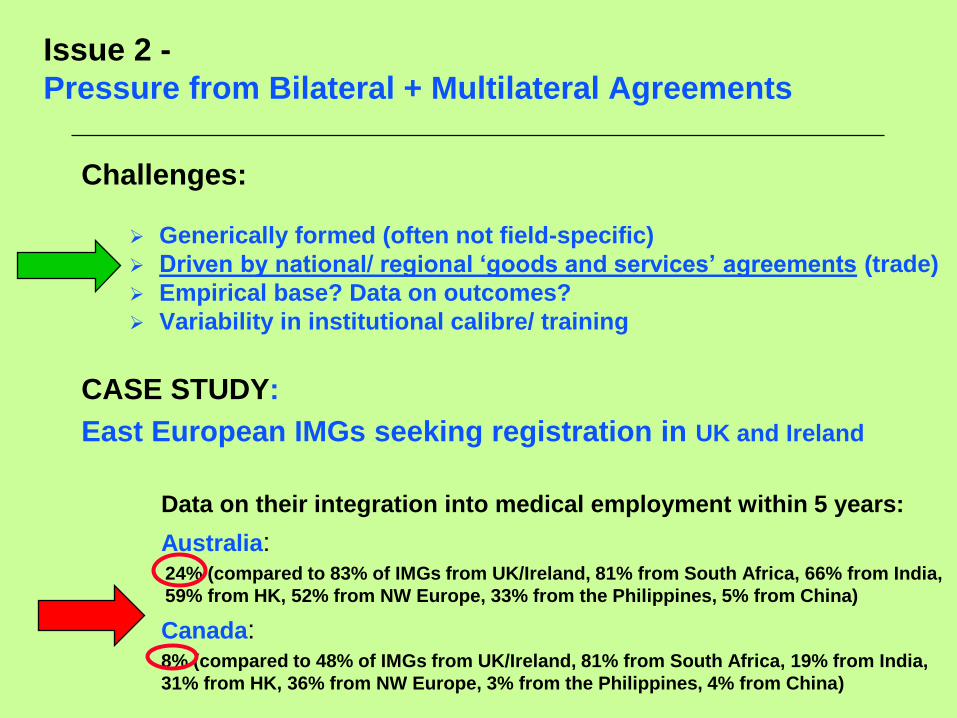
Issue 2 -
Pressure from Bilateral + Multilateral Agreements
Challenges:
Generically formed (often not field-specific)
Driven by national/ regional ‘goods and services’ agreements (trade)
Empirical base? Data on outcomes?
Variability in institutional calibre/ training
CASE STUDY:
East European IMGs seeking registration in UK and Ireland
Data on their integration into medical employment within 5 years:
Australia: 24% (compared to 83% of IMGs from UK/Ireland, 81% from South Africa, 66% from India,
59% from HK, 52% from NW Europe, 33% from the Philippines, 5% from China)
Canada: 8% (compared to 48% of IMGs from UK/Ireland, 81% from South Africa, 19% from India,
31% from HK, 36% from NW Europe, 3% from the Philippines, 4% from China)
Source: Based on 2001 Census data (all immigration categories)

2011 Census Evidence: Impact of Source Country/ Region on
IMGs’ Employment in Medicine in Australia (First 5 Years) –
Data on Eastern Europe?
2011 Census:
Overall: 57% of 2006-11 arrivals employed in medicine within 5 years
Most likely to practice: South Africa (83%), Malaysia (75%), UK/Ireland (74%), SE Europe (61%), India (61%), West Europe (59%), Singapore (56%)
Modest performers: Philippines (46%), South/ Central America (42%)
Poor outcomes: East Europe (27%), Vietnam (12%), China (8%), Indonesia (4%)
Unemployed or ‘Not in the labourforce’ within 5 years: China = 43%, Japan/ South Korea = 44%, Vietnam = 65%, Indonesia = 65%
Looming pressures – eg ASEAN (health sector focus)
Bilateral agreements – eg Japan-Indonesia (nursing case study)

Issue 3:
Impact of English Ability on IMG Registration (Australia)
Standard required: Set by relevant regulatory bodies
Data: Occupational English Test data (2005-2011)
Nurses (17%) Pharmacists (38%), Doctors (52%), Dentists (62%)
53%
20%
40% 38% 39%
46%
37%
43%
19%
47%
34%
28% 32%
34%
52%
17%
62%
32%
38% 40% 41%
-10%
0%
10%
20%
30%
40%
50%
60%
70%
Ca
nd
ida
te p
as
s r
ate
(%
)
2005
2010
2011

Top Sources for International Medical Graduates
Accepted by Australia: 2006-11 Permanent Migrants
Medicine = 12,696 new IMGs
India: 2,625
Sri Lanka/ Bangladesh: 2,022
UK/ Ireland: 1,579
North Africa + Middle East: 1,194
Canada/ USA: 719
China: 705
Malaysia: 634
South Africa: 632
Other Africa: 479
Philippines: 473

Impact of English Ability – Regulatory Challenges
Pressure for ‘transparency + accountability’ as well as public safety:
Which instruments? What standards mandated?
Empirical basis of choice?
Exemptions? (Native speakers? International students?)
Length of test result validity?
Passes in all 4 tests at a single or multiple attempts?
Suitability for purpose? (eg clinical communication skills)
Extra tests for clinical communication? (when/ how)
Etc!

Impact on Native Speakers of Requirement to Pass All
English 4 Subtests at a Single Sitting: Nursing Data (2010)
100%
0%
36%
100%
8%
34% 33%
20% 20% 25%
58%
42%
24% 23% 22% 21% 20% 17% 17%
13%
0%
10%
20%
30%
40%
50%
60%
70%
80%
90%
100%
Nu
rsin
g ca
nd
idat
e p
ass
rate
(%
)
Proportion of nursing candidates passing OET by select country of training, 2005 and 2010
2005
2010

Issue 4 -
Dominance of Temporary Resident IMGs
Challenges associated with temporary sponsored flows:
Hyper-mobility - Length of stay?
Immediacy of employment?
Clinical purpose/ location
Availability of supervision?
Willingness to invest in full registration
CASE STUDY: Fly-in Fly-out IMGs working in Saskatchewan or
Weipa or Afghanistan….
CASE STUDY: Sector demand (eg psychiatry ‘area of need’ in
Australia)

Case Study:
IMG Retention in Medicine in NZ (Within 5 Years)
Migration = ‘demographic survival’
1955-2004: 2.3 million migrants leads to net population gain of just
208,000 people
Dependence on migrant health professionals: Highest in the OECD
2005-09: 7,102 work permits issued to IMGs + 1,612 permanent
skilled migrants
2009: 323 new domestic graduates + 1,141 IMGs registered
Top sources: England, S Africa, Scotland, Australia, India, US, Sri
Lanka, Ireland, Germany + Iraq
Retention by 2008: Just 50% retained a year after initial registration +
31% for 3 years
Retention by source country + training system:
<50% from S Africa for 5 years
<30% from UK x 2 years
<30% from US/Canada IMGs x 1 year
Highest retention rate = Asia-trained IMGs (50% resident @7 years)
2012: 41% of medical workforce = IMGs (38% in 2007)

Issue 5 -
Pressure for Partial Licensure for IMGs
• Limited scope of practice – Restricts migrant health professionals to
defined functions excluding areas of practice in which they have limited
experience and/or more senior, unsupervised areas of responsibility
(eg within medicine mandating a requirement for supervised clinical
practice, or in pharmacy extended periods of supervised ‘adaptation’).
• Conditional registration – Allows applicants deemed to have near-
sufficient skills or education to be licensed in the host country on a
limited or conditional basis to undertake training (for example through
completion of host country bridging programs, internships, or
examinations).
• Restricted practice time frames – Provides defined periods of
licensure that cater, for example, to transnational corporation
employees (for example which provide health workers to remote mining
companies

OECD (2008) -
Partial Licensure for IMGs
Global examples of conditional licensing for IMGs include:
• UK: Securing a pass grade on the Professional and Linguistic
Assessments Board (PLAB) exam prior to a year of supervised practice
• Finland: Supervised service in a hospital, then a health center, then
private practice
• US: Completion of a residency (highly competitive to secure places)
• Canada: Repetition of two to six years of university training, depending
on the credits awarded for previous study
• Multiple countries: Public hospital practice under variable levels of
supervision

Australia 2008+: Alternative Registration Pathways for IMGs –
Recruitment Impact of the Competent Authority Pathway
Specialists
? X
Fast
Me
diu
m
Slo
w
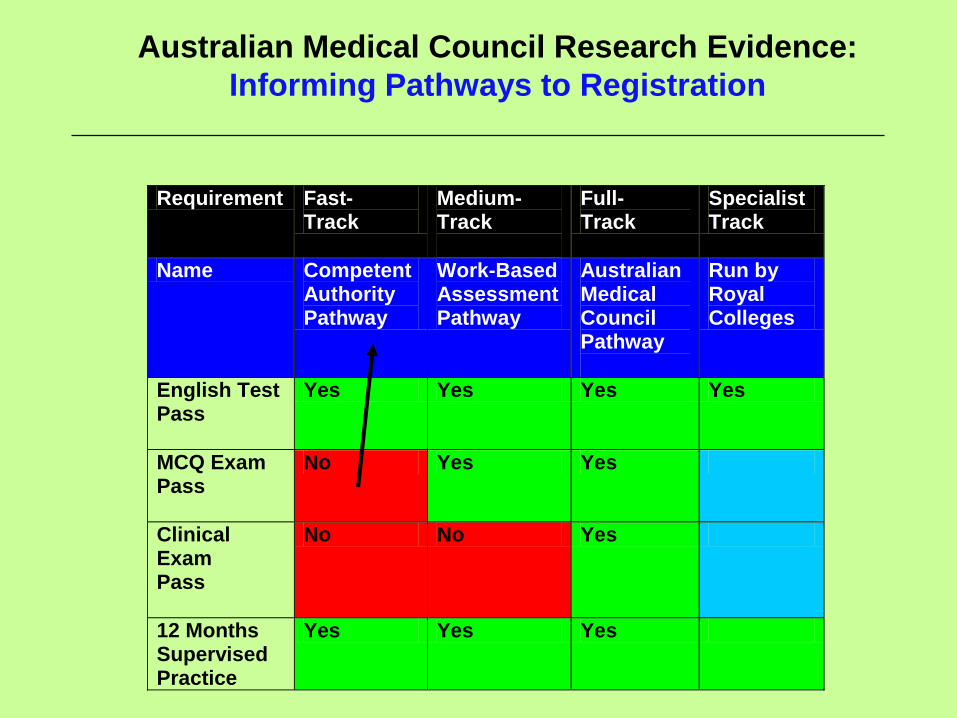
Australian Medical Council Research Evidence:
Informing Pathways to Registration
Requirement Fast- Track
Medium-Track
Full- Track
Specialist Track
Name Competent Authority Pathway
Work-Based Assessment Pathway
Australian Medical Council Pathway
Run by Royal Colleges
English Test Pass
Yes Yes Yes Yes
MCQ Exam Pass
No Yes Yes
Clinical Exam Pass
No No Yes
12 Months Supervised Practice
Yes Yes Yes

Issue 6 -
Catering to the Study-Migration Pathway
Challenges:
The case for testing exemptions?
1. Returning citizens
2. Country of qualification
3. Institution of qualification
Empirical evidence for decision-making?
Location of study (institutional calibre)
CASE STUDY: Returning Canadian students qualified in Australia
or Ireland or UK or Poland or India (scale of
demand!)

OECD Policy:
International Higher Education Students as a Priority
Talent Resource
Top 12 Global Destination Countries (2007-2008)
International Students Enrolled in Higher/ Vocational Education
1. US 623,805 (2008)
2. Australia 389,373 (2008)
3. UK 389,330 (2008)
4. France 260,596 (2008)
5. Germany 246,369 (2007)
6. China 223,499 (2008)
7. Japan 123,829 (2008)
8. Canada 113,996 (2007)
9. Singapore 86,000 (2007)
10. Malaysia 72,000 (2008)
11. South Korea 63,952 (2008)
12. New Zealand 39,942 (2007)
Source: Compiled from data provided in International Student Mobility: Status Report 2009, V Lasanowski, The Observatory on Borderless Higher Education, UK, June 2009
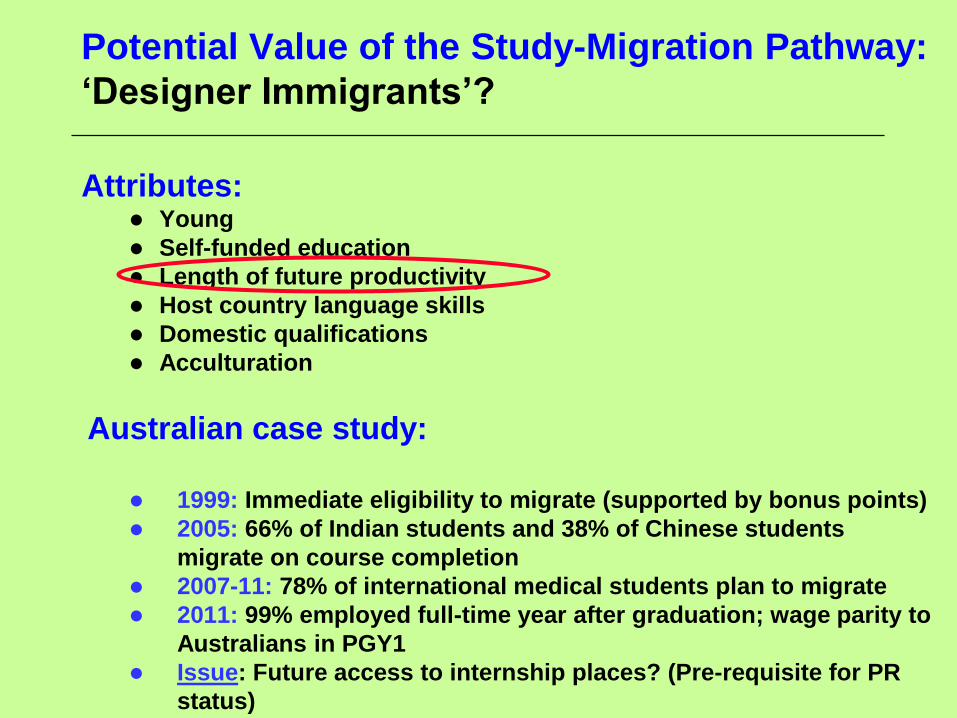
Potential Value of the Study-Migration Pathway:
‘Designer Immigrants’?
Attributes: Young
Self-funded education
Length of future productivity
Host country language skills
Domestic qualifications
Acculturation
Australian case study:
1999: Immediate eligibility to migrate (supported by bonus points)
2005: 66% of Indian students and 38% of Chinese students
migrate on course completion
2007-11: 78% of international medical students plan to migrate
2011: 99% employed full-time year after graduation; wage parity to
Australians in PGY1
Issue: Future access to internship places? (Pre-requisite for PR
status)

Employer Place of Selection –
Facilitating Two-Step Migration (2011-12)

Former International Students: Full-Time Employment Rates 6
Months After Completing Australian Degrees by Field Compared to
Domestic Students (2007-11)
Qualification Field Australian Graduates
(Sample = 371,000)
International Students
(Sample = 79,000)
Accounting 83% 35%
Business 76% 40%
IT 78% 42%
Engineering 86% 44%
Medicine 100% 99%
Dentistry 94% 96%
Pharmacy 98% 96%
Physiotherapy 94% 67%
Nursing 92% 71%

Issue 7 -
Changing Regulation Strategies in Other Fields
Engineering – Washington Accord: Member countries = Select number
Regulatory body capacity-development = Prior to membership (eg Malaysia, China)
Recognition = Select institution of training
Control = Destination country regulatory body
Accounting – ACCA (Association of Chartered Certified Accountants):
Status = Global industry qualification
Providers = Licensed
Training = Upgrades for 1+ planned destination countries
Caters to = Hypermobile professionals
Mining/ Geoscience – CRIRSCO (Committee for Mineral Reserves International Reporting
Standards):
Status = Recognition of ‘global competent persons’
Pre-requisite 1 = Nationally accredited by home country institution
Pre-requisite 2 = Nominated by 3 CRIRSCO members
Pre-requisite 3 = Minimum of 5 years approved professional experience in defined field
Then globally approved to assess mineral deposits for listing on world stock exchanges

The Challenge:
Mismatch Between Regulatory Systems and 21st Century Mobility
Patterns
Stakeholder pressure:
• Employers seek more agile and responsive accreditation
systems, matched to contemporary migration modes and sector
needs.
• Governments urge regulatory bodies to change, in order to
maximize workforce efficiency and social justice outcomes.
• Globally mobile professionals advocate to be able to transfer
and use their skills, including when relocating on a temporary
basis.
• Regulatory bodies are under growing pressure to adapt, spurred
by the scale of migration in regulated fields, the development of
bilateral and multilateral agreements, rapid growth in temporary
flows, expansion of the study-migration pathway, and national or
regional reform agendas