the predictability of maxillary repositioning in …...original article the predictability of...
TRANSCRIPT

ORIGINAL ARTICLE
The predictability of maxillary repositioning inLeFort I orthognathic surgeryRon Jacobson, DDS, MS,a and David M. Sarver, DMD, MSb
Chicago, Ill, and Birmingham, Ala
Our ability to predict the outcome of any orthognathic procedure relies on the surgeon’s ability to accuratelyreproduce the desired skeletal movements and on our understanding of the soft tissue changes associatedwith those movements. The purpose of this retrospective study was to evaluate the surgical accuracy ofmaxillary repositioning by comparing the objectives obtained from cephalometric prediction tracings with theactual skeletal changes achieved during maxillary and maxillomandibular procedures. The sample consistedof 46 patients from the files of 1 orthodontist. Presurgical and immediately postsurgical cephalometricradiographs were digitized, and the original surgical prediction was reproduced with Dentofacial Planner(Dentofacial Software, Toronto, Ontario, Canada) software. Vertical and horizontal measurements to severalskeletal landmarks were used to assess the differences between the predicted maxillary position and theactual maxillary postsurgical position. Statistical differences were found for some measurements, particularlythose related to the vertical placement of the posterior maxilla. Three variables were evaluated for their effecton the surgical discrepancies. The 2 surgeons with the most patients were evaluated and found to havedifferences in the direction of discrepancies but not the amount (absolute values). Significant differenceswere also found when evaluating surgical complexity (single-jaw vs bimaxillary procedures) and the directionof movement (impaction vs advancement) in direction only. To assess the overall fit of individual predictions,we calculated an average discrepancy for each patient; 80% of the actual results fell within 2 mm of theprediction, and 43% fell within 1 mm of the prediction. (Am J Orthod Dentofacial Orthop 2002;122:142-54)
For over 30 years, orthognathic surgery hasproved to be a significant tool in correctingsevere dentofacial skeletal discrepancies. The
combined efforts of orthodontists and oral surgeonshave dramatically improved the quality of life forpatients with functional and esthetic disharmonies.
Now, more than ever, the esthetic outcome of thesurgical procedure is a major factor in determining itssuccess, because patient expectations are very high. Sincetheir introduction over 10 years ago, software programsused to alter patient images to predict the outcome ofsurgical procedures have been refined and now havegreatly improved graphics and impressive interfaces.Printouts of surgical predictions have reached photo-graphic quality. However, there has been an ongoingcontroversy, considering the litigious nature of our soci-ety, about whether these predictions should be shown topatients. Some fear that predictions might imply a guar-anteed outcome.1
A major benefit of surgical prediction is its use as acommunication tool among all involved persons. Theamount of esthetic change desired by a patient candramatically alter the treatment plan. It can determine theneed for bimaxillary versus single-jaw procedures andwhether adjunctive procedures such as genioplasty, rhino-plasty, or liposuction are necessary. The esthetic goal alsodetermines the direction of presurgical orthodontic prep-aration.2
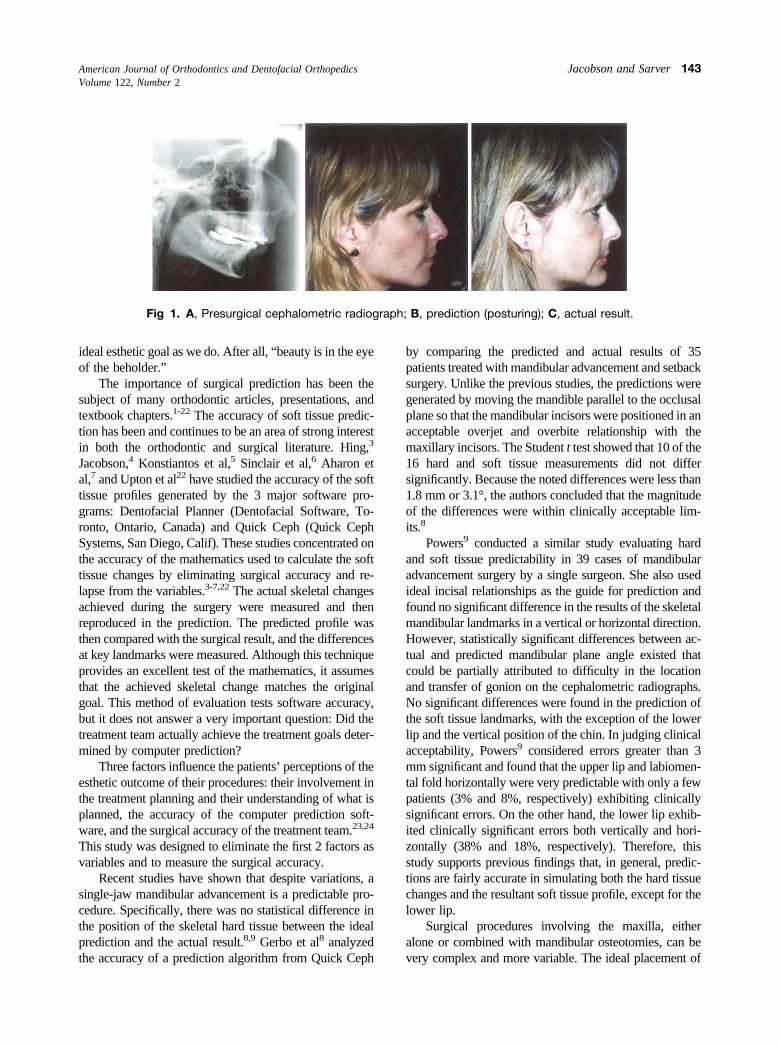
As orthodontists, we look at both the occlusion andthe esthetics when evaluating the success of a surgery.However, the best occlusion will not satisfy a patient whois unhappy with the esthetic outcome. Every patient has aunique perspective of beauty, and some patients havestrong feelings about whether a given result is acceptable.For example, the patient in Figure 1 presented withmandibular retrognathia. The orthodontist and the surgeonagreed that a mandibular advancement would be appro-priate treatment. The orthodontist asked the patient toposture the mandible forward until the anterior teeth werein contact, a simple form of prediction, and the patient waspleased with the photograph (Fig 1, B). Without consult-ing the patient or the orthodontist, the surgeon, knowingthat the patient’s chief complaint was a weak chin,decided to advance the chin an additional 15 mm. Thepatient was not happy with the result. We cannot arbi-trarily assume that patients and surgeons have the same
aAssistant Clinical Professor, Northwestern University.bAdjunct Professor, University of North Carolina.Reprint requests to: Dr Ron Jacobson, 4200 W Peterson Ave, No 116, Chicago, IL60646; e-mail, [email protected], May 2001; revised and accepted, March 2002.Copyright © 2002 by the American Association of Orthodontists.0889-5406/2002/$35.00 � 0 8/1/125576doi:10.1067/mod.2002.125576
142
ideal esthetic goal as we do. After all, “beauty is in the eyeof the beholder.”
The importance of surgical prediction has been thesubject of many orthodontic articles, presentations, andtextbook chapters.1-22 The accuracy of soft tissue predic-tion has been and continues to be an area of strong interestin both the orthodontic and surgical literature. Hing,3
Jacobson,4 Konstiantos et al,5 Sinclair et al,6 Aharon etal,7 and Upton et al22 have studied the accuracy of the softtissue profiles generated by the 3 major software pro-grams: Dentofacial Planner (Dentofacial Software, To-ronto, Ontario, Canada) and Quick Ceph (Quick CephSystems, San Diego, Calif). These studies concentrated onthe accuracy of the mathematics used to calculate the softtissue changes by eliminating surgical accuracy and re-lapse from the variables.3-7,22 The actual skeletal changesachieved during the surgery were measured and thenreproduced in the prediction. The predicted profile wasthen compared with the surgical result, and the differencesat key landmarks were measured. Although this techniqueprovides an excellent test of the mathematics, it assumesthat the achieved skeletal change matches the originalgoal. This method of evaluation tests software accuracy,but it does not answer a very important question: Did thetreatment team actually achieve the treatment goals deter-mined by computer prediction?
Three factors influence the patients’ perceptions of theesthetic outcome of their procedures: their involvement inthe treatment planning and their understanding of what isplanned, the accuracy of the computer prediction soft-ware, and the surgical accuracy of the treatment team.23,24
This study was designed to eliminate the first 2 factors asvariables and to measure the surgical accuracy.
Recent studies have shown that despite variations, asingle-jaw mandibular advancement is a predictable pro-cedure. Specifically, there was no statistical difference inthe position of the skeletal hard tissue between the idealprediction and the actual result.8,9 Gerbo et al8 analyzedthe accuracy of a prediction algorithm from Quick Ceph
by comparing the predicted and actual results of 35patients treated with mandibular advancement and setbacksurgery. Unlike the previous studies, the predictions weregenerated by moving the mandible parallel to the occlusalplane so that the mandibular incisors were positioned in anacceptable overjet and overbite relationship with themaxillary incisors. The Student t test showed that 10 of the16 hard and soft tissue measurements did not differsignificantly. Because the noted differences were less than1.8 mm or 3.1°, the authors concluded that the magnitudeof the differences were within clinically acceptable lim-its.8
Powers9 conducted a similar study evaluating hardand soft tissue predictability in 39 cases of mandibularadvancement surgery by a single surgeon. She also usedideal incisal relationships as the guide for prediction andfound no significant difference in the results of the skeletalmandibular landmarks in a vertical or horizontal direction.However, statistically significant differences between ac-tual and predicted mandibular plane angle existed thatcould be partially attributed to difficulty in the locationand transfer of gonion on the cephalometric radiographs.No significant differences were found in the prediction ofthe soft tissue landmarks, with the exception of the lowerlip and the vertical position of the chin. In judging clinicalacceptability, Powers9 considered errors greater than 3mm significant and found that the upper lip and labiomen-tal fold horizontally were very predictable with only a fewpatients (3% and 8%, respectively) exhibiting clinicallysignificant errors. On the other hand, the lower lip exhib-ited clinically significant errors both vertically and hori-zontally (38% and 18%, respectively). Therefore, thisstudy supports previous findings that, in general, predic-tions are fairly accurate in simulating both the hard tissuechanges and the resultant soft tissue profile, except for thelower lip.
Surgical procedures involving the maxilla, eitheralone or combined with mandibular osteotomies, can bevery complex and more variable. The ideal placement of
Fig 1. A, Presurgical cephalometric radiograph; B, prediction (posturing); C, actual result.
American Journal of Orthodontics and Dentofacial OrthopedicsVolume 122, Number 2
Jacobson and Sarver 143

the maxilla can be a subject of debate and a matter ofopinion. The vertical and horizontal placement of themaxilla will determine the amount of mandibular autoro-tation and the need for a mandibular osteotomy or adjunc-tive genioplasty. Ultimately, the placement of the maxilladuring the surgical procedure has a significant effect onthe esthetic result.
The predictability of maxillary surgery is influ-enced by the ability of the surgeon to accuratelyplace the maxilla, the stability of the maxilla in itsnew location, and the variability of the soft tissueresponse. The purpose of this retrospective study wasto evaluate the first of these factors by comparing thesurgical objectives obtained from original presurgi-cal cephalometric prediction tracings with the actualskeletal changes achieved in maxillary orthognathicsurgery.
MATERIAL AND METHODS
Forty-six patients were selected from the files of thecoauthor (D.M.S). The sample consisted of 31 females
and 15 males with a mean age of 27.1 years (range,13.4-56.0). Case selection was made on the basis of thefollowing criteria: (1) patients received a LeFort Imaxillary osteotomy alone or combined with a man-dibular osteotomy or genioplasty; (2) preoperative andimmediately postoperative lateral cephalometric radio-graphs were of good quality, and the selected land-marks were not obscured; (3) the original presurgicalprescription was present (see the description below);(4) the radiographs showed no apparent misalignmentof the subject’s head in the cephalostat, with the samemachine and technique used for each patient to mini-mize magnification error; and (5) cleft deformities wereexcluded because previous surgery and soft tissueanomalies might have influenced the surgical outcome.
The presurgical radiographs were taken at a meantime of 31 days (range, 1-74) before surgery. The post-surgical radiographs were taken at a mean time of 11 days(range, 2-37) after surgery.
The surgical treatment was divided among 8 surgeons.Twenty-one patients were treated by 1 surgeon, 14 byanother, and the remaining 11 were treated by 6 surgeonswho had 1 to 3 patients each.
For the purposes of the study, it was critical to obtainthe original presurgical evaluation used by the orthodon-tist to determine the surgical objectives. These objectiveswere established after an extensive esthetic evaluation andan interactive consultation with the patient (to producegraphic images of functional and esthetic goals for patientapproval) before the start of treatment and were confirmedbefore the surgical procedure.2 The objectives used toevaluate the surgical outcome for the study were gener-ated by the orthodontist and relayed to the surgeon asgraphic and written prescriptions with specific instructionsfor maxillary movement. The following is an example ofan actual surgical prescription used in the study: maxilla:impact 4.5 mm and advance 2 mm; mandible: autorotate;chin: advance 7 mm; rhinoplasty: none.
The surgical prescriptions were made on the basis ofprediction tracings and model surgery performed by theorthodontist. A surgical splint, if used, was based on thesame model surgery as the prediction and was alsofabricated by the orthodontist. Ideally, the presurgicaltracing plus the surgical prescription would equal thepostsurgical tracing. All differences were recorded andlabeled as surgical discrepancy.
The presurgical radiograph was traced onto acetatepaper, and landmarks were identified. Outlines of thecranial base, the maxilla, and the mandible were drawn toaid in proper superimposition of the presurgical andpostsurgical radiographs. Points corresponding to land-marks sella, nasion, porion, orbitale, basion, and pterygo-maxillary fissure were marked on the postsurgical radio-
Fig 2. Custom analysis. Linear measurements (mm):A-point horizontal to SN�7 perpendicular; A-point ver-tical to SN�7; maxillary central incisor horizontal toSN�7 perpendicular; maxillary central incisor vertical toSN�7; maxillary first molar horizontal to SN�7 perpen-dicular; maxillary first molar vertical to SN�7. Angularmeasurement: palatal plane to SN�7 perpendicular.
American Journal of Orthodontics and Dentofacial OrthopedicsAugust 2002
144 Jacobson and Sarver
graph by superimposing the presurgical and postsurgicalradiographs on the cranial base.22 This was done to assurethat these landmarks were coincident on the radiographs.The computer uses sella and nasion to superimpose thecephalometric tracings. In addition, maxillary regionalsuperimposition of the postsurgical radiograph on thepresurgical tracing was used as a guide to outline themaxilla on the postsurgical radiograph and to select themaxillary landmarks anterior nasal spine (ANS), A-point,maxillary incisor tip (U1), maxillary molar cusp tip (U6),and posterior nasal spine (PNS). These landmarks wereused to assess changes in maxillary position, and, if theywere not identified the same on both radiographs, the
differences in landmark location would affect the mea-surement results.
The tracings were digitized with a Neumonics digi-tizer (Dentofacial Software) and Dentofacial Planner, acomputerized diagnostic and treatment planning softwaresystem for IBM-compatible computers.
The original surgical prediction tracing was thenrecreated in Dentofacial Planner Plus so that a directcomparison could be made with the postsurgical tracing.This was accomplished by first loading the presurgicaltracing onto the screen. The software has a surgicalcomponent that allows the user to move maxilla, mandi-ble, and chin to simulate the desired surgery. The infor-
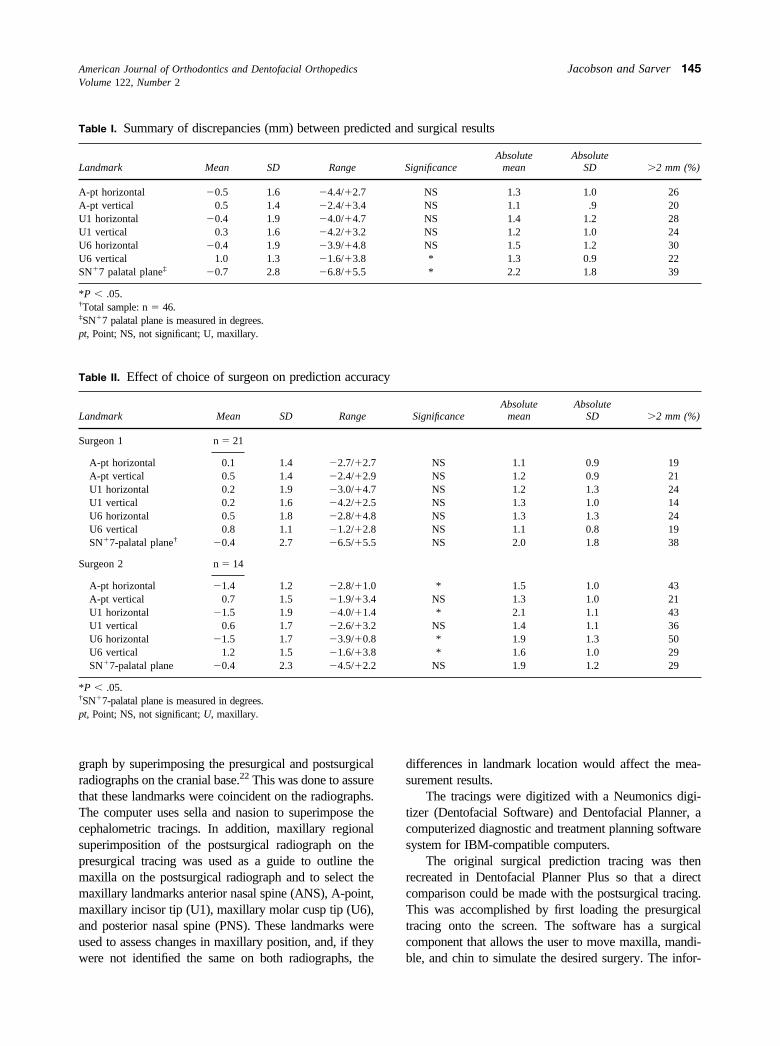
Table I. Summary of discrepancies (mm) between predicted and surgical results
Landmark Mean SD Range SignificanceAbsolute
meanAbsolute
SD �2 mm (%)
A-pt horizontal �0.5 1.6 �4.4/�2.7 NS 1.3 1.0 26A-pt vertical 0.5 1.4 �2.4/�3.4 NS 1.1 .9 20U1 horizontal �0.4 1.9 �4.0/�4.7 NS 1.4 1.2 28U1 vertical 0.3 1.6 �4.2/�3.2 NS 1.2 1.0 24U6 horizontal �0.4 1.9 �3.9/�4.8 NS 1.5 1.2 30U6 vertical 1.0 1.3 �1.6/�3.8 * 1.3 0.9 22SN�7 palatal plane‡ �0.7 2.8 �6.8/�5.5 * 2.2 1.8 39
*P � .05.†Total sample: n � 46.‡SN�7 palatal plane is measured in degrees.pt, Point; NS, not significant; U, maxillary.
Table II. Effect of choice of surgeon on prediction accuracy
Landmark Mean SD Range SignificanceAbsolute
meanAbsolute
SD �2 mm (%)
Surgeon 1 n � 21
A-pt horizontal 0.1 1.4 �2.7/�2.7 NS 1.1 0.9 19A-pt vertical 0.5 1.4 �2.4/�2.9 NS 1.2 0.9 21U1 horizontal 0.2 1.9 �3.0/�4.7 NS 1.2 1.3 24U1 vertical 0.2 1.6 �4.2/�2.5 NS 1.3 1.0 14U6 horizontal 0.5 1.8 �2.8/�4.8 NS 1.3 1.3 24U6 vertical 0.8 1.1 �1.2/�2.8 NS 1.1 0.8 19SN�7-palatal plane† �0.4 2.7 �6.5/�5.5 NS 2.0 1.8 38
Surgeon 2 n � 14
A-pt horizontal �1.4 1.2 �2.8/�1.0 * 1.5 1.0 43A-pt vertical 0.7 1.5 �1.9/�3.4 NS 1.3 1.0 21U1 horizontal �1.5 1.9 �4.0/�1.4 * 2.1 1.1 43U1 vertical 0.6 1.7 �2.6/�3.2 NS 1.4 1.1 36U6 horizontal �1.5 1.7 �3.9/�0.8 * 1.9 1.3 50U6 vertical 1.2 1.5 �1.6/�3.8 * 1.6 1.0 29SN�7-palatal plane �0.4 2.3 �4.5/�2.2 NS 1.9 1.2 29
*P � .05.†SN�7-palatal plane is measured in degrees.pt, Point; NS, not significant; U, maxillary.
American Journal of Orthodontics and Dentofacial OrthopedicsVolume 122, Number 2
Jacobson and Sarver 145

mation from the surgical prescription was used as a guideto create the desired skeletal positions. The software thengenerated a predicted soft tissue profile on the basis of themovements of the skeletal structures. For this study, thesoft tissue profile was not compared with the actualoutcome because of facial swelling immediately aftersurgery. For similar reasons, the predicted mandibularposition was not compared with the actual outcomebecause its position on the immediately postsurgicalradiograph might not be accurate because of edema,muscular swelling, and, in some cases, the presence of asurgical splint.
A custom analysis was designed with the Tools(Dentofacial Software) supplemental software. The anal-ysis measured the linear distances (in millimeters) fromthe maxillary landmarks (A-point, U1, and U6) to hori-zontal and vertical reference lines (Fig 2). The horizontalreference is a line 7° to sella-nasion (SN) and is referred toas SN�7. The line was used to orient the tracings on thecomputer screen and the printouts. The vertical referencewas established perpendicular to SN�7, with its origin atsella (see previous articles). One angular measurementwas included to determine discrepancies in the orientationof the palatal plane (PNS-ANS).
The surgical prediction and the actual immediatelypostsurgical tracing were superimposed on the computeron the basis of SN and oriented on the basis of SN�7. Theanalysis was performed for the individual tracings, anddifferences between the tracings were presented andrecorded as the raw data for the study. When evaluatingthe differences between the 2 tracings, it is helpful toremember that the differences were calculated by subtract-ing the predicted landmark location from the actualpostsurgical landmark location. Therefore, for horizontalmeasurements, a negative value indicates that the actualresult was posterior to predicted position; a positive valueindicates that the actual result was anterior to the predicted
position. For vertical measurements, a negative valueindicates that the actual result was superior to the pre-dicted position, whereas a positive value indicates that theactual result was inferior to the prediction.
An analysis of variance (ANOVA) was used to assessstatistical significance. The independent variables of land-mark and predicted/actual result were used in all analyses.
The primary interest of the study was how closely thepredicted result matched the actual result at each land-mark. Two different dependent variables were used toassess this. In the first set of analyses, the dependentvariables were the distances from the landmarks to thereference lines (positive and negative), comparing thepredicted results with the actual results. To determine theoverall accuracy, we used a 2-way repeated-measuresANOVA, with landmark and predicted/actual results be-ing the 2 repeated measures. To test the effect of a variableon the accuracy of the surgery, we divided the sample intoa series of subgroups. The first series was 2 subgroupsdetermined on the basis of the surgeon used. The secondseries involved 2 subgroups determined according to thelevel of surgical complexity (maxillary alone or bimaxil-lary). The third series had 2 subgroups based on theprimary direction of maxillary movement (impaction vsadvancement). The subgroups were compared in eachseries with 3-way repeated-measures ANOVAs with thesame variables as above, but with the added independentvariable specific to the series. In this analysis, we wereprimarily interested in interaction effects. When signifi-cance was obtained in an interaction effect, a Newman-Keuls post hoc analysis was used to establish whichpredicted values were different from the actual values.
The second set of analyses used the absolute value ofthe discrepancies between predicted and actual measure-ments as the dependent variable. The independent vari-ables were landmark, surgeon, complexity, and direction.The statistic used for analysis was a 2-way repeated-
Fig 3. Effect of choice of surgeon on prediction accuracy.
American Journal of Orthodontics and Dentofacial OrthopedicsAugust 2002
146 Jacobson and Sarver
measures ANOVA, with landmark as the repeated vari-able.
In any study based on cephalometrics, the error in themethod must be assessed and considered when interpret-ing the results. To assess the error in this study, werandomly selected 5 subjects and repeated the completeprocess of presurgical tracing, postsurgical tracing, super-imposition, and digitizing 2 to 3 months after the initialevaluation. The tracings were superimposed by the com-puter and compared with the custom analysis created forthe study. The mean differences for the linear landmarkmeasurements were within 0.65 mm. The mean differencefor the angular measurement was 0.96.
RESULTSSurgical prediction and actual outcomemeasurements
A 2-way repeated-measures ANOVA was per-formed to look for differences between the predictionand the actual outcome. We examined the effect of 2independent variables (predicted/actual and landmark)on the distance from the reference lines to the land-marks. Both independent variables were examined in arepeated-measures manner, because all measurementscame from the same subject. This analysis measuredthe significance of 3 effects: predicted versus actual,landmark differences, and interaction between the 2
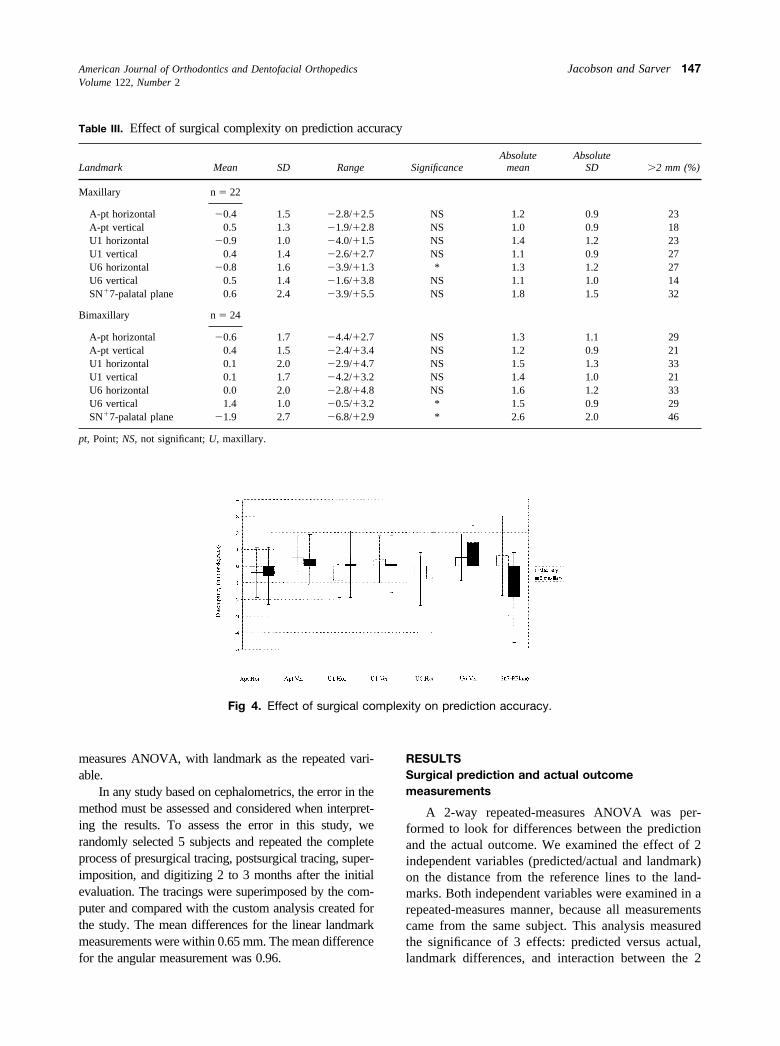
Fig 4. Effect of surgical complexity on prediction accuracy.
Table III. Effect of surgical complexity on prediction accuracy
Landmark Mean SD Range SignificanceAbsolute
meanAbsolute
SD �2 mm (%)
Maxillary n � 22
A-pt horizontal �0.4 1.5 �2.8/�2.5 NS 1.2 0.9 23A-pt vertical 0.5 1.3 �1.9/�2.8 NS 1.0 0.9 18U1 horizontal �0.9 1.0 �4.0/�1.5 NS 1.4 1.2 23U1 vertical 0.4 1.4 �2.6/�2.7 NS 1.1 0.9 27U6 horizontal �0.8 1.6 �3.9/�1.3 * 1.3 1.2 27U6 vertical 0.5 1.4 �1.6/�3.8 NS 1.1 1.0 14SN�7-palatal plane 0.6 2.4 �3.9/�5.5 NS 1.8 1.5 32
Bimaxillary n � 24
A-pt horizontal �0.6 1.7 �4.4/�2.7 NS 1.3 1.1 29A-pt vertical 0.4 1.5 �2.4/�3.4 NS 1.2 0.9 21U1 horizontal 0.1 2.0 �2.9/�4.7 NS 1.5 1.3 33U1 vertical 0.1 1.7 �4.2/�3.2 NS 1.4 1.0 21U6 horizontal 0.0 2.0 �2.8/�4.8 NS 1.6 1.2 33U6 vertical 1.4 1.0 �0.5/�3.2 * 1.5 0.9 29SN�7-palatal plane �1.9 2.7 �6.8/�2.9 * 2.6 2.0 46
pt, Point; NS, not significant; U, maxillary.
American Journal of Orthodontics and Dentofacial OrthopedicsVolume 122, Number 2
Jacobson and Sarver 147
independent variables. The mean discrepancies, stand-ard deviations, and ranges for landmark location be-tween the surgical prediction and the actual outcomefor the total sample are summarized in Table I. Nosignificant overall differences were found betweenpredicted and actual locations of the landmarks. Asexpected, the landmark effect was significant, be-cause different landmarks naturally occur at differentdistances from the reference lines. This is irrelevantto this study. The third effect, the interaction effect,shows whether the delta (discrepancy) between pre-dicted and actual location of each landmark issignificantly different from 0 or from other land-
marks. The analysis showed that this interactioneffect was significant.
Next, a Newman-Keuls post hoc analysis wasperformed to determine which landmarks were signif-icantly different from 0. For most measurements, themean differences were very close to 0. The placementof the maxillary molar in a vertical dimension tended tobe inferior to the prediction and led to the strongeststatistical difference between predicted and actual po-sitions. The angular measurement SN�7-palatal planetended toward a negative direction, indicating that theslope of the palatal plane was more upward (or lessdownward) than predicted.
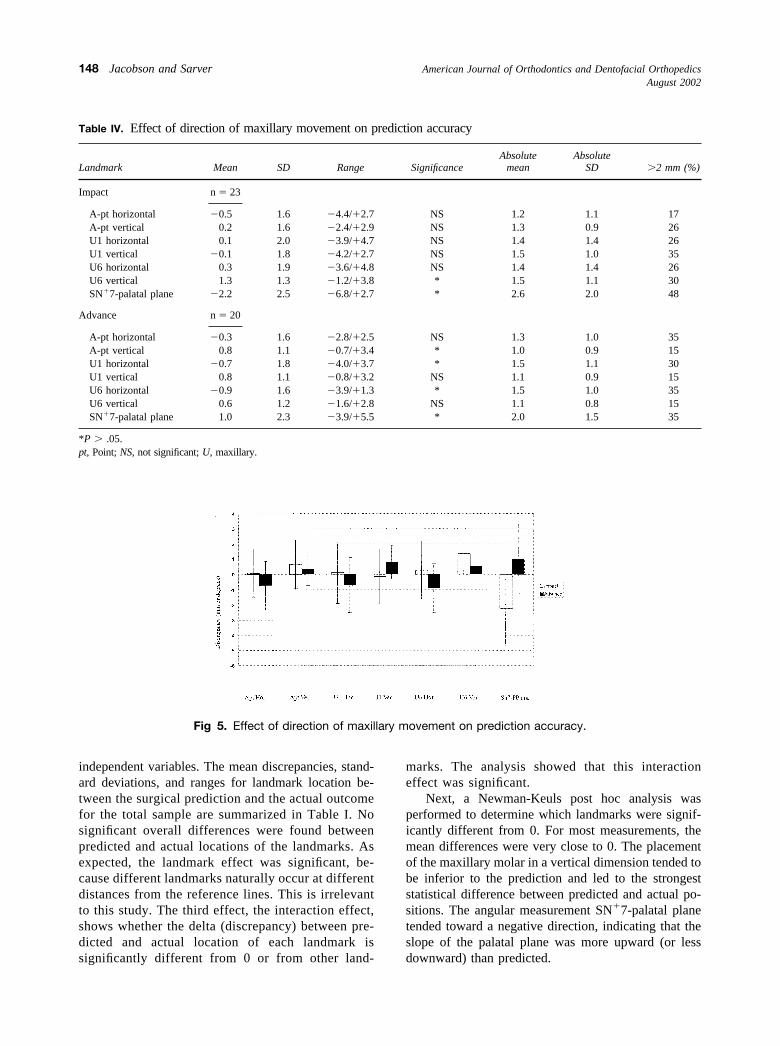
Fig 5. Effect of direction of maxillary movement on prediction accuracy.
Table IV. Effect of direction of maxillary movement on prediction accuracy
Landmark Mean SD Range SignificanceAbsolute
meanAbsolute
SD �2 mm (%)
Impact n � 23
A-pt horizontal �0.5 1.6 �4.4/�2.7 NS 1.2 1.1 17A-pt vertical 0.2 1.6 �2.4/�2.9 NS 1.3 0.9 26U1 horizontal 0.1 2.0 �3.9/�4.7 NS 1.4 1.4 26U1 vertical �0.1 1.8 �4.2/�2.7 NS 1.5 1.0 35U6 horizontal 0.3 1.9 �3.6/�4.8 NS 1.4 1.4 26U6 vertical 1.3 1.3 �1.2/�3.8 * 1.5 1.1 30SN�7-palatal plane �2.2 2.5 �6.8/�2.7 * 2.6 2.0 48
Advance n � 20
A-pt horizontal �0.3 1.6 �2.8/�2.5 NS 1.3 1.0 35A-pt vertical 0.8 1.1 �0.7/�3.4 * 1.0 0.9 15U1 horizontal �0.7 1.8 �4.0/�3.7 * 1.5 1.1 30U1 vertical 0.8 1.1 �0.8/�3.2 NS 1.1 0.9 15U6 horizontal �0.9 1.6 �3.9/�1.3 * 1.5 1.0 35U6 vertical 0.6 1.2 �1.6/�2.8 NS 1.1 0.8 15SN�7-palatal plane 1.0 2.3 �3.9/�5.5 * 2.0 1.5 35
*P � .05.pt, Point; NS, not significant; U, maxillary.
American Journal of Orthodontics and Dentofacial OrthopedicsAugust 2002
148 Jacobson and Sarver
We used the preceding analysis to determine thesignificance of the directionality of differences betweenpredicted and actual results. We also wanted to deter-mine if any landmarks were more susceptible to dis-crepancy, regardless of the direction of the discrepancy.To illustrate the amount of the discrepancy, we re-moved the directional component by looking at abso-lute values of the data (Table I). Using these figures, weperformed an ANOVA, which showed that only theangle SN�7-palatal plane was significantly differentfrom the other measurements (P � .000014).
To evaluate clinical relevance, the percentage ofpatients with a discrepancy of 2 mm or more betweenpredicted and actual landmark locations is also shown inTable I. For the angular measurement, Sn�7 perpendicu-lar to the palatal plane, 2° was used as the clinical level ofsignificance. For the total sample, a 2-mm or greaterdiscrepancy was noted for 20% to 30% of the patients, and
a 2o or more discrepancy was noted for 39% of thepatients.
Surgical accuracy between surgeons
To evaluate the effect of choice of surgeon onprediction accuracy, we used a subset of the data.Surgeon 1 treated 21 patients, and surgeon 2 treated 14patients. The remaining 6 surgeons treated between 1and 3 patients each, and their subgroups were too smallto evaluate meaningfully. The first 2 surgeons’ mea-surement results are presented in Table II. The direc-tional data showed significance between surgeons 1 and2, and an interaction effect between choice of surgeonand landmark discrepancy.
Surgeon 1 (21 patients) had no statistically significantdiscrepancies between predicted and actual locations, andwas more consistent in the placement of the maxillaaccording to the prediction. The percentage of surgeon 1’s
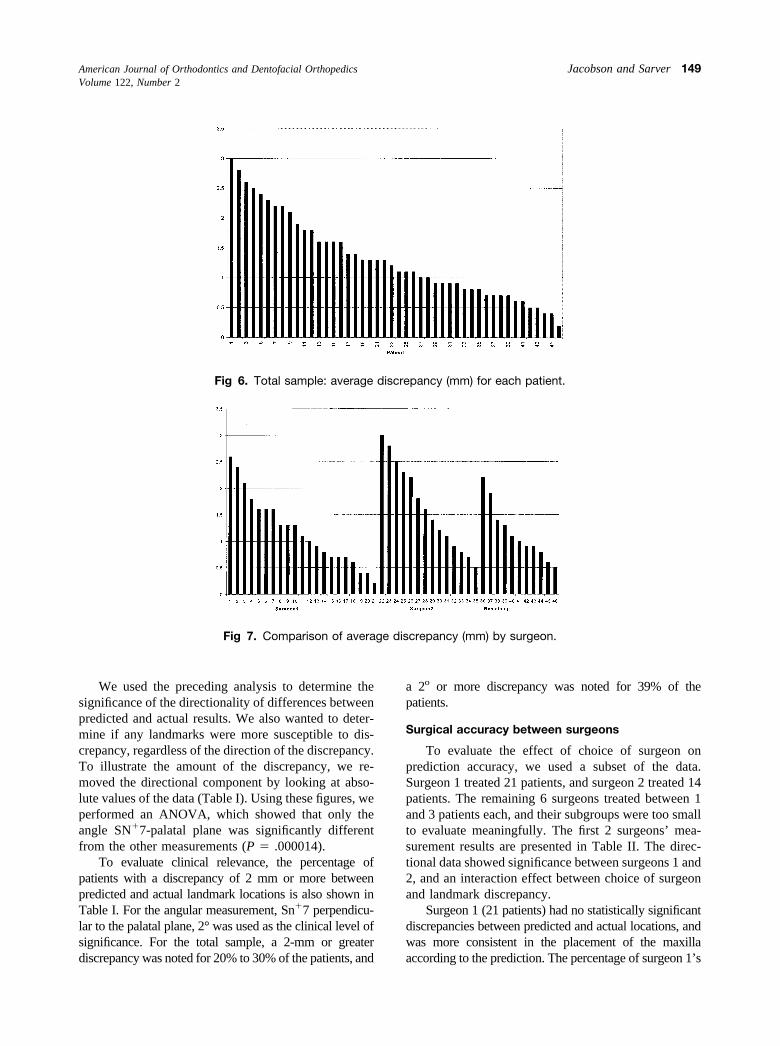
Fig 6. Total sample: average discrepancy (mm) for each patient.
Fig 7. Comparison of average discrepancy (mm) by surgeon.
American Journal of Orthodontics and Dentofacial OrthopedicsVolume 122, Number 2
Jacobson and Sarver 149
patients with discrepancies larger than 2 mm was less thanthe total sample and less than surgeon 2’s patients (range,19%-24%).
Surgeon 2 had significant differences in predictedversus actual locations for 4 of the landmarks because ofa tendency to place the maxilla posterior to its predictedposition. The differences in landmark placement betweenthe surgeons are illustrated in Figure 3. As shown in TableII, surgeon 2 had higher percentages of patients, withclinically significant discrepancies (21%-50%); unfortu-nately, the samples were not of equal size, and the surgicalprocedures were not exactly the same, so a direct clinicalcomparison was problematic.
Evaluation of absolute values (amount of discrepancyregardless of direction) showed that surgeon 2 had con-sistently higher means, but the differences between thesurgeons were not significant (repeated-measures ANOVAwith the absolute differences between actual and predictedlocations (P � .130), and the surgeons did not differ fromeach other by landmark (interaction effect P � .464).
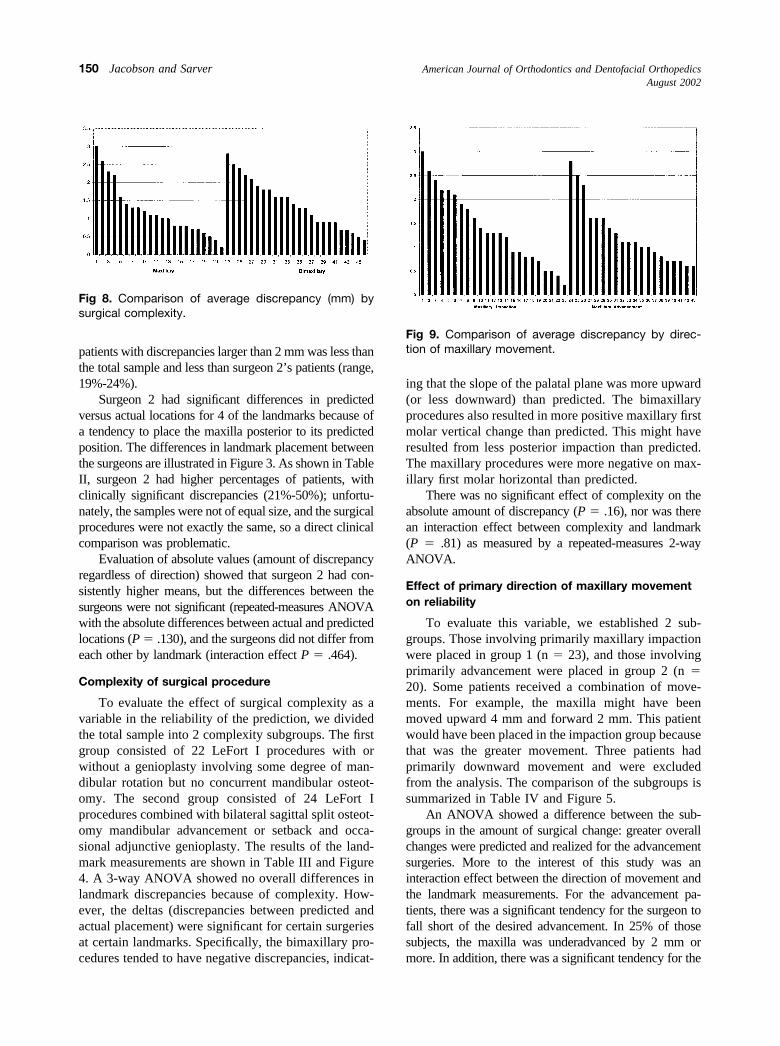
Complexity of surgical procedure
To evaluate the effect of surgical complexity as avariable in the reliability of the prediction, we dividedthe total sample into 2 complexity subgroups. The firstgroup consisted of 22 LeFort I procedures with orwithout a genioplasty involving some degree of man-dibular rotation but no concurrent mandibular osteot-omy. The second group consisted of 24 LeFort Iprocedures combined with bilateral sagittal split osteot-omy mandibular advancement or setback and occa-sional adjunctive genioplasty. The results of the land-mark measurements are shown in Table III and Figure4. A 3-way ANOVA showed no overall differences inlandmark discrepancies because of complexity. How-ever, the deltas (discrepancies between predicted andactual placement) were significant for certain surgeriesat certain landmarks. Specifically, the bimaxillary pro-cedures tended to have negative discrepancies, indicat-
ing that the slope of the palatal plane was more upward(or less downward) than predicted. The bimaxillaryprocedures also resulted in more positive maxillary firstmolar vertical change than predicted. This might haveresulted from less posterior impaction than predicted.The maxillary procedures were more negative on max-illary first molar horizontal than predicted.
There was no significant effect of complexity on theabsolute amount of discrepancy (P � .16), nor was therean interaction effect between complexity and landmark(P � .81) as measured by a repeated-measures 2-wayANOVA.
Effect of primary direction of maxillary movementon reliability
To evaluate this variable, we established 2 sub-groups. Those involving primarily maxillary impactionwere placed in group 1 (n � 23), and those involvingprimarily advancement were placed in group 2 (n �20). Some patients received a combination of move-ments. For example, the maxilla might have beenmoved upward 4 mm and forward 2 mm. This patientwould have been placed in the impaction group becausethat was the greater movement. Three patients hadprimarily downward movement and were excludedfrom the analysis. The comparison of the subgroups issummarized in Table IV and Figure 5.
An ANOVA showed a difference between the sub-groups in the amount of surgical change: greater overallchanges were predicted and realized for the advancementsurgeries. More to the interest of this study was aninteraction effect between the direction of movement andthe landmark measurements. For the advancement pa-tients, there was a significant tendency for the surgeon tofall short of the desired advancement. In 25% of thosesubjects, the maxilla was underadvanced by 2 mm ormore. In addition, there was a significant tendency for the
Fig 8. Comparison of average discrepancy (mm) bysurgical complexity.
Fig 9. Comparison of average discrepancy by direc-tion of maxillary movement.
American Journal of Orthodontics and Dentofacial OrthopedicsAugust 2002
150 Jacobson and Sarver

maxilla to have downward movement that was notanticipated by the prediction. For the impaction sub-group, the maxillary first molar vertical measurementand the SN�7-palatal plane were significant. Clinically,in 30% of the cases, the surgeon underimpacted themaxilla by 2 mm or more.
Direction of maxillary movement had no significanteffect on absolute amounts of discrepancy as measured bya 2-way repeated measures ANOVA (P � .33), nor wasthere an interaction effect between landmark and direction(P � .31).
Evaluation of individual cases
Evaluating the means and standard deviations of themeasurements can yield information about tendenciesin direction and amount of discrepancy for a specificlandmark, but in evaluating the accuracy of a predictionfor a patient, it is helpful to look at the maxilla as awhole. An overall discrepancy in millimeters for eachpatient was calculated as the total of the absolute valuesof the linear measurements. The absolute values wereused so that discrepancies in different directions would
Fig 10. Example of 5-mm horizontal discrepancy (average discrepancy, 2.5 mm). Mandible is notin occlusion in postsurgical radiograph.
Fig 11. Vertical and horizontal discrepancy (average discrepancy, 3 mm).
American Journal of Orthodontics and Dentofacial OrthopedicsVolume 122, Number 2
Jacobson and Sarver 151

not cancel each other. The average discrepancy inmillimeters for the patient is the overall discrepancydivided by 6 (number of millimeter measurements). Byassigning a value to the overall fit of the actual result tothe prediction, it was possible to organize the samplefrom least accurate to most accurate (Fig 6). Theaverage discrepancy in millimeters does not take intoaccount the angular data, so similar calculations com-bining the measurements in millimeters and angulardata were also performed. The results were very close
(with a slight difference in the sorting of the patients),so the 2 types of measurements were not combined.
As the graph illustrates, many predictions had verylittle discrepancy from the actual result. In fact, 43% of thepredictions had less than 1 mm average discrepancy, and80% had less than 2 mm average discrepancy.
Organizing the data by average discrepancy alsoallowed for a visual comparison between the series ofsubgroups that were compared in the study. Figure 7shows the average discrepancy for the predictions in the
Fig 12. Mild average discrepancy (1.5 mm).
Fig 13. Minimal average discrepancy (0.6 mm).
American Journal of Orthodontics and Dentofacial OrthopedicsAugust 2002
152 Jacobson and Sarver

subgroups determined by the surgeon involved in thetreatment. This confirms that there was little differencebetween the surgeons. Figure 8 shows the average dis-crepancy in the predictions for the subgroups determinedby surgical complexity. There appears to be less averagediscrepancy with single-jaw procedures than with double-jaw procedures, but the difference is not significant.Figure 9 shows the average discrepancy for the predic-tions in the subgroups determined by the direction ofmaxillary movement. Again, the graphs are similar.
DISCUSSION
The results of this study suggest that LeFort Imaxillary orthognathic surgery can be very accurate.However, the results showed a fairly wide range. Mostpatients (80%) had good approximation between theprediction and the actual result, and several wereextremely good. What happened to the patients forwhom predictions did not match surgical outcome? Insome, for valid reasons, the surgeon could not, or chosenot to, follow the final presurgical plan.
Figure 10 shows the surgical plan for a patient and theactual result superimposed on the prediction. This patientdemonstrates 1 of the highest average millimeter discrep-ancies. In this plan, a 3-mm maxillary impaction wasprescribed with subsequent mandibular autorotation and a5-mm advancement genioplasty. The surgeon impactedthe maxilla 3 mm but also advanced it 5 mm. Then,because the mandibular autorotation was not sufficient, amandibular advancement was performed with a concur-rent advancement genioplasty. This does not necessarilyindicate that the result of the surgical procedure was poor,
but that it was different from the original plan. In fact, thesurgeon might have viewed the patient’s esthetic needsdifferently. This demonstrates the need for surgical pre-diction and consultation between the involved persons butalso illustrates a shortcoming of the current method ofinvestigation. To label the measured discrepancies be-tween prediction and actual result a “surgical error,” wewould need to establish with confidence that the surgeonattempted to follow the agreed-on prediction.
Another example of a patient with a high averagediscrepancy is shown in Figure 11. In this patient, thesurgical prescription called for a 3-mm posterior impac-tion and a 2-mm advancement to accommodate themandibular autorotation. Instead, the surgeon down-grafted the anterior portion of the maxilla and left theposterior maxilla alone. This meant that no mandibularautorotation occurred, so there was no need for themaxillary advancement. Was this surgical error or dis-agreement with the plan? The result was the highestaverage millimeter discrepancy (3 mm).
Fortunately, most results were considerably closer tothe prediction than the last 2 examples. Figure 12 illus-trates a typical case that falls in the middle of the samplewhen sorted by the average discrepancy. The surgicalprescription called for a 4.5-mm maxillary impaction witha 2-mm advancement to allow for mandibular autorotationand a 7-mm advancement genioplasty. Figures 13 and 14show examples of extremely accurate results.
This study suggests that, to evaluate the error in thesurgical technique, the method should include the sur-geon’s own predictions. This would eliminate the variableof communication and agreement between the clinicians.
Fig 14. Least average discrepancy (0.2 mm).
American Journal of Orthodontics and Dentofacial OrthopedicsVolume 122, Number 2
Jacobson and Sarver 153
Why would the clinicians not agree? Because this study isretrospective, that is a difficult question to answer. Mostpatients in the sample originally sought orthodontic treat-ment and were referred to the surgeons. However, somewere referred for orthodontic treatment by the surgeonsinvolved. Did that make a difference in the perception ofwho was responsible for deciding the final esthetic goals?A prospective study involving consecutive cases andconfirmed agreement would be ideal. The next step inevaluating the existing sample would be to look at theposttreatment radiograph at least 6 months after thesurgery to evaluate the effect of the discrepancies inmaxillary position on the soft tissue outline, ie, to deter-mine if the surgical goals were met.
CONCLUSIONS
1. LeFort I maxillary and maxillomandibular surgerycan be extremely accurate.
2. In 80% of the sample, the results of the surgery were,on average, within 2 mm of the prediction.
3. There were statistical differences between 2 surgeonsin the direction of specific landmark discrepancies butnot in the amount.
4. There were no statistical differences between the sur-gical groups when divided by surgical complexity(single-jaw vs bimaxillary procedures) with the excep-tion of the direction of the palatal plane discrepancy.
5. There were statistical differences between the surgicalgroups when divided by direction of movement (im-paction vs advancement) in the direction of landmarkdiscrepancies. For advancements, the surgeons tendedto place the maxilla posterior and inferior to its pre-dicted position. For impactions, the surgeons tended tounderimpact the posterior maxilla. However, theamounts were not significant when absolute valueswere considered.
6. The study supports the use of surgical predictiontracing and demonstrates the need for communicationbetween the involved clinicians to ensure that theyagree on a plan.
REFERENCES
1. Pospisil OA. Reliability and feasibility of prediction tracing inorthognathic surgery. J Craniomaxillofac Surg 1987;154:79-83.
2. Sarver DM. Esthetic orthodontics and orthognathic surgery. StLouis: Mosby-Year Book; 1998.
3. Hing NR. The accuracy of computer generated prediction tracings.Int J Oral Maxillofac Surg 1989;18:148-51.
4. Jacobson RS. The reliability of soft tissue profile prediction inorthognathic surgery [thesis]. Chicago: Northwestern University;1989.
5. Konstiantos KA, O’Reilly MT, Close J. The validity of the predic-tion of soft tissue profile changes after LeFort I osteotomy using thedentofacial planner (computer software). Am J Orthod DentofacialOrthop 1994;105:241-9.
6. Sinclair PM, Kipelainen P, Phillips C, White RP, Rogers L, SarverDM. The accuracy of video imaging in orthognathic surgery. Am JOrthod Dentofacial Orthop 1995;107:177-85.
7. Aharon PA, Eisig S, Cisneros GJ. Surgical prediction reliability: acomparison of two computer software systems. Int J Adult OrthodOrthognath Surg 1997;12:65-78.
8. Gerbo LR, Poulton DR, Covell DA. A comparison of a computer-based orthognathic surgery prediction system to postsurgical results.Int J Adult Orthod Orthognath Surg 1997;12:55-62.
9. Powers B. The accuracy of computer generated profile predictionsassociated with mandibular advancement surgery [thesis]. Chicago:Northwestern University; 1998.
10. Turvey T, Hall DJ, Fish LC, Epker BN. Surgical-orthodontictreatment planning for simultaneous mobilization of the maxilla andmandible in the correction of dentofacial deformities. Oral Surg OralMed Oral Pathol Oral Radiol Endod 1982;54:491-8.
11. Harradine NWT, Birnie DJ. Computerized prediction of the resultsof orthognathic surgery. J Maxillofac Surg 1985;13:245-9.
12. Friede H, Kahnberg K, Ragnar A, Ridell A. Accuracy of cephalo-metric prediction in orthognathic surgery. J Oral Maxillofac Surg1987;45:754-60.
13. Bryan DC, Hunt NP. Surgical accuracy in orthognathic surgery. Br JOral Maxillofac Surg 1993;31:343-50.
14. Bryan DC. An investigation into the accuracy and validity of threepoints used in the assessment of autorotation in orthognathicsurgery. Br J Oral Maxillofac Surg 1994;32:363-72.
15. Johnson DG. Intraoperative measurement of maxillary reposition-ing: an ancillary technique. Oral Surg Oral Med Oral Pathol OralRadiol Endod 1985;60:266-8.
16. Van Sickels JE, Larsen AJ, Triplett R. Predictability of maxillarysurgery: a comparison of internal and external reference marks. OralSurg Oral Med Oral Pathol Oral Radiol Endod 1986;61:542-5.
17. Stanchina R, Ellis E III, Gallo WJ, Fonseca RJ. A comparison oftwo measures for repositioning the maxilla during orthognathicsurgery. Int J Adult Orthod Orthognath Surg 1988;3:149-54.
18. Wylie GA, Epker BN, Mossop JS. A technique to improve theaccuracy of total maxillary surgery. Int J Adult Orthod OrthognathSurg 1988;3:143-7.
19. Polido WD, Ellis E III, Sinn DP. An assessment of the predictabilityof maxillary surgery. J Oral Maxillofac Surg 1990;48:697-701.
20. Ellis E III, Tharanon W, Gambrell K. Accuracy of face-bowtransfer: effect on surgical prediction and postsurgical result. J OralMaxillofac Surg 1992;50:562-7.
21. Wiesenfeld D. Improving the accuracy of orthognathic surgery. AnnR Aust Coll Dent Surg 1994;12:225-6.
22. Upton PM, Sadowsky PL, Sarver DM, Heaven TJ. Evaluation ofvideo imaging prediction in combined maxillary and mandibularorthognathic surgery. Am J Orthod Dentofacial Orthop 1997;112:656-65.
23. Kiyak HA, Bell R. Psychosocial considerations in surgery andorthodontics. In: Profitt WR, White RP, editors. Surgical-orthodon-tic treatment. St Louis: Mosby; 1991.
24. Kiyak HA, Vitaliano PP, Crinean J. Patients’ expectations aspredictors of orthognathic surgery outcomes. Health Psychol 1988;7:251-68.
American Journal of Orthodontics and Dentofacial OrthopedicsAugust 2002
154 Jacobson and Sarver