the power to bribe three economic essays on the causes and consequences of...
TRANSCRIPT

THE POWER TO BRIBE
Three Economic Essays on the Causes and Consequences of
Corruption
Nils Herger
February 2007

Acknowledgments
Any work of the length and scope of a thesis must benefit from the help and support of
numerous persons from both academic and private backgrounds. In particular, I would like
to express my gratitude to the following for facilitating the work on this thesis during the
last three years.
Not only having pointed out the interesting economic questions about corruption waiting
to be researched, Christos Kotsogiannis and Steven McCorriston have provided excellent su-
pervision during my studies for a Ph.D. I appreciate in particular, the amount of time they
were ready to devote to this project in terms of countless discussions as well as providing
many valuable comments on unfinished manuscripts of this thesis.
I would like to thank my parents, Tilly and Martin Herger, for their continuous support.
Your striking of the balance between being encouraging but never setting overly high expec-
tations in me, provided the basis to proceed my way on the path leading to higher education.
Last but not least, my wife Wu Hua continued to be my biggest source of inspiration,
albeit studying at the University of Exeter meant that we had to live for some time in a
long-distance relationship. Most importantly, you have given me the necessary distraction
from studying, without which I would have risked to get lost in the details of research.
Berne, August 2006
i

Abstract
This thesis assesses some of the causes and consequences of endemic corruption by drawing
on economic theory and applying econometric methods. Aside from an introductory and
concluding part, the main matter is divided into three essays, each of which addressing a
specific research question.
From a theoretical perspective, the first essay establishes the causal impact of a fed-
eral structure of government upon the extent of corruption. Federalism divides public power
between tiers of governance and thereby modifies an essential component upon which cor-
ruption - defined as an abuse of public power for private benefit - rests. In particular, such
multi-tiered governance exhibits vertical externalities to the extent that two distinct gov-
ernments operate directly upon the economy. Due to inevitable overlapping responsibilities,
federations are believed to suffer from corrupt overgrasing (Shleifer and Vishny, 1993). Essay
1 suggests, however, a more complex mapping from federalism onto corruption. Analogous
to tax competition in federations (Keen and Kotsogiannis, 2002, 2003), where horizontal and
vertical externalities arise across jurisdictions and tiers of government, decentralising public
power over a multitude of jurisdictions provides a remedy against corruption. Contrary to
taxation, participation decisions guide the voluntary choice of government representatives
and firms to engage in corrupt conduct. Above all, participation constraints endogenise the
number of Leviathans, which in turn determine how many profit maximising firms they are
willing to corrupt into bankruptcy to maximising graft. Decentralising public power accord-
ing to the federal principle allows, furthermore, to exploit possible differences in incentives
and monitoring across jurisdictions, which underly the participation constraints for corrup-
tion. Thus, strong central government will be preferable to political decentralisation when
combatting corruption (Shleifer and Vishny, 1993), only if the central tier remains unaffected
by endemic bribery. Assigning clear spheres of responsibility to central and local government
provides an alternative to centralisation when dealing with corrupt overgrasing in federations.
Remaining with corruption in federations, the second essay endeavours to establish the
empirical mapping between multi-tiered governance and government misconduct. Based on
data comparing perceived differences in corruption around the world, previous studies suggest
ii

iii
federations to be more corrupt (Treisman, 2000) meanwhile fiscal decentralisation reduces the
level of bribery (Fisman and Gatti, 2002). These findings provide a puzzle insofar as fed-
erations almost always assign distinct tax bases to central and local government. Indeed,
countries with indisputably federalistic constitutions, like Canada, India, Switzerland, and
the United States, figure among the most fiscally decentralised. Against this background,
the second essay attributes this inconsistency to unattended selection bias, e.g. federalism
is an endogenous variable with attributes inducing a country to draw up a federal consti-
tution being in turn related to corruption. Moreover, the ordinal nature of survey based
corruption indices renders them somewhat unsuitable in guiding OLS regressions. Applying
semi-parametric matching methods as well as switching regressions instead, which mitigate
against ordinality and selection bias, results in a negative impact of federalism upon corrup-
tion. The result is robust towards employing recently assembled structural data on the extent
of corruption (Dreher et al., 2004), which exhibit cardinal properties.
Finally, the third essay addresses some of consequences of corruption in terms of estab-
lishing the relationship between foreign direct investment (FDI) undertaken as cross-border
acquisition (CBA) and institutional quality variables. In order to explain the distribution
and growth of international merger activity around the world, the current sample contains
a panel of merger counts between country-pairs for the years from 1997 to 2003, aggregated
from SDC Platinum, which claims to attain an almost exhaustive coverage of CBAs. The
essay draws together three inter-related aspects of the literature on FDI and CBAs: First,
the ”knowledge-capital model” provides the theoretical underpinning relating the distribu-
tion and form of FDI to country size, relative factor endowment, and resulting factor cost.
Other variables control for common language, distance, trade-barriers, and preferential trad-
ing agreements. Secondly, the empirical specification accounts for the growth of CBAs based
on finance-related variables such as financial deepening and relative wealth effects. Thirdly,
institutional quality is introduced, which was the focus of Rossi and Volpin (2003), but the
present variables refer to a more general concept of institutional quality manifesting in host
country characteristics such as established democratic rule, voice and accountability, estab-
lished and secure property rights, modest regulation, as well as the absence of corruption.
The role of such broader measures of institutional quality have been highlighted, among else
by the World Bank, as why developing countries do not fully benefit from globalisation.
Based on estimation by means of panel-count techniques, results suggest that - controlling
for established economic covariates for FDI - institutional quality is an important determi-
nant facilitating CBAs, though some variables featuring prominently in previous research like
investment cost (Carr et al. 2001) or common law origin (La Porta, 1997, 1998, 1999) fail to
produce statistically or economically significant impacts. Furthermore, since SDC Platinum
reports standard industry classification codes (SDC) of merging companies, the full sample

iv
can be split into horizontal deals, which typically involve acquiring and target firms with
equal SIC codes, and vertical respectively conglomerate deals, which typically involve acquir-
ing and target firms with different SIC codes. The conditional impact of institutional quality
variables suggests voice and accountability, property rights, and regulatory quality to matter
more for horizontal deals. Conversely, vertical and conglomerate deals are rather facilitated
when investment cost are low and the control of corruption is effective.
To subsume, the present thesis shows how institutions like federalism, which decentralises
public power, stand crucial to combat abuses of public power for private benefit. Creating
and maintaining institutions, which foster uncorrupted government conduct, can, however,
put a considerable burden on a countries resources and involve a long time period to establish
effective checks and balances. For some countries, a reduction of endemic corruption back to
tolerable levels might only happen in the long-term. The economic benefits thereof, e.g. in
terms of receiving more FDI, tend, however, to be substantial.

Contents
I Introduction and Literature Review 1
1 Introduction 2
1.1 Defining Corruption . . . . . . . . . . . . . . . . . . . . . . . . . . . . . . . . 3
1.2 Economic Aspects of Corruption . . . . . . . . . . . . . . . . . . . . . . . . . 5
1.3 Classifying Corruption . . . . . . . . . . . . . . . . . . . . . . . . . . . . . . . 7
2 Literature Review 15
2.1 Empirical Studies . . . . . . . . . . . . . . . . . . . . . . . . . . . . . . . . . . 16
2.1.1 Measuring Corruption around the World . . . . . . . . . . . . . . . . . 16
2.1.2 Empirical Patterns . . . . . . . . . . . . . . . . . . . . . . . . . . . . . 18
2.2 Theoretical Causes of Corruption . . . . . . . . . . . . . . . . . . . . . . . . . 20
2.2.1 Industrial Organisation of Corruption . . . . . . . . . . . . . . . . . . 20
2.2.2 Corruption as a Crime . . . . . . . . . . . . . . . . . . . . . . . . . . . 23
2.2.3 Regulatory and Principal-Agent Approaches . . . . . . . . . . . . . . . 24
2.2.4 Self-Enforcing Corruption . . . . . . . . . . . . . . . . . . . . . . . . . 27
2.3 Theoretical Consequences of Corruption . . . . . . . . . . . . . . . . . . . . . 29
2.3.1 Growth and Investment . . . . . . . . . . . . . . . . . . . . . . . . . . 29
2.3.2 Corruption as a Tax . . . . . . . . . . . . . . . . . . . . . . . . . . . . 30
II Essays 35
3 Federalism and Corruption - Theory 36
3.1 Structure and Timing . . . . . . . . . . . . . . . . . . . . . . . . . . . . . . . 39
3.2 Participation Decision . . . . . . . . . . . . . . . . . . . . . . . . . . . . . . . 42
3.2.1 Officials . . . . . . . . . . . . . . . . . . . . . . . . . . . . . . . . . . . 43
3.2.2 Firms . . . . . . . . . . . . . . . . . . . . . . . . . . . . . . . . . . . . 45
3.3 Corrupt Leviathans . . . . . . . . . . . . . . . . . . . . . . . . . . . . . . . . . 48
3.4 Unitarian Constitutions . . . . . . . . . . . . . . . . . . . . . . . . . . . . . . 51
3.4.1 Centralised Governance . . . . . . . . . . . . . . . . . . . . . . . . . . 51
3.4.2 Confederation . . . . . . . . . . . . . . . . . . . . . . . . . . . . . . . . 53
v

CONTENTS vi
3.5 Federations . . . . . . . . . . . . . . . . . . . . . . . . . . . . . . . . . . . . . 54
3.5.1 Balanced Power Federation . . . . . . . . . . . . . . . . . . . . . . . . 55
3.5.2 Asymmetric Power Federation . . . . . . . . . . . . . . . . . . . . . . 57
3.6 Comparative Considerations . . . . . . . . . . . . . . . . . . . . . . . . . . . . 59
3.7 Concluding Remarks . . . . . . . . . . . . . . . . . . . . . . . . . . . . . . . . 61
4 Federalism and Corruption - Empirical Results 69
4.1 Data and OLS Estimates . . . . . . . . . . . . . . . . . . . . . . . . . . . . . 71
4.1.1 Dependent Variable: Corruption . . . . . . . . . . . . . . . . . . . . . 71
4.1.2 Control Variables . . . . . . . . . . . . . . . . . . . . . . . . . . . . . . 76
4.1.3 Decentralisation . . . . . . . . . . . . . . . . . . . . . . . . . . . . . . 77
4.2 Endogenous Federalism . . . . . . . . . . . . . . . . . . . . . . . . . . . . . . 79
4.2.1 Federations around the World . . . . . . . . . . . . . . . . . . . . . . . 79
4.2.2 Federalism and Selection Bias . . . . . . . . . . . . . . . . . . . . . . . 79
4.2.3 Attributes to adopt Federalism . . . . . . . . . . . . . . . . . . . . . . 81
4.3 Federalism and Corruption: Results from Models with Endogenous Selection
of Federalism . . . . . . . . . . . . . . . . . . . . . . . . . . . . . . . . . . . . 84
4.3.1 Switching Regression . . . . . . . . . . . . . . . . . . . . . . . . . . . . 85
4.3.2 Propensity Score Matching . . . . . . . . . . . . . . . . . . . . . . . . 88
4.4 Concluding Remarks . . . . . . . . . . . . . . . . . . . . . . . . . . . . . . . . 93
5 CBA, Corruption, and Institutions 101
5.1 Theoretical Background - Horizontal and Vertical Motives for International
Merger Activity . . . . . . . . . . . . . . . . . . . . . . . . . . . . . . . . . . . 104
5.2 An Econometric Method to Analyse Mergers as Event Count . . . . . . . . . 106
5.2.1 Counting International Merger Deals . . . . . . . . . . . . . . . . . . . 106
5.2.2 Regression onto Merger Counts . . . . . . . . . . . . . . . . . . . . . . 109
5.3 A Baseline Specification of International Merger Activity . . . . . . . . . . . 112
5.3.1 Econometric Specification and Data . . . . . . . . . . . . . . . . . . . 112
5.3.2 Baseline Results . . . . . . . . . . . . . . . . . . . . . . . . . . . . . . 115
5.4 Introducing Institutional Quality . . . . . . . . . . . . . . . . . . . . . . . . . 118
5.4.1 Four Dimensions of Institutional Quality . . . . . . . . . . . . . . . . . 118
5.4.2 Empirical Impact of Institutional Quality . . . . . . . . . . . . . . . . 120
5.5 Concluding Remarks . . . . . . . . . . . . . . . . . . . . . . . . . . . . . . . . 124
5.5.1 Data Description . . . . . . . . . . . . . . . . . . . . . . . . . . . . . . 127
5.5.2 Summary Statistics . . . . . . . . . . . . . . . . . . . . . . . . . . . . . 129
III Concluding Remarks 135

List of Figures
1.1 Classification according to Decision Maker . . . . . . . . . . . . . . . . . . . . 9
2.1 Corruption around the World (2005) . . . . . . . . . . . . . . . . . . . . . . . 17
2.2 Multiple Equilibria in Corruption . . . . . . . . . . . . . . . . . . . . . . . . . 29
3.1 Sequence of Events . . . . . . . . . . . . . . . . . . . . . . . . . . . . . . . . . 42
3.2 Endogenous Number of Officials . . . . . . . . . . . . . . . . . . . . . . . . . . 45
3.3 Endogenous Number of Firms . . . . . . . . . . . . . . . . . . . . . . . . . . . 48
3.4 Laffer Relationship in Bribery . . . . . . . . . . . . . . . . . . . . . . . . . . . 50
3.5 Equilibria under a Centralistic, Confederate, and Federal Constitution . . . . 59
4.1 Probability Response of Adopting Federalism towards Ethnic Diversity and
French Legal Origin . . . . . . . . . . . . . . . . . . . . . . . . . . . . . . . . 83
4.2 Empirical Distributions of Federations and other Countries . . . . . . . . . . 89
4.3 Distribution of Federations according to Propensity Score . . . . . . . . . . . 91
5.1 CBA Activity relative to Differences in GDP and Wages . . . . . . . . . . . . 115
vii

List of Tables
1.1 Various Classifications of Corruption . . . . . . . . . . . . . . . . . . . . . . . 8
1.2 Classification according to Power . . . . . . . . . . . . . . . . . . . . . . . . . 10
4.1 Least Squares Regressions . . . . . . . . . . . . . . . . . . . . . . . . . . . . . 72
4.2 Corruption and Decentralisation Data . . . . . . . . . . . . . . . . . . . . . . 74
4.3 Federations . . . . . . . . . . . . . . . . . . . . . . . . . . . . . . . . . . . . . 79
4.4 Logit Regressions onto Federations . . . . . . . . . . . . . . . . . . . . . . . . 82
4.5 Summary Statistics . . . . . . . . . . . . . . . . . . . . . . . . . . . . . . . . . 85
4.6 Results from Switching Regressions . . . . . . . . . . . . . . . . . . . . . . . . 87
4.7 Simulated Outcomes of Corruption . . . . . . . . . . . . . . . . . . . . . . . . 88
4.8 Results from Propensity Score Matching . . . . . . . . . . . . . . . . . . . . . 93
4.9 Description of the Data Set . . . . . . . . . . . . . . . . . . . . . . . . . . . . 95
5.1 Overview of Merger Counts (Source Countries) . . . . . . . . . . . . . . . . . 107
5.2 Overview of Merger Counts (Host Countries) . . . . . . . . . . . . . . . . . . 108
5.3 Baseline Model . . . . . . . . . . . . . . . . . . . . . . . . . . . . . . . . . . . 116
5.4 Summary Statistics of Institutional Quality Variables . . . . . . . . . . . . . . 119
5.5 Count Regressions with Institutional Quality Variables . . . . . . . . . . . . . 121
5.6 Marginal Impact of Institutional Quality Variables . . . . . . . . . . . . . . . 123
5.7 Description of the Data Set . . . . . . . . . . . . . . . . . . . . . . . . . . . . 127
5.8 Summary Statistics of Control Variables . . . . . . . . . . . . . . . . . . . . . 129
viii

Part I
Introduction and Literature Review
1

Chapter 1
Introduction: Corruption and
Economics
Corruption is a persistent phenomenon, evolving with the ever more complex structures of
governance in human society. Every country around the world has witnessed practices of
bribery, embezzlement, fraud, or nepotism. Not surprisingly, social sciences like history,
law, philosophy, political science, and sociology have contributed to a substantial strand of
literature endeavouring to explain the nature of corruption. Conversely, up to the 1990ies
economics contributed only sparsely towards this literature, even though bribery involves
economic elements like the exchange of scarce resources or the tradeoff between the benefits
from extracting kickbacks and the possibility of arrest. Identifying corruption as a major
obstacle for economic development, the ongoing globalisation, and newly assembled empiri-
cal data have since sparked a dramatic increase in economic research about the causes and
consequences of corruption. Not wanting to disregard the efforts undertaken by other disci-
plines, corruption will here be analysed from an economic perspective.
Against this background, the present three essays on corruption must be seen as small
but specific contributions. Although not comprehensive in terms of coverage, the essays
encompass a broad range of theoretical and empirical methods applied in the economics of
corruption. Furthermore, both the economic causes and consequences of endemic bribery are
subject of the present thesis.
Preliminary to the essays, the following presents some general thoughts on the definition
and the nature of corruption as well as its features that matter when adopting an economic
perspective. So, bribery constitutes a voluntary exchange between issuing specific rights or
providing privileged public services against paying a price - e.g. in terms of a kickback -
entailing efficiency and distributional effects on the allocation of scarce resources. By way
of contrast, political science would focus more on misconduct within the political process,
2

CHAPTER 1. INTRODUCTION 3
with a special emphasis on bribery entailing voting-scandals meanwhile legal scholars tend
to research the differences among monitoring systems and their effectiveness in combatting
corruption.
Meanwhile adopting such an economic perspective, section 1.1 of this introduction reviews
some definitions of the term corruption and section 1.2 discusses some typical economic
features inherent in these definitions. Finally, section 1.3 proposes some categories, based on
which corruption can be classified.
1.1 Defining Corruption
Although recognising corrupt conduct seems straightforward, there exists no consensus about
the definition of the term ”corruption”.1 In order to nevertheless provide a flavour of the
definition of corruption, this section reviews some popular examples. This should not be
seen as an attempt to reveal the best, or even more, the right definition - a definition merely
constitutes a tautological convention and can therefore not be right or wrong. The purpose
of circumscribing the term ”corruption” lies rather in ensuring that hypothesis coming out of
economic theory can be tested in a transparent manner. Furthermore, from a theoretical and
empirical perspective, a clear ground in understanding the term corruption seems inevitable
because ”how corruption is defined ends up determining what gets modeled and measured”
(Jain, 2001, p.73).
As regards common language, the meaning of the term corruption is threefold:2
Corruption (from Latin corrumpere = to break up, destroy, annihilate, spoil,
weaken):
(a) Impairment, decay or decomposition of integrity, virtue, or moral principle
by inducement to the wrong, by improper or unlawful means especially of
people in authority: allegations of bribery and corruption.
Example: I either want less corruption, or more chance to participate in it.
- Ashleigh Ellwood Brilliant (American Author, *1933).
(b) The act or effect of making somebody change from moral to immoral stan-
dards of behaviour.
Example: Power tends to corrupt, and absolute power corrupts absolutely.
- Lord Acton (Historian, 1834-1902).

CHAPTER 1. INTRODUCTION 4
(c) The form of a word or phrase that has become changed from its original form
in some way.
Example: The word ”holiday” is a corruption of ”holy day”.
In its wider sense corruption relates, thus, to a conduct that undermines the rules being
valid in society either as enacted, legal norms or informal customs and conventions. Therefore,
whether or not a behaviour is considered to be corrupt depends crucially on the corresponding
cultural context, which is itself subject to social change. E.g. local customs need taking into
account to distinguish the presentation of a gift from offering a bribe to a public official
(see e.g. Neild 2002, p.5). As regards social change, selling parliamentary seats for profit or
lending parts of public funds for private benefit was not considered to be reprehensible in
18th century Britain (Wraith and Simkins, 1965, pp.63ff.). By today’s standards this would
undoubtedly be considered as public misconduct.3 In its tighter sense, corruption refers to
acts of bribery.4 Within this spirit, legal definitions typically take an extensional form by
circumscribing corruption with a list of practices, which my be involved when extracting a
bribe. E.g. the Council of Europe states in its Civil Law Convention on Corruption:
For the purpose of this convention, ”corruption” means requesting, offering, giv-
ing or accepting, directly or indirectly, a bribe or any other undue advantage or
prospect thereof, which distorts the proper performance of any duty or behaviour
required of the recipient of the bribe, the undue advantage or prospect thereof.
The advantage of such extensional, legal definition lies in their clarity. Conversely, at times
the law enjoys little support or does not coincide with the prevailing norms, legalistic def-
initions are too restrictive insofar as they ignore the social and cultural dimensions of bribery.
In contrast, intentional definitions seek to point out a combination of typical aspects
characterising corrupt exchanges, such as the violation of rules, the abuse of public power,
the seeking of personal benefit, or the infringement of the public interest. Nye (quoted in
Philp, 1997) provides an example of a definition with a more intentional character:
Corruption is a behaviour which deviates from the formal duties of a public role
because of private regarding (personal, close family, private clique) pecuniary or
status gains; or violates rules against the exercise of certain types of private regard-
ing influence. This includes such behaviour as bribery (use of reward to pervert
the judgement of a person in a position of trust); nepotism (bestowal of patron-
age by reason of ascriptive relationship rather than merit); and misappropriation
(illegal appropriation of public resource for private-regarding uses) (p.440).

CHAPTER 1. INTRODUCTION 5
The following popular definition, among else used by the World Bank (e.g. Tanzi, 1998),
states the major characteristics of corruption in a concise manner:
Corruption is the abuse of public power for private benefit.
Brevity renders this definition somewhat vague. It remains e.g. unclear why corruption
must involve compulsively the public domain and whether or not abuses of discretion for
private benefit, which do not impair prevailing laws, still constitute an act of corruption.
Indeed, corruption typically harms the public interest and normally involves a breaking
of prevailing laws. A definition among else build around this idea can be found in Friedrich
(1971):
Corruption is a kind of behaviour which deviates from the norm actually preva-
lent or believed to prevail in a given context, such as the political. It is deviant
behaviour associated with a particular motivation, namely that of private gain at
public expense. But whether this was the motivation or not, it is the fact that
private gain was secured at public expense that matters. (p.127).
It would be meaningless to extend the list with more definitions which have been considered
in the literature. Finding the right definition - in the sense of the for economics most purposive
one - is a pointless task. Instead, the next section endeavours to establish some aspects
inherent in bribery that matter from an economic perspective.
1.2 Economic Aspects of Corruption
From an economic perspective, persistent corruption requires rents and discretionary power
to coexist, which provides the basis for an exchange between offering a bribe and obtain-
ing privileges impairing prevailing laws (compare Jain, 2001, pp.77ff or Aidt, 2003, p.633).
Therefore, aside from legal remedies, an economic strategy to combat corruption must aim
at reducing economic rents and dispersing discretionary power.
Corrupt exchanges involve at least two parties, which may, however, consist of one or sev-
eral individuals with parties termed ”corruptant” or ”bribe-payer”, respectively ”corruptee”
or ”bribe-taker”. Typically, but not necessarily, the corruptee represents the public domain
(politician, bureaucrat, police officer, political party etc.) with the corruptant belonging to
the private domain (citizen, firm, association etc.). The corruptant pays a kickback merely
as a compensation for the corruptee doing him a favour. Corruption shares, hence, some sim-
ilarities with other market transactions, where ”market structure” might crucially determine
the ”market outcome”, e.g. whether or not a society suffers from endemic bribery. Moreover,
this reciprocity stands crucial in contrasting corruption with other economic crimes like fraud

CHAPTER 1. INTRODUCTION 6
or embezzlement. However, unlike other transactions, corruption is typically not embedded
in an institutional framework and therefore lacks established and secure property rights.
Hence, corrupt conduct occurs normally on the basis of personal trust within a face to face
bargain. Then, the bribe-payer can hardly engage in arbitrage. Therefore, the bribe-taker
typically possesses substantial bargaining power, which can be abused meanwhile seeking
self-enrichment.
Adopting and implementing economic policies almost always benefits some parties mean-
while others will find themselves be made worse-off. Therefore, rent-shifting between different
parties like consumers, producers, or government representatives constitutes an inevitable,
albeit sometimes undesired, effect of any government intervention into the economy. When
parties affected by an economic policy can clearly be identified, decision makers enacting,
executing, or enforcing regulations might be tempted to abuse their discretion in order to
secure ”their” share of rent. In general, such competition aiming at creating, maintaining,
and finally capturing rents is referred to as rent-seeking (Krueger 1974; Bhagwati 1982)5.
Although rent-seeking is not illegal per se (e.g. when lobbying a public decision maker to
obtain a favourable outcome), more often than not it involves practices like smuggling, buy-
ing and selling on black markets, or bribery. The exact difference between corruption and
rent-seeking is therefore hard to establish as both include elements of unproductively extract-
ing resources. Some authors indeed consider these concepts as interchangeable (e.g. Persson
and Tabellini, 2003, p.959). As mentioned previously, acts of corruption typically include a
government representative as bribe-taker, whereas rent-seeking does not further specify the
agents involved. When at least one of the following conditions applies, Jain (2001) considers
rent-seeking to likewise constitute an act of corruption:
(a) The process of adopting and implementing economic policies is not carried out according
to the rules known to all agents in advance.
(b) There exist secret side payments to some agent.
(c) The decision-makers’ benefits depend directly on the rents earned by his clients, which
requires a close link between the manner economic policies are implemented and the
income of decision makers.
Corruption requiring some form of government intervention tempts to conclude that dereg-
ulation provides the most effective way to combat public misconduct.6 However, countries
undergoing economic transition, which lead to more freedom and economic deregulation, at
least initially saw an increase in the level of bribery (see Abed and Davoodi, 2000). Further-
more, despite their extensive government intervention, Scandinavian countries figure among
the least corrupted.7 Apparently, government intervention and corruption interact in a more

CHAPTER 1. INTRODUCTION 7
complex manner.
Power stands crucial in corrupt conduct as stated by the famous dictum of Lord Acton
that ”power tends to corrupt, and absolute power corrupts absolutely”. The availability of
discretion, in the sense of the relevant public official possessing the authority to adopt and ex-
ecute policies on a case to case basis even against the will of the potential corrupter, provides
the basis for any kind of opportunistic behaviour (compare Aidt, 2003, p.633 and Jain, 2001,
pp.77ff.). Discretionary power puts authorities in a position to enact (legislative power),
execute (executive power), or enforce (judicatory power) policies. Trivially, only politicians,
bureaucrats, and judges possessing discretionary power can engage in public misconduct.
Corruption is commonly perceived as wrongdoing, with an agent taking advantage of
his position by deviating from the original instructions of a principal. Indeed, ”the person
bribed must necessarily be acting as an agent for another individual or organisation since
the purpose of the bribe is to induce him to place his interest ahead of the objectives of the
organisation for which he works” (Rose-Ackerman, 1975, p.157). Such practices are costly,
insofar as the policies a country has adopted necessitate rules, which are bypassed and in
the long-term undermined by endemic corruption. Consequently, corruption constitutes an
illegal act, which, if discovered, is subject to punishment. This allows applying an economic
”crime and punishment” approach (Becker, 1968) where corrupt exchanges involve a tradeoff
between obtaining kickbacks against the probability of being caught and convicted.
Corrupt exchanges are sometimes referred to as victimless crimes (see Ruggiero, 2000) in
the sense that no individual is directly exposed to any kind of economic damage or harm.
Conversely, an indirect damage on agents not included in the corrupt exchange might occur
via inducing institutional decline, which jeopardises the validity of a set of prevailing rules.
Aside from its illegality, corruption is often seen as an act of immoral behaviour as personal
gain has been put ahead of social benefit at the expense of the integrity of public rules.
However, this judgement rests itself on the perceived integrity of the rules under consideration.
A prisoner bribing his way out of a concentration camp provides a striking example for this
(Rose-Ackerman, 1978).
1.3 Classifying Corruption
Various categories and classifications have been put forward in order to disentangle different
forms of corruption. Table 1.1 contains an overview of the classifications featuring in the
literature on corruption (see e.g. Tanzi, 1998, p.565; Shleifer and Vishny, 1993, pp.5, 6; Bliss
and Di Tella, 1997, p.1003), most of which refer to the way corrupt exchanges are structured

CHAPTER 1. INTRODUCTION 8
and in what way the conduct of parties involved, or the effects of bribery differ.
Table 1.1: Various Classifications of Corruption
Dimension Examples
Structure of Corruption Centralised vs. Decentralised
Petty vs. Grand
Political vs. Bureaucratic
Private vs. Public
Conduct of Parties Coercive vs. Collusive
Effects of Corruption Cost-Reducing vs. Benefit-Enhancing
With Theft vs. Without Theft
Cost Reducing vs. Surplus Shifting
Sources: Tanzi, 1998, p.565; Shleifer and Vishny, 1993, pp.5,6; Bliss and
Di Tella, 1997, p.1003
Some of the proposed classifications are debatable. In particular, distinguishing a case
with theft and without theft (Shleifer and Vishny, 1993) seems hard to justify since cor-
ruption involves the shift of rents and, thus, always inflicts a cost burden upon some third
party. E.g. even if corrupt customs officers do not steal imported commodities, the citizens
of the corresponding country could forgo some tariff-revenue and hence be affected in their
role as tax payer. Moreover, policies upon which a country has agreed will be undermined.
Likewise, the concept of surplus shifting corruption (Bliss and Di Tella, 1997, p.1003) seems
rather inaccurate, as surplus is rather shared in order to obtain rights and privileges in an
illegal, albeit mutually beneficial, exchange.
Another way of distinguishing various types of corruption draws on the role of the economic
parties involved.
Figure 1.1 depicts the relationship of decision-makers in a stylised country identifying
three areas of corrupt exchanges.
(a) Political Corruption
The political elite enacts, executes, and enforces policies by excreting power, which must
be based on some legitimation in order to establish and maintain authority. Democratic
leaders are selected by an electoral process meanwhile totalitarian regimes typically
refer to traditions (monarchy) or the charisma of their leader (dictatorship) in order to

CHAPTER 1. INTRODUCTION 9
Figure 1.1: Classification according to Decision Maker
GOVERNMENT
Enacting , executing, and enforcing laws and regulations
Bureaucracy Collecting information Low level decision making
Appointment and Nepotism
Population
Taxes and Tax Evasion Bribes
Budget and Embezzlement
Elections and Electoral Fraud
Fees and Bribes
POLITICAL CORRUPION
NEPOTISM
BUREAUCRATIC CORRUPION
PDF created with pdfFactory trial version www.pdffactory.com
Source: After Jain 20018
legitimate power. Abusing state power, in the sense of ignoring the rules or traditions
inherent in a society, can bring about enormous private benefits for the political elite.9
This kind of political corruption, which is typically grand in style, undermines the
authority of the political elite and can ultimately induce the population to overthrow
a government, be it through a revolution or democratic defeat at the polls.
(b) Bureaucratic Corruption
Any political system requires bureaus10 to collect information and to take low level
decisions. Most bureaus are monopoly suppliers of their public service, which is pro-
vided on an agreed level against a budget. The fact that there is no direct link between
the provision of a public service and the remuneration of the bureaucrat stands crucial
within the context of corruption. Indeed, according to Niskanen (1974, pp.15ff.) typical
features of bureaus are, firstly, that the owners and employees of bureaus do not ap-
propriate any part of the net revenues as personal income and, secondly, that a major
part of the recurring revenues of such organisations derives from other than the sale
of output at per-unit prices. Corruption can emerge as soon as a service shares some

CHAPTER 1. INTRODUCTION 10
private good characteristics in the sense of exclusively affecting some clearly defined
group of recipients. Then, cynical bureaucrats could be tempted to engage in corrupt
exchanges by demanding undue compensation ahead of providing a service. Such kind
of corruption is typically petty in style.
(c) Nepotism
Appointing bureaucrats is a delicate issue, as for the period they are in office they
sometimes possess a substantial amount of discretionary power which can be abused
for private benefit. This includes the entire discounted present value of the expected
future legal and illegal revenue and privileges attached to a post. Not surprisingly, there
have been cases where large amounts were paid in order to be appointed to a certain
post. However, to maintain the quality and integrity of a bureaucracy necessitates, of
course, appointments on grounds of ability and merit, rather than nepotism.
Finally, Rose-Ackerman (1999, pp.113ff.) suggest a classification according to the level and
distribution of discretionary power between (private) bribe-payers and (public) bribe-takers:
Table 1.2: Classification according to Power
Domain
Powerful Bribe-
Payers within the
Private Domain.
Multiple weak Bribe-
Payers within the
Private Domain .
Corruption concen-
trated among Politi-
cal Elite.
Bilateral Monopoly Kleptocraty
Decentralised Cor-
ruption in Bureau-
cracy.
Mafia dominated State Competitive Bribery
Source: After Rose-Ackerman (1999, p.115)
A Kleptocracy emerges where a powerful elite controls the government without facing
substantial constraints in the private domain. Then, the elite might be able to design a
government structure, which suits them best in diverting large amounts of resources into
their own pockets. When the elite faces an equally powerful opponent across the table, a
bilateral monopoly emerges where the level of bribery and nepotism depends crucially on the
distribution of bargaining power. Conversely, if the power is concentrated in the private sec-
tor, gangs, respectively mafias, could employ bribes in order to keep other criminal activities
afloat without interference from state prosecution. Finally, with power being decentralised

CHAPTER 1. INTRODUCTION 11
in both the public and private domain, a situation of competitive bribery occurs.
The importance of classifying corruption according to some dimension should not be over-
estimated. Any classification constitutes by no means a theory in itself, but merely allows to
identify specific types of bribery. Above all this section has stressed the versatility of corrupt
practices by reemphasising the importance of the distribution of power and the concept of
rent-seeking meanwhile analysing corruption from an economic perspective.

NOTES 12
Notes
1Hence, many studies into corruption start with a discussion about its definition. Examples include Rose-
Ackerman (1999), Neild (2002), Jain (2001), and Tanzi (1998).2See Merriam-Webster or Oxford Dictionary.3Another example, where social change manifests in the meaning of the term corruption can be borrowed
from Johnston and Hao (1995). They report that in the late 1970ies the meaning of the term official corruption
in China was threefold: tanwu referring to public embezzlement and swindling, shouhui referring to bribery,
and tequan referring to privilege seeking. However, by the early 1990ies the term corruption had broadened
to include fubai (moral decay) and guandao (official speculation).4See e.g. Doig (1984): ”Corruption is bribery and bribery is corruption” (p.25).5Bhagwati (1982) defines the somewhat broader concept of unproductive-profit-seeking (DUP) as activities
that ”yield pecuniary returns but do not produce goods or services that enter a utility function directly or
indirectly via increased production or availability to the economy of goods that enter a utility function.”6This conjecture can be traced back to the Roman historian Publicus Cornelius Tacitus stating that: ”The
more corrupt a society, the more numerous the laws”.7E.g. as measured by the corruption perceptions index (CPI) compiled by Transparency International
(www.transparency.org).8Jain (2001) only considers corrupt conduct within democratic societies. Authoritarian forms of government
are included here, since they tend to foster corruption (see e.g. Lederman et al., 2005).9Zaire under Mobuto, the Philippines under Marcos, but also France under the Bourbons provide examples
for this.10Here the term ”bureaus” is used instead of its euphemism ”civil service”.

Bibliography
[1] Abed, G.T. and Davoodi, H.R. (2000), ’Corruption, Structural Reforms, and Economic
Performance in Transition Economies’, IMF Working Paper, no.132.
[2] Aidt, T.S. (2003), ’Economic Analysis of Corruption: A Survey’, The Economic Journal,
vol.113, pp.632-652.
[3] Andevig, J.C. (1991), ’The economics of corruption: a survey’, Studi Economici, vol.43,
pp.57-94.
[4] Becker, G. (1968), ’Crime and punishment: an economic approach’, Journal of Political
Economy, vol.76, pp.169-217.
[5] Bhagwati, J.N., (1982), ’Directly Unproductive, Profit-seeking (DUP) Activities’, Jour-
nal of Political Economy, vol.90, pp.988-1002.
[6] Bliss, C. and Di Tella, R. (1997), ’Does Competition Kill Corruption’, Journal of Political
Economy, vol.105, pp.1001-1023.
[7] Doig, A. (1984), Corruption and misconduct in contemporary British politics, Har-
mondsworth, Penguin.
[8] Friedrich, C.J., (1972), The Pathology of Politics - Violence, Betrayal, Corruption, Se-
crecy and Propaganda, New York, Harper and Row Publishers.
[9] Jain, A.K. (2001), ’Corruption: A Review’, Journal of Economic Surveys, vol.15, pp.71-
121.
[10] Johnston, M. and Hao, Y. (1995), ’China’s Surge of Corruption’, Journal of Democracy”,
Vol.6, pp.80-94.
[11] Keen, M. J. and Kotsogiannis, C. (2002), ’Does Federalism Lead to Excessively High
Taxes?’, The American Economic Review, vol.92, pp.363-370.
[12] Keen, M. J. and Kotsogiannis, C. (2003), ’Leviathan Capital Tax Competition in Fed-
erations’, Journal of Public Economic Theory, vol.5, pp.177-199.
13

BIBLIOGRAPHY 14
[13] Krueger, A. (1974), ’The Political Economy of the Rent-Seeking Society’, American
Economic Review, vol.64, pp.291-303.
[14] Lederman, D., Loayza, N. and Reis Soares, R. (2005), ’Accountability and Corruption -
Political Institutions Matter’, Economics and Politics, vol.17, pp.1-35.
[15] Neild, R. (2002), Public Corruption - The dark side of social evolution, London, Anthem
Press.
[16] Niskanen, W. (1994), Bureaucracy and Public Economics, Aldershot Elgar.
[17] Persson, T, Tabellini, G. and Trebbi, F. (2003), ’Electoral Rules and Corruption’, Jour-
nal of the European Economic Association, vol.1, pp.958-989.
[18] Philp, M. (1997), ’Defining Political Corruption’, Political Studies, vol.45, pp.435-462.
[19] Rose-Ackerman, S. (1975), ’The Economics of Corruption’, Journal of Public Economics,
Vol.4, pp.187-203.
[20] Rose-Ackerman, S. (1978), Corruption - a study in political economy, New York, London
Academic Press.
[21] Rose-Ackerman, S. (1999), Corruption and Government - Causes, Consequences and
Reform, Cambridge, Cambridge University Press.
[22] Ruggiero, V. (2000), Crime and Markets - Essays in Anti Criminology, Oxford, Oxford
University Press.
[23] Shleifer, A. and Vishny, R.W. (1993), ’Corruption’, Quarterly Journal of Economics,
vol.108, pp.599-617.
[24] Tanzi, V. (1998), ’Corruption Around the World - Causes, Consequences, Scope, and
Cures’, IMF Staff Papers, vol.45, pp.559-594.
[25] Wraith, R. and Simkins, E. (1965), Corruption in Developing Countries, London, George
Allen and Unwin Ltd.

Chapter 2
Literature Review on the
Economics of Corruption
The present literature review on the economic aspects of corruption should not be seen as
an attempt to comprehensively survey all contributions in the field, as this has recently been
done elsewhere (Aidt, 2003; Jain, 2001; Tanzi, 1998; Bardhan, 1997). In order to prepare the
ground for the essays of the following chapters, the aim lies, rather, in identifying the major
lines of research by restricting the focus on some selected studies.
Two dimensions structure the present literature review: First, as in any field of economics,
the research into corruption can be divided between empirical contributions, which are re-
viewed in section 2.1, and theoretical contributions, which are reviewed in sections 2.2 and
2.3. Meanwhile theory produces models to portray certain aspects of reality from a particular
perspective, empirical approaches serve to test the models against the data. In the end, only a
match between theoretically underpinned relationships and empirical predictions yields com-
pelling explanations for corrupt patterns around the world. Thereby, neither theoretical nor
empirical research into corruption employs new economic methods or techniques. Rather,
studying corruption relies on applying existing economic thought and techniques to a new
field.
Secondly, studies differ between those looking at the causes and those investigating the
consequences of corruption. The complexity of the phenomenon corruption manifests in the
fact that, even within economic science, numerous points of view - or theories - have been
proposed in order to understand its causes and consequences. Therefore, both the empirical
and theoretical sections of this literature review reflect this for the economics of corruption
fundamental distinction between its causes and consequences.
All categorisations bear the risk of oversimplification meaning some research might not
fit perfectly into the scheme or may address issues that fall into several sections. Therefore,
some contributions will be referred to several times, however from a different perspective.
15

CHAPTER 2. LITERATURE REVIEW 16
2.1 Empirical Studies
In order to provide the basis for the following more theoretical sections, this section surveys
the empirical relationship between corruption and economic or social variables. Thereto,
some indices quantifying the extent of corruption around the world need looking at first.
Due to its clandestine character, which provides parties involved with every incentive to
disguise their misconduct, direct measures on the extent of corruption are notoriously unreli-
able. Ironically, a large number of reported cases could be a sign of rather clean institutions,
insofar as endemic corruption does not completely undermine prosecution. Moreover, cultural
differences and changes in social attitudes render a comparison between the extent of cor-
ruption across both countries and time difficult. Nevertheless, some indirect ways relying on
survey based techniques have been proposed in order to gauge the relative extent of bribery
and nepotism around the world. This has triggered a dramatic increase in the number of
empirical studies into the economics of corruption during the last decade. However, due to
the problems mentioned above, empirical data should be treated with some caution.
2.1.1 Measuring Corruption around the World
The lack of reliable data has long ruled out empirical studies into the economic nature of cor-
ruption (compare Ades and Di Tella, 1999, p.982). Indeed, Transparency International (TI)11
- the leading NGO in the combat against corruption - publishes its composite Corruption-
Perceptions-Index (CPI) on a yearly basis only since 1995. Based on a survey of surveys, the
CPI draws together the opinion of business people, country analysts, and local residents to
measure the degree to which corruption is perceived to exist among politicians and bureau-
crats. Surveys included regularly in the CPI are the:
(a) Global Competitiveness Report published by the World Economic Forum (Surveyed
Group: Senior Business Leaders).
(b) World Competitiveness Yearbook published by the Institute of Management Develop-
ment, IMD, Lausanne (Surveyed Group: Executives in top and middle management).
(c) Country Risk Service and Country Forecast published by the Economists Intelligence
Unit (Surveyed Group: Expert Staff).
(d) World Business Survey published by the World Bank (Surveyed Group: Senior Man-
agers).
Figure 2.1 maps the CPI for the year 2005 with more intensive red colours designating
countries with higher perceived levels of corruption.
The bulk of empirical studies draws on subjective perceptions rather than the objective
extend of corrupt exchanges (e.g. in terms of the number of transactions or the amount of

CHAPTER 2. LITERATURE REVIEW 17
Figure 2.1: Corruption around the World (2005)
Source: Transparency International (www.transparency.org)
economic resources involved). Due to the nature of survey based data, some caution needs
however applying. In particular, the CPI represents an ordinal ranking rather than cardinally
measured differences in the extent of corruption between country-pairs. Clearly, a doubling of
the CPI does by no means translate into a proportional change of corruption, but merely re-
flects the relative position of countries as regards the extent of bribery. Still, most subjective
measures are closely correlated, which suggests some reliability of survey based techniques
in picking up bribery (compare Lederman et al, 2005). Since a small number of reported
cases could be a sign of inefficient - or corrupt - institutions rather than ubiquitous hon-
esty, employing objective data instead could likewise be misleading (Ades and Di Tella, 1997,
p.985f.). Furthermore, the number of reported cases depends, among else, on the underlying
legal definition of corruption.12
Based on the well known causes and consequences of corruption, Dreher et al. (2004)
have extracted a corruption index as latent variable, which is embedded in a structural
model calibrated for the years 1990 - 1997. The resulting structural corruption index (CSI)
mitigates against ordinality insofar as it directly relates to cardinally measured causal and
consequential variables, albeit no meaningful interpretation can be attached to the index
score itself.

CHAPTER 2. LITERATURE REVIEW 18
2.1.2 Empirical Patterns
Within an econometric model, corruption may serve either as dependent variable to inves-
tigate its underlying causes, or as independent variable to look at its consequential impact
upon economic performance variables. Studies conducted thus far allow to sketch the follow-
ing empirical patterns.
Empirical Causes of Corruption
(a) Institutionalised accountability prevents corrupt conduct.
In respect to the relationship between corruption and institutional quality, Lederman
et. al. (2005) focus on political determinants. In general, they find that political
institutions matter in the sense of shaping the environment - especially the incentive
structure - in which relations between individuals and the government take place. In
particular, corruption tends to be substantially lower the more widespread institutions
fostering accountability in terms of democratic rule, parliamentary systems, political
stability, and the freedom of press.
Decentralisation constitutes an institutional component exhibiting somewhat ambiva-
lent effects onto corruption. On the one hand, Fisman and Gatti (2002) suggest a
strong negative relationship between fiscal decentralisation and bribery. On the other
hand, according to Treisman (2000) politically decentralised federations are perceived
to be more corrupt.
Restricting the focus on democracies, Persson et al. (2003) highlight the effect electoral
rules exhibit upon political corruption. Consistent with theory, voting on party lists
as well as increasing the barriers to entry by having relatively small electoral districts,
reduces the potential for voters to hold corrupt politicians accountable at the polls and
therefore increases the empirically observed level of bribery. Due to offsetting effects,
a switch from strictly proportional to a strictly majoritarian electoral system impacts
only slightly negative upon the extent of corruption.
(b) Cumbersome regulation tends to increase corruption.
Across 85 countries, Djankov et al. (2002) compare the official number of procedures
as well as the time and cost required to legally set up a business. They find that
countries with more burdensome regulation of entry have higher levels of perceived
corruption but no better quality in the provision of public goods. As regards opposing
motives underlying the regulation of entry, results support the public choice perspective,
where politicians and bureaucrats abuse their discretion to grab rents, rather than
implementing rules in the public interest.
CHAPTER 2. LITERATURE REVIEW 19
(c) Efficiency wages provide a way to tackle bureaucratic corruption.
Van Rijkeghem and Weder (1997) look at the effects of wages in bureaucracies. In
the empirical part of their study, a negative relationship between government wages
relative to manufacturing wages and corruption is found across developing countries,
which supports the hypothesis of efficiency wage models. This kind of reasoning can
however only be applied to bureaucratic bribery, where effort is compensated by earning
a regular wage. Conversely, wage considerations do not appear to lie at the core of
political corruption.
(d) Competitive markets erode rents and undermine the basis for corrupt conduct.
Likewise to political competition in elections, competition on product markets erodes
rents, decentralises power and thereby undermines the pillars, upon which endemic
corruption rests (see section 1.2). In particular, Ades and Di Tella (1999) find lower
levels of corruption in countries more open to international trade. In a similar vain,
OECD membership, which entails a strong commitment to market economy, relates
negatively to bribery and nepotism (Treisman, 2000).
(d) Countries with a high share of protestants suffer less from corruption.
As regards religions affiliation, a high share of Protestants relates negatively to cor-
ruption (e.g. Treisman, 2002; La Porta et al., 1999). Compared with other belief
systems, Protestantism arguably shapes a culture to challenge agents intrusted with
power through its relatively non-hierarchical (or decentralised) structure. Furthermore,
historically Protestants have developed a supportive attitude towards state institutions.
(e) Common law heritage secures property rights and thereby reduces corruption.
According to La Porta et al. (1999) countries with a French colonial heritage or French
civil law systems tend to have relatively less secure property rights. Conversely, common
law has evolved in England largely as a response against the attempts of the sovereign
to expropriate property owners. Empirically, there is indeed some evidence on common
law countries suffering less from corruption.
Empirical Consequences of Corruption
(f) Corruption slows down economic growth by discouraging investment.
Mauro (1995) provides the first empirical study into the relationship between corruption
and growth. Using an estimation technique robust to a possible simultaneity between
economic growth and corruption, suggests that economic growth is significantly and
negatively related to corruption. Likewise, endemic bribery impacts negatively upon
investment. Looking at cumulative effects, this translates into a negative relationship

CHAPTER 2. LITERATURE REVIEW 20
between the extend of corruption and income. Therefore, corruption is particularly
prevalent among relatively poor countries and decreases as a country becomes more
affluent. The causality between these effects is however difficult to establish, with
the question remaining whether countries are poor because they suffer from endemic
corruption or they suffer from endemic corruption because they are poor.
As regards investment, Wei (1997) finds a negative relationship between corruption and
foreign direct investment (FDI). Especially, in comparison to taxes corruption induces
further uncertainty, which arguably entails additional damage on economic welfare.
(g) Corruption is closely correlated with the size of the unofficial economy.
Friedman et al. (2000) find that both excessive regulation and endemic corruption
induce firms to move into the unofficial economy. Thereby, the impact from corruption
is far stronger than related effects from high tax rates meaning, the detrimental effects
of corruption surmount the effect of taxation by far.
2.2 Theoretical Causes of Corruption
Causal theories attempt to identify factors entailing differences in the extent of corruption
around the world. Thus far, approaches within the spirit of industrial organisation, economics
of crime, regulation, principal-agent problems, and self-enforcing effects have been considered
to give a framework, within which bribery may be analysed.
2.2.1 Industrial Organisation of Corruption
This theoretical approach rests on the idea of corruption being an exchange with government
representatives obtaining bribes in compensation for issuing undue rights and privileges.
Compared with ordinary market transactions, where property rights over goods and ser-
vices are exchanged, bribery infringes prevailing rules. Still, the way corrupt exchanges are
structured stands crucial in order to determine the equilibrium level of bribes. Due to the
similarities with the behaviour of firms in industries, this line of research has been termed the
”industrial organisation of corruption” (Shleifer and Vishny, 1993 or Ades and Di Tella, 1999).
Similar to industrial organisation, this literature emphasises the effects competition among
bureaucrats, politicians, or firms exhibits on equilibrium prices, respectively bribes. Com-
petition tends to decentralise power and erode rents. Since bribery requires discretionary
power and economic rents to coexist, the idea of competition being able to kill corruption
has already been pointed out in early studies (Rose-Ackerman, 1978, p.12).

CHAPTER 2. LITERATURE REVIEW 21
A more rigorous treatment of this can be found in Bliss and Di Tella (1997), who consider a
model with a bureaucrat exerting monopoly power by issuing licences, which permit firms to
operate legally. The number of firms is determined endogenously by a zero-profit-condition.
Furthermore, firms are differentiated in respect to their cost structure giving raise to eco-
nomic rents,13 with bureaucrats unable to observe this heterogeneity. Then, monopolistic
bureaucrats face a tradeoff between increasing bribes-rates and the risk of corrupting firms
into bankruptcy due to the associated increase in fixed cost. Briefly, meanwhile imposing
bribes, bureaucrats reduce the number of firms and thereby contract the size of their bribe-
base.
Formally, this can be represented as follows: A cumulative distribution function (CDF)
over the profit-bribe margin determines the endogenous number of firms, n = Φ(π − b),
which can operate profitably on the market. Thereby, b represents the bribe-rate and π
denotes profits. The CDF exhibits the usual properties (Φ(0) = 0,Φ(∞) = 1). Monopolistic
bureaucrats maximise
r = bΦ(π − b) (2.1)
giving rise to the first order condition,
∂r
∂b= Φ(π − b)− bΦ′(π − b) != 0 (2.2)
and optimality condition:
b =Φ(π − b)Φ′(π − b)
=Φ(π − b)φ(π − b)
(2.3)
Here, φ denotes the probability density function (PDF) over the profit-bribe margin and,
provided second order conditions are met, monopolistic bureaucrats set bribes (b) such that
a marginal increase equals the probability to induce the marginal firm to exit the market
(Φ(π − b)/φ(π − b)).
The degree of competition can be altered e.g. by exogenously lowering profits across
firms, making cost more similar, or changing the overhead cost. To see this, introduce
an exogenously imposed competition parameter, α, affecting profits (π(α)) with πα < 0.
Substituting (π(α)) into (2.2) and applying the implicit function theorem yields:
bα =Φ(π(α)− b)πα
−Φ(π(α)− b)− φ(π(α)− b) + bφb(π(α)− b)<>0 (2.4)
This expression can be positive or negative since the numerator is always negative but the
denominator can be positive or negative (compare Ades and Di Tella, 1997, pp.1013ff.). The
logic behind this ambiguity lies in competition decreasing rents available for diversion into

CHAPTER 2. LITERATURE REVIEW 22
bureaucrats pockets but also shifting the marginal firm into a region, where it is less likely
that increased bribes push firms out of business.
A similar result features in Ades and Di Tella (1999) with bureaucrats now inspecting
firms’ profits for taxation purposes. Then again, the relationship between competition and
corruption is ambiguous, as less fierce competition creates more rents, which conversely makes
it more valuable for the public to strictly control bureaucrats. Yet, empirically a negative
relationship between competition and corruption prevails (see section 2.1).
Shleifer and Vishny (1993) turn to the competitive conditions among bureaucrats. They
highlight the fact that entry may require firms to obtain several, complementary licences,
which introduces strategic considerations among bribees. Within this context, a government-
structure with several, uncoordinated, or decentralised authorities could induce more bribery
than one with a coordinating central authority. This result is a consequence of vertical
externalities involved in the former, which feature prominently in industrial organisation
under the term ”double marginalisation”.
To illustrate, revisit the previously discussed licensing model14 consisting now of two
bureaucrats jointly imposing bribe-rates b, respectively B, meanwhile inspecting firms. Then,
the endogenous number of firms, which profitably operate on the market, conditions on two
bribe-rates, meaning n(b + B) with nb(b + B) < 0 and nB(b + B) < 0. Each bureaucrat
maximises his individual bribe-revenue r = bn(b + B), respectively R = Bn(b + B), with
optimality condition:
n(b + B) + bnb(b + B) != 0 (2.5)
n(b + B) + BnB(b + B) != 0 (2.6)
Provided both bureaucrats hold Nash-conjectures, these conditions jointly determine the
equilibrium bribe-rates b∗ and B∗. By cooperatively reducing B∗, bureaucrats can achieve a
Pareto improvement. To see this, denote the equilibrium revenue of the second bureaucrat
by
R(b∗, B∗) = B∗n(b∗ + B∗) (2.7)
to find that:
RB = db∗(db∗ + dB∗) + b∗n′(db∗ + dB∗) (2.8)
Due to the envelope theorem db∗ = 0 and (2.8) reduces to:
RB = b∗n′dB∗ > 0 with dB∗ < 0 (2.9)

CHAPTER 2. LITERATURE REVIEW 23
Not taking into account the effects inflicted upon the other bureaucrat gives rise to vertical
externalities and in turn inefficiently high bribe-rates. Intuitively, this result states that
bribing several bureaucrats could be more costly and distorting than simply bribing one
central, although more powerful authority.15
2.2.2 Corruption as a Crime
Corrupt exchanges frequently result in decisions against the public interest and undermine
the credibility of government. Therefore, bribery is almost always illegal under the law
and punished if discovered. In essence, a tradeoff familiar from economics on crime and
punishment16 emerges, which relates benefits, in terms of bribes, with cost, in terms of the
probability of apprehension as well as the severity of the verdict. The following participation
constraint facing the bribe-taker represents this tradeoff in a concise manner:
(1− q)u(b + w) + qu(wo − s(b)) < u(w) (2.10)
with:
b : Bribe-rate.
w : Wage of a bureaucrat.
w0 : Wage in the private sector (outside option).
u() : Utility as a function of legal (w) and illegal (b) income.
q : Probability of apprehension.
s(b) : Sentence as a function of bribe-rates.
Hence, a bureaucrat is only willing to abstain from corrupt conduct when the utility she
gets from receiving her wage for sure outweighs the expected utility of engaging in bribery.
Therefore, monitoring, q, and penalising, s(b), provide ways to deter corrupt conduct.
Devoting more resources in order to increase the probability of apprehension does not
necessarily bring about lower levels of bribery. Rose-Ackerman (1975) demonstrates how
designing the monitoring and penalty system stands crucial in effectively combatting corrupt
exchanges. To illustrate this, consider a simplified participation constraint with a linear
utility function and bureaucratic wages normalised to zero, that is u(b + w) = b. Making the
bureaucrat indifferent about accepting or refusing to engage in bribery, implicitly imposes an
upper bound on acceptable bribe-rates for the bribe-taker:
(1− q)b + q(wo − s(b)) = 0 ≡ F (q, b) (2.11)
The impact of increasing resources to deter corruption can be established by deriving (2.11)
with respect to the probability of apprehension (q). Applying the implicit function theorem
yields:

CHAPTER 2. LITERATURE REVIEW 24
∂b
∂q= −Fq
Fb= − wo − b− s(b)
1− q − qs′(p)!= 0 (2.12)
Under a linear utility function, the officials’ preferences exhibit risk neutrality implying that
in an extremum expected bribes (b) equal the expected penalty (s(b)) relative to the outside
option (wo).
The second order condition is given by:
∂2b
∂q2=
(Fqb)[1− q − qs′(b)] + [wo − b− s(b)](Fbq + Fbb)[−1 + q + qs′(b)]2
<>0 (2.13)
If (1 − q − qs′(b)) < 0 and hence ∂2b/∂q2 < 0 (assuming Fqb > 0) acceptable bribe-rates
reach a maximum when wo − s(b) = b. In this case, acceptable bribes are constrained by
the penalty system and can, in principle, be pushed towards zero by designing an efficient
enforcement system. Conversely, when (1− q− qs′(b)) > 0 and hence ∂2b/∂q2 > 0 (assuming
Fqb > 0) maximal feasible bribe-rates reach a minimum when wo − s(b) = b. Ill-designing
the penalty system could then induce bribe-takers to impose very high (theoretically even
infinite) bribes-rates. The latter is clearly not feasible as the resources of an economy are
finite. ”Instead we should understand this case simply as one in which the legal sanctions
themselves do not determine the solution” (Rose-Ackerman, 1975, p.194).
Kugler et. al. (2003) consider interactions among ”mafias” engaging simultaneously in
crime and corruption. In particular, ”mafias” compete on the crime market over booties
whereas, if caught, on the corruption market they can bribe their way out of punishment.
Criminal activities are as usual deterred by paying high compensations to law enforcers
(efficiency wages), severe punishments, and a high probability of being caught (monitoring).
However, Kugler et al. (2003) emphasise the complementarity character between criminal
and corrupt activities implying, under low bribing cost, policing to be ineffective as criminal
organisations might react cynically via paying higher kickbacks.
2.2.3 Regulatory and Principal-Agent Approaches
The predominant normative rationale for economic policies lies in the desire to correct market
failure, especially as regards public goods provision and dealing with externalities. However,
any government intervention creates net-losers alongside net-beneficiaries meaning regulation
tends to shift rents among often clearly defined parties. These may include government rep-
resentatives like political parties or the bureaucracy themselves. Consequently, some kind of
power needs to be exercised, in order to ensure that net-losers will comply with the adopted
policies regardless. Therefore, meanwhile enacting, executing, and enforcing rules any gov-
ernment acts in a position of principal, who must hire agents, e.g. a bureaucracy, in order
to implement adopted rules. By virtue of their superior information, the conduct of bureaus

CHAPTER 2. LITERATURE REVIEW 25
cannot be monitored in a perfect manner. Government intervention requiring a bureaucracy
with sometimes substantial discretionary power over allocating rents, creates, then, inevitably
incentives for abusing delegated public power for private benefit. Thus, correcting market
failure entails almost always government failure to some degree (Acemoglu and Verdier, 2000).
Thereby, the following focuses on the process how a regulation is adopted and implemented,
rather than discussing its welfare consequences.
Distinguishing a scenario with a benevolent principal, which always acts in the public
interest, from a malevolent principal, which only cares about his private benefit, stands
crucial within a principle-agent context. More colorfully, Frye and Shleifer (1996) label a
scenario where authorities act in the public interest by restricting themselves to provide
public goods, with the invisible hand, whereas the helping hand refers to a scenario where
only some parties, respectively industries, manage to receive government support. In the for
the public welfare worst case of the grabbing hand, the rationale for government intervention
into the economy lies exclusively in benefitting politicians and bureaucrats themselves.
Benevolent Principal
Suppose a benevolent (respectively invisible hand) political elite is confronted with a principal-
agent problem insofar as facing a cynical bureaucracy deviating from the Weberian ideal.17
Acemoglu and Verdier (2000, p.194) state the underlying assumptions in a concise manner:
(a) Government intervention requires the use of agents (”bureaucrats” [...]) to collect in-
formation, make decisions, and implement policies.
(b) These bureaucrats are self-interested and by virtue of their superior information, hard
to monitor perfectly.
This setting implies that government intervention, even if desired in terms of bringing
about (potential) welfare improvement, creates incentives for cynical bureaucrats to behave
opportunistically and engage in corruption. The consequences of such behaviour are a possible
misallocation of resources, with e.g. an oversized public sector.
Within this context, Acemoglu and Verdier (1998) consider governments enforcing oth-
erwise incomplete contracts in order to protect the property rights of investors. Upholding
property rights benefits property owners, which can lead bureaucrats into the temptation to
extract bribes in order to obtain a part of the resulting economic rent. Corruption can be
prevented by paying efficiency wages, which in turn imposes an additional cost upon soci-
ety and entails a misallocation of resources in the sense of the public sector attracting too
much skilled labour. Therefore, a corruption-free economy might be neither desirable nor
achievable and heterogenous countries, in terms of preferences or wealth, could, thus, opt for
CHAPTER 2. LITERATURE REVIEW 26
different levels of corruption.
Aside from employing the legal system (penalties, monitoring), a benevolent political elite
confronted with a cynical bureaucracy could engage in designing optimal contracts, e.g. by
paying efficiency wages. Participation constraints on whether or not to accept kickbacks imply
that higher wages increase the opportunity cost for dismissal and thereby act as deterrent for
misconduct. Referring back to (2.11) and disregarding the penalty system (s(b) = 0), such
efficiency wages equal:
we = w0 +1− q
qb (2.14)
Hence, the wage deterring misconduct relates to the outside wage (w0) and a markup on the
equilibrium bribe-rate (b) as a function of the effectiveness of the monitoring system (q).
Other studies employing an efficiency wage setting include optimal compensation policies
for corruptible tax inspectors (Besley and McLaren, 1993) and inspectors monitoring pollution
from factories (Mookherjee and Png, 1995).
Non-Benevolent Principal
On top of facing a cynical bureaucracy, the political elite could itself be subject to Leviathan
behaviour. The irony that even monitoring can in principle be corrupted gives rise to the
famous rhetorical question of ”who shall guard the guardians?”. In particular, the political
elite could take advantage of its position to design institutions facilitating self-enrichment
and rent-seeking. This may result in highly dysfunctional institutions. Section 2.2.1 about
the industrial organisation of corruption, contains an example of such ill-designed institutions
where decision-makers employ an otherwise useless licensing-scheme, in order to maximise
their bribe-income (Bliss and Di Tella, 1997; Shleifer and Vishny, 1993).
Ades and Di Tella (1997) present a model, where private cost-reducing research exhibits a
positive externality onto a socially desirable stock of knowledge. Then, aligning private with
public objectives necessitates paying ex-ante subsidies towards firms creating technological
externalities. However, benefits arising from such successful industrial policy could simply be
distorted away by a corresponding increase in corruption. In particular, government officials
could introduce ex-post regulations to confiscate rents that resulted from previous investment
in cost-reducing activities giving rise to a hold-up problem between the private and the public
sector within the spirit of Williamson (1975).
Within the non-benevolent scenario, the conduct of the bureaucracy does not become
irrelevant. Given the Leviathan behaviour of the political elite, a corrupt bureaucracy could

CHAPTER 2. LITERATURE REVIEW 27
even enhance welfare by providing ways to bypass misguided rules, in the sense of:
[...] The only thing worse than a society with a rigid, over-centralised, dishonest
bureaucracy is one with a rigid, over-centralised, honest bureaucracy. (Huntington
S.P. quoted in Bardhan, 1997, p.1322).
Leff (1964) suggests that graft may constitute an efficient response towards government
failure since:
(a) Corruption could speed up the bureaucratic process and reduce red tape.
(b) Corruption introduces some competition over government funds, which may lead to a
more efficient usage of scarce resources.
A more rigorous analysis can be found in Lui (1985), who draws up a queuing model,
where speed-money allows payers to be fast-tracked as well as Beck and Maher (1986), who
model corruption in terms of an auction over licences. In both, the queuing and the auction
model, bribery can serve as a revelation mechanism that allows to allocate rights to those
valuing them most.
The context of these models is however not without criticism (compare Aidt, 2003 , p.634):
(a) Second Best :
”Efficient” corruption is necessarily second best, with the first best solution being to
remove the distortion as stated by Mookherjee and Png (1995, p.146): ”It is easy to
wipe out corruption - the regulator needs only to abandon enforcement.”
(b) Transaction Cost :
As a consequence of its clandestine character, resources will always be wasted to disguise
corrupt exchanges.
(c) Loss of Credibility :
Adopting a dynamic perspective, bribery might undermine the credibility of decision
makers in the long-term. Consequently, rules enhancing public welfare cannot be im-
plemented as, ex-ante, they are expected to be corrupted down.
2.2.4 Self-Enforcing Corruption
For self-enforcing effects to occur, the benefits of corrupt conduct must relate to the pro-
portion of society involved in misconduct. In particular, the benefits and cost accruing form
bribery depend crucially on how endemic corruption is (compare Aidt, 2003, p.647). For
instance:

CHAPTER 2. LITERATURE REVIEW 28
(a) Benefits:
Rent-seeking could be more profitable than engaging in productive activities the more
widespread the former (Acemoglu, 1995).
(b) Cost:
In societies where corruption is more endemic, it might be easier to bribe oneself out
of punishment. Furthermore, the moral cost attached to accepting kickbacks might be
lower, when bribery is more ubiquitous.
Within a dynamic setting, history may determine the extent of corruption to a substantial
degree. Such history dependence implies that societies starting-off under comparable con-
ditions can end up with quite different levels of corruption. Technically speaking, a setting
with multiple equilibria emerges.
To see this, revisit the participation constraint (2.11), which involves a tradeoff between
accepting a bribe and the probability of apprehension as well as the severity of punishment.
However, should a bureaucrat be arrested, he can now escape conviction by passing a bribe
should the judge in charge of his case likewise be willing to engage in misconduct. For
simplicity, dishonesty is assumed to be equally widespread among agents and judges as sum-
marised by the proportion γ. Finally, bureaucrats accepting bribes suffer from a moral cost
(c(γ)), which declines the more endemic corruption is (∂c/∂γ < 0). Then, the participation
constraint (2.11) to engage in bribery becomes
(1− q)(b + w) + q(wo − (1− γ)(s(b))− c(γ)) = w (2.15)
As pointed out by Andevig (1991), a condition like (2.15) exhibits frequency dependent equi-
libria. In particular, figure 2.2 depicts the mapping between the revenue and the proportion,
γ, of corrupt bureaucrats under honest (H) and a dishonest (D) behaviour.
There are three equilibria A, B, and C with only the former two being stable. In par-
ticular, a society with a fairly honest (γ < γC) corps of bureaucrats will enjoy a low level
of corruption whereas a society starting-off with only slightly more widespread cynical be-
haviour (γ > γC), will end up in a corrupt slump.
In a more versatile model, Tirole (1996) attributes the persistence of corruption in a soci-
ety to group reputation. Bureaucrats reputation depends on their past behaviour but, due to
incomplete information, also on the past behaviour of the entire bureaucratic corps. There-
fore, incentives facing new bureaucrats depend crucially on the merits and sins committed by
their elders. In other words, individual and collective reputation might interact, with society
possibly being trapped within a hysteresis of corruption, where misconduct itself provides
the main driving force producing more misconduct.

CHAPTER 2. LITERATURE REVIEW 29
Figure 2.2: Multiple Equilibria in Corruption
H (honest)
D (dishonest)
Revenue Revenue
Share of Corrupt Agents (γ) 0 1 γc
B
C
A
PDF created with pdfFactory trial version www.pdffactory.com
2.3 Theoretical Consequences of Corruption
Studies into the consequences are concerned with the theoretical knock-on effects of corrupt
exchanges onto the economy. The literature has looked at the consequences foremost in terms
of the detrimental impact bribery exhibits upon economic growth and investment as well as
distortionary effects akin to taxation.
2.3.1 Growth and Investment
In a model with endogenous growth, Ehrlich and Lui (1999) consider an economy where
agents can either invest in the accumulation of growth enhancing human capital or socially
unproductive political capital. Agents consumption depends not only on their income but
also on their political capital enabling to divert resources into their own pockets. Conse-
quently, any increase in the size of government, reflected by the accumulation of political
capital, typically lowers economic growth as less investment occurs in production enhancing
human capital. The weakness of this model lies in the limited scope for government activities,
with any productive rationale of the public domain, e.g. by providing public goods or correct-
ing market failure, being assumed away. However, the model correctly predicts decreasing
corruption with increasing income per capita.
CHAPTER 2. LITERATURE REVIEW 30
Focusing on the relationship between rent-seeking bureaucracies and their political au-
thority, Sarte (1997) takes into account that the government might provide public goods
to enhance private production. Nevertheless, corrupt activities can be pursued, since the
bureaucracy maximises its discretionary budget, rather than providing public goods at an
efficient level. Such misconduct can be combatted by strengthening monitoring. Again, less
developed economies might end up in a vicious cycle where high cost to monitor an unpro-
ductive bureaucracy prevent economic growth.
Aside from allowing for productive government investment in infrastructure, Ventelou
(2002) introduces dynamic aspects into a growth model, where politicians can engage in
corruption at the expense of harming their reputation. Politicians in power decide between
”taking the money and run” or investing in their reputation. This approach suggests that
institutions play a major role in combatting corruption.
2.3.2 Corruption as a Tax
As long as government representatives are involved, corruption like taxation transfers rents
towards the public sector. Hence, some studies have addressed the distortionary impact of
corruption onto the private sector within the spirit of taxation theory. Although compulsory,
taxes are collected respecting the rules and customs for the sake of securing public expendi-
ture. Conversely, corrupt activities by definition involve the breaking of the rules in order to
seek self-enrichment. Unlike taxation, corruption could indeed be seen as theft by govern-
ment representatives. Noteworthy, in authoritarian regimes, the distinction between bribes
and taxes collapses as by definition the sovereign constitutes the government implying ”the
treasury becomes indistinguishable from the sovereigns pocket” (Shleifer and Vishny, 1993,
p.605). However, in terms of welfare, corruption seems to be more distortionary than taxes
due to its lack of transparency and arbitrariness induced uncertainty. Apart from transaction
cost considerations, the demand for secrecy could shift resources away from highly productive
investments towards unproductive projects ending up as white-elephants. Wei (1997) tests
this hypothesis finding that the second moment of a corruption index (uncertainty) to impact
negatively upon the flow of foreign direct investment.

NOTES 31
Notes
11See www.transparency.org.12Objective data on the reported number of cases involving corruption can be found e.g. in the United
Nations Survey on Crime Trends and the Operation of Criminal Justice Systems (see www.uncjin.org). Con-
trary to economic priors (Abed and Davoodi, 2000), the number of reported cases on bribery typically falls in
economies in transition. Rather than being a genuine decline in corruption, this could equally reflect a decline
in institutional quality and monitoring.13Under the Chicago School of industrial organisation, such a licensing scheme could be interpreted as
bureaucrats imposing sunk cost on firms and thereby preventing markets from being perfectly contestable.
Hence, regulation of entry (licensing) lies at the very heart of imperfect competition, creating rents that can
be diverted into bureaucrats pockets.14See also Aidt (2003), who assumes that, instead of bribe-rates, bureaucrats set the number of licenses as
strategic variable.15A corresponding reasoning applies to a small but coordinated cut in b.16See Posner (1986) for an overview of crime and economics.17The Weberian ideal type of bureaucracy is characterised by qualities like precision, control, responsibility,
regularity, and certainty (see Gerth and Mills, 1991).

Bibliography
[1] Abed, G.T. and Davoodi, H.R. (2000), ’Corruption, Structural Reforms, and Economic
Performance in Transition Economies’, IMF Working Paper, no.132.
[2] Acemoglu, D. (1995), ’Reward structures and the allocation of talent’, European Eco-
nomic Review, vol.30, pp.17-33.
[3] Acemoglu, D. and Verdier, T. (1998), ’Property rights, Corruption and the Allocation of
Talent, a General Equilibrium Approach’. The Economic Journal, vol.108, pp.1381-1403.
[4] Acemoglu, D. and Verdier, T. (2000), ’The Choice between Market Failures and Cor-
ruption’, The American Economic Review, vol.90, pp.194-211.
[5] Ades, A. and Di Tella, R. (1997), ’National Champions and Corruption: Some unpleasant
interventionist Arithmetic’, The Economic Journal, vol.107, pp.1023-1042.
[6] Ades, A. and Di Tella, R. (1999), ’Rents, Competition, and Corruption’, The American
Economic Review, vol.89, pp.982-993.
[7] Aidt T.S. (2003), ’Economic analysis of Corruption: A Survey’, The Economic Journal,
vol.113, pp.632-652.
[8] Andevig, J.C. (1991), ’The economics of corruption: a survey’, Studi Economici, vol.43,
pp.57-94.
[9] Bardhan, P. (1997), ’Corruption and Development: A Review of Issues’, Journal of
Economic Literature, vol. 35, pp.1320-1346.
[10] Beck, P. and Maher, M.V. (1986), ’A comparison of bribery and bidding in thin markets’,
Economic Letters, vol.20, pp.1-5.
[11] Becker, G. (1968), ’Crime and punishment: an economic approach’, Journal of Political
Economy, vol.76, pp169-217.
[12] Becker, G. and Stigler, G. (1974), ’Law enforcement, malfaisance and compensation of
enforcers’, Journal of Legal Studies, vol.3. pp.1-19.
32

BIBLIOGRAPHY 33
[13] Besley, T. and McLaren, J. (1993), ’Taxes and Bribery: The Role of Wage Incentives’,
The Economic Journal, vol.103, pp.119-141.
[14] Bliss, C. and Di Tella, R. (1997), ’Does Competition Kill Corruption?’, Journal of Po-
litical Economy, vol.105, pp.1001-1023.
[15] Djankov, S., La Porta, R., Lopez-de-Silanes, F. and Shleifer, A. (2002), ’The Regulation
of Entry’, Quarterly Journal of Economics, vol.117, pp.1-37.
[16] Dreher, A., Kotsogiannis, C. and McCorriston, S. (2004), ’Corruption around the World:
Evidence from a Structural Model’, Mimeo, University of Exeter.
[17] Ehrlich, I. and Lui, F.T. (1999), ’Bureaucratic Corruption and Endogenous Economic
Growth’, Journal of Political Economy, vol.107, pp.270-293.
[18] Fisman, R. and Gatti, R. (2000), ’Decentralisation and Corruption: Evidence Across
Countries’, World Bank.
[19] Friedman, E., Johnson, S., Kaufman, D. and Zoido-Lobaton, P. (2000), ’Dodging the
grabbing hand: the determinants of unofficial activity in 69 countries’, Journal of Public
Economics, vol.76, pp.459-493.
[20] Frye, T. and Shleifer, A. (1996), ’The invisible hand and the grabbing hand’, NBER
Working Paper, No.5856.
[21] Gerth, H.H. and Mills, C.W. (1991), From Max Weber essays in sociology, London,
Routledge.
[22] Jain, A.K. (2001), ’Corruption: A Review’, Journal of Economic Surveys, vol.15, pp.71-
121.
[23] Kugler, M., Verdier, T. and Zenou, Y. (2003), ’Organized Crime, Corruption and Pun-
ishment’, CEPR Discussion Paper, No. 3806.
[24] Lederman, D., Loayza, N. and Reis Soares, R. (2005), ’Accountability and Corruption -
Political Institutions Matter’, Economics and Politics, vol. 17, pp.1-35.
[25] Leff, N. (1964), ’Economic development through bureaucratic corruption’, American
Behavioral Scientist, vol.8, pp.8-14.
[26] Lui, F.T. (1985), ’An Equilibrium Queuing Model of Bribery’, Journal of Political Econ-
omy, vol.93, pp.760-781.
[27] Mauro, P. (1995), ’Corruption and Growth’, Quarterly Journal of Economics, vol.105,
pp.681-712.

BIBLIOGRAPHY 34
[28] Mookherjee, D. and Png, I.P.I. (1995), ’Corruptible Law Enforcers: How Should they
be Compensated?’, The Economic Journal, vol.105, pp.145-159.
[29] Persson, T, Tabellini, G. and Trebbi, F. (2003), ’Electoral Rules and Corruption’, Jour-
nal of the European Economic Association, 1, pp.958-989.
[30] Posner, R.A. (1977), The economic analysis of law, Boston, Little Brown.
[31] Rose-Ackerman, S. (1975), ’The Economics of Corruption’, Journal of Public Economics,
vol.4, pp.187-203.
[32] Rose-Ackerman, S. (1978), Corruption - a study in political economy, New York, London
Academic Press.
[33] Sarte, P.D.G. (2001), ’Rent-seeking bureaucracies and oversight in a simple growth
model’, Journal of Economic Dynamics and Control, vol.26, pp.1345-1365.
[34] Stigler, G.J. (1970), ’The Optimum Enfocement of Laws’, The Journal of Political Econ-
omy, vol.78, pp.526-536.
[35] Shleifer, A. and Vishny, R.W. (1993), ’Corruption’, Quarterly Journal of Economics,
vol.108, pp.599-617.
[36] Tanzi, V. (1998), ’Corruption Around the World - Causes, Consequences, Scope, and
Cures’, IMF Staff Papers, vol.45, pp.559-594.
[37] Tirole, J. (1996), ’A Theory of Collective Reputations (with applications to the per-
sistence of corruption and to firm quality)’, The Review of Economic Studies, vol.63,
pp.1-22.
[38] Treisman, D. (2000), ’The causes of corruption: a cross-national study’, Journal of Public
Economics, 76, PP.399-457.
[39] Van Rijkeghem, C. and Weder, B. (2001), ’Bureaucratic corruption and the rate of
temptation: do wages in the civil service affect corruption, and by how much?’, Journal
of Development Economics, vol.65, pp.307-331.
[40] Ventelou, B. (2002), ’Corruption in a model of growth: Political reputation, competition
and shocks’, Public Choice, vol.110, pp.23-40.
[41] Wei, S.J. (1997), ’Why is corruption so much more taxing than tax? Arbitrariness kills’,
NBER Working Paper 6255.
[42] Williamson, O. (1975), Market and Hyrarchies: Analysis and Anti Trust Implications,
New York, Free Press.

Part II
Essays
35

Chapter 3
FIRST ESSAY
Federalism, Competition, and
Corruption
The first essay investigates the theoretical relationship between federal structures of govern-
ment and corruption.
From an economic perspective, corruption means that agents entrusted with a public po-
sition abuse their discretionary power to secure rents in a reciprocal exchange with issuing
unlawful privileges towards the bribe-payer. Such government failure involves, furthermore, a
bribe-taker acting as an agent on behalf of a principal, with corruption implying opportunistic
misconduct to the extent that self-interests has been placed ahead of common-interest. The
theoretical literature on corruption can broadly be categorised according to the objectives of
the principal:18 A benevolent principle (government or social planner) necessitating a self-
interested agent, e.g. a corrupt bureaucracy, in order to implement adopted policies provides
the theoretical framework to carry out normative analysis. Proposed measures to align the
interests of the principle and the agent include paying efficiency wages (Besley and McLaren,
1993; Mookherjee and Png, 1995; Ades and Di Tella, 2000) or using legal remedies (Rose-
Ackerman, 1975). Conversely, the premise that all trusties of power - including the principle
- are corruptible underlies the positive approach to analyse bribery, which allows comparing
the capability of various predetermined institutional arrangements to combat corruption (e.g.
Shleifer and Vishny, 1993). Thereby, electoral monitoring (Ferejohn, 1986), the separation of
powers (Persson et al., 1997), as well as fiscal decentralisation (Arikan, 2004; Hendriks and
Lockwood, 2005) have been identified as possible institutions constraining corrupt abuses.
Within the institutional context, the theoretical implications of federalism have been ne-
glected. Opposed to central governance, decentralising political power according to the federal
principle entails horizonal and vertical interdependencies across jurisdictions and tiers, which
36

CHAPTER 3. FEDERALISM AND CORRUPTION - THEORY 37
give rise to ”externalities”. Since graft is exchanged in a clandestine manner and therefore
lacks the protection of well defined and enforceable property rights, the extent of corruption
in one jurisdiction could affect other jurisdictions and tiers, without compensation occurring
through a transfer system like the market. Within a corrupt federation, horizontal externali-
ties rest on the size of the economy exceeding the size of jurisdictions, which entails spillovers,
e.g. when differences in the extent of bribery entail a relocation of (footloose) economic ac-
tivities. As regards vertical externalities, federalism implies ex-definitionae that the economy
is regulated upon by at least two distinct governments, which makes duplications of govern-
ment activities, including bribe-taking, unavoidable in practice. Thus, competition among
government representatives seeking self-enrichment gives rise to interdependence insofar as
extracting bribes in one jurisdiction affects - positively or negatively - the rents at disposition
of the federal tier or rival jurisdictions.
Previous papers have addressed some aspects inherent in the mapping of federalism onto
corruption. Especially, in an early study, Rose-Ackerman (1978, ch.6) provides a rationale for
horizontal competition among government representatives to reduce corruption when citizens
shift economic activities away from jurisdictions affected by endemic bribery. In essence, de-
centralising bureaucratic power undermines the basis for bureaucratic misconduct.19 Shleifer
and Vishny (1993) show that several authorities with overlapping responsibilities - like the
federal and state tiers - regulating the same economy in an uncoordinated manner entail a
potential for corrupt overgrasing.20 Furthermore, Bliss and Di Tella (1997) as well as Ades
and Di Tella (1997, 1999) investigate the impact of competition on private markets onto the
extent of corruption finding an ambiguous theoretical relationship, albeit empirically fiercer
competition seems to erode rents and hence reduce corruption. Meanwhile assessing the capa-
bility of federalism to constrain government misconduct, the focus shifts towards competition
and the corresponding externalities within the pubic rather than the private domain. How-
ever, Acemoglu and Verdier (2000) consider possible interdependencies between government
failure and market failure. In particular, any government intervention aimed at correcting
market failure creates rents, which are asymmetrically distributed across parties and therefore
might induce politicians or bureaucrats to behave cynically in terms of capturing their share
of rent via extracting bribes. Constraining such government failure, e.g. via strengthening
monitoring or designing incentive schemes, is costly, implying that there is a tradeoff between
correcting market failure and reducing government failure in terms of corruption.
Bribery resembles taxation to the extent that the public sector levies a cost-burden upon
firms, which entails similar incidences and distortionary effects. Consequently, the present
analysis bears some similarities with the literature on tax competition in federations (Keen
and Kotsogiannis, 2002, 2003, 2004). Yet, bribing constitutes a pure transfer lacking the
potential of taxation to enhance welfare via the provision of public goods. Moreover, bribery
typically impairs prevailing rules and participation in such illegal conduct occurs voluntarily.

CHAPTER 3. FEDERALISM AND CORRUPTION - THEORY 38
Hence, opposed to compulsory taxation, individual rationality requires corrupt exchanges to
remain mutually beneficial in order to satisfy certain participation constraints, which shape
the attitude of government representatives towards self-interest and social-interest.21 Mean-
while, the antagonism between the benevolent social planner (Keen and Kotsogiannis, 2004)
and the malevolent Leviathan (Keen and Kotsogiannis, 2003), familiar from the analysis of
federal tax competition, can be overcome when considering corrupt exchanges with underly-
ing participation constraints instead.
The contributions of the present essay lie in drawing together the institutional features
and establish the theoretical mapping between federalism and corruption. Opposed to the
investigation of Shleifer and Vishny (1993) into corrupt overgrasing and Arikan (2004) into
fiscal decentralisation and corruption, the analysis of corrupt federations must include both
vertical and horizontal dimensions of government. Furthermore, similar approaches in the
literature on tax competition (Keen and Kotsogiannis, 2002, 2003, 2004) are improved upon
by considering the different welfare implications of corruption and, more importantly, taking
into account the voluntary character of bribe exchanges. Like this, the present approach de-
viates from previous work by endogenising the structure in terms of the number of firms the
private sector can support and the number of government representatives willing to engage in
acts of bribery. Participation in corruption relates explicitly to the constraints and incentives
of extracting, respectively paying, a bribe. To my knowledge participation constraints have
not yet been considered in analysing taxation or corruption in federations.
I find federalism to impact upon corruption in a complex manner:
• Firstly, endemic bribery can be combatted not only by horizontal competition among
firms, which reduces rents there to be grabbed by officials, but also among jurisdictions,
which decentralises public power and thereby undermines a pillar upon which corruption
- defined as an abuse of public power for private benefit - rests.
• Secondly, in federations vertical competition across tiers entails a potential for corrupt
overgrasing, which mitigates against the benefits of interjurisdictional competition.
• Thirdly, federalism may prevent corrupt overgrasing when clear spheres of responsibility
- e.g. a consensus about the distribution of power - provide one tier with a first-mover
advantage.
• Finally, bribery involves a voluntary, albeit illegal, transfer and participation is subject
to a tradeoff between the perceived probability of apprehension and the benefits from
obtaining a kickback. Higher bribe-rates therefore tempt more officials into corruption
but entail an economic cost in terms of a reduced number of firms the market can sup-
CHAPTER 3. FEDERALISM AND CORRUPTION - THEORY 39
port. When conditions for participating in bribery differ substantially across jurisdic-
tions, federalism allows that states with effective monitoring and governed by motivated
politicians, respectively bureaucrats, remain free of corruption. Conversely, centralis-
ing power in order to combat bribery more effectively (Shleifer and Vishny, 1993) is
only successful when incentives and monitoring prevent opportunistic behaviour on the
central tier.
The remainder is organised as follows: Section 3.1 lays out the structure and timing of
the model followed by section 3.2, which details the participation decision officials and firms
take as well as section 3.3 describing the behaviour of corrupt Leviathans. Sections 3.4 and
3.5 constitute the core of the essay presenting the mapping of unitarian respectively federal
governance onto equilibrium bribe-rates and rents. Finally, the last sections contain some
comparative considerations and concluding remarks.
3.1 Structure and Timing
The economy is regulated by one supreme or federal unit - the variables pertaining to this
denoted by capital letters - divided into identical lower-tiered jurisdictions or states indexed
by superscripts s = 1 . . .M , each of which contains up to ns firms indexed by superscripts
i = 1 . . . ns. The total number of firms in the federation equals N ≡∑
s ns.
In order to operate, profit maximising firms require permits issued by government rep-
resentatives called, for convenience, officials.22 In essence, on both tiers the task of officials
consists of regulating entry to a market, which encompasses the entire federation. However,
the only purpose of the corresponding government licensing scheme lies in erecting a barrier
to entry restricting the number of firms and in turn competition on the market.23 This al-
lows to disregard the provision of public goods or the correction of market failure as motives
underlying government intervention, which would be hard to justify meanwhile analysing the
relationship between corruption and federalism. Then again, state and federal officials do
not derive utility directly from issuing permits, but rather indirectly via the corresponding
legally obtained wages (w respectively W ) and illegally extracted bribes (b respectively B).
Thus, the utility attached to working in the public sector amounts to us(bs, ws) for the official
controlling state s respectively U(B,W ) for the official controlling the federal tier.
Engaging in corrupt conduct impairs prevailing laws and brings about a probability
qs ∈ [0, 1] for state and Q ∈ [0, 1] for federal officials to be caught and convicted. This
propensity of apprehension reflects the concept of separation of power, supposing some in-
dependent monitoring system like the judiciary or the mass media to exist, which may put
corrupt conduct on trial or denounce misconduct through provoking scandals. Disregarding

CHAPTER 3. FEDERALISM AND CORRUPTION - THEORY 40
the concept of benevolence gives, of course, rise to the rhetoric question: Quis custodiet ipso
custodes? (”Who shall guard the guardians?”). Presuming the probability of apprehension
to be exogenous provides a way out of this irony in recognition that monitoring relies on
there being at least one honest agent.24 Still, officials face heterogenous propensities of ap-
prehension, which can be attributed to some posts being more prone to bribery as well as
some individuals being more talented in disguising dishonesty.25
Idiosyncratic fixed cost (fsi) impact upon the earning potential of firm i located in state
s with type-specific profits being denoted by πsi(fsi). Corruption forces firms to share their
profits by bribing state and federal Leviathans at a rate of b, respectively B, in exchange for
obtaining a permissions to operate. Thereby, βs denotes consolidated bribe-rates (bs + Bs)
within each state s. Likewise, fiscal decentralisation manifests in both states (ts) and the
federal unit (T ) levying taxes autonomously with a consolidated rate of τ s. Tax revenue shall
be earmarked for financing public sector wages w, respectively W . Taking into account that
states tax ns and the federation all N firms gives rise to the budget constraint on both tiers
of government:
State tsns = ws s = 1...M
Federal TN = W (3.1)
Information about officials’ and firms’ types is asymmetrically distributed insofar as they
privately observe their propensity of apprehension (qs) or idiosyncratic cost (fsi) opposed to
public knowledge being confined to the corresponding joint probability density φ(q, f) and
cumulative distribution Φ(q, f).26 Both φ and Φ are supposed to follow a uniform distri-
bution with φ(0, 0) = 0 and Φ(0, 0) = 0 as well as φ(1, f) = 0 and Φ(1, f) = 1. Thus,
intervals [0, 1] and [0, f ] confine the support underlying the distribution. Choosing the uni-
form distribution for φ and Φ merely reflects the simplest and most commonly used way to
introduce heterogeneity, with a constant density of officials and firms across the support of
apprehension respectively cost.27 Moreover, independence between q and f - meaning intu-
itively that the propensity of apprehension does not relate to firms cost structure - entails
firstly: φ(q, f) = φq(q)φf (f) and Φ(q, f) = Φq(q)Φf (f) meaning the joint density equals the
product of marginal densities. Secondly, as regards conditional distributions between q and
f , independence implies φ(q|f) = φq(q) and φ(f |q) = φf (f) respectively conditional distri-
butions equal marginal distributions.
Federalism manifests in specific institutionalised rules within the constitutional structure
of government. Brennan and Buchanan (1980) define such a constitution as ”a set of rules,
or social institutions, within which individuals operate and interact with one another” (p.3),
albeit their work features around constraints imposed by a fiscal constitution on the power

CHAPTER 3. FEDERALISM AND CORRUPTION - THEORY 41
to tax, rather than the constraints of federalism on the power to extract bribes. Henceforth,
Γ denotes the institutionalised set of rules characterising the structure of government.
Shleifer and Vishny (1993) refer to the mapping of various government structures onto
corruption as ”industrial organisation of corruption”. Despite technical similarities with
analysing industry structures, this term seems too narrow to encompass the versatile features
inherent in governance. Moreover, the term ”constitution” is more entrenched in the literature
on political economy (e.g. Brennan and Buchanan, 1985).
Formally, the constitution Γ combined with a collection of: federal and state officials as
well as firms; their strategy profiles Ss, S, Ssi; outcome functions u(., qs), U(., Q), π(., fsi);
the cartesian product of possible types of officials Θ, and firms Ω; as well as the densities
over types relating to the probability of apprehension and fixed cost φ(q, f) define a Bayesian
game of incomplete information:
[M + 1, N ; Ss, SSsi; u(.), U(.), π(.);
Θ1 × ..×ΘM ,ΘF ,Ω1 × ..× ΩN , φ(q, f)] (3.2)
To illustrate, figure 3.1 summarises the sequence of decisions and events, the information
known to firms and officials, as well as the corresponding pay-off in terms of profits and the
utility accruing to the state and federal tier (the variables of which are again denoted by
capital letters).
In words, officials on both tiers and firms undergo the following subsequent stages of
events:
1. Officials decide (ex-ante) about whether or not to participate in corruption based on
corresponding participation constraints. Benevolent officials abstain from accepting
kickbacks (b, B = 0).
2. Corrupt Leviathans impose positive levels of bribe-rates (b, B > 0) to seek self-enrichment
under the constraints inherent in competing over a shared bribe-base and monitoring.
3. An independent monitoring system apprehends corrupt Leviathans with probability
q, Q.
4. When confronted with a positive bribe and contingent on profits remaining positive,
firms decide (ex-post) on whether or not to exit the market.
Stage 2 determines how endemic corruption is. Thereby, the impact of single and multi-
tiered constitutional structures Γ upon the extent of bribery will be considered in sections
3.4 and 3.5. However, unlike taxation where agents face only limited possibilities for evasion,
corrupt exchange occur voluntarily. Therefore, passing a bribe must be deemed rational

CHAPTER 3. FEDERALISM AND CORRUPTION - THEORY 42
Figure 3.1: Sequence of Events
Official
≥ 0)()(
)(
sifWUwu
π
)()0()0(
sifUu
π
= 0)()(
)(
sifWUwu
π
>≤
++
0),(
)()(
βπ sif
BWUbwu
←
FirmofitOfficialFederalUtility
OfficialStateUtility
Pr
Participate in corruption (c=1,
C=1).
Abstain from corruption (c=0,
C=0).
No apprehension with probability
(1-q), (1-Q) Apprehension with
probability q,Q
Exit Market (e=1)
Stay in Market (e=0)
Monitoring (exogenous)
Firm
Request bribe within possible
range e.g. b,B>0
Leviathan Officials
PDF created with pdfFactory trial version www.pdffactory.com
from the officials’ and firms’ perspective in the first instance meaning, optimising the level of
bribe-rates is embedded in the participation decisions of stages 1 and 4.
3.2 Participation Decision
The participation constraints inherent in stages 1 and 4 of figure 3.1 differ to the extent
that officials request a bribe ahead of learning about the exact type of firms they are facing
(ex-ante participation constraint) whereas firms can infer the corruptability of officials from
the fact of being requested to pass a bribe (ex-post participation constraint). Hence, the
participation decisions of firms depend on the proceeding decision taken by officials, which
therefore needs establishing first. Above all, their cumulative decisions about engaging in
corruption and exiting the market determines the endogenous number of Leviathans and
operating firms, which will crucially affect benefits and costs of imposing bribes as discussed
during section 3.3.
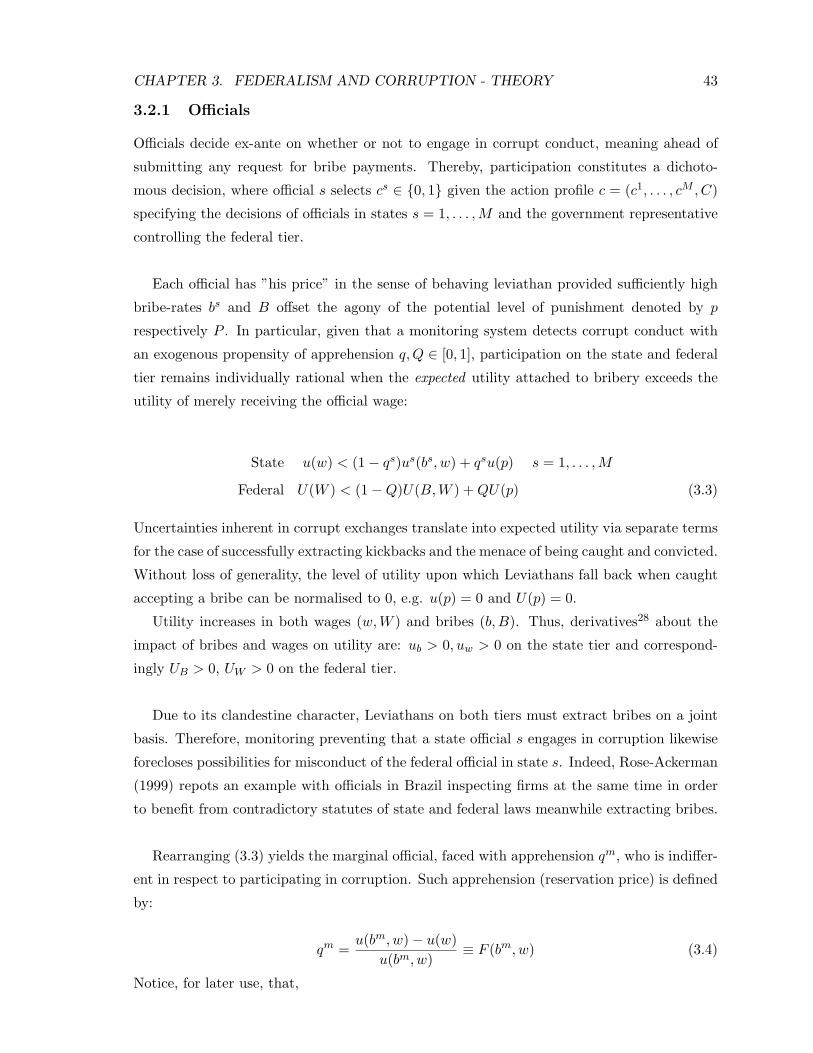
CHAPTER 3. FEDERALISM AND CORRUPTION - THEORY 43
3.2.1 Officials
Officials decide ex-ante on whether or not to engage in corrupt conduct, meaning ahead of
submitting any request for bribe payments. Thereby, participation constitutes a dichoto-
mous decision, where official s selects cs ∈ 0, 1 given the action profile c = (c1, . . . , cM , C)
specifying the decisions of officials in states s = 1, . . . ,M and the government representative
controlling the federal tier.
Each official has ”his price” in the sense of behaving leviathan provided sufficiently high
bribe-rates bs and B offset the agony of the potential level of punishment denoted by p
respectively P . In particular, given that a monitoring system detects corrupt conduct with
an exogenous propensity of apprehension q, Q ∈ [0, 1], participation on the state and federal
tier remains individually rational when the expected utility attached to bribery exceeds the
utility of merely receiving the official wage:
State u(w) < (1− qs)us(bs, w) + qsu(p) s = 1, . . . ,M
Federal U(W ) < (1−Q)U(B,W ) + QU(p) (3.3)
Uncertainties inherent in corrupt exchanges translate into expected utility via separate terms
for the case of successfully extracting kickbacks and the menace of being caught and convicted.
Without loss of generality, the level of utility upon which Leviathans fall back when caught
accepting a bribe can be normalised to 0, e.g. u(p) = 0 and U(p) = 0.
Utility increases in both wages (w,W ) and bribes (b, B). Thus, derivatives28 about the
impact of bribes and wages on utility are: ub > 0, uw > 0 on the state tier and correspond-
ingly UB > 0, UW > 0 on the federal tier.
Due to its clandestine character, Leviathans on both tiers must extract bribes on a joint
basis. Therefore, monitoring preventing that a state official s engages in corruption likewise
forecloses possibilities for misconduct of the federal official in state s. Indeed, Rose-Ackerman
(1999) repots an example with officials in Brazil inspecting firms at the same time in order
to benefit from contradictory statutes of state and federal laws meanwhile extracting bribes.
Rearranging (3.3) yields the marginal official, faced with apprehension qm, who is indiffer-
ent in respect to participating in corruption. Such apprehension (reservation price) is defined
by:
qm =u(bm, w)− u(w)
u(bm, w)≡ F (bm, w) (3.4)
Notice, for later use, that,

CHAPTER 3. FEDERALISM AND CORRUPTION - THEORY 44
Fbm =ubmu(w)u(bm, w)2
> 0 (3.5)
meaning increasing the level of graft (bm) increases the level of monitoring required to achieve
indifference as regards engaging in corruption.
Conversely, the impact of wages on participation in corruption is ambiguous,
Fw =u(bm, w)[uw(bm, w)− uw(w)]− uw(bm, w)[u(bm, w)− u(w)]
u(bm, w)2<>0 (3.6)
because, in contrast to bribes, increased wages affect both the level of utility achieved under
honest and dishonest conduct.29
On the federal tier, participation in dishonesty constitutes a dichotomous decision accord-
ing to (3.3). Conversely, state official s facing a probability of apprehension qs < qm will find
it worthwhile to engage in corruption opposed to virtuous official t with probability qt ≥ qm,
where monitoring successfully deters accepting kickbacks. Referring back to section 3.1, the
distribution over the probability of apprehension defines the endogenous number of corrupt
Leviathans (m) relative to the total number of state officials (M). Thus, the ratio (m/M)
reflects how widespread corruption is and equals the cumulative distribution function Φq
evaluated at the marginal official of (3.4), who is indifferent about accepting bribes, that is
m
M≡ Φq(qm) = Φq(F (bm, w)) (3.7)
Based on (3.7), the number of corrupt Leviathans willing to divert rents into their own pockets
m(bm, w) ≡ Φq(F (bm, w))M (3.8)
relates to the incentives about accepting bribes (bm) and wages (w) as well as the effectiveness
of monitoring, which pins down the marginal official, m, who is indifferent about accepting
bribes.
Lemma 1 With positive propensities of apprehension (q), the number of corrupt officials
inherent in (3.8) increases in higher bribe-rates.
Proof: From (3.8):
mbm = Mφq(.)Fbm(bm, w) > 0
The result follows from M > 0 and the positivity of φq as well as (3.5). 2
According to lemma 1, higher bribes tempt more officials to accept kickbacks. Figure
3.2 depicts this relationship between bribe-rates and the endogenous number of corrupt
Leviathans.

CHAPTER 3. FEDERALISM AND CORRUPTION - THEORY 45
Figure 3.2: Endogenous Number of Officials
Number of corrupt officials (m)
Bribe rate bm
m(bm,w)
PDF created with pdfFactory trial version www.pdffactory.com
3.2.2 Firms
Based on imperfectly competitive markets, firms produce surplus and so rents, providing the
source for both taxation and bribery. Following the approach lied out in Bliss and Di Tella
(1997), aside from their idiosyncratic fixed cost structure, firms are alike. Firm i in state s
maximises profits
πsi = θ(β)− csi(βsi) (3.9)
given by the difference between market power (θ(β)) - the ability to obtain supra competitive
revenue - and cost.
Denoting the m-vector of consolidated bribe rates by β ≡ (β1, β2, . . . , βm), market power
increases monotonically in the extent of bribery: θβ > 0. This relationship between weak
competition and bribery is entrenched in the literature about the causes of corruption (e.g.
Ades and Di Tella, 1999). Albeit the regulation of entry applies to each jurisdiction, states
remain interconnected to the extent that the common market encompasses all states of the
federation. Therefore, overall competitive conditions relate to the vector of consolidated
bribe-rates across jurisdictions and tiers, though the extent of corruption may vary across
states.30 Notice, for later use, that the special case of a symmetric equilibrium, where states
are alike and therefore superscripts can be dropped, implies
θβ = m(b, w)∂θ
∂β(3.10)

CHAPTER 3. FEDERALISM AND CORRUPTION - THEORY 46
meaning the overall impact of bribes on market power equals the product of the partial
impacts in each state multiplied by the number of corrupt Leviathans as given by (3.8).
Again, the increase in market power as a response to higher bribes ∂θ∂β originates in bribes
imposing an artificial barrier to entry, which reduces competition and allows remaining firms
to exert more market power.
The following assumptions contain some stability and regularity conditions:
Assumption 1 In any state s the mapping of consolidated bribe-rates (β) onto competitive
conditions is such that:
(a) 0 < θβ < 1
(b) θ(β) is weakly convex in β
In particular, assumptions 1 ascertain that the amount of firms the economy can support
remains well behaved in bribe-rates, excluding cases of an infinite or negative number of firms.
Furthermore, thanks to weak convexity the increase in market power does not fade-away in
higher levels of bribes. E.g. a simple linear relationship with θ =∑
s asβs with 0 < a < 1
satisfies these assumptions.
Cost consists of three components: Firstly, there are idiosyncratic fixed cost f , which,
following section 3.1, are uniformly distributed according to the marginal distribution function
Φf (.). Secondly, taxes are levied on a state (ts) and federal level (T ). Finally, provided firms
are inspected by corrupt Leviathans, bribes must be paid towards state (bs) and federal (Bs)
officials. Thus, total cost of firm i in state s condition on the virtue of inspecting officials:
csi =
fsi + τ s if qs ≥ qm
fsi + τ s + βs if qs < qm(3.11)
Since the present essay looks at bribery rather than taxation, henceforth consolidated tax-
rates (τ) are normalised to 0, which based on the states budget constraint (3.1) coincides
with normalising wages to 0.
Participation constitutes a dichotomous decision esi ∈ 0, 1 of a firm i in state s about
whether or not to exit the market given the action profile e = (e11, . . . , eMN ) of competing
firms and c = (c1, . . . , cM , C) of inspecting officials. Firms participation decisions occur at an
ex-post stage after officials decided whether or not to impose kickbacks. Since any uncertainty
about future profits are removed, firms’ decisions about exiting the market depend only on
the level of fixed cost (f is) and the bribe-rates (β) they face. In particular, firm i in state s
maintains production as long as profits of (3.9) are non-negative πsi ≥ 0.

CHAPTER 3. FEDERALISM AND CORRUPTION - THEORY 47
Within each state s, the zero-profit constraint (πsm = 0) marks the firm with superscript
m and idiosyncratic fixed cost fsm (reservation price), which is indifferent between operating
and exiting the market:
fsm = θ(β)− βs (3.12)
In states unaffected by bribery, that is βs = 0, no firm needs stopping its production due
to additional expenses attributed to corruption. Conversely, with strictly positive levels of
graft βs > 0, idiosyncratic fixed cost fsi > fsm force a firm si to declare bankruptcy whereas
a firm sj characterised by idiosyncratic fixed cost fsj ≤ fsm remains profitably operable.
Therefore, the marginal density of fixed cost Φf(.) evaluated at the marginal firm of (3.12),
identifies the endogenous share (ns/ns) of participating firms with nonnegative profits, a state
can support:
ns
ns = Φf (fsm) = Φf (θ(β)− βs) (3.13)
In states controlled by non-corrupt officials, (3.13) equals 1 meaning no firm is corrupted
away. Conversely, strictly positive consolidated bribe-rates (βs > 0) push a share of firms
confined to 1− Φf (.) ∈ [0, 1] into bankruptcy.
The number of firms exiting the market conditions on the corruptibility of the corre-
sponding state s and therefore depends on the joint distribution between the propensity of
apprehension and fixed cost. In particular, only firms with relatively high fixed cost inspected
by corrupt Leviathans will be pushed into bankruptcy. Recall from section 3.1 that the level
of fixed cost and the propensity of apprehension are independently distributed, which allows
splitting the joint distribution evaluated at the marginal official and firm into the product of
their respective marginal distributions. Therefore, the endogenous share (N/N) of firms the
federal economy can support is given by the product of (3.8) and (3.13):
N
N= Φq(F (bm))Φf (θ(β)− βs) = m(bm)Φf (θ(β)− βs) (3.14)
In essence (3.13) and (3.14) constitute the relationship between bribe-rates and the number
of firms willing to operate, e.g. the demand curve facing the state, respectively federal, official
with the usual properties:
Lemma 2 For positive propensities of apprehension and fixed cost the number of firms willing
to operate in the state (ns) and federal economy (N) decreases in higher bribe-rates.
Proof: Following (3.13) and (3.14):

CHAPTER 3. FEDERALISM AND CORRUPTION - THEORY 48
Figure 3.3: Endogenous Number of Firms
Number of Firms (n,N)
Bribe- Rate (β)
n(β) resp. N(β)
nβ = n[φf (.)(θβ − 1)] < 0
Nβ = N [Φq(.)φf (.)(θβ − 1)] < 0 (3.15)
The inequality rests on the positivity of Φ, respectively φ, as well as θβ−1 < 0 of assumption
1 (a). 2
Notably, the impact of bribe-rates upon firms’ profits is twofold: Firstly, paying kickbacks
constitutes a cost burden and provides a potential cause for bankruptcy. Secondly, corruption
reduces the number of firms and so increases market power and in turn profits of the remaining
firms. As long as θβ − 1 < 0, the marginal cost of imposing bribes outweighs the benefits
attributed to increased market power of remaining firms. Insofar as assuring that corruption
causes economic damage, with the endogenous number of firms being negatively related to
graft as depicted in figure 3.3, assumption 1 (a) constitute a regularity condition. Empirical
results support this relationship as e.g. the economic size of countries in terms of GDP per
capita conditions negatively on corruption (Mauro, 1995).
3.3 Corrupt Leviathans
Leviathans participating in misconduct face a tradeoff between increasing bribe-rates and
infringing a commonly shared bribe-base.

CHAPTER 3. FEDERALISM AND CORRUPTION - THEORY 49
To keep the model tractable, henceforth the attention is confined to symmetric equilib-
ria where states affected by corruption impose identical bribes (βs = β ∀ s| qs < qm).
However, in states with qs ≥ qm monitoring successfully deters corrupt abuses, that is
βs = 0 ∀ s| qs ≥ qm.
Compared with taxation, corruption provides a more appropriate environment for analysing
the Leviathan, since paying bribes involves ex-definitionae a shifting of rent towards repre-
sentatives willing and able to abuse public power, without aiming at enhancing public wel-
fare. However, despite all agents being driven by self-interest only, the present approach
departs from the overly pessimistic Hobbesian jungle, since by virtue of ex-ante participa-
tion constraints solely an endogenous share of officials is inclined to seek self-enrichment by
usurpatating their discretion.31 Differences in motivation and incentives induce virtuous offi-
cials to abstain from self-enrichment opposed to corrupt state and federal Leviathans seeking
to maximise rents.
The rent a Leviathan manages to extract consists of the product between bribes (b, B)
and the size of the corresponding bribe-base (n, N). Since paying kickbacks imposes a cost
burden on firms, increasing bribe-rates affects the size of the bribe-base as given by (3.13),
respectively (3.14). Thus, the rent function facing lower-tiered Leviathans with relatively
modest propensities of apprehension is:
r(b, B|q < qm) = bn = bΦf (θ(β)− β)n (3.16)
Conversely, the federal tier encompasses the entire economy. Provided sufficiently weak mon-
itoring, the federal Leviathan must take into account the participation decisions on the state
tier meanwhile maximising rents given by:
R(B, b) = BN = Bm(b)Φf (θ(β)− β)N (3.17)
The federation exhibits externalities to the extent that rents accruing to the state and fed-
eral tier depend among else on the bribes (β) imposed by competing Leviathans. Thereby,
horizontal externalities rest on the federal economy exceeding the size of regulatory jurisdic-
tions, meaning states. In particular, market power θ increases in the vector of bribe-rates
β across all, rather than a single state. Conversely, vertical externalities arise within the
present federation since two distinct governments operate directly upon each firm, and ex-
tract consolidated bribes (β) in an uncoordinated manner. Furthermore, from the federal
officials perspective bribe-rates, b, determine the endogenous share of corrupt states and in
turn the amount of resources subject to their discretion.

CHAPTER 3. FEDERALISM AND CORRUPTION - THEORY 50
Figure 3.4: Laffer Relationship in Bribery
Rent (r,R)
Bribe Rates (b,B)
β
0
PDF created with pdfFactory trial version www.pdffactory.com
In respect to rents, assumption 1 (a) together with the properties of the distribution
function (Φ) imply (3.16) and (3.17) to be bounded at an upper and lower level. It is natural
to assume that bribe-taking can neither exceed the size of its base bn, respectively BN , nor
become negative. Here, n and N reflect the maximal size of the state respectively federal
economy. Without loss of generality, n and N can be normalised to 1 aligning the size of
state with the federal tier. Furthermore, rents are assumed to be concave in consolidated
bribes:
Assumption 2 For all β such that β > 0 second derivatives of r(b, B) and R(B, b) are
negative e.g. rbb < 0, respectively RBB < 0.
In other words, rents exhibit characteristics familiar from the Laffer curve in taxation.32
E.g. as depicted in figure 3.4, they drop to 0 due to the lack of bribe-takers when β = 0,
respectively bribe-payers when β = β. For 0 < β < β rents are strictly positive and, due to
assumption 2, concave, which ascertains a unique interior maximum. Therefore, by virtue of
assumption 2 second order conditions for a maximum are met throughout the remainder.
Both (3.16) and (3.17) exhibit the following mapping from competition among firms onto
corruption:
Proposition 1 Fiercer competition among firms represented by a decrease in market power
(θ), reduces the extent of corruption measured by state or federal rents regardless the param-
eters affecting officials participation constraint.

CHAPTER 3. FEDERALISM AND CORRUPTION - THEORY 51
Proof: Appendix.
The intuition behind proposition 1 lies in corruption requiring discretionary power and
rents to coexist. Fiercer competition among firms results in rents being competed down,
leaving fewer opportunities for corrupt officials to divert resources into their own pockets.33
Conversely, Ades and Di Tella (2000) find competition among firms to impact ambiguously
upon corrupt rents. However, their result rests on the existence of a benevolent planer
trading-off the cost of prosecution against its benefits in terms of sustaining a private sector,
producing rents. Proposition 1 suggests that this ambiguity is not robust towards departing
from the concept of benevolence.
3.4 Unitarian Constitutions
Before establishing the impact of federalism, the following prepares the field by analysing
single-tiered government, where each official deals exclusively with his assigned territory and
in consequence only one government operates upon firms. In essence, unitarian governance
implies that Leviathans act as ”monopolists” within their jurisdiction when regulating market
entry.
Compared with federations, the unitarian constitution can be established either by dis-
solving the lower tier, giving rise to centralistic governance, or by disregarding the supreme
tier, giving rise to a confederation.
3.4.1 Centralised Governance
Consider the former case of vertically integrated and completely centralised governance with
constitution ΓC and public power concentrated on the supreme tier. Such a centralistic form
of government provides a natural benchmark free of inter and intra-state competition and
hence subject to neither vertical nor horizontal externalities. Aside from the risk to corrupt
further firms into bankruptcy, rent-seeking is only subject to the constraint (3.3), which
determines the level of monitoring Q required for an upper-tiered official to participate in
bribery. Elsewhere (Rose-Ackerman, 1999, p.151), the dishonest centralist facing, in essence,
a non-binding monitoring system has been labeled somewhat colorfully as ”kleptocrat”. Given
a low enough propensity of apprehension (Q), the centralist Leviathan seeks self-enrichment
according to the rent function:
R(B) = BN = BΦf (θ(B)−B) (3.18)
Deriving R(.) in respect to bribes (B) yields the sufficient condition for a maximum:
∂R
∂B= Φf (θ(B)−B) + Bφf (.)(θB − 1) != 0 (3.19)

CHAPTER 3. FEDERALISM AND CORRUPTION - THEORY 52
This condition captures the tradeoff between increasing bribes and the corresponding shrink-
ing of the bribe-base in a concise manner. In particular, the first term on the right hand side
represents the benefit attached to increasing B incrementally in terms of extracting higher
rents. Following lemma 2, the second term, Bφf (.)(θB − 1), is negative and represents the
cost associated with corrupting the marginal firm into bankruptcy. The stability and regu-
larity conditions of assumptions 1 imply that the cost of corruption increase in higher bribe
rates. Thus, a corner solution where the Leviathan permits only one firm to remain in the
market will typically not yield a maximum of rents. This maybe somewhat counterintuitive
result rests on the structure of the model where, unlike the approach of Keen and Kotso-
giannis (2002) with freely movable capital, firms are immobile and only interconnected via
competitive conditions θ, which introduces limits to their individual potential to produce
rent.
Applying absolute values to the term (θB − 1), which by virtue of assumption 1 (a) is
negative, and rearranging (3.19) into its elasticity form yields
|ηNB| =1
|θB − 1|(3.20)
meaning, in an optimum graft induces an equality between the elasticity of firms abundance
in respect to bribes, ηN,B = φf (.) BΦf (.) , and the ratio between 1 and the excess market power
created, as fewer firms operate on the imperfectly competitive market. Thus, compared with
the monopolistic firm, where elasticities in a corresponding optimum equal 1, the centralist
Leviathan recognises the benefit attached to constraining the abundance of firms in terms of
additional disposable rents, created through the resulting increase in market power.
Equilibrium bribe-rates of the centralist Leviathan can be obtained via rearranging (3.19),
BΓC =Φf (.)φf (.)
1|θB − 1|
=[P (e)|θB − 1|
]−1 (3.21)
where,
P (e) =φf (θ(B)−B)Φf (θ(B)−B)
(3.22)
denotes the probability of inducing the marginal firm to exit the market. Due to Φf and
φf following a uniform distribution, P (e) remains constant for positive levels of corruption.
According to (3.21), equilibrium bribe-rates (BΓC) relate negatively to the probability of
inducing exit P (e) but positively to the impact of firms ability to earn supra-competitive
profits (θB).

CHAPTER 3. FEDERALISM AND CORRUPTION - THEORY 53
3.4.2 Confederation
Dissolving the supreme tier gives rise to a confederation with constitution Γc, where a multi-
tude of jurisdictions located on the same tier exert public power to regulate entry. However,
the confederate scenario exposes jurisdictions to horizontal externalities. In particular, ex-
tracting bribes meanwhile regulating market entry in one jurisdiction entails spillovers onto
market power (θ) and the level of graft in other jurisdictions. Provided engaging in corruption
remains individually rational according to (3.3),
r(b|q < qm) = bΦf (θ(b)− b) (3.23)
constitutes the function, according to which Leviathans maximise their bribe-revenue. Before
deriving optimal bribe-taking-rules, recall that under the present scenario, the level of graft
for one Leviathan depends among else on decisions taken by other confederate Leviathans as
market power (θ) conditions on the vector b of imposed bribe-rates. Furthermore, following
(3.10) in a symmetric equilibrium θb = θb/m(b) with m(b) determined by (3.8). First order
conditions maximising (3.23) are thus,
∂r
∂b= [Φf (θ(b)− b)] + bφf (.)
(θb
m(b)− 1
)!= 0 (3.24)
respectively rearranged into elasticity form:
|ηN,b| =1
|θb/m(b)− 1|(3.25)
The equilibrium bribe-rate, bΓc, imposed by confederate Leviathans can again be obtained
by rearranging (3.24):
bΓc =Φf (.)φf (.)
1|θb/m(b)− 1|
=[P (e)|θb/m(b)− 1|
]−1 (3.26)
Through the term m(b), the optimal bribe-taking-rule conditions on the endogenous number
of corrupt officials. In particular, compared with a centralistic constitution, ΓC , differences
in the equilibrium level of graft arising in a confederation, Γc, rests on there being potentially
more than one corrupt Leviathan inducing horizontal competition for rent across jurisdictions.
Proposition 2 Thanks to horizontal competition, and relative to a centralistic constitution
ΓC with equilibrium bribe-rate BΓC and equilibrium rents RΓC , under a confederate constitu-
tion Γc in an equilibrium:
(a) bribe-rates are lower, bΓc < BΓC ;
(b) a cooperative marginal increase in equilibrium bribe-rates, bΓc, would be strictly benefi-
cial to Leviathans allowing them to extract higher rents rΓc.

CHAPTER 3. FEDERALISM AND CORRUPTION - THEORY 54
Proof: Appendix.
Proposition 2 reveals the benefits attached to horizontal competition in reducing cor-
ruption. Intuitively, decentralising the regulation of entry across a multitude of jurisdictions
undermines the temptation to abuse public power for private benefit. More precisely, increas-
ing bribes in one jurisdiction corrupts firms into bankruptcy meanwhile increasing market
power of the remaining firms across the entire economy. Thus, the extent of corruption in
one jurisdiction spills over onto the competitive conditions for firms and in turn the rent
available to all Leviathans. Thanks to such horizontal externalities, confederate Leviathans
do not take fully advantage of the tradeoff between increasing bribe-rates, and corrupting a
part of their bribe-base leaving them with bribe-rates and rents, which are to low (from their
perspective) in a non-cooperative equilibrium. In essence, horizontal competition over rents
provides a remedy against endemic corruption.
Unlike Arikan (2004), the present results rest on endogenous decisions about bribery rather
than an exogenous increase in the number of corrupt states. This emphasises, how decen-
tralisation allows taking advantage of heterogeneity among officials incentives to engage in
corrupt conduct.
3.5 Federations
Federalism refers to a structure of government, ”which has been formed for common pur-
poses, but in which the member states retain a large measure of their original independence”
(Wheare, 1956, p.1). Hence, the emphasis does not lie on the mere existence of multiple
tiers, but rather on a constitution established according to the federal principle in the sense
of dividing power so that the federal and state authorities are not subordinate to one another,
but within a frequently constitutionally assigned sphere coordinate and autonomous aiming
to achieve a balance between unity and diversity, respectively independence and interdepen-
dence, by means of combining shared-rule with self-rule.34 Inevitably, within a federation
two distinct governments operate directly upon firms making overlapping responsibilities un-
avoidable in practice, even though a great deal of the constitutional consent might be directed
towards separating spheres of responsibility.
Within a federation, the decision about what level of bribes to impose interdepends with
the actions taken by higher, respectively lower tiered officials. Thus, federalism calls for the
Nash Equilibrium as solution concept defined by an m× 1 vector of consolidated bribe-rates
(β), upon which no single Leviathan can improve unilaterally:
Definition 1 A Nash Equilibrium in a federation with constitution Γ is a constellation

CHAPTER 3. FEDERALISM AND CORRUPTION - THEORY 55
(b∗, B∗) of correctly conjectured mutual best-responses according to the best-response func-
tion of the federal Z(b) and state z(B) official, or formally:
β ∈ Z(b), z(B) (3.27)
Depending on the process of establishment, the balance of power varies considerably among
various types of federations. Especially, the balance might advantage the lower tier, where
the process of establishment has involved the aggregation of previously sovereign states.
Conversely, where federations have been created through a devolution process, key areas
of power are likely to remain with the supreme tier.35 The present model addresses this
distinction by considering cases where either the state or the federal tier enjoys the benefit
of being first-mover alongside the simultaneous moves case reflecting a scenario of balanced
power distribution.
3.5.1 Balanced Power Federation
A constitutional structure ΓF , which obliges corrupt Leviathans on either tier to seek self-
enrichment by simultaneously maximising the state (3.16) respectively federal (3.17) rent-
function, yields the undermentioned conditions:
State ∂r∂b = Φf (θ(β)− β) + bφf
(θβ
m(b) − 1)
!= 0 (3.28)
Federal ∂R∂B = m(b)
[Φf (.) + Bφf
(θβ
m(b) − 1)]
!= 0 (3.29)
On both tiers, corrupt Leviathans face the tradeoff of sections 3.4.1 and 3.4.2 between extract-
ing additional rents from infra-marginal firms and the probability of corrupting the marginal
firm into bankruptcy. Moreover, the federal Leviathan takes into account the impact of par-
ticipation decisions (m(b)) taken by state Leviathans upon the magnitude of his bribe-base.
Still, symmetric discretionary power implies congruent optimal bribe-taking-rules, which can
be derived along the lines of the previous sections:
State bΓF =[P (e)|θβ/m(b)− 1|
]−1 (3.30)
Federal BΓF =[P (e)|θβ/m(b)− 1|
]−1 (3.31)
Notably, optimal bribe-rates mimic the outcome of the confederation aside from bribes in
each jurisdiction consolidating with the higher, respectively lower tier.
The first order conditions (3.28) and (3.29) inhere the best-responses (z(B)) and (Z(b)),
e.g. how Leviathans adapt optimal bribe-rates when anticipating a change in bribe-rates

CHAPTER 3. FEDERALISM AND CORRUPTION - THEORY 56
on the other tier. On the state tier, the identity rb[z(B), B] ≡ 0 implicitly defines the
best-response function as well as its slope zB = − rbBrbb
, which determines the direction of the
reaction when adapting the expectation of bribe-rate B. By virtue of assumption 2 the numer-
ator, rbb, is negative. As the mixed derivation of the denominator rbB is negative, bribe-rates
across tiers constitute strategic substitutes and best-response functions slope downwards. A
congruent argument applies to the federal tier.
According to definition 1, correctly conjectured mutual best responses,
z(BΓF ) = Z(bΓF ) (3.32)
pin down the equilibrium within the present federation. Compared with the centralistic
benchmark, introducing two tiers of governance impacts upon both officials ability to impose
bribes and to divert rents into their own pockets.
Proposition 3 Relative to a centralistic constitution ΓC with equilibrium bribe-rates BΓC
and equilibrium rents RΓC , under a federal constitution ΓF in an equilibrium with balanced
power (simultaneous moves):
(a) consolidated bribe-rates are excessively high, βΓF > BΓC ;
(b) the state Leviathan earns relatively low rents in the sense that a small but significant
cooperative decrease in βΓF would be strictly beneficial allowing to extract higher rents;
(c) the same cooperative decrease in βΓF has an ambiguous effect on rents extracted by
the federal Leviathan due to the impact of participation decisions attached to state
Leviathans.
Proof: Appendix.
Overlapping responsibilities in federations imply that each firm is subordinate to a pair
of Leviathans regulating market entry. Despite inter-state competition within the lower tier
constraining bribes to some degree (see proposition 2), vertical externalities attached to intra-
state competition across tiers prevail to the extent that, in an equilibrium, consolidated bribe-
rates of the balanced power federation exceed those of the centralist benchmark. As regards
rents on the state tier, intra-state competition likewise exhibits vertical externalities with
excessively high consolidated bribe-rates entailing a corrupt overgrasing of the bribe-base with
essentially more firms pushed into bankruptcy than optimal from a Leviathans perspective.
Conversely, for the federal Leviathan participation constraints mitigate against this result
featuring prominently in the economics of corruption (Shleifer and Vishny, 1993) as well
as tax competition in federations (Keen and Kotsogiannis, 2003), since lowering bribe-rates
might induce fewer officials to participate in misconduct and hence foreclose possibilities for

CHAPTER 3. FEDERALISM AND CORRUPTION - THEORY 57
joint extraction of kickbacks. In essence, provided the preferences to participate in corruption
differ across states, maintaining bribe-rates at a high level ensures that a large fraction of state
officials find it individually worthwhile to tolerate corrupt conduct within their jurisdiction.
3.5.2 Asymmetric Power Federation
Introducing sequentiality between federal and state officials establishes a dominant tier as-
signed by the constitution Γf with the role of first-mover within the federal decision process.
Such sequentiality provides tiers with different levels of power in what has now become a fully
sequential game. This requires the leading tier to correctly anticipate the followers reaction
in terms of bribe-rates meanwhile engaging in corruption.
With states acting as first-mover, the condition RB(.) != 0 pins down the reaction of
the federal Leviathan. Again, (3.29) inherently defines the best-response function Z(b). On
the federal tier, the bribe-rate b is predetermined in the sense that Z(b) represents actual
responses, rather than some belief about the state Leviathans behaviour. Since B = Z(b),
the state Leviathan maximises rents according to,
r(b, Z(b)|q < qm) = bΦf (θ(b + Z(b))− b− Z(b)) (3.33)
with optimality condition:
∂r
∂b= Φf (.) + bφf (.)
[θβ(1 + Zb)
m(b)− 1− Zb
]!= 0 (3.34)
Rearranging (3.34) yields the optimal bribe-taking rule,
|ηNb| =1
|θβ/m(b)− 1|(1 + Zb)(3.35)
with the corresponding equilibrium bribe-rate of the state Leviathan:
bΓf =[P (e)|θβ/m(b)− 1|(1 + Zb)
]−1 (3.36)
Provided strategic substitutability, meaning more competitive behaviour to seek rents on the
lower tier prompts less competitive behaviour on the supreme tier, best-response functions
slope downward, e.g. Zb < 0. Therefore, bribes of the first moving states (3.36) exceed
the corresponding equilibrium level of graft (3.30) under a symmetric power distribution.
Conversely, since Zb < 0 and B = Z(b), the federal Leviathan reacts by extracting lower
bribe-rates. Furthermore, as along as bribes constitute substitutes, meaning r(b, B) is strictly
falling in B, such a first-mover advantage spills over onto rents.36

CHAPTER 3. FEDERALISM AND CORRUPTION - THEORY 58
The participation decision of the following states makes the derivation of the optimality
conditions with a first moving federal Leviathan somewhat more complicated. Substituting
the states best-response function, obtained from (3.28), into the federalists rent function
(3.17) yields:
R(B, z(B)) = Bm(z(B))Φf (θ(B + z(B))−B − z(B)) (3.37)
The first order condition is:
∂R
∂B= m(.)Φf (.) + B
m(.)φf (.)
[θβ(1 + zB)
m(.)− 1− zB
]+ mzzBΦf (.)
!= 0 (3.38)
Solving for the optimal bribe-rate yields,
BΓf =[P (e)|θβ/m(b)− 1|(1 + zB) + P (c)
]−1 (3.39)
where,
P (c) =mzzB
m(z(B))(3.40)
denotes the propensity of additional state Leviathans participating in corrupt conduct after
a marginal increase in bribe-rates.
Compared with (3.31), the effect of introducing best-response functions z(B) on the fed-
eral tier is twofold: Firstly, strategic substitution characterised by zB < 0 translates into a
first-mover advantage in terms of higher equilibrium bribe-rates. Secondly, the participation
decision of lower tiered officials, reflected by the term P (c), mitigates against the first-mover
advantage, as with zB < 0 increasing bribes on the federal tier prompts lower optimal bribe-
rates on the state tier tempting less officials to engage in corruption. Albeit the federal
Leviathan might not benefit fully from initiating bribery, the outcome of the balance power
case can always be reproduced. As long as zB < 0 setting bribe-rates first will therefore not
entail a disadvantage for the federal Leviathan.
Intuitively, the dominant tier of governance benefits from its first-mover advantage when
abusing public power for private benefit. In essence, asymmetric power within a corrupt fed-
eration drives a wedge between the extent of bribery across tiers. However, as responsibilities
no longer overlap, shifting public power in favour of the federal or state tier mitigates against
excessively high consolidated bribes by eliminating vertical externalities.
Proposition 4 A federal constitution Γf entitling one Leviathan with the advantage of set-
ting bribe-rates first (asymmetric power), removes vertical externalities between the state and
federal tier.

CHAPTER 3. FEDERALISM AND CORRUPTION - THEORY 59
Proof: The value functions evaluated at the equilibrium are r(bΓf , Z(bΓf )), respectively
R(BΓf , bΓf ). Now, rB(bΓf , z(bΓf )) = 0 and Rb(BΓf , Z(BΓf )) = 0. 2
Anticipating the followers bribe-rate puts the leading tier into a position to internalise
vertical externalities. Therefore, by clearly assigning spheres of responsibility, sequentiality
among tiers provides a way to deal with corrupt overgrasing alternative to centralisation
proposed by Shleifer and Vishny (1993). Even more, in terms of combatting corruption, such
a sequential moves federation upholds the benefits attached to inter-state competition and
horizontal externalities of proposition 2.
3.6 Comparative Considerations
Figure 3.5 draws together the participation constraint facing officials (see fig. 3.2) and firms
(see fig. 3.3) as well the rent function (see fig. 3.4), which jointly determine the endogenous
number of firms and Leviathans as well as the amount of resources devoted to corruption in
terms of the level of bribe-rates or the rent obtained from graft.
Figure 3.5: Equilibria under a Centralistic, Confederate, and Federal Constitution
Rent
Bribe Rates
Number of Firms/Officials
m(b)
Centralistic (C)
Sim. Federation (F)
Confederation (c)
nc mc mC nC mF nF rF,RF RC rc
N(b)
PDF created with pdfFactory trial version www.pdffactory.com
Under centralisation (C), the Leviathan faces neither competition nor externalities mean-
while extracting rents and therefore manages to divert a maximum of resources into his
pockets, as shown by the Laffer relationship of the first quadrant. Confederate (c) and fed-

CHAPTER 3. FEDERALISM AND CORRUPTION - THEORY 60
eral (F) structures of government exhibit externalities, which locates their equilibrium on the
upward, respectively downward sloping part of the Laffer curve leaving them with lower rents
(r, R). Conversely, as regards bribery, which is mapped onto the vertical axis, externalities
work in the opposite direction with vertical externalities leaving federal Leviathans with ex-
cessively high bribe-rates whereas horizontal externalities leave confederate Leviathans with
bribe-rates, which are too low from their perspective.
Above all, the number of Leviathans (m(b)) constitutes an endogenous variable determined
according to participation constraints (3.3). According to the distribution of power within
federations, equilibrium bribe-rates map into participation decisions on the state tier, with
differences in monitoring and incentives translating into heterogenous behaviour as regards
corruption:
Proposition 5 On the state tier, the endogenous number of officials tempted into corrup-
tion m(b) relative to a balanced power federation with ΓF is higher in a asymmetric power
federation with Γf when states act as first mover but lower when the federal unit constitutes
the first mover.
Proof: After Lemma 1, mb > 0. The result follows from the first-mover advantage inher-
ent in (3.36) and (3.39). 2
Proposition 5 is a direct consequence of the ranking of bribe-rates in various types of fed-
erations. With the advantage of power distributed in their favour, state Leviathans manage
to extract relatively high bribes. In turn, due to the heterogeneity in monitoring, endemic
corruption increases the endogenous number of Leviathans on the state tier.
Conversely, on the supreme tier participation is dichotomous in the sense of a quality of
monitoring Q > Qm, capable of wiping out corruption opposed to Q < Qm, rendering the
entire tier subject to self-enrichment. Hence, centralising public power constitutes a double
edged sword when pooling power on the supreme tier allows to combat corruption more ef-
fectively, but at the same time creates the temptation for abuse, the more the rents at stake
typically exceed those available on the lower tier.
Consolidated bribe-rates relate, furthermore, to the endogenous number of firms (N) con-
stituting the only surplus generating unit within the present federation and therefore provides
a possible welfare measure. Moreover, the number of firms exiting the market relates to the
number of jurisdictions, m(b), affected by corruption.

CHAPTER 3. FEDERALISM AND CORRUPTION - THEORY 61
Proposition 6 Relative to the centralistic Leviathan, the number of firms N(β) the entire
economy can support is higher in a confederation Γc but lower in a balanced power federation
ΓF .
Proof: After Lemma 2, Nβ < 0. Since after Lemma 1, mb > 0 the result follows directly
from proposition 2 stating that bΓc ≤ BΓC and proposition 3 stating that βΓF ≥ BΓC 2
Whilst assessing the extent of corruption, it seems a priori not evident whether to apply
bribe-rates or rents as measure: Considering rents, the centralised Leviathan prevails in
diverting the largest amount of resources into his pockets meanwhile introducing any kind
of competition across or within tiers, reduces the extent of corruption. However, federalism
with a balanced distribution of power increases consolidated bribe-rates and hence the cost
burden for firms inspected by corrupt Leviathans. Therefore, under this scenario more firms
decide to exit the market.
3.7 Concluding Remarks
Excessive levels of corruption have been attributed in the economic literature to weak central
government with a constitution establishing several - possibly multi-tiered - authorities to
deal with the same licensing process (e.g. Shleifer and Vishny, 1993). This approach has
been introduced into the analysis of federal government structures (e.g. Treisman, 1999)
anticipating to find more widespread misconduct due to corrupt overgrasing. The present
theoretical analysis suggests, however, a more complex mapping from federalism onto cor-
ruption with countervailing forces attributed to horizontal and vertical competition within
respectively across tiers of government as well as incentives and monitoring guiding partici-
pation decisions for misconduct.
In general, discretionary power together with economic rents gives rise to the temptation
for corrupt abuse. In the same manner as competition among firms decentralises rents and
market power, within federations, inter-state competition decentralises public power and
hence undermines the basis for self-enrichment. Conversely, when jurisdictions overlap, intra-
state competition threatens to entail uncoordinated corrupt overgrasing.
In comparison to taxation, the voluntary character of bribery gives rise to corrupt ex-
changes being subject to individual rationality, which affects or even alters results entrenched
in the literature on tax competition in federations. In particular, the effectiveness of mon-
itoring and the equilibrium level of bribes determine the endogenous number of corrupt
Leviathans. As the temptation to engage in corrupt conduct relates directly to the level of
bribes at stake, the ambiguous impact of horizontal and vertical externalities carries over
onto participation decisions. Thereby, political decentralisation allows exploiting differences
in incentives and motivation inherent in officials participation decision to reduce the number

CHAPTER 3. FEDERALISM AND CORRUPTION - THEORY 62
of Leviathans. Conversely, centralism constitutes a double-edged sword capable of wiping out
corruption but also prone to potential misconduct, which would not be met by countervailing
forces on other tiers. Finally, the interpretation of the results differs fundamentally, since,
opposed to taxation, corruption benefits only the bribe-taker and lacks the potential of taxes
to impact upon social welfare via providing public goods.
As regards policy conclusions, federal structures of government do not necessarily entail
more corruption and the associated decentralisation of power might even provide a remedy
against endemic government misconduct. In particular, the distribution of power within a
federation, which can vary according to the process by which it was established, crucially
determines the vulnerability of federations towards corruption. Above all, in order to benefit
from political decentralisation meanwhile combating corruption, federations should assign
clear spheres of responsibility, which give states or the federal tier a disproportionate share
of power to avoid, as far as possible, overlapping responsibilities.

CHAPTER 3. FEDERALISM AND CORRUPTION - THEORY 63
Appendix: Proofs of Propositions
Proof of Proposition 1: Define a parameter α designating the fierceness of competition
(in terms of lower market power) among firms.37 Thus, market power is now θ(β, α), with
θα < 0
Rents are, thus, given by r = bΦf (θ(β, α)−β) on the state tier and R = Bm(b)Φf (θ(β, α)−β)
on the federal tier. Now, the impact of fiercer competition on rents is:
State : rα = bφ(.)θα < 0 ∀ b > 0
Federation : Rα = Bm(b)φ(.)θα < 0 ∀ B > 0 2
Proof Proposition 2: (a) From (3.21) and (3.26) we have:
BΓC
bΓc=
P (e)P (e)
|θb/m(b)− 1||θB − 1|
> 1
Suppose not and BΓC ≤ bΓc. As φ(.) and Φ(.) follow a uniform distribution,
P (e)P (e)
= 1
implying for BΓC
bΓc ≤ 1 to hold, given 0 < θb,B < 1 of assumption 1 (a), that,
|θb/m(b)− 1||θB − 1|
≤ 1
and,
θb/m(b) ≤ θB
As m(b) ≥ 2 is required to initiate horizontal competition in confederations, this is only
possible if θ is strongly concave in b, respectively B, violating assumption 1 (b).
(b) The value function evaluated at the equilibrium is:
r(b, bΓc) = bΓcΦf (θ(b)− bΓc)
Given m > 1 and (3.10) the impact of an increase in b whilst keeping bΓc fixed is:
rb(b, bΓc) = bΓcφf (θ(b)− bΓc)θb
m(b)> 0
The positivity follows from the properties of φ and assumption 1 (a). Thanks to the envelope
theorem, indirect effects of b on bΓc can be disregarded. 2
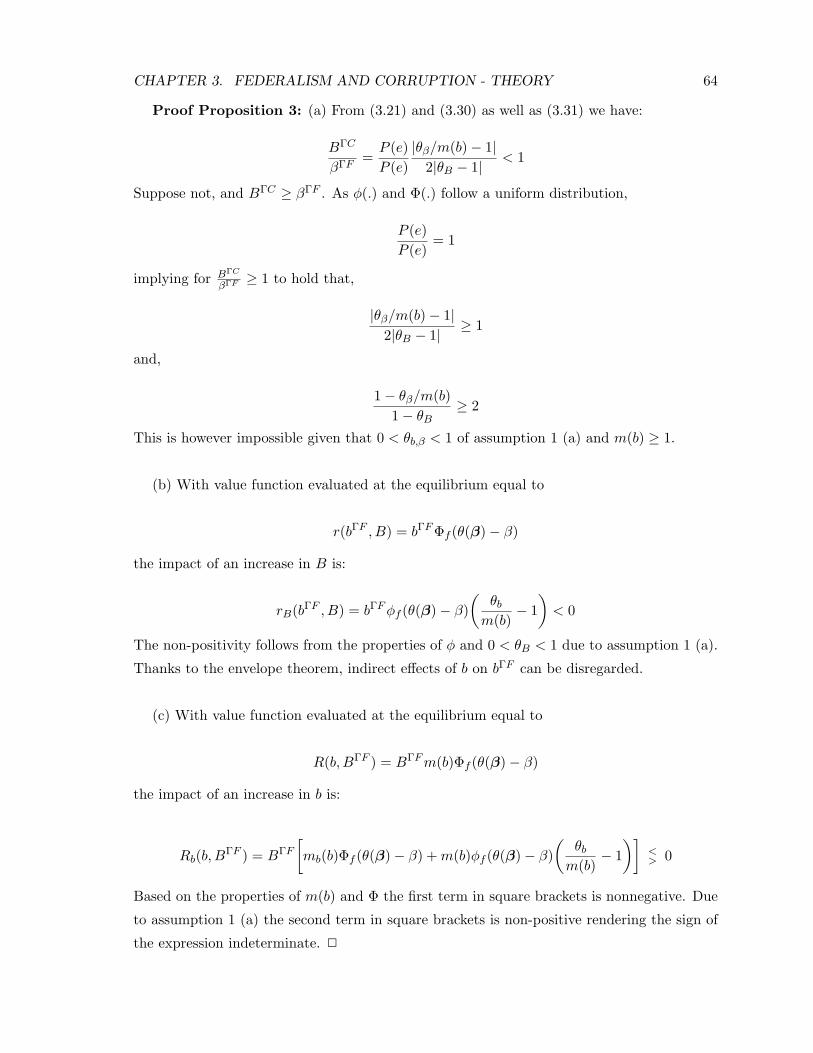
CHAPTER 3. FEDERALISM AND CORRUPTION - THEORY 64
Proof Proposition 3: (a) From (3.21) and (3.30) as well as (3.31) we have:
BΓC
βΓF=
P (e)P (e)
|θβ/m(b)− 1|2|θB − 1|
< 1
Suppose not, and BΓC ≥ βΓF . As φ(.) and Φ(.) follow a uniform distribution,
P (e)P (e)
= 1
implying for BΓC
βΓF ≥ 1 to hold that,
|θβ/m(b)− 1|2|θB − 1|
≥ 1
and,
1− θβ/m(b)1− θB
≥ 2
This is however impossible given that 0 < θb,β < 1 of assumption 1 (a) and m(b) ≥ 1.
(b) With value function evaluated at the equilibrium equal to
r(bΓF , B) = bΓF Φf (θ(β)− β)
the impact of an increase in B is:
rB(bΓF , B) = bΓF φf (θ(β)− β)(
θb
m(b)− 1
)< 0
The non-positivity follows from the properties of φ and 0 < θB < 1 due to assumption 1 (a).
Thanks to the envelope theorem, indirect effects of b on bΓF can be disregarded.
(c) With value function evaluated at the equilibrium equal to
R(b, BΓF ) = BΓF m(b)Φf (θ(β)− β)
the impact of an increase in b is:
Rb(b, BΓF ) = BΓF
[mb(b)Φf (θ(β)− β) + m(b)φf (θ(β)− β)
(θb
m(b)− 1
)]<> 0
Based on the properties of m(b) and Φ the first term in square brackets is nonnegative. Due
to assumption 1 (a) the second term in square brackets is non-positive rendering the sign of
the expression indeterminate. 2

NOTES 65
Notes
18Aidt (2003) provides a recent overview of the literature on corruption structured around a principle-agent
framework.19Tiebout (1956) refers to such geographic substitution somewhat colorfully as ”voting by feet”. In a more
general context, the benefits of decentralisation meanwhile constraining public abuses feature in Brennan and
Buchanan (1977, 1980).20Shleifer and Vishny (1993) refer to the case of various specialised authorities regulating different aspects of
a licensing process like, health, safety, taxes etc. rather than multi-tiered government. The analysis, however,
carries over to the federal-state relationship.21Likewise, tax evasion provides a way to circumvent compulsory taxation. To some degree, avoiding
taxation constitutes a counterpart to corruption as it may be defined as an abuse of private power at the
expense of the public benefit. Indeed, Dreher et al. (2005) suggest corruption and tax evasion, measured by
the size of the shadow economy, to be theoretically and empirically intertwined concepts.22Hence, the term ”officials” can here be interpreted widely including bureaucrats, politicians, or even entire
government authorities.23Whilst investigating the regulation of entry, Djankov et al. (2002) show indeed how corruption systemat-
ically relates to the number, the time, and cost involved in starting up a business without regulation having
any apparent impact upon the provision of public goods.24Compare Besley and McLaren (1993). Aidt (2003) provides an overview of studies taking q as exogenous
as well as attempts to let monitoring quality depend on the history of corruption, e.g. q(b).25Rose-Ackerman (1999) indeed reports numerous examples of bribery involving large public or military
construction projects, administering natural resources, or collecting taxes and duties. Within a theoretical
context, Acemoglu and Verdier (2000) consider a discrete distribution about disguising dishonesty, with types
either talented or untalented in taking bribes.26Compare Bliss and Di Tella (1997) for a similar approach in modeling corruption with a univariate distri-
bution.27This scenario indeed reflects the standard location model of product differentiation (Hotelling’s Beach).28Throughout the exposition, derivatives shall be denoted by subscripts. Meanwhile superscripts relate to
a specific type of official, firm, or constitution.29Considering an additive separable utility function instead - e.g. the linear utility function applied in Besley
and McLaren (1993) or Mookerjee and Png (1995) - removes the indeterminacy meaning paying efficiency wages
decreases the level of monitoring required to prevent misconduct.30Horizontal competition could equally be modeled through firms dislocating across jurisdictions in order
to achieve cost savings (compare Arikan, 2004).31Based on such decisions to engage in malfeasance, classic authors like James Madison have stressed the
importance of selecting representatives upholding virtue into government, alongside monitoring and punish-
ment to prevent endemic corruption. Within this spirit, Besley (2005) provides an approach to the political
economy of selection, motivation, and incentives within a principal-agent context.32See Sanyal et. al. (2000) for a theoretical analysis of the impact of corruption on the shape of the Laffer
curve.33A similar reasoning features in Bliss and Di Tella (1997, pp.1012ff.) albeit their impact upon corruption is
evaluated with regard to bribe-rates rather than rents. The overall effect in respect to bribe-rates is ambiguous
since fiercer competition reduces the sustainable number of firms but moves the marginal firm into a region,
where it is less likely to be pushed into bankruptcy.34An excellent comparative overview of federal systems can be found in Watts (1999). For an early treatment
see Wheare (1956).
NOTES 66
35Examples for the process of aggregation include Austria, Germany, Switzerland, and the United States.
Conversely, the federations of Spain and Belgium have been established more recently by means of a devolution
process.36A formal proof can be found in standard textbooks on microeconomics, e.g. Varian (1999).37For a similar approach see Bliss and Di Tella (1997, pp.1012ff.).

Bibliography
[1] Ades, A. and Di Tella, R. (1997), ’National Champions and Corruption: Some unpleasant
interventionist Arithmetic’, The Economic Journal, vol.107, pp.1023-1042.
[2] Ades, A. and Di Tella, R. (1999), ’Rents, Competition, and Corruption’, The American
Economic Review, vol.89, pp.982-993.
[3] Aidt, T.S. (2003), ’Economic Analysis of Corruption: A Survey’, The Economic Journal,
vol.113, pp.632-652.
[4] Arikan, G.G. (2004), ’Fiscal Decentralization: A Remedy for Corruption?’, International
Tax and Public Finance, vol.11, pp.175-195.
[5] Besley, T. (2005), Principal Agents: Motivation and Incentives in Politics, Book
Manuscript, London School of Economics.
[6] Besley, T. and McLaren, J. (1993), ’Taxes and Bribery: The Role of Wage Incentives’,
The Economic Journal, vol.103, pp.119-141.
[7] Bliss, C. and Di Tella, R. (1997), ’Does Competition Kill Corruption?’, Journal of Po-
litical Economy, vol.105, pp.1001-1023.
[8] Brennan, G. and Buchanan, J.M. (1977), ’Towards a tax constitution for Leviathan,
Journal of Public Economics, vol. 8, pp.255-273.
[9] Brennan, G. and Buchanan, J.M. (1980), The Power to Tax - Analytical foundations of
a fiscal constitution, Cambridge, Cambridge University Press.
[10] Brennan, G. and Buchanan, J.M. (1985), The Reason of Rules - Constitutional Political
Economy. Indianapolis, Liberty Fund.
[11] Djankov, S., La Porta, R., Lopez-De-Silanes, F. and Shleifer, A. (2002), ’The Regulation
of Entry’, The Quarterly Journal of Economics, vol.117, pp.1-36.
[12] Dreher, A., Kotsogiannis, C. and McCorriston, S. (2005), ’How do institutions affect
corruption and the shadow economy?’, Mimeo, Unversity of Exeter.
67

BIBLIOGRAPHY 68
[13] Hendriks, J. and Lockwood, B. (2005), ’Decentralization and Electoral Accountability:
Incentives, Seperation, and Voter Welfare’, unpublished paper.
[14] Keen, M. J. and Kotsogiannis, C. (2002), ’Does Federalism Lead to Excessively High
Taxes?’, The American Economic Review, vol.92, pp.363-370.
[15] Keen, M. J. and Kotsogiannis, C. (2003), ’Leviathan Capital Tax Competition in Fed-
erations’, Journal of Public Economic Theory, vol.5, pp.177-199.
[16] Keen, M. J. and Kotsogiannis, C. (2004), ’Tax competition in federations and the welfare
consequences of decentralization’, Journal of Urban Economics, vol.56, pp.397-407.
[17] Mauro, P. (1995), ’Corruption and Growth’, Quarterly Journal of Economics, vol.105,
pp.681-712.
[18] Mookherjee, P. and Png, I. (1995), ’Corruptible Law Enforcer: How should they be
compensated?’, The Economic Journal, vol.108, pp.145-159.
[19] Rose-Ackerman, S. (1975), ’The Economics of Corruption’, Journal of Public Economics,
vol.4, pp.187-203.
[20] Rose-Ackerman, S. (1978), Corruption - a study in political economy, New York, London
Academic Press.
[21] Rose-Ackerman, S. (1999), Corruption and Government - Causes, Consequences and
Reform, Cambridge, Cambridge University Press.
[22] Sanyal A., Gang, I.N. and Gaswami, O. (2000), ’Corruption, Tax Evation and the Laffer
Curve’, Public Choice, vol.105, pp.61-78.
[23] Shleifer, A. and Vishny, R.W. (1993), ’Corruption’, Quarterly Journal of Economics,
vol.108, pp.599-617.
[24] Tibout, C. (1956), ’A Pure Theory of Local Expenditures’, Journal of Political Economy,
vol.64, pp.416-424.
[25] Treisman, D. (1999), ’Decentralization and Corruption: Why are federal states perceived
to be more corrupt?’, Mimeo, University of California.
[26] Varian, H. (1999), Microeconomic Analysis, New York, W.W. Norton & Company.
[27] Watts, R.R. (1999), Comparing Federal Systems, Montreal & Kingston, McGill-Queen’s
University Press (2nded.).
[28] Wheare, K.C. (1956), Federal Government, London, Oxford University Press (3rded.).

Chapter 4
SECOND ESSAY
Federalism and Corruption - How
does Multi-Tiered Governance
impact upon Government
Misconduct?
Federalism divides public power between tiers of governance and modifies, therefore, an essen-
tial component upon which corruption - defined as an abuse of public power for private benefit
- rests. Due to the countervailing incidence inherent in the horizontal and vertical dimension
of multi-tiered governance, theoretical analysis of the previous essay suggests federalism to
impact upon corruption in a complex manner:
As regards its vertical dimension, federalism implies that more than one government acts
directly and within its sphere of responsibility autonomously upon each citizen entailing the
risk for corrupt overgrasing (Shleifer and Vishny, 1993). Especially, vertical externalities,
which rest on bribes being extracted in an uncoordinated manner across complementary tiers
of governance, may result in relatively endemic corruption. Conversely, in respect to the
horizontal dimension, competition among lower-tiered jurisdictions over a commonly shared
bribe-base provides a remedy against abuses of public power (Arikan, 2004). As suggested
in essay 1, participation decisions taken by government representatives modify these coun-
tervailing horizontal and vertical forces entrenched in the literature on tax competition in
federations (e.g. Keen and Kotsogiannis, 2002, 2003) since, unlike taxation, bribery consti-
tutes a voluntary, albeit illegal, transaction.
Owing to the ambiguous theoretical implications inherent in the mapping of federalism
69

CHAPTER 4. FEDERALISM AND CORRUPTION - EMPIRICAL RESULTS 70
onto corruption, there is scope for empirical testing. In fact, in a cross-country study on the
causes of corruption, Treisman (2000) finds political decentralisation to relate positively to
government misconduct, supporting theories emphasising corrupt overgrasing in federations.
However, results on the effects of fiscal decentralisation (Fisman and Gatti, 2002; Arikan,
2004) argue the converse in the sense that more decentralised countries are less affected by
endemic bribery and nepotism. These findings, thus, provide a puzzle insofar as federalism
and fiscal decentralisation constitute closely intertwined concepts, with effective multi-tiered
governance necessitating distinct tax bases for both regional and general government (see
Watts, 1999, ch.4). Fisman and Gatti (2002, pp.326ff.) attribute the existence of various
types of decentralisation to this puzzle. However, whilst historically grown federations differ
a great deal in the extent of inter-jurisdictional competition, monitoring, and possibilities for
centralised rent-seeking (see Watts, 1999), the exact theoretical and empirical justification
for these countervailing results remains obscure.
Above all, countries do not adopt a federal constitution at random but rather based on
attributes. According to Oates’ (1972) decentralisation theorem the benefits of providing
public goods locally increase with the heterogeneity in tastes and preferences and the size of
territorial subunits allowing to take advantage of economies of scale. On average, federations
indeed exceed other countries in terms of country size, population, and ethnic diversity, which
may represent measures for the heterogeneity in preferences and thereby the desire to provide
public good locally (Panizza, 1999). Countries sharing such attributes, thus, face a higher
probability to draw up a federal constitution. With attributes like ethnic diversity in turn
relating systematically to corruption (Treisman, 2000), significant differences in the level of
corruption between single and multi-tiered countries might simply reflect different underlying
probabilities in adopting federalism rather than genuine corrupt overgrasing - e.g. regressing
federalism (unconditionally) onto a corruption index might introduce a selection bias.
The contribution of the present essay lies in taking the endogenous nature of drawing up
a federal constitution into account meanwhile establishing the empirical mapping between
multi-tiered governance and government misconduct. This calls for econometric methods like
switching regressions or propensity score matching, which identify the probability of adopting
federalism during a first stage, in order to cope with estimation bias introduced by sample
selectivity when evaluating the (conditional) impact of federalism upon corruption during a
second stage.
As regards the first stage, results reveal a close empirical relationship between federalism
and country characteristics like ethnic diversity, economic development, and size in terms of
area and population. After taking into account actual characteristics shared by federations,
the second stage finds federalism to be significantly and negatively related to corruption

CHAPTER 4. FEDERALISM AND CORRUPTION - EMPIRICAL RESULTS 71
coinciding with the impact of fiscal decentralisation. Thus, the benefits of decentralising
political power according to the federal principle seem to prevail over concerns about possible
uncoordinated corrupt overgrasing, once the propensity of adopting federalism constitutes an
integral part of the econometric strategy.
Furthermore, the negative relationship between federalism and corruption holds even if
perception based measures of corruption - like the corruption perceptions index (CPI) -
should reflect a ranking rather than a cardinal index making them somewhat unsuitable in
guiding parametric regressions as dependent variable. In particular, employing propensity
score matching (compare, Heckman et al., 1998; Persson et al., 2003) designed to cope with
both ordinality and sample selectivity as well as a recently developed corruption index based
on a structural model (Dreher et al., 2004), which is therefore more likely to exhibit cardinal
properties, preserves the negative relationship between federalism and corruption.
The remainder of this essay is organised as follows: In order to introduce the variables
and for the sake of comparability, section 4.1 re-estimates the empirical results on the effect
of political and fiscal decentralisation onto corruption featuring in Treisman (2000), Fisman
and Gatti (2002), as well as Arikan (2004) with the current more recent and extended data
set. Section 4.2 discusses the endogenous nature of drawing up a federal constitution and es-
tablishes the relationship between country attributes and the probability to adopt federalism.
Drawing on the estimates of 4.2, the following section 4.3 applies switching regressions re-
spectively propensity score matching methods in order to mitigate against selection bias and
potential ordinality of corruption indicators. Section 4.4 provides some concluding remarks.
4.1 Data and OLS Estimates
In order to introduce the control variables impacting upon corruption, the following repro-
duces the essence of the results featuring in Fisman and Gatti (2002), Arikan (2004), and
Treisman (2000). The present extended and more recent data set contains cross-country
observations averaged predominantly over the years 1999 - 2003. Depending on the specifica-
tion, this allows including between 52 and 116 countries meaning up to about 60 more than
in previous studies. Table 4.1 reports the corresponding results. Precise definitions and the
sources of the variables are deferred to table 4.9 of the appendix.
4.1.1 Dependent Variable: Corruption
From an economic perspective, corruption arises whenever agents entrusted with a public
position abuse their discretionary power to secure rents in a reciprocal exchange with issuing
illegal rights or providing privileged treatment. The reciprocal character of the exchange
contrasts corruption with other economic crimes like fraud or embezzlement. Moreover, the

CHAPTER 4. FEDERALISM AND CORRUPTION - EMPIRICAL RESULTS 72
Table 4.1: Least Squares Regressions
Notes: Specifications reported in columns (1)-(3) refer to Fisman and Gatti (2002), columns (4)- (6) refer to Arikan
(2004), and columns (7)-(9) relate to Treisman (2000). Table 4.9 contains definitions and sources of all variables.
Standard errors are in parentheses. They are heteroscedasticity robust, applying the method of White. Coefficients
significant at the 10% level are labelled with *, at the 5% level with **, and at the 1% level with ***.
Fisman and Gatti (2002) Arikan (2004) Treisman (2000)
(1) (2) (3) (4) (5) (6) (7) (8) (9)
Dep. Variable ICRG CPI CSI ICRG CPI CSI ICRG CPI CSI
Govshare -5.47*** -9.43*** -0.69
(2.31) (2.34) (0.45)
Open -0.5* -0.28 -0.03
(0.26) (0.31) (0.04)
OECD -0.96*** -0.29 -0.06
(0.25) (0.38) (0.05)
Log(GDPPC) -0.35** -0.96*** -0.16*** -0.18 -0.9*** -0.15*** 0.21** -1.05*** -0.1***
(0.14) (0.14) (0.02) (0.18) (0.19) (0.03) (0.09) (0.11) (0.02)
Civil -0.17 -0.26** -0.005
(0.12) (0.12) (0.01)
School 1.4* -1.82** -0.13
(0.73) (0.88) (0.11)
Demage -0.007** -0.008** -0.002**
(0.003) (0.003) (0.001)
Legfra 0.22 0.38* 0.005
(0.17) (0.19) (0.03)
Nevercol 0.02 0.11 -0.09*
(0.19) (0.3) (0.04)
Log(Pop) 0.07 0.15* 0.005
(0.07) (0.09) (0.02)
Ethnic 0.69 0.31 -0.1 0.01 -0.46 -0.04
(0.65) (0.81) (0.1) (0.41) (0.45) (0.06)
Prot -0.006 -0.02*** -0.001
(0.004) (0.005) (0.001)
Intercept 5.86*** 13.94*** 1.52*** 4.93*** 14.35*** 1.56*** 4.48*** 14.48*** 1.01***
(1.6) (1.82) (0.35) (1.19) (1.36) (0.21) (0.8) (0.85) (0.13)
Decentr. (Exp) -2.25** -2.1 -0.45*
(0.93) (1.27) (0.24)
Decentr.(Rev) -2.08* -2.22 -0.53**
(1.14) (1.55) (0.21)
Federal 0.3 -0.19 -0.03 0.33** 0.6** -0.03
(0.25) (0.44) (0.05) (0.16) (0.27) (0.04)
Adj. R2 0.68 0.83 0.84 0.57 0.75 0.82 0.64 0.82 0.8
N 54 63 52 54 62 53 101 116 100
element of crime distinguishes corruption from rent-seeking activities like lobbying, which do
not impair prevailing rules. In particular, its clandestine character provides parties involved
in bribery with every incentive to disguise their conduct making it virtually impossible to
obtain reliable direct measures on the extent of corruption. Nonetheless, two ways have been
proposed in order to indirectly extract comparative information about the relative extent of

CHAPTER 4. FEDERALISM AND CORRUPTION - EMPIRICAL RESULTS 73
corruption around the world. Columns (1) to (3) of table 4.2 contain an overview of the
resulting corruption indices across the counties of the current sample:
Perception based indices result from a rating by various surveyed groups like investors,
country analysts, or the general public as regards their appraisal of the extent of bribery
within a country. These include the corruption perception index (CPI), which is most widely
used in empirical work and compiled by Transparency International - a NGO dedicated to
fighting corruption - by drawing together at least three surveys on corruption around the
same mean and variance on a scale from 1 to 10.38 Among else, the CPI comprises the
corruption survey of the Global Competitiveness Report of the World Economic Forum,
the World Competitiveness Yearbook of the Institute for Management and Development in
Lausanne, the World Business Environment Survey of the World Bank, and the International
Country Risk Guide of the Economists’ Intelligence Unit. On its own, the index published
by the International Country Risk Guide (ICRG) reflects an experts’ assessment on a scale
from 0 to 5. Where necessary, indices have been reversed such that higher values mean more
endemic corruption.
The caveat against survey based techniques lies in their subjective nature as culture might
shape attitudes towards corruption, and current perceptions are likely to overreact towards
scandals involving bribery.39 In essence, perception based indices provide an ordinal ranking
rather than a cardinal measure of corruption around the world.40 In fact, the scores attached
to perceptions translate neither into information on the actual extent of corruption nor into
any other associated cardinally measured economic variable. E.g. a doubling of the CPI does
by no means represent a doubling in the extent of bribery. The ordinal character of percep-
tion based indices reduces their information content and renders them somewhat unsuitable
in guiding OLS regressions, since linear regressions treat the difference between a CPI score of
5 and 6 the same as the difference between 4 and 5, whereas in fact they represent, possibly,
only a ranking.
In order to mitigate against ordinality, Dreher et al. (2004) have recently extracted a
latent measure of corruption embedded in a structural model. This structural corruption
index (CSI) exploits the causes and consequences of bribery by means of the Multiple In-
dicators Multiple Causes technique (MIMIC). Then, differences across index scores relate
to underlying causal and consequential variables, most of which exhibiting cardinal prop-
erties.41 Nevertheless, difficulties in attributing an interpretation to the level of the index
remain, which is reflected in the fact of scores having been normalised around a reference
value of 0.
As reported in table 4.1, in terms of direction of impact the results of previous studies

CHAPTER 4. FEDERALISM AND CORRUPTION - EMPIRICAL RESULTS 74
Table 4.2: Corruption and Decentralisation Data
Federations
Country Corruption Fisc. Dec. Country Corruption Fisc. Dec.
ICRG CPI CSI Rev. Exp. Prop. ICRG CPI CSI Rev. Exp. Prop.
Argentina 2.7 6.9 0.09 0.32 0.38 0.243 Mexico 3.1 6.5 0.18 0.2 0.2 0.712
Australia 1 1.4 -0.26 0.28 0.41 0.520 Nigeria 4 8.6 0.33 NA NA 0.486
Austria 1 2.2 -0.49 0.27 0.3 0.069 Pakistan 3.9 7.6 0.29 NA NA 0.472
Belgium 1.3 3.5 -0.41 0.06 0.12 0.462 Russia 3.2 7.6 NA 0.4 NA 0.682
Brazil 2.6 6 0.23 0.25 0.34 0.933 South Afr. 1 5.2 0.18 NA 0.24 0.927
Canada 0 1 -0.26 0.52 0.57 0.997 Spain 1.7 3.1 -0.14 0.15 0.24 0.674
Ethiopia NA 6.9 NA 0.02 0.02 0.021 Switzerland 0.2 1.4 -0.90 0.46 0.51 0.706
Germany 0.5 2.4 -0.51 0.35 0.41 0.743 USA 1.1 2.4 -0.46 0.4 0.44 0.999
India 3.4 7.2 0.29 0.33 0.46 0.550 Venezuela 3 7.4 0.21 0 NA 0.160
Malaysia 2 5 0.07 0.16 0.19 0.509 Yugoslavia NA 8.1 NA NA 0.76 0.372
Other Countries
Albania 2.5 7.6 NA 0.02 0.2 2E-04 Kuwait 3.2 4.7 -0.12 NA NA 0.049
Algeria 2.8 7.4 0.30 NA NA 0.041 Kyrgyzstan NA 7.9 NA NA NA 0.009
Angola NA 8.3 NA NA NA 0.085 Laos NA NA NA NA NA 0.003
Armenia NA 7.3 NA NA NA 4E-05 Latvia NA 6.5 NA 0.19 NA 0.021
Azerbaijan NA 8.2 NA NA NA 3E-04 Lebanon NA 7 NA NA NA 1E-04
Bahamas 3.6 NA -0.02 NA NA 0.002 Lesotho NA NA NA NA NA 5E-05
Bahrain 2.3 3.9 -0.01 0.02 0.03 0.002 Liberia NA NA NA NA NA 0.006
Bangladesh 4.4 9 0.29 NA NA 0.001 Lithuania NA 5.6 NA 0.22 NA 0.004
Barbados NA NA 0.10 NA NA 2E-05 Madagascar 2 7.9 0.31 0.05 NA 0.037
Belarus NA 5.9 NA 0.28 NA 0.011 Malawi 2.8 6.6 0.31 NA NA 0.002
Benin NA NA 0.29 NA NA 0.007 Maldives NA NA NA NA NA 7E-05
Bhutan NA NA NA NA NA 4E-04 Mali 3.6 7 0.29 NA NA 0.013
Bolivia 3.5 7.7 0.25 0.18 0.18 0.075 Malta 2.1 NA 0.03 NA NA 6E-06
Botswana 2.4 4 0.26 NA NA 0.015 Mauritania NA NA NA NA NA 0.003
Bulgaria 2 6.3 0.28 0.16 0.19 0.009 Mauritius NA 5.4 0.18 0.01 NA 4E-04
Burkina F. NA 7 NA NA 0.03 0.008 Moldava NA 7.4 NA NA NA 0.001
Burundi NA NA NA NA NA 1E-05 Mongolia NA 5.7 NA 0.27 0.37 0.001
Cambodia NA NA NA NA NA 3E-04 Morocco NA 6.1 0.24 NA NA 0.041
Cameroon 3 8.1 0.28 NA NA 0.137 Mozamb. NA 7.2 NA NA NA 0.010
Cap Verde NA NA NA NA NA 3E-05 Namibia 1.8 4.7 0.29 NA NA 0.055
C. Afr. Rep. NA NA 0.32 NA NA 0.010 Nepal NA NA NA NA NA 0.011
Chad NA NA 0.31 NA NA 0.023 Netherl. 0 1.1 -0.51 0.07 0.25 0.032

CHAPTER 4. FEDERALISM AND CORRUPTION - EMPIRICAL RESULTS 75
Table 4.2 Continued
China 2.4 6.6 0.23 NA NA 0.468 New Zealand 0.2 0.6 -0.20 NA NA 0.211
Columbia 3.3 6.6 0.25 0.19 0.29 0.357 Nicaragua 1.1 7.4 0.25 0.08 0.07 6E-04
Comoros NA NA NA NA NA 1E-07 Niger 3.4 NA 0.28 NA NA 0.005
Congo, D. Rep. 3 NA 0.32 NA NA 0.059 Norway 0.2 1.2 -0.53 0.22 0.33 0.066
Congo, Rep. 3 7.8 0.29 NA NA 0.026 Oman 3 3.7 0.12 NA NA 0.016
Costa Rica 1 5.2 0.21 0.03 0.03 0.001 Panama 4 6.6 0.13 0.02 0.02 0.010
Cote d’Iv. NA 7.5 0.27 NA NA 0.105 Papua New G. 2.9 7.9 0.26 NA NA 0.001
Cyprus 1.5 3.9 -0.07 NA NA 4E-04 Paraguay 4.2 8.2 0.24 0.03 0.04 0.001
Czech Rep. 1.9 5.9 0.09 NA NA 0.032 Peru 3 5.9 0.22 0.07 0.18 0.384
Denmark 0 0.3 -0.52 0.31 0.44 0.033 Philippines 3.3 7.1 0.24 NA NA 0.009
Djibouti NA NA NA NA NA 0.001 Poland 1 6 0.26 0.15 0.23 0.035
Dom. Rep. 2.8 6.7 0.27 0.01 0.03 0.004 Portugal 1.1 3.5 -0.04 0.07 0.1 0.006
Ecuador 2.9 7.7 0.27 NA NA 0.073 Romania 2.3 7.1 0.30 0.09 0.13 0.016
Egypt 3.1 6.7 0.28 NA NA 0.010 Rwanda NA NA NA NA NA 4E-05
Eq. Guinea NA NA NA NA NA 7E-05 Saudi Arabia 4 5.5 NA NA NA 0.154
Estonia NA 4.4 NA 0.21 NA 0.009 Senegal 3 6.8 0.27 NA NA 0.012
Fiji NA NA NA NA NA 0.002 Sierra Leone 4.6 7.8 0.30 NA NA 0.003
Finland 0 0.2 -0.39 0.32 0.39 0.097 Singapore 2 0.8 -0.35 NA NA 0.015
France 0.9 3.4 -0.43 0.12 0.19 0.358 Slovak Rep. 2.2 6.3 0.22 NA NA 0.005
Gabon 4.8 NA NA NA NA 0.064 Solomon Is. NA NA NA NA NA 3E-06
Gambia NA 7.5 NA 0.04 0.03 2E-04 Sri Lanka 2.8 6.5 0.26 0.04 0.03 0.006
Georgia NA 7.8 NA NA NA 0.003 Sudan NA 7.7 NA NA NA 0.151
Ghana 2.8 6.5 0.32 NA NA 0.031 Suriname NA NA NA NA NA 0.004
Greece 1 5.5 0.02 0.03 0.04 0.019 Swaziland NA NA NA NA NA 2E-05
Grenada NA NA NA NA NA 4E-06 Sweden 0 0.7 -0.47 0.33 0.36 0.115
Guatemala 3.6 7.3 0.24 0.05 0.04 0.010 Syria 2.6 6.6 0.33 NA NA 0.009
Guinea NA NA NA NA NA 0.016 Tajikistan NA 8.2 NA NA NA 0.001
Guinea-Bissau 4 NA 0.35 NA NA 2E-04 Tanzania 2.1 7.6 NA NA NA 0.058
Haiti 4.4 8.2 0.26 NA NA 1E-05 Thailand 3 6.8 0.14 0.05 0.08 0.729
Honduras 4 7.6 0.27 NA NA 1E-05 Togo 4 NA 0.30 NA NA 0.001
Hong Kong 1 2.1 -0.39 NA NA 0.002 Trin. and Tob. 3 5.1 0.13 0.03 0.04 0.012
Hungary 1 4.9 0.20 0.12 0.21 0.009 Tunisia 3 5 0.20 0.02 0.05 5E-04
Iceland 0 0.7 -0.33 0.23 0.23 0.002 Turkey 2.9 6.5 0.23 NA NA 0.100
Indonesia 3.6 8.2 0.18 0.03 0.11 0.778 Turkmenistan NA NA NA NA NA 0.003
Iran 2.5 7 0.29 0.04 0.04 0.557 Uganda 3.2 7.9 0.29 NA NA 0.174
Ireland 1.2 2.6 -0.20 0.09 0.24 0.025 Ukraine NA 7.8 0.30 NA NA 0.108
Italy 2.4 4.9 -0.22 0.07 0.22 0.197 Utd. Arab E. 3.8 4.8 NA NA NA 0.360
Israel 1.1 2.9 -0.09 0.07 0.11 0.053 United Kd. 1.1 1.4 -0.29 0.13 0.25 0.386
Jamaica 3.4 6.1 0.22 NA NA 0.001 Uruguay 3 5 0.14 0.1 0.09 0.004
Japan 1.1 3.3 -0.87 NA NA 0.674 Uzbekistan NA 7.6 NA NA NA 0.014
Jordan 2.3 5.4 0.21 NA NA 0.008 Vanutu NA NA NA NA NA 1E-06
Kazakhstan NA 7.5 NA NA NA 0.414 Vietnam NA 7.5 NA NA NA 0.004
Kenya 3.1 8 0.28 NA NA 0.206 Zambia 2.9 7.1 0.32 0.05 0.04 0.069
Korea, Rep. 1.7 5.8 -0.04 NA NA 0.049 Zimbabwe 2.5 7 0.29 0.17 0.19 0.004

CHAPTER 4. FEDERALISM AND CORRUPTION - EMPIRICAL RESULTS 76
are reasonably robust towards employing alternative measures of corruption. This is not
surprising given that the pairwise correlations between ICRG, CPI and CSI lie between 0.74
and 0.85. Yet, aside from maybe economic development (GDPPC) and democratic rule
(DEMAGE), the choice about the corruption index may determine whether or not a variable
is deemed to impact significantly upon bribery.
4.1.2 Control Variables
Meanwhile establishing the interrelationship between fiscal and political decentralisation and
corruption, economic, institutional, historical, and social variables of the second panel of ta-
ble 4.1 control for spurious correlations. Treisman (2000) provides a comprehensive study on
the empirical factors causing countries to be more corrupt.
The size of government in terms of public expenditure as a share of GDP (GOVSHARE)
controls for the amount of resources potentially subject to public abuse. Yet, GOVSHARE
produces a negative entry meaning that empirical results do not suggest that a bigger public
sector inevitably entails more corruption. Indeed, Scandinavian countries regularly top the
list of the least corrupt countries despite their vast public sector. However, current data on
the size of government relate to the 1980ies and 90ies and might, therefore, not yet reflect the
impact of economic deregulation undergone by the public sector in many countries during
the 1990ies.
Countries sharing a commitment to a decentralised economic system based on market
exchange typically experience lower levels of government misconduct, since economic rents
tend to erode on competitive markets undermining one pillar upon which corrupt exchanges
rest. Ades and Di Tella (1999) employ trade openness (OPEN) to capture this impact of
competitive markets upon corruption. Likewise, OECD membership involves a commitment
to establish and maintain institutions underlying market based economies and provides an
alternative measure to control for competitive markets.
Economic development measured by logarithmic GDP per capita (GDPPC) impacts sig-
nificantly negative upon corruption. The causality of this relationship remains yet obscure
insofar as corruption might prevent economic development, e.g. via impeding foreign direct
investment (see essay 3), or only developed countries being in a position to afford institutions
necessary to constrain government misconduct (Mauro, 1995).
Institutional quality is widely reflected by the index of civil liberties (CIVIL) ascribed
to Gastil with values between 1 (least freedom) and 7 (most freedom). In particular, in-
stitutional features like a free press and the freedom to set up political associations might
provide a monitoring device to denounce corrupt behaviour and thereby open up ways for
provoking scandals. Likewise, education measured by school enrollment on the secondary

CHAPTER 4. FEDERALISM AND CORRUPTION - EMPIRICAL RESULTS 77
level (SCHOOL) might provide citizens with the knowledge to challenge government miscon-
duct. None the less, empirically CIVIL and SCHOOL fail to produce consistently significant
coefficients.
Moreover, long established democratic rule (DEMAGE) fosters institutions dedicated to
transparency and accountability by means of fair and free elections. As such, the significantly
negative entry of DEMAGE can be interpreted in a similar manner as the entry of CIVIL.
La Porta et al. (1999) suggest that, compared with common law, countries with a French
colonial heritage and consequently adopting French civil law (LEGFRA) tend to experience
a relatively worse protection of (property) rights and ultimately higher levels of corruption.42
This hypothesis only finds support with the CPI as dependent variable. However, results
based on the CSI suggest countries never subject to colonial rule (NEVERCOL), and there-
fore governed within a relatively stable institutional setting, to suffer significantly less from
corruption.
The size of a country measured in terms of population (POP) constitutes a potential
source for spurious correlation not least because of its correlation with the extent of fiscal
decentralisation. Equally, POP could reflect economics of scale in providing public goods
including efforts to prevent corrupt abuses (Treisman, 1999).
Fearon and Laitin (1996) present and argument that local ethnic communities act as a
social control mechanism exerting informal sanctions against members betraying their co-
ethics. Theoretically, this suggests a negative relationship between ethnic diversity and cor-
ruption. However, when measured by the probability that two persons drawn at random
from a countries population belong to different ethnicities (ETHNIC), this hypothesis does
not find widespread empirical support.
The share of the population affiliated to protestant beliefs (PROT) impacts negatively
upon corruption. Possible explanations lie in the non-hierarchical, or decentralised, charac-
ter of Protestant institutions shaping a culture of challenging agents entrusted with public
power together with Protestants traditionally having a supportive attitude towards state and
government.
4.1.3 Decentralisation
As regards the impact of variables pertaining to decentralisation, which are reported in the
bottom panel of table 4.1, recall that decentralisation is not exogenous but constitutes rather
an endogenous choice variable about the structure of governance. Thus, corresponding OLS
estimates might suffer from selection bias and be misleading. Therefore, they serve here only
as an indicative result.
Alternative measures of fiscal and political decentralisation do not impact upon corrup-

CHAPTER 4. FEDERALISM AND CORRUPTION - EMPIRICAL RESULTS 78
tion in a coherent manner: Fiscal decentralisation measured by the share of government
expenditure, respectively revenue, undertaken by sub-national units enters negatively and
widely significantly in regressions explaining corruption. This reflects, in essence, the results
reported in Fisman and Gatti (2002), as well as Arikan (2004). However, due to a lack of
data on fiscal decentralisation, which are only available from the 1980ies up to the beginning
of the 1990ies, these results include merely more than 60 countries. Conversely, introducing
an indicator variable for federal countries in OLS regressions suggests that federations are
perceived to be more corrupt (Treisman, 2000, pp.430ff.), which could be attributed to cor-
rupt overgrasing.
Federations almost always earmark distinct tax bases to each tier (Watts, 1999, ch.4) and
design arrangements of financial transfers in order to enable jurisdictions to exercise their
constitutionally assigned responsibilities as well as to smooth out vertical and horizontal
imbalances. According to the data of table 4.2, for the period 1980 to 1995, the share of sub-
national government expenditure and revenue in federations exceeds other countries, where
fiscal decentralisation averages only 16% respectively 11%, by about 15 percentage points.
Moreover, federations like Canada, India, Switzerland, or the United States top the list of
the most fiscally decentralised countries with local revenue and expenditure lying above 50%
of the corresponding total. Insofar as fiscal and political decentralisation constitute closely
intertwined concepts, their countervailing impact upon corruption featuring in Fisman and
Gatti (2002) respectively Treisman (2000) provides a puzzle. However, the OLS framework
employed to obtain these results, might not be suitable when federalism is not an exogenous
variable, meaning there is some interdependence between adopting multi-tiered governance,
the extent of corruption, and control variables. Indeed, Treisman (2000) speculates about
the impact of federalism upon corruption:
”Could that apparent relationship be caused by some third factor correlated with
both federal structure and corruption? Federalism is often viewed as accommo-
dation to ethnic diversity [...]. It might be that countries with larger areas or
populations are both more likely to be federal and to be relatively more corrupt
(perhaps because their economies are less exposed to competition from imports).”
(p.432)
Therefore, the econometric strategy employed during the remainder will go beyond the
OLS framework. In order to control for the potential endogenous nature of multi-tiered
governance, at first country attributes need establishing, which increase the propensity to
draw up a federal constitution.

CHAPTER 4. FEDERALISM AND CORRUPTION - EMPIRICAL RESULTS 79
4.2 Endogenous Federalism
4.2.1 Federations around the World
Federalism refers to a structure of government, ”which has been formed for common pur-
pose, but in which the member states retain a large measure of their original independence”
(Wheare, 1956, p.1). The key principle lies in a division of power over a territory, so that gen-
eral and regional authorities are not subordinate to one another, but within typically consti-
tutionally assigned spheres, coordinate and autonomous aiming to achieve a balance between
unity and diversity. Following Treisman (2000), countries sharing such a combination between
shared-rule and self-rule include: Argentina, Australia, Austria, Belgium, Brazil, Canada,
Germany, India, Malaysia, Mexico, Nigeria, Pakistan, Russia, Spain, Switzerland, the United
States, and Venezuela. As reported in table 4.2, additional federations included in the present
extended sample are Ethiopia, South Africa,43 and Serbia and Montenegro as residual of the
former Federal Republic of Yugoslavia. Notably, these 20 federations encompass highly de-
veloped and underdeveloped countries and locate on all continents. Nevertheless, compared
with other countries, table 4.3 uncovers systematic differences with typical federations being
wealthy countries with a large population and territory. Furthermore, multi-tiered gover-
nance can be designed in order to cope with the heterogenous preferences of an ethnically
diverse population, albeit, within the present sample, the corresponding mean-difference fails
to be statistically significant.
Table 4.3: FederationsNotes: According to whether or not a country is a federation, this table shows averages in the mean
of specific attributes. Significant mean-differences at the 10% level are labelled with a *, at the 5%
level with **, and at the 1% level with ***.
Attribute Ethnic Diversity GDP per capita Land Surface Population
Unit Share US$(1995) Km2 Integer
Mean Federations 50.64 13’132 3’117’534 102’865’807
Mean other Countries 43.31 5’790 364’788 19’700’256
t-test 1.22 2.99*** 7.25*** 3.3***
4.2.2 Federalism and Selection Bias
Similarities across federations suggest countries to adopt multi-tiered governance according
to a set of attributes rather than by historical accident. The corresponding selection process
might introduce considerable selection bias in OLS regressions when some country character-
istics condition on both their probability to become a federation and the extent of corruption.
To see this, let CM and CS represent the vector of corruption indices pertaining to countries
with multi -tiered respectively single-tiered governance. Correspondingly, the indicator vari-
able F = 1, respectively F = 0, designates the actual choice about federalism with countries

CHAPTER 4. FEDERALISM AND CORRUPTION - EMPIRICAL RESULTS 80
selecting themselves into the set M with politically decentralised jurisdictions respectively
S containing other countries, where political power is centralised on a single tier. Whether
or not a country adopts multi-tiered governance conditions systematically on attributes de-
noted by the set Z, which overlaps with covariates X impacting upon the extent of corruption,
Z ∩ X 6= ∅. The problem at hand consists of establishing the expected mean difference, τ ,
in the extent of corruption of single-tiered countries, would they undertake constitutional
reform towards multi-tiered governance - e.g. a change from F = 0 to F = 1 - conditional on
covariates X:
τ |F=1 = E[CS |X, F = 1]− E[CS |X, F = 0] (4.1)
However, meanwhile estimating (4.1) a missing data problem emerges since every country
can only be observed under one government structure at a time C(.) = (1−F )CS +FCM , e.g.
the first term on the right hand side is latent. A ”solution” to this problem consists of simply
replacing E[CS |X, F = 1] with the expected mean of actual federations E[CM |X, F = 1].
Then again, attributes Z entailing countries with F = 0 and F = 1 not to constitute exact
counterfactuals, give rise to a selection bias:
B(Z) = E[CM |X, F = 1]− E[CS |X, F = 1] (4.2)
Such selection bias can be circumvented by recognising that the endogenous choice of feder-
alism relates to corruption within the following system of structural equations:
Federalism F ∗ = G(Z) + µ∗ (4.3)
Corruption C∗ = H(F,X∗) + ε∗ (4.4)
Based on this econometric system of equations, the present analysis aims at evaluating the
impact of F on C, e.g. the mean effect of adopting multi-tiered governance onto corruption.
Features worth noting within this econometric model are twofold: Firstly, since each coun-
try can actually only be observed under one government structure at a time, some variables
remain unobserved, or latent, as denoted by a *. Notably, this applies to the federalism
selection equation, where F ∗ can be seen as the latent difference in social utility in respect
to multi-tiered governance, which after the decentralisation theorem (Oates, 1972) depends
on factors like the heterogeneity of preferences, price elasticity of demand, or scale economies
in respect to the provision of local public goods. Secondly, federalism and the extent of
corruption inter-depend within a system of structural equations. Thus when disregarding
(4.3), a selection bias B(Z) might arise. Confining estimation to (4.4) by means of OLS
like in Treisman (2000) or Fisman and Gatti (2002) introduces in turn the following implicit
assumptions (compare Persson and Tabellini, 2004, pp.30ff.):

CHAPTER 4. FEDERALISM AND CORRUPTION - EMPIRICAL RESULTS 81
Recursivity: Corruption is independent of attributes Z conditional on the choice about
federal governance C ⊥ Z|F .
Linearity: H is a linear relationship, so the only effect of F occurs on the intercept of H.
Cardinality: C is cardinal meaning sectioning the underlying scale into regular intervals
allows attaching a meaningful interpretation to the length of subsequent intervals.
As regards the assumption of recursivity, adopting the federal principle seems rather a
deliberate - or in statistical terms non-random - choice made when countries draw up or
amend their constitution. Due to the heterogenous probabilities to be drawn into the set M
with multi-tiered governance, econometric methods robust towards relaxing the assumption
of recursivity at first necessitate to establish the set of attributes Z, which, after (4.3),
determine the probability of a country to adopt federalism.44
4.2.3 Attributes to adopt Federalism
After Wheare (1956, p.35) ”federal government is rare because its prerequisites are many”.
This subsection endeavours nevertheless to establish some attributes Z impacting systemat-
ically upon federal regime choice, which has to my knowledge not been attempted before.45
Estimation occurs by means of binary choice models based on the actual adoption of federal
constitutions, which link up with the corresponding latent process (4.3) through the following
index function:
F =
1 if F ∗ = Zα + µ > 0 Federations
0 if F ∗ = Zα + µ ≤ 0 Otherwise(4.5)
Considering F instead of F ∗ as well as assuming the stochastic component to be logistically
distributed, µ ∼ λ(Zα), allows calculating the results of the Logit regressions reported in
table 4.4.46
Attributes inclining a country to become a federation encompass ethnic diversity, economic
development, size in terms of land-surface and population, as well as legal origin:
The nexus between heterogenous preferences and the desire for decentralised decision
making stands crucial in Oates’ (1972) decentralisation theorem. When ethno-linguistic
communities diverge as regards tastes about public goods provision, ethnic fractionalisation
(ETHNIC) - measured by the probability that two persons drawn from a countries popula-
tion belong to different ethnicities - provides a proxy for heterogenous preferences (Panizza,
1999), which in turn creates a desire for federalism allowing to tailor the level of local public
goods and regulations to communities’ tastes.47 Indeed, figure 4.1 shows an exponential in-
crease in the propensity to adopt a federal constitution for ethnically more diverse countries.

CHAPTER 4. FEDERALISM AND CORRUPTION - EMPIRICAL RESULTS 82
Table 4.4: Logit Regressions onto FederationsNotes: The dependent variable is FEDERAL. Table 4.9 contains descriptions and sources
of all variables. Results have been calculated by means of a Logit regression. Standard
errors are in parentheses. They are heteroscedasticity robust, applying the method of White.
Coefficients significant at the 10% level are labelled with *, at the 5% level with **, and at
the 1% level with ***.
(1) (2) (3) (4)
Ethnic 0.05*** 0.07*** 0.07*** 0.08***
(0.02) (0.02) (0.02) (0.02)
Log(GDPPC) 1.16*** 1.21*** 1.34*** 1.57***
(0.33) (0.25) (0.32) (0.43)
Log(Land) 0.87*** 0.37 0.55**
(0.20) (0.27) (0.28)
Log(Pop) 1.21*** 0.96*** 1.03***
(0.24) (0.28) (0.29)
Legfra -0.87
(0.76)
Intercept -24.8*** -34.86*** -36.68*** -42.44***
(4.81) (6.08) (7.42) (9.00)
McFadden R2 0.37 0.45 0.47 0.53
N 168 167 164 160
Furthermore, a large population (POP ) entails, typically, a large number of jurisdictions and
potentially diverse preferences about the quantity and quality of public goods. Similar to
cultural distance in terms of ethnic diversity, geographic distance in terms of a large land sur-
face (LAND) tends to isolate communities and fosters diversity and regional consciousness,
which underlies the preponderance of countries with a large territory among federations.
On an international level, the entry of the first three variables of table 4.4 coincide with
the outcome of Strumpf and Oberholzer-Gee (2002), who find for the case of liquor control
in American states that more religious diversity a larger population as well was land area
create a desire for delegating the power to prohibit the consumption of alcohol to the local
(county) tier.
Meanwhile, multi-tiered governance imposes a considerable cost burden on countries’ re-
sources through inevitably overlapping responsibilities and foregoing economies of scale in
supplying and administering (national) public goods. As the ”luxury” of federalism, and
the benefits thereof, apparently exhibit properties of a normal good, economic development
(GDPPC) enters the Logit regression with a positive coefficient.
Finally, legal institutions originating in the civil rather than common law tradition favour
centralised governance with centrally enacted statutes being valid over the entire territory.
Empirically, this relationship applies in particular to countries with French (LEGFRA) rather
than German legal heritage (Fisman and Gatti, 2002, p.337). Although failing to produce a
significant impact upon the choice about federalism, LEGFRA enters (4.5) with the expected
negative sign and according to figure 4.1 decreases the probability to adopt multi-tiered gov-

CHAPTER 4. FEDERALISM AND CORRUPTION - EMPIRICAL RESULTS 83
Figure 4.1: Probability Response of Adopting Federalism towards Ethnic Diversity and
French Legal Origin
.0
.1
.2
.3
.4
.5
0 10 20 30 40 50 60 70 80 90 100
Ethnic Diversity (%)
Pro
pensity for
Federa
lism
French Law
Other Law
ernance up to a considerable 20 percentage points.
Further specifications than those of table 4.4 have been used to estimate the choice of
adopting federalism. In particular, federations must reach some minimal consensus on po-
litical governance to safeguard the autonomy of jurisdictions. Indeed, the constitutions of
the United States and Switzerland require states respectively cantons to be republics and
Australia as well as Canada prescribe constitutional monarchy as form of government to
all provinces. However, some federations only impose weak democratic institutions and the
causality might run from federalism to democratic rule instead. Therefore, table 4.4 does
not include control variables such as DEMAGE. Furthermore, POP could be divided by
LAND to obtain a more parsimonious model with population density as covariate. However,
the propensity of a country to adopt multi-tiered governance relates, as noted earlier, rather
to absolute country size. Correspondingly, population density did not produce a significant
entry in (4.5). Above all, considering alternative specifications of (4.5) that include covariates
on democratic rule and population density did not overturn the essence of the undermen-
tioned results.
Based on equation (4.5), the probability P (Z) of countries with attributes Z to adopt
federalism - henceforth referred to as propensity score - can be inferred via the coefficients in
column (4) of table 4.4 since:

CHAPTER 4. FEDERALISM AND CORRUPTION - EMPIRICAL RESULTS 84
P [F ] = P [F ∗] = P [Zα− µ > 0] = P [µ > −Zα] = 1− Λ[Zα] (4.6)
Table 4.2 reports resulting propensity scores for federal and other countries. The probabil-
ity to adopt multi-tiered governance ranges from less 1% to over 99% with propensity scores in
federations averaging 56% exceeding those of other countries by about 50 percentage points.
4.3 Federalism and Corruption: Results from Models with
Endogenous Selection of Federalism
Against the background of different countries facing different propensities to be drawn into
the set M containing federations, the expected extent of corruption, E[C|X, Z], conditions
on both the set of covariates, X, but also the set containing attributes, Z, which impact upon
the choice about adopting multi-tiered governance F . Hence, adopting the federal principle
is a deliberate - or in terms of statistical theory non-random - choice made when countries
draw up or amend a constitution. Unless the assumption of recursivity holds (Persson and
Tabellini, 2004), robust inference between federalism and corruption necessitates the usage
of a two-stage procedure:
The first stage establishes propensity scores, P (Z), as reported in table 4.2, which assign
probability weights reflecting the endogenous choice about federalism according to (4.3).
Taking into account propensity scores, the second stage evaluates the conditional expectation
of corruption as regards political decentralisation along the lines of (4.4). Thereto, the set
of covariates X includes ETHNIC, GDPPC, DEMAGE, LEGFRA, OPEN , POP , and
PROT coinciding widely with the theoretically underpinned control variables employed in
Treisman (2000) as well as Fisman and Gatti (2002) (see section 4.1). Note that the set of
covariates X and the attributes of federal countries Z partly overlap but also contain separate
variables such as OPEN , PROT , or LAND to identify the equations onto corruption (4.4)
respectively the choice about multi-tiered governance (4.3).
Table 4.5 provides corresponding summary statistics and pairwise correlations across the
common sample containing 88 countries (to save space, the statistics of nominal variables
have been dropped from table 4.5).
The present employs switching regressions, which parameterise the stochastic error ε∗
into a normal distribution as well as nonparametric propensity score matching, to guard
against the endogenous nature of federalism meanwhile establishing the empirical mapping
of federalism onto corruption.

CHAPTER 4. FEDERALISM AND CORRUPTION - EMPIRICAL RESULTS 85
Table 4.5: Summary StatisticsICRG CPI CSI Demage Ethnic L.(Gdppc) L.(Land) Open L.(Pop) Prot
Unit Index Index Index Years % US$(1995) Km2 % Integer Percent
Mean 2.4 5.8 0.08 21.8 0.44 7.63 11.14 0.68 15.33 17.2
Std. 1.2 2.2 0.26 36.4 0.26 1.59 2.78 0.39 2.06 23.41
Min. 0 0.2 -0.9 0 0 4.54 2.99 0.16 10.63 0
Max 4.8 9 0.35 200 0.93 10.97 16.64 2.83 20.9 89.5
N 105 136 106 173 188 178 199 178 191 187
Correlation Matrix
(Based on 88 Common Observations)
ICRG CPI CSI Demage Ethnic L.(Gdppc) L.(Land) Open L.(Pop) Prot
CPI 0.84
CSI 0.74 0.86
Demage -0.64 -0.65 -0.70
Ethnic 0.43 0.47 0.48 -0.25
L.(Gdppc) -0.77 -0.88 -0.87 0.62 -0.59
L.(Land) 0.09 0.23 0.20 0.08 0.23 -0.20
Open -0.21 -0.30 -0.20 -0.02 -0.07 0.25 -0.59
L.(Pop) 0.14 0.25 0.04 0.09 0.05 -0.13 0.61 -0.33
Prot -0.47 -0.46 -0.39 0.41 -0.13 0.27 0.06 -0.07 -0.22
4.3.1 Switching Regression
In order to relax the assumption of recursivity (see section 4.2.2), switching regressions48
separate the corruption equation (4.4) into linear versions pertaining to federations with
multiple tiers (M) respectively single-tiered countries (S), which are supposed to be guided
by different conditional distributions:
F =
1 if F ∗ = Zα− µ > 0 Federations
0 if F ∗ = Zα− µ ≤ 0 Otherwise(4.7)
CM = XβM + εM if F = 1 (4.8)
CS = XβS + εS if F = 0 (4.9)
Furthermore, σµ, σM , and σS denote the standard deviations of the error term with respect to
the selection process (4.7), respectively the corruption equations (4.8) and (4.9). Covariances
between µ and εM , respectively εS , are given by σµM and σµS with corresponding correlation
coefficients denoted by ρM = σµM
σµσM, respectively ρS = σµS
σµσS.
According to (4.8) and (4.9) conditional expectations about the extent of corruption relate
to the set of covariates, X, but via (4.7) also to the set of attributes, Z, characterising federal
countries. Thereby, the endogenous choice about adopting federalism introduces an additional
term, which, based on the logistic distribution underlying (4.5), contains the probability
density (φ(.)) and cumulative distribution functions (Φ(.)),

CHAPTER 4. FEDERALISM AND CORRUPTION - EMPIRICAL RESULTS 86
E[CM |F = 1, XM ] = XMβM − σMρMΛM Federations (4.10)
E[CS |F = 0, XS ] = XSβS + σSρSΛS Otherwise (4.11)
where,
ΛM =φ(Zα)
1− Φ(Zα)(4.12)
ΛS =φ(Zα)Φ(Zα)
(4.13)
Thus, the expected extent of corruption rests on the unconditional impact associated with co-
variates X as well as a second term conditioning on the choices about the type of governance,
which relates to attributes Z via the inverse Mills-Ratio ΛM (Zα), respectively ΛS(Zα). Es-
timates of the inverse Mills-Ratios of (4.12) and (4.13) are obtained by means of the fitted
values of the logit regression reported in column 4 of table 4.4. Neglecting this term as in
OLS regressions of table 4.1 entails an omitted variable bias. Furthermore, the estimated
coefficient pertaining to the inverse Mills-Ratio designates the extent of self-selection, which
typically increases with the covariance between covariates X and attributes Z. In case pure
randomisation determines which countries become federations, the covariance term σµM , re-
spectively σµS , would drop to 0 implying effects conditioning on the choice about federalism
would vanish. Drawing up a federal constitution does, however, not occur by simple chance,
but, after section 4.2, relates systematically to observable country attributes like ethnic di-
versity, economic development, country size, or legal origin.
Table 4.6 contains the results of the second stage of the switching regression onto the three
corruption indices considered thus far.
Resulting coefficients coincide widely with those of OLS regressions of table 4.1 in respect
to the direction of impact, although in some instances sign reversals occur. In particular,
economic development (GDPPC) and established democratic rule (DEMAGE) seem to
systematically reduce corruption. Moreover, there is some limited support for French le-
gal heritage (LEGFRA) to foster government misconduct meanwhile competitive markets,
measured by trade openness (OPEN), the share of Protestants (PROT ), and ethnic diver-
sity (ETHNIC) seem to constrain bribery. Further, the entry of country size in terms of
population, which differs according to table 4.3 substantially between federations and other
countries, is characterised by altering signs across various specifications of table 4.6. Above
all, estimates of (4.11) yield significant coefficients for σ attributed to self-selection bias, when
corruption is measured by the ICRG and CPI.

CHAPTER 4. FEDERALISM AND CORRUPTION - EMPIRICAL RESULTS 87
Table 4.6: Results from Switching RegressionsThis table presents two stage estimates of switching regressions after equations (4.10) and
(4.11). Standard errors are reported in parentheses. Coefficients significant at the 10% level
are labelled with *, at the 5% level with **, and at the 1% level with ***.
Dep. Var. ICRG CPI CSI
Equation Other
Countries
Federations Other
Countries
Federations Other
Countries
Federations
(1) (2) (3) (4) (5) (6)
Ethnic -0.251 -0.356 -0.749 0.437 -0.019 -0.526
(0.611) (1.301) (0.640) (4.298) (0.070) (0.377)
Log(GDPPC) -0.363*** -0.556* -1.001*** -1.250 -0.111*** -0.274**
(0.117) (0.268) (0.144) (0.807) (0.018) (0.082)
Log(Pop) -0.225** 0.202 0.063 0.033 -0.024* -0.072
(0.099) (0.254) (0.103) (0.625) (0.013) (0.096)
Legfra 0.225 0.543** 0.174 1.020 -0.027 0.213*
(0.217) (0.239) (0.206) (0.805) (0.037) (0.100)
Demage -0.010*** -0.001 -0.014** -0.006 -0.002 -0.0001
(0.003) (0.004) (0.006) (0.008) (0.001) (0.001)
Open -0.282 -0.007 -0.687** -0.133 -0.066 0.013
(0.284) (0.231) (0.283) (0.647) (0.051) (0.137)
Prot -0.960** -0.915 -1.703*** -0.618 -0.217** -0.178
(0.391) (1.343) (0.580) (3.828) (0.096) (0.409)
Intercept 10.96*** 3.939 15.00*** 15.79 1.446** 3.484
(2.631) (6.236) (3.110) (17.40) (0.449) (2.233)
σ -1.586*** -0.766 -1.292* -0.918 0.089 0.553
(0.618) (1.075) (0.710) (3.326) (0.166) (0.363)
N 81 18 95 19 83 17
Adj. R2 0.554 0.873 0.832 0.794 0.781 0.760
Since federalism constitutes an endogenous choice variable, its expected mean effect in
terms of difference between (4.10) and (4.11) cannot be tested via imposing restrictions
on the switching regression. Rather, hypothesising about the empirical mapping between
federalism and corruption necessitates comparing two non-nested models.
Simulating the choice process about adopting a federal constitution undergone by a large
number of resampled countries yields comparable empirical distributions of corruption as re-
gards single and multi-tiered governance. Predictions on the extent of corruption condition
on covariates X as well as attributes Z and rest on the fitted values of equation (4.10) for
countries having opted for federalism and otherwise on (4.11), calibrated by the coefficients
reported in table 4.6. Furthermore, propensity scores of table 4.2 determine the probability
weight attached to adopting a federal constitution during the resampling process. The fol-
lowing algorithm provides further details about the subsequent steps of the simulation process:
For replications r = 1...R
1. Draw countries into multi-tiered, F = 1, and single-tiered, F = 0, subsets according to

CHAPTER 4. FEDERALISM AND CORRUPTION - EMPIRICAL RESULTS 88
their propensity score P (Z),
2. Predict for each resampled country the extent of corruption based on equations (4.10)
and (4.11) calibrated with the coefficients of table 4.6,
3. Compare the mean and the empirical distribution for subsets containing federal and
other countries.
Figure 4.2 depicts the resulting empirical distributions across their respective support for
all three corruption indices after performing 10’000 bootstrap replications. Thereby, the
dotted line reflects the simulated empirical distribution as regards corruption in federations
with the dashed line showing the corresponding empirical distribution in other countries.
The actual distribution of the observed corruption indices is given by the solid line. Against
the benchmark of actual values, figure 4.2 reveals for federations a considerable shift in
probability mass towards lower levels of corruption. In fact, table 4.7 reports estimated mean
differences in terms of index scores (federal-other) equaling -0.30 for the ICRG, -0.68 for the
CPI, and -0.16 for the CSI, all of which being statistically significant on all conventional
levels of rejection. Thus, switching regressions suggest federalism to impact negatively upon
corruption.
Table 4.7: Simulated Outcomes of CorruptionFor 10’000 replications, this table repots the bootstrapped predictions of corruption under
federalism and other structures of governance. Mean differences significant at the 10% level
are labelled with *, at the 5% level with **, and at the 1% level with ***.
ICRG CPI CSI
Actual Mean 2.37 5.75 0.08
Simulated Mean Federations 2.06 5.14 -0.06
Simulated Mean Central Governance 2.36 5.82 0.10
Mean Difference (Fed-Other) -0.30*** -0.68*** -0.16***
t-Value 21.00 20.69 39.02
4.3.2 Propensity Score Matching
Results of switching regressions might be spurious when corruption indices represent an or-
dinal ranking rather than cardinal measures of bribery around the world. Furthermore, the
relationship between C and X might not be linear giving rise to potential misspecification
of the functional form in switching regressions. Conversely, thanks to their nonparametric
nature, propensity score matching methods allow to relax all assumptions of subsection 4.2.2,
that is linearity and cardinality meanwhile guarding against potential self-selection.
Propensity scores, which are reported for each country in the final column of table 4.2,
concisely map similarities across countries in respect to a multidimensional set of attributes,

CHAPTER 4. FEDERALISM AND CORRUPTION - EMPIRICAL RESULTS 89
Figure 4.2: Empirical Distributions of Federations and other Countries
.0
.1
.2
.3
.4
.5
.6
0 1 2 3 4 5
De
nsity
.00
.05
.10
.15
.20
.25
0 1 2 3 4 5 6 7 8 9 10
Corruption Index (CPI)
Actual DistributionFederationsOther CountriesD
en
sity
0.0
0.2
0.4
0.6
0.8
1.0
1.2
1.4
-1.0 -0.8 -0.6 -0.4 -0.2 0.0 0.2 0.4 0.6 0.8
De
nsity
Corruption Index (ICRG)
Corruption Index (CSI)

CHAPTER 4. FEDERALISM AND CORRUPTION - EMPIRICAL RESULTS 90
Z, into one dimension P (Z). Within this context, matching rests on the idea of pairing each
single-tiered country with similar federations in terms of propensity score.49 Rosenbaum
and Rubin (1983) have established the conditions necessary to match exclusively onto one-
dimensional propensity scores, instead of multi-dimensional attributes Z:
Propensity Score Theorem: Let P (Z) denote the probability to opt for multi-tiered gov-
ernance, as defined by (4.6). Assume that 0 < P (Z) < 1 as well as Pr(S1, S2, . . . , Sn) =∏ni=1 P (Zi)Si(1− P (Zi))1−Si for the n countries in the sample. Then:
CM , CS ⊥ F | Z ⇒ CM , CS ⊥ F | P (Z) (4.14)
In words, the propensity score theorem requires that P (Z) genuinely reflects countries proba-
bility to opt for multi-tiered governance and that the propensity score, P (Z), must lie strictly
between 0 and 1, which is referred to as the common support condition. Then, conditional
on propensity scores, P (Z), the extent corruption C is independent of a countries choice
about adopting multi-tiered governance according to attributes Z. Note that according to
the common support condition, every country should potentially consider to adopt federalism.
Figure 4.3 depicts the distribution of propensity scores showing a relatively large proportion
of countries with low propensity scores, e.g. a probability to draw up a federal constitution
below 25%. Clearly, the share of actual federations increases with propensity scores and
federal countries like the United States, Canada, South Africa, or Brazil score among the
highest probabilities. However, despite rather modest propensity scores, countries like Aus-
tria, Pakistan, or Ethiopia have adopted multi-tiered governance, which suggest historical
circumstances to preserve some randomness about the choice of federalism as required by the
common support condition.
Above all, conditional on the propensity score, matched country-pairs face about the same
probability of adopting federalism, which mimics to some extent experimental conditions with
pure randomisation. Since there remains no systematic difference in opting for federalism
within these pairs, different levels of bribery may then be attached to multi-tiered governance.
The average mean difference, τ , across pairs of countries matched in terms of propensity scores
is
τ |F=1= E[E[CM | P (Z), F = 1]− E[CS | P (Z), F = 0] | F = 1
](4.15)
where the outer expectation is over the distribution of P (Z) | F = 1.
In practice, the following issues emerge meanwhile estimating τ |F=1: The stochastic
nature of the propensity scores and the limited number of observed countries prevent finding
perfect matches. Instead, establishing estimated mean effects τ requires assigning weights, w

CHAPTER 4. FEDERALISM AND CORRUPTION - EMPIRICAL RESULTS 91
Figure 4.3: Distribution of Federations according to Propensity Score
0
20
40
60
80
100
120
140
Centralistic Countries Federations
Num
ber of C
ountr
ies
Propensity Score
[0-0.25] [0.25-0.5] [0.5-0.75] [0.75-1]
and W , to all potential matches between the observed federations NM and other countries
NS :
τ |F=1=∑i∈S
wNC ,NM(i)
[ ∑j∈M,j 6=i
WNS ,NM(i, j)CMj − CSi
](4.16)
Here, multi-tiered federations j ∈ M matched onto single-tiered countries i ∈ S are in a
neighbourhood Ai = j ∈ (F = 1)|P (Zj) ∈ S(P (Zi)) where S(P (Zi)) is the neighbourhood
of a particular single-tiered country. The underlying idea of matching in terms of comparing
relatively similar observations manifests in attaching more weight WNS ,NMto pairs with
relatively similar propensity scores. As such, matching methods differ in assigning specific
weights. E.g. nearest-neighbour matching sets S(P (Zi)) = P (Zi)|P (Zi) = mini‖P (Zi) −P (Zj)‖, j ∈ (F = 1) and WNS ,NM
(i, j) = 1 ∈ Ai and WNS ,NM(i, j) = 0 otherwise meaning,
each single-tiered country is only matched on its most similar multi-tiered counterfactual.
Alternatively, single-tiered controls could be matched onto more than one federation, which
mitigates against overusing specific observations. E.g. federations can be matched within
a 10 percentage point radius, r, around single-tiered states. Finally, following Dehejia and
Wahba (1999) countries can be split into a number of regularly partitioned strata in terms
of propensity scores. The stratification method proceeds by adding up the mean difference

CHAPTER 4. FEDERALISM AND CORRUPTION - EMPIRICAL RESULTS 92
weighted by wNS ,NM(i) across all strata.50
Moreover, the potential ordinal scaling of corruption indices might prevent attaching a
meaningful interpretation to the average mean difference. Instead, the vector of paired dif-
ferences across countries i ∈ S can be transformed into ranks, on which standard Wilcoxon
singed-rank tests can be applied in order to assess the significance of the mean difference:51
τ |rankF=1= sign
( ∑i∈S
wNs,NM(i)
[ ∑j∈M,j 6=i
WNS ,NM(i, j)CMj − CSi
])∗rank
( ∑i∈S
wNS ,NM(i)
[ ∑j∈M,j 6=i
WNS ,NM(i, j)CMj − CSi
])(4.17)
Critical values for significance level p, denoted by Tcrit,p, for rank sums over 20 pairs52 are
calculated after,
Tcrit,p = zp
√m(m + 1)(2m + 1)
6(4.18)
where zp is the ordinate of the standard normal density function evaluated at significance level
p, and m represents the number of matched pairs. The advantage of signed-rank tests lies
in their robustness towards assumptions on stochastic distributions (distribution free tests)
and ordinally scaled data.
Results summarised in table 4.8 reveal predominantly negative mean differences across
matched pairs. This is to say, on average, single-tiered countries would experience lower lev-
els of corruption would they undertake constitutional reform towards federalism. The result
holds for all matching methods and corruption indices but nearest-neighbour matching and
the CPI, which finds a slightly positive average mean difference. However, due to overusing
the observation of Ethiopia, standard deviations are rather large and positive mean-differences
fail to be significant.53 Conversely, depending on the matching method and in particular for
tests based on signed-ranks, mean differences turn out to be mostly negative and statistically
significant. Significant values of mean-differences in table 4.8 amount to -0.59 for the ICRG,
-1.03 for the CPI, and -0.51 for the CSI, all of which exceeding the corresponding impacts
of federalism upon corruption in switching regressions reported in table 4.7.
Above all, both switching regressions and propensity score matching find decentralisation
of political power according to the federal principle to significantly constrain practices of
bribery and nepotism suggesting the contrary result featuring in Treisman (2000) to be sub-
ject to selection bias, misspecification of the functional form, and/or suffering from restrictive
assumptions on the cardinality of the CPI.

CHAPTER 4. FEDERALISM AND CORRUPTION - EMPIRICAL RESULTS 93
Table 4.8: Results from Propensity Score MatchingFederations are matched onto single-tiered countries. τ |F=1 refers to the mean-difference of
(4.16). τ |rankF=1 is the corresponding mean difference in terms of singed ranks according to
(4.17). Critical values of rank signed tests are calculated after (4.18). The radius r equals
10%, respectively 0.1, and m denotes the number of matched pairs respectively strata. Mean
differences significant at the 10% level are labelled with *, at the 5% level with **, and at
the 1% level with ***.
Values Ranks
ICRG CPI CSI ICRG CPI CSI
Nearest-Neighbour: Nearest-Neighbour:
τ |F=1 -1.22 0.4 -0.16 τ |rankF=1 -2’393*** 931 -2’091***
Std. (5.13) (11.03) (1.32) Tcrit,5% (-847) (1’140) (895)
m 82 100 85 m 82 100 85
Radius: Radius:
τ |F=1 -1.13 -0.88 -0.51** τ |rankF=1 -341* -2’230*** -6’810***
Std. (1.10) (2.94) (0.24) Tcrit,5% (-847) (1’140) (895)
m 82 100 85 m 81 100 85
Stratification:
τ |F=1 -0.59** -1.03* -0.10
Std. (0.22) (0.56) (0.08)
Strata 4 4 4
4.4 Concluding Remarks
The predominance of affluent, ethnically diverse, and large countries among federations sug-
gests federalism to be an endogenous choice variable when countries decide about their struc-
ture of government, which stands crucial meanwhile establishing the empirical impact of
federalism upon corruption.
By taking the endogenous nature of corruption into account, the present analysis shows
that multi-tiered governance relates negatively to government misconduct in a statistical
significant manner. Propensity score matching and switching regressions are employed to
guard against self-selection bias by proceeding along two stages:
Conducting discrete choice regressions during the first stage reveals that country attributes
like ethnic diversity, economic development, a large population or land surface increase the
probability of adopting federalism. These empirical dimensions widely reflect the economic
priors inherent in Oates’ decentralisation theorem suggesting that the benefits of a local
provision of public goods increase with the heterogeneity in tastes and the size of jurisdictions.
Furthermore, economic development relates positively to the propensity to adopt a federal
constitution. Relative to the benefits of decentralisation, affluent countries seem to be in
a better position to bear the cost burden associated with multi-tiered governance, where
overlapping responsibilities and foregone economies of scales increase the cost of public goods
provision.
During the second stage, controlling for covariates like democratic rule, legal heritage, reli-

CHAPTER 4. FEDERALISM AND CORRUPTION - EMPIRICAL RESULTS 94
gious affiliation, and trade openness, the average mean difference between countries, weighted
according to their propensity to become federations, is negative suggesting political decentral-
isation according to the federal principle to reduce corruption. This result holds for various
corruption indices and thanks to employing nonparametric matching methods is robust even
if indices should exhibit ordinal rather than cardinal properties. Thus, in federations the
benefits from horizontally competing jurisdictions seem empirically to prevail over concerns
about corrupt overgrasing (Shleifer and Vishny, 1993).
An OLS framework does not account for the endogenous nature of adopting federalism.
Therefore, the puzzle of the countervailing impact of decentralisation upon corruption with
fiscal decentralisation entering negatively (Fisman and Gatti, 2002) and federalism entering a
similar regression positively (Treisman, 2000), can be attributed to the restrictive assumptions
like recursivity, linearity, and ordinality underlying the OLS approach.
Fiscal and political decentralisation are promoted among others by the IMF and the World
Bank as a possible strategy to combat corruption. The present study indeed suggests that
by dispersing political power, federalism provides a way to undermine endemic corruption.
Yet, considering the differences between countries like Switzerland and Nigeria, the observed
levels of corruption in federations cover a wide range of index values meaning, federalism
in isolation does not ensure low levels of bribery. However, countries fostering an economy
based on decentralised market exchange, established democratic rule, and characterised by
rather non-hierarchical belief systems like Protestantism alongside fiscal decentralisation and
federalism, tend to suffer far less from abuses of public power for private benefit.

CHAPTER 4. FEDERALISM AND CORRUPTION - EMPIRICAL RESULTS 95
Data Appendix
Table 4.9: Description of the Data SetThis table summarises the data set collected for up to 150 countries as averages over the years 1999-
2003 unless stated otherwise. The listing starts with corruption indices followed consecutively by
variables related to decentralisation and other control variables.
Variable Description Source
ICRG Expert based assessment of Corruption as reported in the Inter-
national Country Risk Guide (ICRG). Values ranging from 0 to
5 are averaged for the period 1990-1997. Higher values designate
countries with more endemic corruption.
Political Risk
Service of the
Economists Intelli-
gent Unit.
CPI Composite corruption perceptions index based on subjective as-
sessments about the extent of bribery and nepotism by business
people, country experts, and the general public. In order to make
results more intuitive, the original scaling has been reversed with
scores ranging from 0 (least corrupt) to 10 (most corrupt).
Transparency
International.
CSI Latent measure of corruption extracted from its underlying causes
and consequences on the basis of a structural model calculated for
the period 1990-97. Values have been standardised around 0 with
higher values indicating higher levels of corruption.
Dreher et al.
(2004).
DECENTR.
(Exp)
Expenditure of subcentral units (States, Municipalities) as share
of total government expenditure for the period 1980-1995.
Fisman and Gatti
(2002).
DECENTR.
(Rev)
Revenue of subcentral units (States, Municipalities) as share of
total government revenue for the period 1980-1995.
Fisman and Gatti
(2002).
FEDERAL Countries with multi-tiered or federal governance. Treisman (2000),
Griffith and Neren-
berg (2002).
CIVIL Average for the years 2000 and 2003 of the Gastil index of civil
liberties taking into consideration such issues as the freedom of
press, of political association, and trade unions association. Index
values ranging from 1 to 7 have been reversed to make results
more intuitive with higher values indicate more civil liberties.
Freedom House.
DEMAGE Years of uninterrupted democratic rule in 2000. Democracy is
defined by a regime with an Executive Index of Electoral Com-
petitiveness (EIEC) ≥ 6 not run by a military officer.
Beck et al. (2001).

CHAPTER 4. FEDERALISM AND CORRUPTION - EMPIRICAL RESULTS 96
Continued
ETHNIC Ethnic fractionisation computed for the years 1965 - 1995 as one
minus the Herfindahl index of ethnic group shares (Ethnic =
1−∑
s2) reflecting the probability that two randomly selected
individuals belong to different ethnolinguistic groups.
Alesina et al.
(2003).
Log(GDPPC) Logarithm of the real gross domestic product per capita with
base year 1995 in terms of US$.
World Develop-
ment Indicators
(WDI), World
Bank.
Log(LAND) Size of a country in terms of (logarithmic) land surface. WDI, World Bank.
Log(POP) Size of a country in terms of (logarithmic) population. WDI, World Bank.
GOVSHARE Total government expenditure relative to GDP averaged over
the years 1980-1995.
Fisman and Gatti
(2002).
LEGFRA Indicator variable for French civil law heritage. La Porta et al.
(2003) and CIA
World Factbook.
NEVERCOL Indicator variable for countries never subject to colonial rule. Lederman et al.
(2005), CIA World
Factbook.
OECD Indicator variable for OECD-membership representing countries
sharing a strong commitment to democratic government and
market economy.
OECD.
OPEN Trade in goods as share of GDP. WDI, World Bank.
PROT Share of the population affiliated to a protestant belief. Encyclopedia Bri-
tannica, Book of
the Year 2001.
SCHOOL School enrollment on secondary level as share of the correspond-
ing cohort.
WDI, World Bank.

NOTES 97
Notes
38See www.transparency.org for a comprehensive description of the CPI.39E.g. for Argentina the score of the CPI increased dramatically from an average of 2.9 during the years
1997-1999 to 7.5 in the year 2003. It seems somewhat unclear whether this reflects a genuine increase in
corruption or can partly be attributed to the turbulent political situation during this period.40Indeed, Transparency International itself states that its CPI ”ranks countries in terms of the degree
to which corruption is perceived to exist among public officials and politicians. [...] It reflects the views
of business people and analysts from around the world, including experts who are locals in the countries
evaluated.” (emphasis added, source: www.transparency.org).41Causal variables coincide widely with the political, historical, and socio-economic controls introduced
during this section. GDP, capital control restrictions, the development of the financial sector, as well as the
consumption of cement serve as measure for the economic consequences of corruption. Whilst the first three
variables are self explanatory, the consumption of cement seems to reflect opportunities to extract large bribes
by creating so called ”White Elephants”, meaning overengineered public infrastructure or military construction
projects.42The overlap between colonial and legal origin is close but not perfect. E.g. despite British colonial heritage,
Jordan, Egypt, Iraq, Malta, and Mauritius adopted civil law systems.43When founding the dominion of South Africa in 1910, a federal union was rejected on grounds of high cost
involved in multi-tiered governance (Wheare, 1956, p.53). Nowadays however, South Africa is widely seen as
a federal country (Griffith and Nerenberg, 2002).44Instead of establishing the probability to adopt federalism (F ), an instrumental variable that is highly
correlated with F but uncorrelated with the stochastic error term µ of equation 4.4 could likewise be employed
to reestablish recursivity. Within the present context, finding a suitable instrument proofed, however, to be
difficult. Moreover, instrumental variables estimates could yield the implausible prediction of the probability
to adopt federalism lying outside the interval [0, 1]. Due to the dangers associated with employing weak
instruments (Staiger and Stock, 1997) this approach has not been pursued further.45Some related work on factors contributing to fiscal centralisation can, however, be found in Panizza (1999).46Normally distributed errors and the corresponding Probit model provide an alternative to the Logit which
yields almost identical results, but allows for slightly less diverse outcomes due to allocating comparatively
less probability mass in its tails.47However, ETHNIC does not relate directly to the distribution of ethnic communities over territory. E.g.
a given value of ETHNIC does not allow to discriminate between a scenario of an ethnic minority populating
one area and a diaspora spread over the entire state territory.48Maddala (1986) provides a comprehensive overview of self-selection and switching regressions.49Matching was introduced into economics whilst analysing labour markets (see e.g. Heckman et al., 1998).
Persson et al. (2003) first use propensity score matching whilst evaluating the causes of corruption.50Variances of matching estimators increase dramatically whenever one federation is matched many times
onto other countries. In particular, the variance of nearest-neighbour matching is given by: V arNN =
(1/NS)[V ar(CS) +∑
j∈M (WNS,NM(i,j))2
NMV ar(CM )]. Aside from weighting, variances of the radius method
coincide with the nearest-neighbour case. The variance for stratification is: V arS = (1/NS)[V ar(CS) +∑m
NS,m
NS
NS,m
NM,mV ar(CM )], where m denotes the number of strata.
51For the sake of simplicity, the present version of rank sums disregards the possibility of tied ranks. However,
without loss of generality, (4.17) could be restated into a form allowing for tied ranks.52For values below 20, tabulated values for Tcrit,p can be found in introductory textbooks on statistics.53In order to assure the common support condition, some authors (e.g. Persson and Tabellini, 2004) suggest
to drop values below and above the minimum respectively maximum propensity score among F = 1 countries.

NOTES 98
Like this, all mean effects (τ) would become negative. Due to the associated loss in degrees of freedom as well
as its arbitrary character of this approach, the results of table 4.8 employ the full sample of countries.

Bibliography
[1] Ades, A. and Di Tella, R. (1999), ’Rents, Competition, and Corruption’, The American
Economic Review, vol.89, pp.982-993.
[2] Alesina, A., Devleeschauwer, A., Esterley, W., Kurlat, S. and Wacziarg, R. (2003),
’Fractionization’, Journal of Economic Growth, vol.8, pp.155-194.
[3] Arikan, G.G. (2004), ’Fiscal Decentralization: A Remedy for Corruption?’, International
Tax and Public Finance, vol.11, pp.175-195.
[4] Beck, T., Clark, G., Groff, A., Keefer, P. and Walsh, P. (2001), ’New tools in comparative
political economy: The database of political institutions.’ World Bank Economic Review,
vol.15, pp.165-176.
[5] Dreher, A.; Kotsogiannis, C. and McCorriston, S. (2004), ’Corruption around the World:
Evidence from a Structural Model’, Mimeo, University of Exeter.
[6] Fearon, J.D. and Laitin, D.D. (1996), ’Explaining Interethnic Cooperation’, American
Political Science Review, vol.90, pp.715-735.
[7] Fisman, R. and Gatti, R. (2002), ’Decentralization and corruption: evidence across
countries’, Journal of Public Economics, vol.83, pp.325-345.
[8] Griffith, A.L. and Nerenberg, K. (eds.) (2002), Handbook of Federal Countries, 2002,
Montreal & Kingston, McGill-Queen’s University Press.
[9] Heckman, J.J., Ichimura, H. and Todd, P. (1998), ’Matching as and Econometric Eval-
uation Estimator’, The Review of Economic Studies, vol.65, pp.261-294.
[10] Keen, M.J. and Kotsogiannis, C. (2002), ’Does Federalism Lead to Excessively High
Taxes?’, The American Economic Review, vol.92, pp.363-370.
[11] Keen, M.J. and Kotsogiannis, C. (2003), ’Leviathan Capital Tax Competition in Feder-
ations’, Journal of Public Economic Theory, vol.5, pp.177-199.
[12] La Porta, R., Lopez-De-Silanes, F., Shleifer, A. and Vishny, R. (1999), ’The quality of
government’, Journal of Law, Economics and Organization, vol.15, pp.222-279.
99

BIBLIOGRAPHY 100
[13] Lederman, D., Loayza, N. and Reis Soares, R. (2005), ’Accountability and Corruption -
Political Institutions Matter’, Economics and Politics, vol. 17, pp.1-35.
[14] Maddala, G.S. (1986), ’Disequilibrium, Self-Selection, and Switching Models’, in
Griliches Z. and Intriligator, M.D. Handbook of Econometricts, Vol III, Amsterdam,
Elsevier Science Publishers.
[15] Mauro, P. (1995), ’Corruption and Growth’, Quarterly Journal of Economics, vol.105,
pp.681-712.
[16] Oates, W.E. (1972), Fiscal Federalism, New, York, Harcourt Brace Jovanovich.
[17] Panizza, U. (1999) ’On the determinants of fiscal centralization: Theory and evidence’,
Journal of Public Economics, vol.74, pp.97-139.
[18] Persson, T. and Tabellini, G. (2004), ’Constitutional Rules and Fiscal Policy Outcomes’,
The American Economic Review, vol.94, pp.25-45.
[19] Persson, T., Tabellini, G. and Trebbi, F. (2003), ’Electoral Rules and Corruption’, Jour-
nal of the European Economic Association, vol.1, pp.958-989.
[20] Rosenbaum, P. and Rubin, D. (1983), ’The Central Role of Propensity Score in Obser-
vational Studies for Casual Effects’, Biometrica, vol.70, pp.41-55.
[21] Shleifer, A. and Vishny, R.W. (1993), ’Corruption’, Quarterly Journal of Economics,
vol.108, pp.599-617.
[22] Staiger, D. and Stock, J.H. (1997), ’Instrumental variables regression with weak instru-
ments’, Econometrica, vol.65, pp.557-586.
[23] Treisman, D. (1999), ’Decentralization and Corruption: Why are federal states perceived
to be more corrupt?’, Mimeo, University of California.
[24] Treisman, D. (2000), ’The causes of corruption: a cross-national study’, Journal of Public
Economics, vol.76, pp.399-457.
[25] Watts, R.R. (1999), Comparing Federal Systems, Montreal & Kingston, McGill-Queen’s
University Press (2nded.).
[26] Wheare, K.C. (1956), Federal Government, London, Oxford University Press (3rded.).

Chapter 5
THIRD ESSAY
Cross Border Acquisitions,
Corruption, and the Quality of
Institutions - An Event Count
Study
”Little else is requisite to carry a state to the highest degree of opulence from the
lowest barbarism but peace, easy taxes, and a tolerable administration of justice:
all the rest being brought about by the natural course of things.”
As suggested by the introductory quote ascribed to Adam Smith, institutions devised to
create and safeguard a set of rules in a transparent manner, which thereby lower transaction
cost, facilitate domestic and international exchange and ultimately foster economic develop-
ment. Conversely, endemic corruption and nepotism inherently undermine rules and result
in institutional decay, obstructing domestic and foreign investment.
Within this context, Mauro (1995) has pointed out the negative empirical relationship
between economic growth and bribery attributed to lower private investment in endemically
corrupt countries, even after controlling for regulatory quality. Likewise, Wei (2000) finds a
detrimental impact of corruption upon flows of foreign direct investment (FDI). In particular,
compared with taxation, bribery and nepotism seem to put-off international investors to a
far bigger extent.
Multinational enterprises (MNEs) constitute an increasingly more important vehicle to
undertake FDI when a firm creates or expands subsidiaries into another country involving
not only a transfer of resources, but also the acquisition of control. In form of cross-border
101

CHAPTER 5. CBA, CORRUPTION, AND INSTITUTIONS 102
acquisitions (CBAs) activity, the 1990ies have witnessed indeed a dramatic expansion of FDI,
which partly reflected a shift away from greenfield investment (Di Giovanni, 2005). During
the first year of the new millennium, CBA activity has shown an equally dramatic downturn
(UNCTAD, 2005). Still, CBAs accounted for about 80% of FDI (by value) in the year 2000
(UNCTAD, 2001).
The present chapter endeavours to establish the impact of institutional quality upon a
country’s ability to host CBAs. In terms of the distribution and growth of deal values, the
empirical determinants of international mergers - in particular the role of financial deepening
- have recently received attention from Di Giovanni (2005). Furthermore, Rossi and Volpin
(2004) have analysed the impact of corporate governance variables like accounting standards
or shareholder protection in source countries, and find positive relationships with regard to
the volume of merger activity, stock as a method of payment, attempts for hostile takeovers,
takeover premiums, and domestic investment. They conclude that acquiring firms typically
locate in countries with higher investor protection and might, thus, urge target firms to
enhance their standards of corporate governance.
The present analysis contributes to this literature by adopting a much broader view on
institutional quality referring to a set of humanly devised rules to lower transaction cost
(compare North, 1990), which manifest e.g. in the prevalence of democratic rule, regulatory
quality, the proliferation of property rights, as well as the control of corruption. Notably,
this coincides widely with proposed dimensions to measure the quality of government within
an economic context (La Porta et al., 1999). The impact of weak institutions upon inter-
national merger activity has to date received relatively scant attention even though CBAs
ex-definitionae involve entering a foreign market, and the theory of the MNE originates in the
question as why the same company decides to locate plants in different countries, presuming
that local firms have the competitive advantage of being familiar with the local institutional
setting and business customs.
Aside from adopting a broader view on institutional quality, the present empirical strategy
differs in several ways from previous studies into international merger activity:
Firstly, the gravity framework entrenched in the analysis of goods and asset trade, and
employed among else by Di Giovanni (2005), is replaced by the empirical approach of Carr
et al. (2001). Thereby, the desire to establish subsidiaries in foreign markets rests on the
knowledge-capital theory where MNEs exploit scale economies (horizontal CBAs) and inter-
national differences in relative factor costs (vertical CBAs) provided trade and investment
costs are sufficiently low.
Secondly, the present essay aggregates cross-border acquisitions reported by Thomson
Financial Securities Data (SDC) into an event count rather than employing affiliate sales
data or the cumulative value of deals. The resulting panel contains up to 67 source countries,

CHAPTER 5. CBA, CORRUPTION, AND INSTITUTIONS 103
147 host countries, and spans over 7 consecutive years between 1997 and 2003, implying
institutional divergence can be traced across countries and time. Employing count data
offers the following advantages:
• Event counts relate to a well defined class of discrete distributions such as the Poisson or
the negative binomial distribution which account for the fact that international merger
deals across many country-pairs constitute rather rare events.
• Merger counts allow for an intuitive interpretation in terms of the number of deals
struck during a given time domain and exhibit a close correspondence to the theory of
the MNE, which analyses the decisions of entering foreign markets but not directly the
amount of foreign direct investment involved or targeted sales.
• Due to a lack of compulsory information disclosure, the value of a deal goes frequently
unreported implying conditional distributions in studies such as Volpin and Rossi (2004)
or Di Giovanni (2005) to suffer from potential bias should mergers with unobserved at-
tributes share similarities, or disclosure requirements differ systematically across coun-
tries. Conversely, aggregating observed CBAs reported by SDC into event counts allows
to attain an almost exhaustive coverage of international merger activity.
• SDC reports Standard Industry Classification (SIC) codes of merging firms, which
allows, in principle, to isolate merger deals driven by market access considerations
and estimate the model separately for horizontal and vertical CBAs - a distinction that
stands crucial within the knowledge capital theory.
There are, however, some caveats against employing count data: Unlike value data, merger
counts do not allow to discriminate between deals involving different levels of investment.
Meanwhile treating all CBAs equally as one event might offer some robustness in terms of
data coverage and econometric specification, the magnitude of the international flow of fi-
nancial resources involved in CBAs remains inevitably obscured.
Results suggest institutional quality to act as an important determinant of CBAs, though
differences between its dimensions remain. In particular, institutional quality dimensions like
investment cost proposed by Carr et al. (2001) or common law heritage, which features promi-
nently in the finance and development literature (La Porta et al. 1997, 1998, 1999) exhibit
a comparatively modest impact upon CBA-activity. Conversely, dimensions like democratic
accountability, modest regulation, or the control of corruption seem to be more important
to attract CBAs. Finally, there is no fundamental difference as regards the importance of
institutional quality variables between horizontal and other CBAs.

CHAPTER 5. CBA, CORRUPTION, AND INSTITUTIONS 104
The remainder is organised as follows: The next section reviews some recent developments
on the theory of the MNE. Section 3 introduces and discusses the methods employed to
analyse merger counts. Section 4 sets out the baseline model whilst the following section
5 introduces and discusses institutional quality variables. Finally, section 6 provides some
concluding remarks.
5.1 Theoretical Background - Horizontal and Vertical Motives
for International Merger Activity
Dunnings’ (1977, 1981) OLI framework provides a first attempt to explain the emergence of
MNEs attributing their advantages over single plant firms to ownership - the possession of
intangible firm specific knowledge and skills -, location - comparative advantage and access to
customers -, and internalisation - superiority while maintaining long-term and complex rela-
tionships necessitating specific investment without being exposed to opportunistic behaviour
by incompletely contracted parters. Albeit the OLI theory refers to imperfectly competitive
conduct, it allegedly fails to model the market structures giving rise to MNEs. Thereto,
the rationales underlying firms’ desire to maintain several plants in several countries have
subsequently been integrated into an industrial economics framework where horizontal (e.g.
Markusen, 1984) as well as vertical (e.g. Helpman, 1984; Helpman and Krugman, 1985)
motives explain the desire to invest aborad. As a specific manner to undertake FDI, these
theories carry over to international merger activity.54
Benefits of horizontal merger activity arise when firms seek to place production closely to
its customers in order to avoid transportation cost and tariffs. Meanwhile, substituting trade
for setting up a local plant to access a market still allows to take advantage of firm-specific
scale economies.55 In particular, firm-level fixed cost may be distributed - in form of joint
inputs - over several plants when production is replicated in multiple locations.
In general, due to the significance of economic size while exploiting scale economies, theory
suggests horizontal merger activity to arise predominantly as counterpart to intra-industry
trade among developed countries, and in particular when:
1. Countries are similar in size and factor endowments;
2. Physical, institutional, and legal trade cost are high;
3. Industries are characterised by firm-specific (not plant-specific) fixed cost and internal
scale economies.
Conversely, when merging vertically, MNEs outsource stages of production across space.
This fragmentation by stages of production implies that affiliates must trade with other

CHAPTER 5. CBA, CORRUPTION, AND INSTITUTIONS 105
parts of the firm meaning intra-firm exchange partly replaces inter-firm exchange. In doing
so, vertical MNEs seek to exploit relative differences in factor cost by shifting upstream and
downstream activities necessitating the intensive usage of a production factor towards loca-
tions well endowed with it. Examples include manufactures relocating production towards
countries disposing off a large unskilled labour force, whilst headquarters remain in places
abundantly endowed with skilled labour, or mining companies locating extraction in coun-
tries well endowed with natural resources. In essence, vertical merger activity constitutes
a counterfactual to comparative advantage driven, inter-industry trade and will dominate
when:
1. Countries differ in relative factor endowments translating into unequal factor prices;
2. Industry’s stages within the chain of production and distribution differ in technologies
(factor intensities) as regards input combinations of capital, energy, natural resources,
as well as skilled and unskilled labour.
Markusen and coauthors (e.g. 2001, 2002) have integrated motives pertaining to internal
scale economies and unequal factor prices into the knowledge capital model (KK), where
horizontal and vertical MNEs arise endogenously. Focusing on the effect of skilled labour
endowment, knowledge is assumed to be geographically mobile - hence the name of the model
- and constitutes, in terms of headquarter services, a joint input to multiple production
facilities. Alongside multinationals, the KK-model allows for national firms, which take
full advantage of plant level economies of scale by producing in one location and shipping
commodities to foreign markets. Such national firms prevail when:
1. Domestic markets are relatively large;
2. Physical, institutional, and legal trade cost are relatively low;
3. Industries are characterised by plant-specific fixed cost and scale economies.
Due to the hybrid structure of the KK-model, direction and form of FDI activity vary
along two dimensions. Translated into a CBA context, simulations reported in Carr et al.
(2001) suggest an increase in vertical CBAs in diverging relative factor endowment opposed
to a decrease in horizontal merger activity in diverging economic size. Whilst the economic
size effect follows roughly an inverted U-shape, the impact of factor endowment is asymmetric
insofar as small but skilled labour abundant countries should see highest relative cross-border
merger activity.

CHAPTER 5. CBA, CORRUPTION, AND INSTITUTIONS 106
5.2 An Econometric Method to Analyse Mergers as Event
Count
5.2.1 Counting International Merger Deals
Opposed to ongoing flows in international finance, FDI undertaken as merger project marks
the occurrence of an event in time based on a discretionary decision taken by e.g. the
firms’ board. Therefore, international merger activity may concisely be aggregated into an
event count, CBAij,t, in terms of the number of deals between acquiring firms located in
source country i and target firms located in host country j during time domain t (e.g. a
year). Previous studies, like Di Giovanni (2005) or Rossi and Volpin (2004), rely instead
on the cumulated value of international merger deals, the caveat against which lying in the
restricted information disclosure by many merging companies. Indeed, even SDC of Thomson
Financial, which claims to achieve an almost exhaustive coverage of merger and acquisitions
(M&A) activity, reports for more than 50% of recorded deals no information beyond: (i)
the announcement date, (ii) target and acquirer names, (iii) target and acquirer countries of
origin, (iv) target and acquirer SIC code, (v) the percentage of shares sought, acquired, and
owned after a deal.56 However, SDC covers virtually all deals around the world undertaken
after 1990, which involve at least a 5% change in ownership.
Based on deals resulting in an ownership of at least 50%,57 mergers recorded in SDC have
been counted between 67 source countries and 147 host countries for each of the 7 years
between 1997 and 2003. Source countries listed in table 5.1 saw typically more than 50 deals
in total (column 1) and financed at least 8 CBAs during the period under consideration
(column 2), which cumulatively cover almost 98% of international mergers observed around
the world (column 4). Due to a lack of necessary economic or institutional prerequisites to
undertake CBAs, observations from remaining source countries were dropped. Many of these
countries did, during the period under consideration, not finance cross-border merger deals or
did not even see any merger activity at all. Source countries locate on all continents. However,
OECD countries in general as well as the United States, the United Kingdom, Canada, and
Germany in particular account for a vast number of deals. As regards the percentage of
international as opposed to domestic merger activity, the last column of table 5.1 uncovers
substantial differences, with small and developed countries like the Netherlands, Sweden,
Switzerland, or Luxembourg accounting for a relatively large fraction of CBAs, which partly
supports the predictions of the KK-model.
Table 5.2 summarises recorded deals according to 208 recipient countries around the world.
Albeit to a large extent the ranking continues to reflect economic size, emerging markets like
China, Brazil, or India host considerably more CBAs than they finance whilst the converse
holds for countries like the United States, the United Kingdom, Canada, Hong Kong, the

CHAPTER 5. CBA, CORRUPTION, AND INSTITUTIONS 107
Table 5.1: Overview of Merger Counts (Source Countries)This table summarises M&A activity by source countries. Data relate to cumulative event
counts for the period 1997 to 2003. Countries are ranked according to CBA-counts.
Source Country All M&A CBA
Rank Name Count Count Perc. of World Perc. of
Ind. Cum. M&A
1 United States 77’666 11’592 24.49 24.49 14.93
2 United Kingdom 21’747 5’550 11.62 36.11 25.29
3 Canada 12’780 3’428 7.24 43.35 26.83
4 Germany 9’892 3’318 6.97 50.32 33.36
5 France 7’505 2’597 5.48 55.80 34.59
6 Netherlands 3’982 2’115 4.47 60.27 53.11
7 Sweden 3’377 1’551 3.28 63.54 45.93
8 Hong Kong 3’508 1’294 2.73 66.28 36.92
9 Switzerland 2’417 1’247 2.63 68.93 51.59
10 Japan 9’066 1’001 2.11 71.03 11.04
11 Australia 7’160 997 2.11 73.13 13.92
12 Belgium 1’782 985 2.08 75.21 55.27
13 Singapore 2’243 978 2.07 77.28 43.60
14 Italy 3’178 918 1.94 79.22 28.88
15 Finland 2’717 866 1.83 81.05 31.87
16 Spain 3’749 817 1.73 82.77 21.79
17 Denmark 1’659 809 1.71 84.48 48.76
18 Austria 1’202 632 1.34 85.82 52.57
19 Norway 1’593 623 1.32 87.13 39.11
20 Ireland 1’025 620 1.31 88.44 60.48
21 Malaysia 4’630 458 0.97 89.41 9.89
22 South Africa 2’016 406 0.86 90.27 20.14
23 China 2’475 278 0.59 90.85 11.23
24 Israel 759 272 0.57 91.43 35.83
25 Greece 1’065 248 0.52 91.96 23.29
26 Luxembourg 284 246 0.52 92.48 86.62
27 India 2’037 240 0.51 92.98 11.78
28 New Zealand 1’164 219 0.46 93.46 18.81
29 Russia 1’201 211 0.45 93.89 17.56
30 Korea 1’128 186 0.39 94.28 16.49
31 Portugal 694 164 0.35 94.63 23.63
32 Mexico 532 151 0.32 94.95 28.38
33 Argentina 660 108 0.23 95.18 16.36
34 Brazil 1’159 93 0.20 95.37 8.02
35 Thailand 843 84 0.18 95.55 9.96
36 Hungary 623 76 0.16 95.71 12.20
37 Chile 322 75 0.16 95.87 23.29
38 Cyprus 163 75 0.16 96.03 46.01
39 Bahrain 72 58 0.12 96.15 80.56
40 Saudi Arabia 104 58 0.12 96.27 55.77
41 Czech Republic 579 55 0.12 96.39 9.50
42 Turkey 268 55 0.12 96.51 20.52
43 Indonesia 391 54 0.11 96.62 13.81
44 Poland 724 52 0.11 96.73 7.18
45 Estonia 223 47 0.10 96.83 21.08
46 Iceland 100 47 0.10 96.93 46.00
47 Philippines 488 45 0.10 97.02 9.22
48 Slovenia 196 41 0.09 97.76 20.92
49 Utd. Arab Em. 70 40 0.08 97.19 57.14
50 Bahamas 44 35 0.07 97.27 79.55
51 Colombia 124 31 0.07 97.33 25.00
52 Slovakia 114 26 0.05 97.39 22.81
53 Lithuania 138 25 0.05 97.44 18.12
54 Kuwait 46 24 0.05 97.49 52.17
55 Latvia 116 22 0.05 97.54 18.97
56 Venezuela 112 22 0.05 97.58 19.64
57 Panama 57 21 0.04 97.63 36.84
58 Ukraine 128 17 0.04 97.66 13.28
59 Croatia 97 17 0.04 97.70 27.53
60 Egypt 96 14 0.03 97.73 14.58
61 Romania 135 13 0.03 97.76 9.63
62 Zimbabwe 45 12 0.03 97.78 26.67
63 Oman 44 12 0.03 97.81 27.27
64 Pakistan 42 10 0.02 97.83 23.81
65 Bulgaria 276 8 0.02 97.85 2.90
66 Peru 118 8 0.02 97.86 6.78
67 Trinidad and T 9 8 0.02 97.88 88.89
- World 206’202 47’339 100 100 22.96

CHAPTER 5. CBA, CORRUPTION, AND INSTITUTIONS 108
Table 5.2: Overview of Merger Counts (Host Countries)This table summarises CBA activity by host countries. Data relate to cumulative event
counts for the period 1997 to 2003. Countries are ranked according to CBA-counts.
Host Country CBA Host Country CBA Host Country CBA
Rank Name Count Rank Name Count Rank Name Count
1 United States 6’939 71 Armenia 32 141 Burkina Faso 5
2 United Kingdom 4’336 72 Dominican Rep. 30 142 Botswana 5
3 Germany 3’259 73 Ghana 29 143 Cameroon 5
4 France 2’492 74 El Salvador 29 144 Guam 5
5 Canada 2’447 75 Bahamas 28 145 Mali 5
6 China 1’537 76 Panama 28 146 Mauritania 5
7 Australia 1’512 77 Zambia 28 147 Congo (Rep.) 4
8 Netherlands 1’389 78 Bosnia 27 148 Senegal 4
9 Italy 1’229 79 Tunisia 27 149 Syria 4
10 Spain 1’189 80 Cayman Is. 26 150 Chad 4
11 Sweden 1’172 81 Lebanon 26 151 Kiribati 3
12 Switzerland 944 82 Zimbabwe 26 152 Libya 3
13 Brazil 888 83 Guatemala 24 153 Nepal 3
14 India 876 84 Moldava 24 154 Rwanda 3
15 Hong Kong 827 85 Georgia 23 155 Togo 3
16 Belgium 780 86 Tanzania 21 156 Benin 2
17 Poland 725 87 Uzbekistan 20 157 Dominica 2
18 Norway 652 88 Belarus 19 158 Eritrea 2
19 Argentina 618 89 Nigeria 19 159 Faeroe Is. 2
20 Denmark 613 90 Jordan 18 160 Micronesia 2
21 Finland 597 91 Kyrgyz Rep. 18 161 Equatorial Guinea 2
22 Mexico 559 92 Monaco 18 162 Grenada 2
23 Singapore 559 93 Bangladesh 17 163 Liberia 2
24 Korea (South) 554 94 Fiji 17 164 Sierra Leone 2
25 Czech Republic 535 95 Mauritius 16 165 Tajikistan 2
26 Japan 529 96 Nicaragua 16 166 American Samoa 1
27 Austria 509 97 Saudi Arabia 16 167 Bhutan 1
28 New Zealand 451 98 Azerbaijan 15 168 Cape Verde 1
29 Ireland 449 99 Jamaica 15 169 Haiti 1
30 Thailand 432 100 Cambodia 15 170 St. Kitts a. Nevis 1
31 Malaysia 412 101 Uganda 15 171 Kuwait 1
32 South Africa 407 102 Algeria 14 172 Lesotho 1
33 Indonesia 365 103 Isle of Man 14 173 Niger 1
34 Hungary 354 104 Mongolia 14 174 French Polynesia 1
35 Russia 311 105 Albania 13 175 San Marino 1
36 Portugal 309 106 Barbados 13 176 Tonga 1
37 Israel 285 107 Gabon 13 177 Western Samoa 1
38 Chile 268 108 Iceland 13 178 Andorra 0
39 Romania 255 109 Namibia 13 179 Afghanistan 0
40 Philippines 250 110 Qatar 13 180 Burundi 0
41 Bulgaria 215 111 Trinidad and T. 13 181 Cen. African Rep. 0
42 Estonia 196 112 Bahrain 11 182 Channel Is. 0
43 Lithuania 168 113 Ivory Coast 11 183 Comoros 0
44 Turkey 160 114 Honduras 11 184 Djibouti 0
45 Slovakia 158 115 Laos 11 185 Ethiopia 0
46 Ukraine 138 116 Paraguay 11 186 Gambia 0
47 Luxembourg 133 117 Macao 10 187 Guinea Bissau 0
48 Colombia 129 118 Madagascar 10 188 Iraq 0
49 Peru 128 119 Malta 10 189 St. Lucia 0
50 Venezuela 124 120 Mozambique 10 190 Maldives 0
51 Greece 119 121 Oman 10 191 Marshall Is. 0
52 Croatia 113 122 Neth. Antilles 9 192 Northern Mariana Is. 0
53 Latvia 103 123 Brunei 9 193 Mayotte 0
54 Egypt 83 124 Guinea 9 194 New Caledonia 0
55 Vietnam 77 125 Kenya 9 195 Palau 0
56 Bermuda 76 126 Liechtenstein 9 196 Solomon Is. 0
57 Puerto Rico 70 127 Korea (North) 9 197 Somalia 0
58 Kazakhstan 59 128 Swaziland 9 198 Sao Tome 0
59 Slovenia 53 129 Iran 8 199 Suriname 0
60 Uruguay 52 130 Sudan 8 200 Seychelles 0
61 Bolivia 48 131 Antigua 7 201 Turkmenistan 0
62 Utd. Arab Emirates 47 132 Cuba 7 202 Timor-Leste 0
63 Costa Rica 42 133 Greenland 7 203 St. Vincent 0
64 Macedonia 40 134 Malawi 7 204 Virgin Is. 0
65 Cyprus 39 135 Yemen 7 205 Vanutu 0
66 Ecuador 37 136 Angola 6 206 West Bank 0
67 Sri Lanka 36 137 Belize 6 207 Serbia a. Monten. 0
68 Morocco 36 138 Guyana 6 208 Congo (Dem. Rep.) 0
69 Pakistan 33 139 Myanmar 6
70 Papua New Guinea 33 140 Aruba 5

CHAPTER 5. CBA, CORRUPTION, AND INSTITUTIONS 109
Netherlands, or Switzerland. The nonlinearities inherent in the KK-theory of the MNE indeed
predict such asymmetric merger activity as small and wealthy countries engage heavily in
foreign investment in order to offset the disadvantages of having a small domestic market
and high labour costs. Then again, more than one third of the countries around the world
are hardly involved in the international market on corporate control in the sense of receiving,
on average, not more than one deal per year during the seven years between 1997 and 2003.
5.2.2 Regression onto Merger Counts
Cumulated merger events constitute a discrete dependent variables insofar as containing
ordered, nonnegative, and integer counts with a preponderance of zero-valued observations.
Imposing linearity onto the mean specification E[CBAij,t|xij,t] seems inappropriate and yields
potentially inefficient, or even inconsistent estimates for the expected number of international
mergers, conditional on covariates xij,t. Moreover, imposing normality might result in nega-
tively fitted merger counts ˜CBAij,t.58 Plainly, as regards the conditional mean specification
and underlaying probability distribution, any conventional linear model applied to merger
counts is likely to suffer from misspecification.
Instead, count regressions, which rest on probability distributions of the Poisson family,
account more genuinely for the discrete and ordered character of aggregated merger events
after introducing the following assumptions about the functional form and underlying prob-
ability densities:
The expected number λij,t of cross-border acquisitions between source country i and host
country j per year t conditions on the k vector of covariates xij,t and the shift parameter δij,t
through the exponential function:
λij,t = E[CBAij,t|xij,t, δij,t] = exp(x′ij,tβ + δij,t)
= exp(x′ij,tβ)︸ ︷︷ ︸
λij,t
exp(δij,t)︸ ︷︷ ︸αij,t
(5.1)
for:
i = 1...N : Source country index.
j = 1...M : Host country index.
t = 1997− 2003 : Time domain in terms of years.
with:

CHAPTER 5. CBA, CORRUPTION, AND INSTITUTIONS 110
CBAij,t : Count of cross-border acquisitions between country i and j in year t.
xij,t : Covariates attributed to country i and j in year t.
β : Vector of coefficients to be estimated.
αij,t : Country-pair specific effect in year t.
δij,t : Shift parameter equal to ln(αij,t).
λij,t : Expected merger count between country i and j in year t unconditional on
country-pair specific effects αij,t.
λij,t : Expected merger count between country i and j in year t conditional on
country-pair specific effects αij,t.
Employing an exponential mean function allows excluding cases of negatively fitted merger
counts.
Although the conditional mean specification (5.1) relates CBAs systematically to explana-
tory variables, xij,t, it does not fully describe the count distribution. Thereto, a probability-
mass-function, Pr(CBAij,t|xij,t, αij,t) needs specifying. In their simplest form, count regres-
sions place a probability, which is Poisson distributed with parameter λij,t, onto merger counts
conditional on covariates xij,t and country-pair specific effects αij,t:
Pr(CBAij,t|xij,t, αij,t) ∼ P [λij,t = αij,tλij,t] =e−λij,tαij,t(λij,te
αij,t)CBAij,t
CBAij,t!(5.2)
Event counts exhibit typically overdispersion meaning - unlike equidispersion underlying the
Poisson distribution - the conditional variance exceeds the conditional mean. Introducing
additional randomness via the specific effect αij,t accounts for such overdispersion. Then,
the Poisson parameter λij,t constitutes a random variable with realisation λij,t implying
E[CBAij,t|xij,t] may differ across country-pairs sharing the same covariates xij,t. Since αij,t
relates to unobserved components, it needs integrating out in order to obtain the correspond-
ing marginal distribution of (5.2):
Pr(CBAij,t|xij,t) =∫
e−λij,tαij,t(λij,teαij,t)CBAij,t
CBAij,t!g(αij,t)dαij,t (5.3)
Assume the mixing distribution g(αij,t) to follow a Gamma distribution with precision pa-
rameter θ so that E[αij,t] = 1 and V [αij,t] = 1/θ. Then, g(αij,t) ∼ Γ(θ) and (5.3) results in
a negative binomial distribution,
Pr(CBAij,t|xij,t) =Γ(θ + CBAij,t)
Γ(CBAij,t + 1)Γ(θ)qCBAij,t
ij,t (1− qij,t)θ (5.4)
where,
qij,t =λij,t
λij,t + θ(5.5)
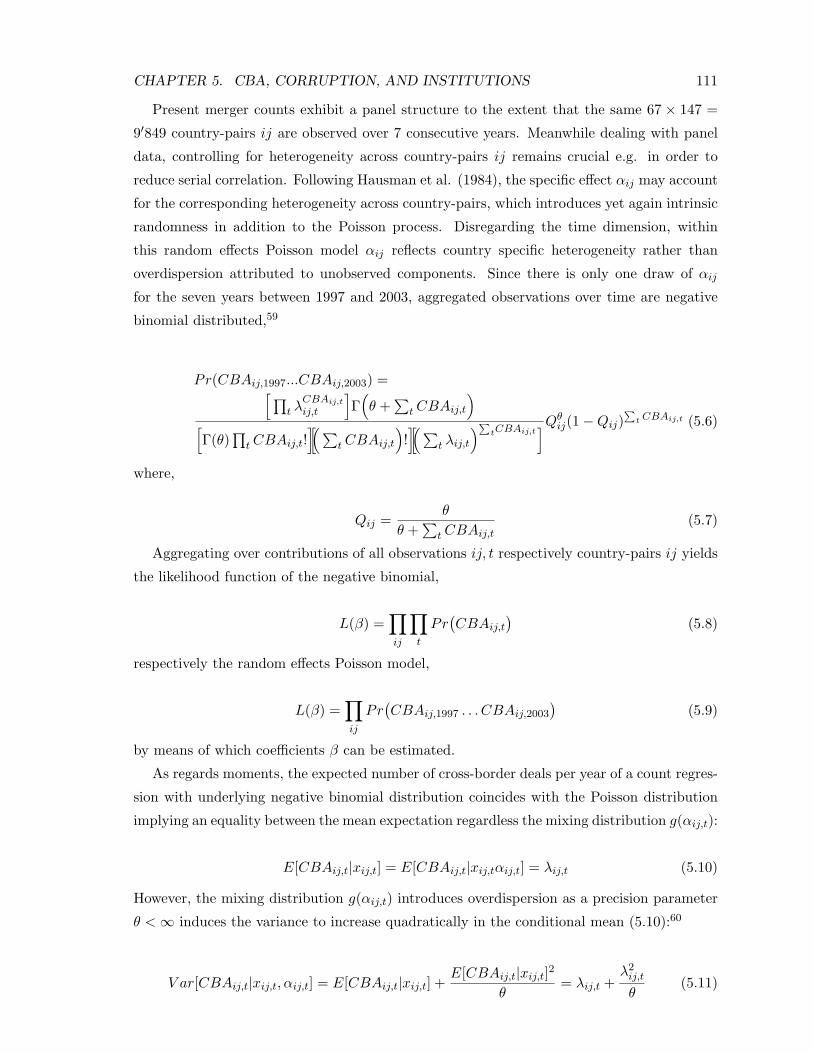
CHAPTER 5. CBA, CORRUPTION, AND INSTITUTIONS 111
Present merger counts exhibit a panel structure to the extent that the same 67 × 147 =
9′849 country-pairs ij are observed over 7 consecutive years. Meanwhile dealing with panel
data, controlling for heterogeneity across country-pairs ij remains crucial e.g. in order to
reduce serial correlation. Following Hausman et al. (1984), the specific effect αij may account
for the corresponding heterogeneity across country-pairs, which introduces yet again intrinsic
randomness in addition to the Poisson process. Disregarding the time dimension, within
this random effects Poisson model αij reflects country specific heterogeneity rather than
overdispersion attributed to unobserved components. Since there is only one draw of αij
for the seven years between 1997 and 2003, aggregated observations over time are negative
binomial distributed,59
Pr(CBAij,1997...CBAij,2003) =[ ∏t λ
CBAij,t
ij,t
]Γ(θ +
∑t CBAij,t
)[Γ(θ)
∏t CBAij,t!
][( ∑t CBAij,t
)!][( ∑
t λij,t
)∑tCBAij,t
]Qθij(1−Qij)
∑t CBAij,t (5.6)
where,
Qij =θ
θ +∑
t CBAij,t(5.7)
Aggregating over contributions of all observations ij, t respectively country-pairs ij yields
the likelihood function of the negative binomial,
L(β) =∏ij
∏t
Pr(CBAij,t
)(5.8)
respectively the random effects Poisson model,
L(β) =∏ij
Pr(CBAij,1997 . . . CBAij,2003
)(5.9)
by means of which coefficients β can be estimated.
As regards moments, the expected number of cross-border deals per year of a count regres-
sion with underlying negative binomial distribution coincides with the Poisson distribution
implying an equality between the mean expectation regardless the mixing distribution g(αij,t):
E[CBAij,t|xij,t] = E[CBAij,t|xij,tαij,t] = λij,t (5.10)
However, the mixing distribution g(αij,t) introduces overdispersion as a precision parameter
θ < ∞ induces the variance to increase quadratically in the conditional mean (5.10):60
V ar[CBAij,t|xij,t, αij,t] = E[CBAij,t|xij,t] +E[CBAij,t|xij,t]2
θ= λij,t +
λ2ij,t
θ(5.11)

CHAPTER 5. CBA, CORRUPTION, AND INSTITUTIONS 112
The caveat against estimating (5.1) by means of maximum-likelihood (ML) lies in restric-
tive and to a wide extent arbitrary assumptions about the mixing distribution g(αij,t). In
particular, Gourieroux et al. (1984) show maximum likelihood estimates like (5.8) and (5.9)
to be inefficient or even inconsistent should g(αij,t) not follow a Gamma distribution and pro-
pose to restrict the focus on first and second moments instead to obtain estimates consistent
with a wider range of mixing distributions. Within this spirit, Brannas and Johansen (1996)
propose an approach based on the method of moments (MM), which rests on rearranging the
exponential mean specification (5.1) respectively (5.10) into the orthogonality condition:
E[CBAij,t − exp(x′ij,tβ)|xij,t] = 0 (5.12)
Given instruments zij,t, dim(zij,t) = dim(xij,t), a consistent estimator for β minimises the
sample moment condition in its quadratic form,
Q(β) =∑
t
∑ij
((CBAij,t−exp(x
′ij,tβ))zij,t
)′
W∑
t
∑ij
((CBAij,t−exp(x
′ij,tβ))zij,t
)(5.13)
where W denotes a symmetric weighting matrix.
Based on ML and MM-estimation techniques, the remainder revisits the evidence on the
determinants of cross-border merger activity and subsequently introduces dimensions related
to institutional quality.
5.3 A Baseline Specification of International Merger Activity
5.3.1 Econometric Specification and Data
To date, empirical studies on FDI rely heavily on the gravity framework introduced by e.g.
Frankel et al. (1996). In particular, whilst analysing the impact of corruption upon FDI
respectively modeling international merger activity, Wei (2000), Braconier et al. (2005), and
Di Giovanni (2005) find exchanges to increase in economic size (GDP) but to decrease in
distance between country-pairs ij. Despite achieving a good fit to the data, gravity models
lack a clear theoretical underpinning as why MNEs enjoy cost advantages over local firms.61
Therefore, the following baseline specification follows Carr et al. (2001), where explicit cost
advantages inherent in horizontally respectively vertically integrated MNEs guide the choice
of covariates xij,t:

CHAPTER 5. CBA, CORRUPTION, AND INSTITUTIONS 113
E[CBAij,t|xij,t] = (5.14)
exp(β0 + β1(
∑GDPij,t) + β2(∆GDPij,t)2 Econ. Size
+β3(∆WAGEij,t) + β4(∆WAGEij,t) ∗ (∆GDPij,t) Fact. Cost
+β5DISTANCEij + β6LANGUAGEij Trade Cost
β7INV COSTij Inv. Cost
+β8EXRij,t + β9STOCKi,t+ Fin. Depth
β10CUij,t + β11FTAij,t + β12SERV AGREEij,t
)PTA
Table 5.8 of the appendix reports summary statistics for all variables meanwhile table 5.7
contains their exact definition and source. The common sample covering 67 source and 147
host countries as well as spanning over 7 years from 1997 to 2003 encompasses almost 48’000
observations.
Variables pertaining to economic size account for scale economies to reflect the rationale
for horizontal respectively market access driven CBAs. More specifically, the sum of GDP
between source country i and host country j (∑
GDPij,t) proxies for the firms desire to seek
access to economically large markets and is expected to yield a positive entry. Conversely,
the squared difference in GDP (∆GDP 2ij,t) is supposed to impact negatively upon merger
counts when more dissimilar sized markets benefit single plant (or national) firms locating
only in the larger country and shipping commodities to foreign markets in order to fully take
advantage of scale economies accruing to the plant level. Jointly, this first pair of variables
should reflect the inverted U-shape of horizontal merger activity across positive and negative
differences in economic size predicted by the KK-theory of the MNE.
Turning towards vertical motives, where MNE outsource stages of production across coun-
tries to reach the benefits of comparative advantage, (5.14) employs data on relative costs
rather than endowments of various types of labour. Meanwhile direct measures on the en-
dowment of skilled and unskilled labour would produce a closer correspondence to theory, the
distortions arising on imperfectly competitive labour markets due to national regulations, or
differences in preferences and technology could drive a wedge between relative factor abun-
dance and cost (Braconier et al., 2005).62 Following Di Giovanni (2005) real GDP per capita
proxies for wage costs. Then, increasing differences in wage cost ∆WAGEij,t across country-
pairs are expected to entail vertical merger activity from skilled labour abundant countries
towards unskilled labour abundant countries. Moreover, the nonlinearities inherent in the
KK-theory associate with the interaction between factor endowments and country size and
necessitate the inclusion of a corresponding variable (∆GDPij,t ∗ ∆WAGEij,t), a negative
entry of which would reflect the predicted disproportional share of vertical merger activity

CHAPTER 5. CBA, CORRUPTION, AND INSTITUTIONS 114
undertaken by small but skilled labour abundant countries.
Variables such as the geographic distance between capital cities (DISTANCEij) or the
cultural distance in terms of the existence of a common language between country i and j
(LANGUAGEij) control for trade costs. Due to the various motives underlying CBAs, the
theoretical impact of trade costs is ambiguous. In fact, horizontal MNEs provide a vehicle to
access markets and circumvent trade barriers63 meanwhile any barrier obstructing intra-firm
trade reduces potential cost savings from vertical integration. Furthermore, the number of
procedures to set up a business (INV COSTj) has been borrowed from Djankov et al. (2002)
to proxy for the regulatory burden when investing in host country j. The expected coefficient
is negative since, under a scenario of low trade but hight investment cost, firms might wish
to serve foreign markets through exports rather than building up production capacity abroad.
Owing to their volatility, financial market variables constitute the main candidates to
provide an explanation for the pronounced increase and subsequent downturn of CBAs during
the period under consideration. Thereby, Di Giovanni (2005) suggests financial deepening in
terms of domestic stock market capitalisation relative to GDP (STOCKi,t) to initiate merger
projects when managers suffer from hubris as companies share-prices continue to rise. Merger
waves seem to coincide indeed widely with burgeoning stock markets.
Exchange rate fluctuations provide another channel through which financial markets might
alter the return on FDI relative to domestic investment. In particular, Froot and Stein (1991)
present an argument that a real appreciation of the domestic currency (increase in EXRij,t)
entails relative wealth effects reducing the cost of acquiring firms abroad. However, in case
foreign affiliates are primarily set up in order to reimport commodities back into the source
country the converse relationship might occur. Furthermore, unlike assets such as bonds,
firm specific assets - e.g. headquarter services considered within the KK-model - might be
geographically mobile and their input value might therefore remain widely unaffected by fluc-
tuations in currencies or inflation. Overall, theories on the link between FDI and exchange
rate fluctuations suggest, thus, an ambiguous relationship (see Blonigen, 1997).
Aside from economic factors, Frankel et al. (1996) have proposed various forms of prefer-
ential trading agreements (PTA) as a determinant for international exchange such as trade in
goods, services, and finance. Once more, the theoretical impact remains a priori ambiguous
as FDI might substitute or complement trade.

CHAPTER 5. CBA, CORRUPTION, AND INSTITUTIONS 115
5.3.2 Baseline Results
Looking first at the empirical distribution of international merger activity in respect to eco-
nomic size and wages, figure 5.1 scatters CBA-counts observed during the years 1997-2003
into 400 groups according to relative differences in GDP and GDP per capita between source
country i and host country j. Thereby, positive and negative divergence between country-
pairs has been normalised by their sum of GDP respectively wages to restrict values on the
interval between 1 and -1. The relatively high importance of CBAs in small but wealthy
countries predicted by the KK-theory manifests in the accumulation of CBAs in the right
corner of figure 5.1. Conversely, the empirical distribution of CBA-activities around the
world does not seem to exhibit the expected inverted U-shape along the axis of differences
in economic size as suggested by the KK-model. However, figure 5.1 refers to relative rather
than absolute size, which constitutes the basis for scale economies determining whether firms
desire to access foreign markets through exports from a single plant or duplicating production
across multiple plants.
Figure 5.1: CBA Activity relative to Differences in GDP and Wages
Column (1) and (2) of table 5.3 contain estimates of the baseline model (5.14) by means of
maximum likelihood with an underlying negative binomial respectively random effects Pois-
son model along the lines of (5.4) and (5.6). With a pseudo R2 above 0.8 and most coefficients
being significant on the 1% level, the baseline specification attains a close fit to the data.
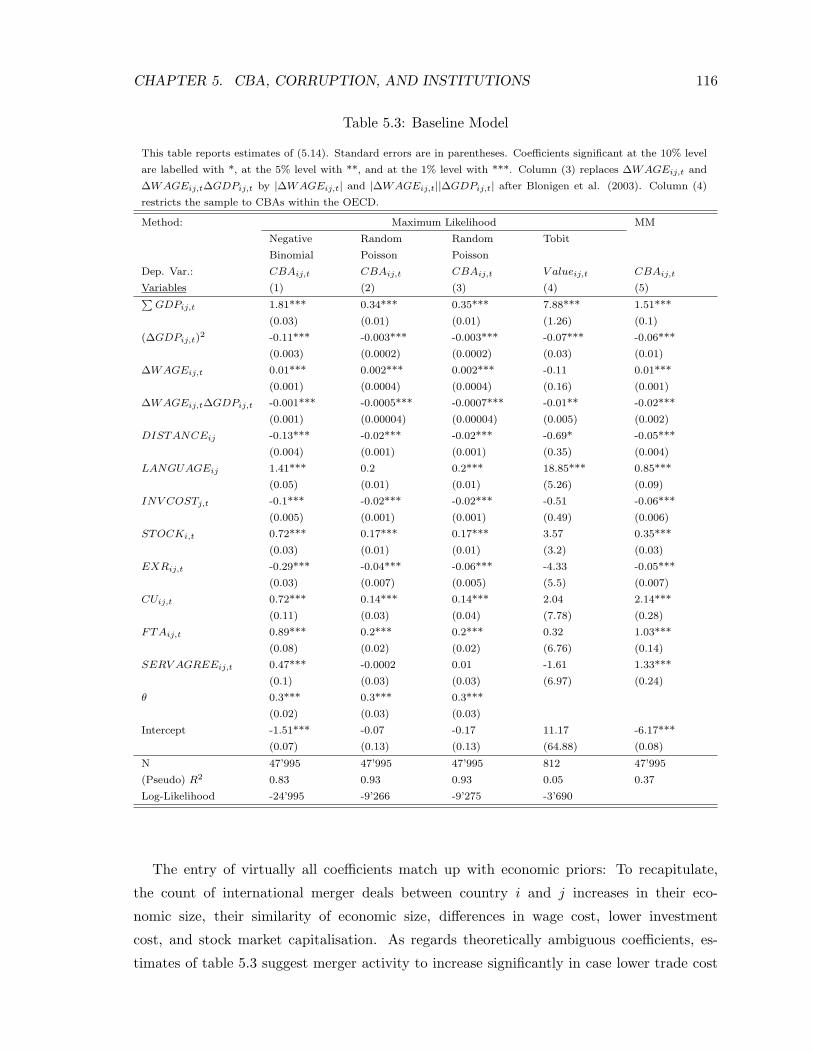
CHAPTER 5. CBA, CORRUPTION, AND INSTITUTIONS 116
Table 5.3: Baseline Model
This table reports estimates of (5.14). Standard errors are in parentheses. Coefficients significant at the 10% level
are labelled with *, at the 5% level with **, and at the 1% level with ***. Column (3) replaces ∆WAGEij,t and
∆WAGEij,t∆GDPij,t by |∆WAGEij,t| and |∆WAGEij,t||∆GDPij,t| after Blonigen et al. (2003). Column (4)
restricts the sample to CBAs within the OECD.
Method: Maximum Likelihood MM
Negative Random Random Tobit
Binomial Poisson Poisson
Dep. Var.: CBAij,t CBAij,t CBAij,t V alueij,t CBAij,t
Variables (1) (2) (3) (4) (5)∑GDPij,t 1.81*** 0.34*** 0.35*** 7.88*** 1.51***
(0.03) (0.01) (0.01) (1.26) (0.1)
(∆GDPij,t)2 -0.11*** -0.003*** -0.003*** -0.07*** -0.06***
(0.003) (0.0002) (0.0002) (0.03) (0.01)
∆WAGEij,t 0.01*** 0.002*** 0.002*** -0.11 0.01***
(0.001) (0.0004) (0.0004) (0.16) (0.001)
∆WAGEij,t∆GDPij,t -0.001*** -0.0005*** -0.0007*** -0.01** -0.02***
(0.001) (0.00004) (0.00004) (0.005) (0.002)
DISTANCEij -0.13*** -0.02*** -0.02*** -0.69* -0.05***
(0.004) (0.001) (0.001) (0.35) (0.004)
LANGUAGEij 1.41*** 0.2 0.2*** 18.85*** 0.85***
(0.05) (0.01) (0.01) (5.26) (0.09)
INV COSTj,t -0.1*** -0.02*** -0.02*** -0.51 -0.06***
(0.005) (0.001) (0.001) (0.49) (0.006)
STOCKi,t 0.72*** 0.17*** 0.17*** 3.57 0.35***
(0.03) (0.01) (0.01) (3.2) (0.03)
EXRij,t -0.29*** -0.04*** -0.06*** -4.33 -0.05***
(0.03) (0.007) (0.005) (5.5) (0.007)
CUij,t 0.72*** 0.14*** 0.14*** 2.04 2.14***
(0.11) (0.03) (0.04) (7.78) (0.28)
FTAij,t 0.89*** 0.2*** 0.2*** 0.32 1.03***
(0.08) (0.02) (0.02) (6.76) (0.14)
SERV AGREEij,t 0.47*** -0.0002 0.01 -1.61 1.33***
(0.1) (0.03) (0.03) (6.97) (0.24)
θ 0.3*** 0.3*** 0.3***
(0.02) (0.03) (0.03)
Intercept -1.51*** -0.07 -0.17 11.17 -6.17***
(0.07) (0.13) (0.13) (64.88) (0.08)
N 47’995 47’995 47’995 812 47’995
(Pseudo) R2 0.83 0.93 0.93 0.05 0.37
Log-Likelihood -24’995 -9’266 -9’275 -3’690
The entry of virtually all coefficients match up with economic priors: To recapitulate,
the count of international merger deals between country i and j increases in their eco-
nomic size, their similarity of economic size, differences in wage cost, lower investment
cost, and stock market capitalisation. As regards theoretically ambiguous coefficients, es-
timates of table 5.3 suggest merger activity to increase significantly in case lower trade cost

CHAPTER 5. CBA, CORRUPTION, AND INSTITUTIONS 117
(DISTANCEij , LANGUAGEij), a customs union (CUij,t), free trade agreement (FTAij,t),
or a service agreement (SERV AGREEij,t) facilitate international exchanges. CBAs seem,
thus, to complement rather than substitute for trade. Finally, an increase in EXRij,t des-
ignating a real appreciation decreases outward merger activity implying that the associated
additional cost of reexporting commodities seem to offset relative wealth effects.
Blonigen et al. (2003) have challenged econometric specifications like (1) and (2) of ta-
ble 5.3 on grounds of sign reversals inherent in difference-terms like ∆WAGE or ∆GDP ,
which render the interpretation of coefficients somewhat awkward. Meanwhile increases in
positive differences translate into a divergence in economic size or factor prices, the op-
posite holds for negative differences. In order to relax linear constraints associated with
difference-terms as well as facilitate interpretation, Blonigen et al. (2003) propose to ap-
ply absolute values |∆WAGEij,t| and |∆WAGEij,t||∆GDPij,t| instead of ∆WAGEij,t and
(∆WAGEij,t)(∆GDPij,t). Results of this absolute value model, reported in column (3) of
table 5.3, coincide widely with the original specification involving difference-terms. Above all,
unlike Blonigen et al. (2003), applying absolute values does not result in sign reversal. The
caveat against the absolute value model lies in its inconsistency with any theoretical model
underlying MNE activity as well as imposing an implausible assumption about symmetric
merger activity between country-pairs ij and ji (Carr et al., 2003).
For the sake of comparability, column (4) of table 5.3 contains estimates of a Tobit regres-
sion onto cumulative values of merger deals (V ALUEij,t) akin to Rossi and Volpin (2004) as
well as Di Giovanni (2005). However, the preponderance of zero-valued observations, which
amount to over 95%, highlights the problem of undisclosed deal-values discussed during sec-
tion 5.2.1 and manifests in a poor fit of Tobit estimates, a large number of iterations until
conversion and even a breakdown of ML-estimates. Therefore, estimates of column (4) rest
on aggregated data across time, restricted to OECD economies, which lowers the share of
zero-valued observations to about 40%. Despite widely coinciding directions of impact, the
empirical fit of corresponding coefficients falls well short of count regressions.
Finally, column (5) of table 5.3 employs the MM as estimation strategy, which mitigates
against potential inconsistency, should merger counts, CBAij,t, conditional on covariates,
xij,t, not follow a negative binomial distribution. The direction of impact and the significance
of resulting coefficients remain broadly unaffected by employing this alternative estimation
strategy. Compared with ML, coefficients obtained by the MM tend, however, to be somewhat
larger.

CHAPTER 5. CBA, CORRUPTION, AND INSTITUTIONS 118
5.4 Introducing Institutional Quality
Following North (1990), the term ”institution” refers here to a set of humanly devised con-
straints - be they formal constitutions and laws or informal customs and conventions - which
structure the framework wherein MNEs take-over target firms. Institutions crucially shape
incentives to undertake FDI, with quality referring to their capability to lower transaction
cost. Despite being embedded in highly persistent formal and informal constraints, institu-
tions change incrementally like society itself. Above all, as modus operandi of any economy
and depending on their quality, the present section endeavours to establish both direction
and degree, to which specific institutional features facilitate or obstruct international merger
activity. Thereby, institutions might comprise an array of conventions, codes of conduct,
norms of behaviour, laws, and political and legal contracts, which go well beyond the gov-
ernance variables like shareholder protection and accounting standards in source countries
featuring in Rossi and Volpin (2004). Moreover, the present panel count data allow to take
into account the effects of institutional evolution and decay meanwhile analysing differences
in the amount of CBAs across countries.
5.4.1 Four Dimensions of Institutional Quality
Whilst the importance of institutional quality meanwhile undertaking FDI is hardly contro-
versial, the dimensions which allow to measure its empirical impact upon CBA-activity are
far from obvious. In particular, investment cost of the base model (5.14), which rests on
Carr et al. (2001), may only account for one of several components inherent in institutional
quality. However, institutional evolution is likely to manifest in additional dimensions, which
impose formal and informal constraints when MNEs invest in other firms or deal with govern-
ment authorities to access a foreign market. In particular, the following 7 variables reflecting
4 broad groups of institutional quality, might impinge on MNEs decision to acquire firms
abroad:
(a) Democratic Accountability
1. DEMOCRACYj,t: Formal democratic rule with effective electoral competition,
which constraints political abuses.
2. V OICEj,t: Voice and accountability, which accompanies formal democratic rule
and encompasses dimensions like civil liberties, political rights, or the indepen-
dence of the media.
(b) Proliferation of Property Rights
1. PROPRIGHTj,t: Legal protection against expropriation by well established and
secure property rights.

CHAPTER 5. CBA, CORRUPTION, AND INSTITUTIONS 119
2. LEGGBRj : Countries with British or common law heritage.
(c) Regulatory Quality and Investment Cost
1. INV COSTj : Cost of doing business measured by the number of procedures offi-
cially required to start up a business.
2. REGULATIONj,t: Regulatory quality promoting necessary economic policies
like. e.g. an adequate supervision of banks whilst avoiding market unfriendly
interventions like price controls.
(d) Corruption
1. CORRUPTIONj,t: Enforcement of rights by an uncorrupted government and
bureaucracy.
The top panel of table 5.4 provides summary statistics about institutional quality vari-
ables with precise definitions and exact sources being deferred to table 5.7 of the appendix.
Thereby, CORRUPTIONj,t, DEMOCRACYj,t, PROPRIGHTj,t, REGULATIONj,t, and
V OICEj,t evolve over time and differ across countries whereas LEGGBRj and INV COSTj
vary only across countries. Institutional quality variables relate to host countries meaning
the absolute value of transaction cost to take-over the potential target determines investment
opportunities as well as a countries capability to attract FDI, regardless the institutional
quality of specific source countries. Finally, variables of table 5.4 coincide widely with dimen-
sions of La Porta et al. (1999) to assess the nexus between the quality of government and
economic and financial development.
Table 5.4: Summary Statistics of Institutional Quality VariablesDEMO. VOICE PROPR. LEGGBR INVCOST REGUL. CORRUPT.
Unit Indicator Index Indicator Index % GDP per C. Index Index
Mean 0.68 -0.02 3.08 0.34 9.69 -0.02 5.33
Std. 0.47 0.99 1.2 0.47 3.33 0.98 0.47
Min. 0 -2.32 1 0 2 -3.99 0
Max 1 1.72 5 1 19 2.27 9.6
N 89’392 98’124 79’994 103’600 72’520 95’904 47’730
Correlation Matrix
(Based on 44’178 Common Observations)
DEMO. VOICE PROPR. LEGGBR INVCOST REGUL. CORRUPT.
VOICE 0.54
PROPRIGHT 0.26 0.76
LEGGBR -0-01 -0.007 0.2
INVCOST -0.15 -0.37 -0.38 0.08
REGULATION 0.27 0.8 0.83 0.1 -0.38
CORRUPTION -0.21 -0.76 -0.83 -0.15 0.37 -0.81
CBAij,t 0.03 0.1 0.11 0.04 -0.05 0.1 -0.11

CHAPTER 5. CBA, CORRUPTION, AND INSTITUTIONS 120
The correlation matrix of the bottom panel of table 5.4 reveals the (unconditional) rela-
tionship among institutional quality variables, some of which being well established in the
literature.
As regards democracy, Lederman et al. (2005) suggest government structures fostering
political transparency and electoral competition to create an environment of accountability,
where firms and the state tend to engage less in practices of bribery. Likewise, according
to Djankov et al. (2003, pp.28ff.) political systems with more open access to public power,
greater constraints on the executive power, and granting more political rights - in brief having
the prerequisites of democratic rule - impose less cumbersome regulation of entry.
La Porta et al. (1998) find no strong effect of countries to compensate a limited offer
of property rights towards shareholders and creditors by better enforcement. Against this
background, the control of CORRUPTIONj,t and PROPRIGHTj,t exhibit a surprisingly
close correlation amounting to -0.83. This might partly be attributed to Germanic and
Scandinavian legal heritage, which tends to create institutions enforcing rights in a rather
effective and virtuous manner, in spite off affecting economic activities by vast government
intervention.
In respect to regulatory quality, Djankov et al. (2003, pp.22ff.) suggest extensive state
intervention to reflect government failure rather than attempts to correct market failure, par-
ticularly in form of creating opportunities to extract bribes. La Porta et al. (1997, 1998)
have established the merits of legal systems rooted in the common law tradition to proliferate
property rights as opposed to civil law heritage of French origin, which tends to bring about
higher state intervention and more cumbersome regulation. Indeed, they see legal origin
as a broad measure of investor protection. Consequently, the negative correlation between
PROPRIGHTj,t and INV COSTj might originate to some extent in the legal system.
Above all, aside from CORRUPTION, PROPRIGHT, and REGULATION, which exhibit
a rather close correlation above 0.8, other pairs show modest correlation coefficients. This
suggests that the proposed four dimensions account for various aspects of institutional quality
within a complex system of checks and balances.
5.4.2 Empirical Impact of Institutional Quality
Columns (1) to (5) of table 5.5 report subsequently the individual and joint impact of the four
dimensions of institutional quality proposed during the previous section upon cross-border
merger counts. Due to being the most widely used count model, estimates rest on the nega-
tive binomial framework. Employing an alternative estimation strategy - like moment based
methods - does, however, not alter the essence of the results. In any case, variables of the
baseline specification (5.14) control for spurious correlation.

CHAPTER 5. CBA, CORRUPTION, AND INSTITUTIONS 121
Table 5.5: Count Regressions with Institutional Quality VariablesThis table introduces institutional quality variables into (5.14). Coefficients are estimated by ML with an underlying
negative binomial distribution (5.4). The dependent variable is merger counts CBAij,t. Standard errors are in
parentheses. Coefficients significant at the 10% level are labelled with *, at the 5% level with **, and at the 1%
level with ***.
Hor. Vert.
Full Sample CBA CBA
(1) (2) (3) (4) (5) (6) (7)
DEMOCRACYj 0.1* 0.17** 0.14* 0.16*
(0.06) (0.07) (0.08) (0.08)
V OICEj,t 0.62*** 0.24*** 0.26*** 0.23***
(0.03) (0.04) (0.05) (0.05)
PROPRIGHTj,t 0.62*** 0.22*** 0.23*** 0.22***
(0.02) (0.03) (0.04) (0.04)
LEGGBRj -0.11*** -0.05 -0.1** 0.04
(0.04) (0.04) (0.05) (0.05)
INV COSTj 0.008*** -0.007 0.001 -0.01
(0.0004) (0.006) (0.007) (0.07)
REGULATIONj,t 0.76*** 0.18*** 0.19*** 0.14***
(0.03) (0.05) (0.05) (0.05)
CORRUPTIONj -0.25*** -0.07*** -0.04** -0.08***
(0.01) (0.02) (0.02) (0.02)
Control Variables yes yes yes yes yes yes yes
N 48’023 46’755 48’385 31’860 31’394 31’394 31’394
Pseudo. R2 0.833 0.831 0.833 0.829 0.830 0.762 0.777
Democracy refers here to its broad definition requiring, aside from political competition
at the ballot box, voice and accountability within a transparent political process. Following
Lederman et al. (2005), countries with effective electoral competition (DEMOCRACYj,t)
share an Executive Index of Electoral Competitiveness (EIEC), compiled by the World Bank
(2002), above 5 and are not run by a military officer. Thereby, DEMOCRACYj,t constitutes
an indicator variable with democratic regimes scoring a value of 1 as opposed to dictatorships
designated by a value of 0. Since the period under consideration (1997-2003) did not fall into
a wave of democratisation, only a few countries such as Ghana, Indonesia, or the Philippines
saw a change in DEMOCRACYj,t. Secondly, V OICEj,t has been extracted as latent variable
from a structural model and reflects the extent to which effective voice and accountability
shapes political rule before and after the elections.
The effect of democratisation on institutional quality is twofold: Firstly, electoral control
allows to hold misbehaving or incompetent politicians accountable at the poll. Secondly, due
to electoral competition, relatively more competent representatives could be selected into
power. Above all, as suggested by the significant positive entry of variables pertaining to
democratic accountability, transparent governance reduces uncertainty and transaction cost,
and thereby allow hosts to attract more CBAs.64
CHAPTER 5. CBA, CORRUPTION, AND INSTITUTIONS 122
International mergers rest on entrenched and safeguarded property rights, which give the
acquirer the power to extract returns on investment from the target firm, and thereby uphold
incentives to enter a foreign market. In order to establish the empirical effect of property
rights, the Heritage Foundations’ rating on a scale from 1 to 5 is employed, where higher
values refer to a lower risk of expropriation.65
As suggested by the significant positive entry of PROPRIGHTj,t, entrenched property
rights protect shareholders and creditors from expropriation by insiders or the state and raise
the willingness of MNEs to take-over control of firms in host country j. Contrasting the lit-
erature on finance and development (La Porta et al., 1997, 1998), which emphasises common
law countries to be more conductive to investment, present results on CBA activity do not
support this result. One explanation might be that civil law countries do not constitute a
homogenous group. In particular, countries with a German or Scandinavian legal heritage
likewise support well established and safeguarded property rights, which could be better re-
flected within PROPRIGHT. Furthermore, a variable like legal heritage does not allow for
dynamic improvements or decay in securing property rights.
Undertaking merger projects involves obtaining permission by various regulators like the
clearance by competition or financial services authorities. Clearly, less burdensome regulation,
measured by the number of procedures66 required to legally set up a firm (INV COSTj) as
well as a latent index of regulatory quality (REGULATIONj,t), fosters cross-border merger
activity within host countries j. However, only the latent measure of regulatory quality pro-
duces consistently significant results.
Finally, an endemically corrupt bureaucracy or judiciary jeopardises the enforcement of
the soundest regulation or most extensive property rights. Indeed, corruption - defined as
the abuse of public power for private benefit - infringes prevailing laws and inherently under-
mines institutional quality. In essence, the significant negative entry of CORRUPTIONj,t,
measured by a composite index on basis of the perception of country experts, business people,
and the general public, uncovers enforcement as a separate dimension of institutional quality.
Then again, this corruption perception index (CPI) compiled by Transparency International
on a yearly basis, accounts for the possibility of institutional evolution. Yet, with values
of the correlation matrix for the years 1997 - 2003 exceeding 0.95, considerable persistence
seems to characterise the ranking of corruption around the world.
Remaining columns (6) and (7) of table 5.5 attempt to split CBAs into horizontal and ver-
tical deals meanwhile uncovering the impact of institutional quality variables. In particular,
an equality of SIC code between acquirer and target firm identifies deals on the same stage
of production, respectively distribution, which therefore are likely to be driven by horizon-

CHAPTER 5. CBA, CORRUPTION, AND INSTITUTIONS 123
tal, market access considerations. Conversely, merger counts including deals with different
SIC codes between acquirer and target, and thereby involving an investment across stages of
production, contain deals, which are rather vertical or conglomerate in nature. SIC codes of
almost any deal are reported in SDC Platinum. Based on employing 2 digit SIC codes, during
the period under consideration, 48% of all deals where horizonal in nature with remaining
52% either being vertical or conglomerate CBAs. Results of columns (5), (6), and (7) do not
show any qualitative difference, suggesting that poor institutional quality affects horizonal
and vertical CBA activity alike.
Finding statistical significance on variables proxying for institutional quality does not
per se coincide with economic significance, e.g. sufficiently large coefficients affecting the
distribution and growth of a considerable number of cross-border deals across countries and
time. Due to nonlinearities, the coefficients β of count regressions do, however, not directly
represent responses towards incremental changes of covariates. Rather after subsequently
differentiating (5.1) and rearranging, the marginal impact xk upon the expected number of
CBAs is given by,
∂E[CBA|x]∂xk
= exp(x′)βk (5.15)
where for the sake of exposition subscripts i, j, and t have been dropped. The marginal
response ∂E[CBA|x]∂xk
depends, thus, on the actual values of covariates x and therefore differs
across country-pairs and time. In order to measure marginal responses regardless, (5.15) can
be evaluated for an average host country e.g,
1N
∑j
∂E[CBA|x]∂xk
=1N
∑j
βkexp(x′β) (5.16)
where βkexp(x′β) may designate the mean or the median of covariates across host countries
and years. Table 5.6 evaluates (5.16) in respect to the 7 institutional quality variables.
Table 5.6: Marginal Impact of Institutional Quality VariablesThis table shows the average response of merger counts towards marginal changes in institutional
quality variables after (5.16).
Marginal Response Democ. Voice Propr. Leggbr Invcost RegulationCorruption
Covariates averaged according to the mean
Total 18 25 23 -5 -1 19 -7
Horizontal 7 14 12 -5 0 9 -2
Vertical 8 11 10 2 -1 7 -4
Covariates averaged according to the median
Total 11 16 14 -3 0 12 -5
Horizontal 5 9 8 -4 0 6 -1
Vertical 5 7 7 1 0 4 -2

CHAPTER 5. CBA, CORRUPTION, AND INSTITUTIONS 124
Results suggest that during the period under consideration the typical host country67 could
have attracted up to 25 more mergers from abroad by improving institutional quality variables
incrementally (signs in table 5.6 are negative when variables measure weak institutions rather
than institutional quality). Thereby, simulations based on the median across covariates of
host countries produce somewhat smaller effects. However, against the benchmark that
according to table 5.2 about half of the countries around the world - many of which with
rather weak institutions - have attracted less than 10 merger deals between 1997 and 2003,
these effects appear to be of considerable magnitude. Economically large benefits accrue in
particular to improving democratic rule, safeguarding property rights, and keeping regulation
modest. Conversely, institutional quality variables widely advocated in previous studies like
investment cost (Carr et al, 2001) or common law origin (La Porta et al. 1997, 1998, 1999)
not only fail to be statistically significant after table 5.5, but also seem to deter cross-border
merger deals to a rather small extent.
Some caution needs however applying when interpreting the evaluated marginal effect of
institutional quality variables in table 5.6. In particular, these results have been obtained
for the benchmark of an average host country as regards economic, geographic, and financial
control variables. However, countries around the world differ a great deal in terms of economic
and financial development, as well as their geographic location in respect to large markets for
corporate control. Therefore, these average results might not be meaningful when looking at
institutional changes within a specific country.
Finally, results do not differ fundamentally when the sample is cut according to whether or
not acquiring and target firms share the same SIC code. Considering that the resulting split
divides the sample almost equally into what are likely to be rather horizontal and vertical,
respectively conglomerate driven CBAs, table 5.6 identifies somewhat higher impacts of voice
and accountability, property rights, and regulatory quality on horizontal CBAs. Conversely,
vertical CBAs seem relatively more affected by investment cost, and corruption. Finally,
common law origin produces an opposing albeit relatively small impact.
5.5 Concluding Remarks
The present event count study has introduced institutional quality as a determinant of in-
ternational merger activity alongside established variables like economic size, differences in
factor prices respectively endowment, trade and investment costs, or financial deepening.
Thereby, institutional quality - defined as a set of humanly devised rules designed to lower
the cost of transactions - manifests in established democratic rule, low investment cost, mod-
est regulation, entrenched property rights, and the control of corruption. According to results
based on panel count regressions, institutional quality variables impact upon the number of
cross-border merger deals in a widely significant manner, both statistically and economically.

CHAPTER 5. CBA, CORRUPTION, AND INSTITUTIONS 125
However, variables like common law origin or investment cost, which feature prominently
in the literature on finance and development respectively measuring the knowledge capital
model, fail to produce significant impacts. Furthermore, there does not seem to be any large
difference in the impact upon horizonal and vertical CBA activity.
As regards policy, this result suggests countries should endeavour to establish government
based on principles of accountability, safeguarding property rights, modest regulation, and
the control of corruption in order to attract FDI in form of international merger deals to
benefit fully from globalisation.

CHAPTER 5. CBA, CORRUPTION, AND INSTITUTIONS 126
Data Appendix
Country Coverage
The baseline specification of table 5.3 contains data on the following countries:
As Source and Host: Argentina, Australia, Austria, Bahamas, Bahrain, Belgium, Brazil,
Bulgaria, Canada, Chile, China, Colombia, Croatia, Cyprus, Czech Republic, Denmark,
Egypt, Estonia, Finland, France, Germany, Greece, Hong Kong, Hungary, Iceland, India,
Indonesia, Ireland, Israel, Italy, Japan, Korea, Kuwait, Latvia, Lithuania, Luxembourg,
Malaysia, Mexico, Netherlands, New Zealand, Norway, Oman, Pakistan, Panama, Peru,
Philippines, Poland, Portugal, Romania, Russia, Saudi Arabia, Singapore, Slovakia, Slovenia,
South Africa, Spain, Sweden, Switzerland, Thailand, Trinidad and Tobago, Turkey, Ukraine,
United Arab Emirates, United Kingdom, United States, Venezuela, Zimbabwe.
As Host: Albania, Algeria, Angola, Antigua, Armenia, Azerbaijan, Bangladesh, Barbados,
Belarus, Benin, Bolivia, Bosnia, Botswana, Bukina Faso, Burundi, Cambodia, Cameroon,
Chad, Congo Rep., Costa Rica, Cote d’Ivoire, Dominican Rep., Ecuador, El Salvador, Ethiopia,
Fiji, Gabon, Gambia, Georgia, Ghana, Guatemala, Guinea, Guyana, Haiti, Honduras, Iran,
Jamaica, Jordan, Kazakhstan, Kenya, Kiribati, Kyrgyzstan, Lebanon, Macao, Macedonia,
Madagascar, Malawi, Mali, Malta, Mauritania, Mauritius, Moldava, Mongolia, Morocco,
Mozambique, Namibia, Nepal, Nicaragua, Niger, Nigeria, Papua New Guinea, Paraguay,
Rwanda, Senegal, Solomon Islands, Sri Lanka, Sudan, Swaziland, Syria, Tanzania, Tunisia,
Uganda, Uruguay, Uzbekistan, Vietnam, Yemen, Zambia.
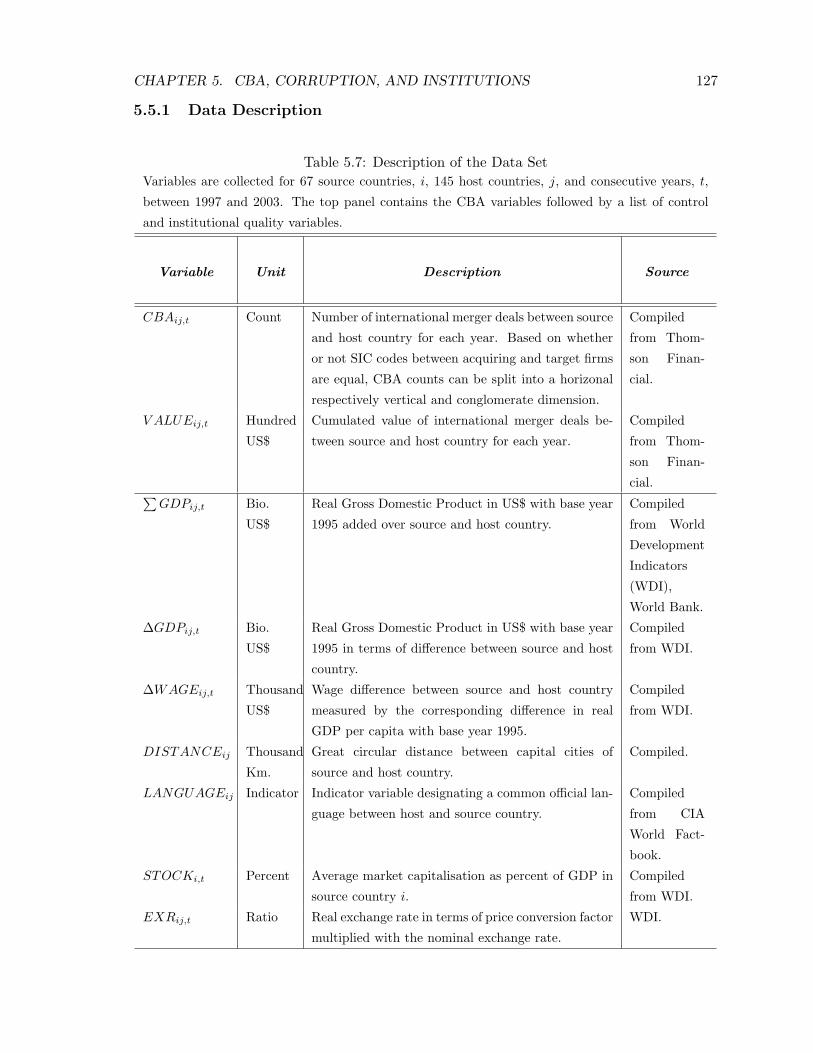
CHAPTER 5. CBA, CORRUPTION, AND INSTITUTIONS 127
5.5.1 Data Description
Table 5.7: Description of the Data SetVariables are collected for 67 source countries, i, 145 host countries, j, and consecutive years, t,
between 1997 and 2003. The top panel contains the CBA variables followed by a list of control
and institutional quality variables.
Variable Unit Description Source
CBAij,t Count Number of international merger deals between source
and host country for each year. Based on whether
or not SIC codes between acquiring and target firms
are equal, CBA counts can be split into a horizonal
respectively vertical and conglomerate dimension.
Compiled
from Thom-
son Finan-
cial.
V ALUEij,t Hundred
US$
Cumulated value of international merger deals be-
tween source and host country for each year.
Compiled
from Thom-
son Finan-
cial.∑GDPij,t Bio.
US$
Real Gross Domestic Product in US$ with base year
1995 added over source and host country.
Compiled
from World
Development
Indicators
(WDI),
World Bank.
∆GDPij,t Bio.
US$
Real Gross Domestic Product in US$ with base year
1995 in terms of difference between source and host
country.
Compiled
from WDI.
∆WAGEij,t Thousand
US$
Wage difference between source and host country
measured by the corresponding difference in real
GDP per capita with base year 1995.
Compiled
from WDI.
DISTANCEij Thousand
Km.
Great circular distance between capital cities of
source and host country.
Compiled.
LANGUAGEij Indicator Indicator variable designating a common official lan-
guage between host and source country.
Compiled
from CIA
World Fact-
book.
STOCKi,t Percent Average market capitalisation as percent of GDP in
source country i.
Compiled
from WDI.
EXRij,t Ratio Real exchange rate in terms of price conversion factor
multiplied with the nominal exchange rate.
WDI.

CHAPTER 5. CBA, CORRUPTION, AND INSTITUTIONS 128
Continued
CUij,t Indicator Indicator variable designating a customs union be-
tween source and host country.
Compiled
from WTO.
FTAij,t Indicator Indicator variable designating a free trade agreement
between source and host country.
Compiled
from WTO.
SERV AGREEij,t Indicator Indicator variable designating a service agreement
between source and host country.
Compiled
from WTO.
DEMOCRACYj,t Index
Score
Average over the 1990ies of an interactive indicator
for regimes with democratic characteristics in coun-
try j in terms of an Executive Index of Electoral
Competitiveness (EIEC) above a score of 5, not run
by military officer. Fully democratic regimes score a
value of 1 opposed to persistent dictatorships scoring
a value of 0.
World Bank
(2000) and
Lederman et
al. (2005).
V OICEj,t Latent
Vari-
able
Rating of voice and accountability meanwhile select-
ing a government. Voice and accountability captures
a multitude of features such as civil liberties, polit-
ical rights, or the independence of the media. The
variable has been extracted from an unobserved com-
ponents model for the years 1996, 1998, 2000, 2002.
For missing years 1997, 1999, 2001, 2003 observa-
tions from previous years have been taken. Higher
values mean more voice and accountability.
Kaufman et
al. (2005).
PROPRIGHTj,t Index
Score
Rating of property rights in country j. Original val-
ues have been reversed on a scale from 1 to 5 with
higher values indicating more secure property rights.
Heritage
Foundation.
LEGBRj Indicator Indicator variable for countries with British common
law heritage.
CIA World
Factbook.
INV COSTj Count Regulatory quality instrumented by the number of
procedures officially required to set up a firm in coun-
try j.
WDI and
Djankov et
al. (2002).
REGULATIONj,t Latent
Vari-
able
Regulatory quality in terms of the absence of mar-
ket unfriendly policies like price controls, inadequate
bank supervision, or excessive government interven-
tion. The variable has been extracted from an unob-
served components model for the years 1996, 1998,
2000, 2002. For missing years 1997, 1999, 2001, 2003
observations from previous years have been taken.
Higher values mean higher regulatory quality.
Kaufman et
al. (2005).
CORRUPTIONj,t Index
Score
Composite Corruption Perception Index (CPI) in
country j based on at least 3 surveys among country
experts, business people, or the general public. Orig-
inal values have been reversed on a scale from 1 to
10 with higher values indicating higher corruption.
Transparency
Interna-
tional.

CHAPTER 5. CBA, CORRUPTION, AND INSTITUTIONS 129
5.5.2 Summary Statistics
Table 5.8: Summary Statistics of Control VariablesCBAij,t
∑GDP ∆GDP 2 ∆WAGE ∆W.∆GDP DIST. INVCO. EXR STOCK
Unit Count US$(1995) US$(1995) US$(1995) US$(1995) Km Perc. - Perc.
Mean 0.43 0.67 2.46 7.07 12.31 7.4 9.69 1.07 0.67
Std. 5.47 1.53 11.39 17.58 44.61 4.41 3.33 1.54 0.72
Min. 0 0.004 0 -58.7 -252.1 0.06 2 0.00001 0
Max 438 18.39 89.55 59.11 306.3 19’84 19 46.55 5.95
N 107’744 81’425 81’425 70’257 69’538 88’529 72’520 70’018 87’984
Correlation Matrix
(Based on 47’995 Common Observations)
CBAij,t∑
GDP ∆GDP 2 ∆WAGE ∆W.∆GDP DIST. INVCO. EXR STOCK∑GDP 0.28
∆GDP 2 0.2 0.93
∆WAGE -0.01 0.07 0.08
∆W.∆GDP 0.05 0.84 0.83 0.16
DIST. -0.07 0.06 0.07 -0.01 0.08
INVCOST -0.09 -0.08 -0.06 0.3 0.004 0.04
EXR -0.01 -0.001 -0.01 -0.36 -0.02 -0.02 -0.21
STOCK 0.08 0.12 0.11 0.32 0.09 -0.001 -0.0001 -0.1

NOTES 130
Notes
54Conglomerate mergers constitute a third and unaccounted possibility with distinctive motives pertaining
to risk diversification whilst investing across industries and stages of production.55Such internal economies of scale occur when the cost per unit decreases in the size of the individual firm.
By way of contrast, external economies of scale, which relate to the size of the industry in a specific location,
typically do not entail MNE activity. Instead, local firms tend to cluster in specialised regions in order to take
advantage of agglomeration effects. External economies of scale have gone widely unnoticed in the literature
on international economics and finance. Krugman (1993) constitutes an exception.56In particular, Di Giovanni (2005) drops 56.3% of all deals due to undisclosed values.57The motivation for introducing this threshold is twofold: Firstly, FDI in general and CBAs in particular
involve an element of change in control. Secondly, Rossi and Volpin (2004, p.279) conjecture that the coverage
of transfers with minority stakes (those below 50%) depends on country-specific disclosure requirements and
might, therefore, suffer from sample selectivity.58Applying a logarithmic transformation to merger counts would mitigate against negatively fitted values.
However, the preponderance of zero-valued counts necessitates introducing an arbitrarily chosen small con-
stant, or dropping a substantial part of the sample. Alternatively, Wei (2000) employs a two-stage model
including a threshold, which identifies the realm of positive FDI flows endogenously.59Alternatively, Hausman et al. (1984) consider splitting up unobserved heterogeneity into components
pertaining to time (αt) and cross sectional dimensions (αij) to account more comprehensively for the panel
structure, which yields the random effects negative binomial model. In this case, the mixing distribution
g(.) relates to two parameters and is typically assumed to be Beta distributed. A second alternative lies in
specifying a fixed effects negative binomial model necessitating quasi differencing event counts to circumvent
the incidental parameter problem when the cross sectional dimension becomes large. Resulting distributions
are akin to the multinomial logit model. Details can again be found in Hausman et al. (1984) as well as
Cameron and Trivedi (1998, ch.9).60This property distinguishes the present negative binomial model of type II from the type I specification,
where the variance increases linearly in E[CBAij,t|xij,t].61The new trade theory (see e.g. Helpman and Krugman, 1985), where firms compete imperfectly and pursue
strategies of product differentiation, partly predicts the basic gravity relationship. However, the new trade
theory neglects the fact that industries characterised by corresponding scale economies are often dominated
by MNEs (Markusen, 1995).62Considering literacy rates as measure for skilled labour regardless, does not alter the essence of the results.
To save up space, corresponding estimates are not reported here.63In respect to protectionist measures, this traditional argument for FDI is sometimes referred to as ”tariff
jumping”.64Furthermore, the positive entry of democratic rule could partly pick up the impact of trade sanctions put in
place against ideologically opposed regimes for political reasons. E.g. the US upholds trade sanctions against
countries like Cuba, Myanmar, or North Korea essentially ruling out foreign investment. For an analysis of
economic sanctions onto FDI within a gravity framework, see Elliot and Hufbauer (1999).65Likewise to the cost of doing business, the number of procedures and the time required to register property
rights provides a quality measure. The World Bank publishes corresponding data (www.doingbusiness.org),
which, however, do not allow to control for dynamic change of institutional quality. Once again, considering
the official number of procedures respectively time to register property regardless, does not alter the essence
of the results.66Both the time and cost to set up a business constitute alternative measures for regulatory quality.
Presently, the number of procedures has been chosen as it most concisely represents the tollbooth theory

NOTES 131
of corruption, where regulators design a multitude of complementary permits in order to maximise their bribe
revenue (Shleifer and Vishny, 1993).67Equation (5.16) could also be evaluated for specific countries within the sample. E.g. a marginal reduction
in corruption in the UK would have increased the expected number of CBAs between 1997 and 2003 by about
14 deals (evaluated at the mean of the data). With actual incoming international merger activity standing at
4’336 deals during that period (see table 5.2), this is negligible suggesting that corruption does not constitute
a major obstacle for attracting foreign investment into the UK.

Bibliography
[1] Blonigen, B.A. (1997), ’Firm Specific Assets and the Link Between Exchange Rates and
Foreign Direct Investment’, The American Economic Review, vol.87, pp.447-465.
[2] Blonigen, B.A., Davies, R.B. and Head, K. (2003), ’Estimating the Knowledge-Capital
Model of the Multinational Enterprise: Comment’, The American Economic Review,
vol.93, pp.980-994.
[3] Braconier, H., Norback, P.H. and Urban, D. (2005), ’Multinational enterprises and wage
cost: vertical FDI revisited’, Journal of International Economics, vol.67, pp.446-470.
[4] Brannas, K. and Johansen, P. (1996), ’Panel Data Regressions for Counts’, Statistical
Papers, vol.37, pp.191-213.
[5] Cameron, C.A. and Trivedi, P.K. (1998), Regression analysis of count data, Cambridge,
Cambridge University Press.
[6] Carr, D.L., Markusen, J.R. and Maskus, K.E. (2001), ’Estimating the Knowledge-
Capital Model of the Multinational Enterprise’, The American Economic Review, vol.91,
pp.693-708.
[7] Carr, D.L., Markusen, J.R. and Maskus, K.E. (2003), ’Estimating the Knowledge-
Capital Model of the Multinational Enterprise: Reply’, The American Economic Review,
vol.93, pp.995-1001.
[8] Di Giovanni, J. (2005), ’What drives capital flows? The case of cross-border M&A
activity and financial deepening’, Journal of International Economics, vol.65, pp.127-
149.
[9] Djankov, S., La Porta, R., Lopez-De-Silanes, F. and Shleifer, A. (2002), ’The Regulation
of Entry’, The Quarterly Journal of Economics, vol.117, pp.1-37.
[10] Dunning, J.H. (1977), ’Trade, Location of Economic Activity and MNE: A Search for
an Eclectic Approach’ in Ohlin, B., Hesselborn, P.O. and Wijkman, P.M. (eds.), The
International Allocation of Economic Activity, London, Macmillan, PP.395-418.
132

BIBLIOGRAPHY 133
[11] Dunning, J.H. (1981), International Production and the Multinational Enterprise, Lon-
don, George Allen and Unwin.
[12] Elliott, K.A. and Hufbauer, G.C. (1999), ’Same Song, Same Refrain? Economic Sanc-
tions in the 1990’s’, The American Economic Review, vol.89, pp.403-408.
[13] Frankel, J.A., Stein, E. and Wei, S.J. (1996), ’Regional Trading Arrangements: Natural
or Supernatural?’, The American Economic Review, vol.86, pp.52-56.
[14] Froot, K.A. and Stein, J.C. (1991), ’Exchange rates and foreign direct investment:
an imperfect capital markets approach’, The Quarterly Journal of Economics, vol.106,
pp.1191-1217.
[15] Gourieroux, C., Monfort, A. and Trognon, A. (1984), Pseudo Maximum Likelihood
Methods: Applications to Poisson Models, Econometrica, vol.52, pp.701-720.
[16] Hausman, J., Hall, B.H. and Griliches, Z. (1984), ’Econometric Models for Count Data
with an Application to the Patents-R&D Relationship’, Econometrica, vol.52, pp.909-
936.
[17] Helpman, E. (1984), ’A Simple Theory of Trade with Multinational Corporations’, Jour-
nal of Political Economy, vol.92, pp.451-471.
[18] Helpman, E. and Krugman, P.R. (1985), Market Structure and Foreign Trade - Increas-
ing Returns, Imperfect Competition, and the International Economy, Brighton, Wheat-
sheaf Books Ltd.
[19] Kaufman, D., Kraay A. and Mastruzzi, M. (2005), ’Governance Matters IV: Governance
Indicators for 1996-2004’, Washington, World Bank.
[20] Krugman, P.R. (1993), Geography and Trade, Cambridge, MIT Press.
[21] La Porta, R., Lopez-De-Silanes, F., Shleifer, A. and Vishny, R.W. (1997), ’Legal Deter-
minants of External Finance’, The Journal of Finance, vol.52, pp.1131-1150.
[22] La Porta, R., Lopez-De-Silanes, F., Shleifer, A. and Vishny, R.W. (1998), ’Law and
Finance’, Journal of Political Economy, vol.106, pp.1113-1155.
[23] La Porta, R., Lopez-De-Silanes, F., Shleifer, A. and Vishny, R.W. (1999), ’The Quality
of Government’, The Journal of Law Economics and Organization, vol.15, pp.222-279.
[24] Lederman, D., Loyaza, N. and Reis Soares, R. (2005), ’Accountability and Corruption -
Political Institutions Matter’, Economics and Politics, vol.17, pp.1-35.
[25] Markusen, J.R. (1984), ’Multinationals, Multi-Plant Economics, and the Gains from
Trade’, Journal of International Economics, vol.16, pp.205-226.

BIBLIOGRAPHY 134
[26] Markusen, J.R. (1995), ’The Boundaries of Multinational Enterprises and the Theory of
International Trade’, Journal of Economic Perspectives, vol.9, pp.169-189.
[27] Markusen, J.R. and Maskus, K.E. (2002), ’Discriminating Among Alternative Theories
of the Multinational Enterprise’, Review of International Economics, vol.10, pp.694-707.
[28] Mauro, P. (1995), ’Corruption and Growth’, The Quarterly Journal of Economics,
vol.109, pp.681-712.
[29] North, D. (1990), Institutions, institutional change, and economic performance, Cam-
bridge, Cambridge University Press.
[30] Rossi, S. and Volpin, P.F. (2004), ’Cross-country determinants of mergers and acquisi-
tions’, Journal of Financial Economics, vol.74, pp.277-304.
[31] Shleifer, A. and Vishny, R.W. (1993), ’Corruption’, The Quarterly Journal of Economics,
vol.108, pp.599-617.
[32] UNCTAD (2001), World Investment Report 2000, Geneva, United Nations Conference
on Trade and Development.
[33] UNCTAD (2005), World Investment Report 2004, Geneva, United Nations Conference
on Trade and Development.
[34] Wei, S.J. (2000), ’How Taxing is Corruption on International Investors?’, The Review of
Economics and Statistics, vol.82, pp.1-10.
[35] World Bank (2002), Database of Political Institutions, Washington.

Part III
Concluding Remarks on the Causes
and Consequences of Corruption
135

136
The present thesis has endeavoured to shed some more light into what causes endemic cor-
ruption to persist in some countries whilst others maintain a government system relatively
clean of practices like bribery and nepotism, and establish some of the economic consequences
thereof. Meanwhile, the analysis revisited most of the causal and consequential factors en-
trenched in the literature on the economics of corruption.
According to its most common definition, corruption constitutes an abuse of public power
for private benefit. In particular, whenever agents, like bureaucrats or politicians, are en-
trusted with discretionary power over allocating considerable amounts of economic rent and
cannot be monitored perfectly, there is scope for opportunistic behaviour in terms of engaging
in corruption. Since almost any government intervention fulfills these criteria, no society can
probably claim not to have witnessed cases of corruption within its political or bureaucratic
system. Therefore, even government intervention aimed at correcting market failure bears
the risk of producing government failure instead when agents behave cynically, let alone the
possibility of the political elite as a principal designing a government system, which suits
them best in seeking self-enrichment.
An understanding of the differences across the elements upon which bribery rests - like the
discretionary power available to the government, economic rents, as well as the monitoring
and penalty system - stands crucial in assessing the differences in corruption around the
world.
Firstly, decentralising power across agents and territory might render its abuse less likely.
Above all, the first and second essay of the present thesis have considered the potential of
political decentralisation in terms of countries adopting federal constitutions, which indeed
proliferates lower levels of corruption. Other mechanisms decentralising power include the
market economy, where resources are exchanged on basis of the price system rather than al-
located though an economic plan, but also non-hierarchical belief systems like Protestantism.
Secondly, in countries with large and open markets, where firms face fierce domestic and
international competition, economic rents will be competed down rapidly and therefore pro-
vide fewer opportunities to engage in practices like directly unproductive profit seeking.
Furthermore, modest regulation and low taxes limit the rents at the discretion of the public
sector.
Finally - aside from these rather economic features - other disciplines typically focus on
the effectiveness of the monitoring and penalty system as a device to deter corrupt abuses.
However, every bureaucrat, judge, or police officer can likewise be tempted into bribery in
exchange for giving the accused a favourable verdict. Effective monitoring rests on there
being at least one honest agent. This is more likely to occur within a complex system of
checks and balances necessitating institutions like democratic rule, an independent judiciary

137
and media, but also civil and political liberties, which allow citizens to challenge government
power. All these institutions endeavour to hold trusties of power accountable or to select
agents into positions of power, which are likely to place public interest ahead of self-interest.
Countries around the world show a great deal of heterogeneity across institutions capable
off constraining corruption. However, creating the prerequisites necessary to effectively com-
bat public misconduct like political decentralisation, a competitive market economy, demo-
cratic rule, or an independent judiciary seems to be a formidable task, which has taken
countries decades if not centuries. For countries with a rather short history in institution-
building, reducing the extent of corruption towards bearable levels might therefore not be
achievable within the short-term.
Whilst institutional reform towards less corruption is tedious, the economic benefits thereof
might be substantial. The third essay has shown how bribery shapes an environment impeding
investment by reducing a countries capability to attract FDI in terms of cross-border merger
deals. Other studies have found an equally detrimental effect upon FDI in general, as well as
economic performance variables like GDP per capita. Endemic corruption seems to constitute
a considerable obstacle for some countries to benefit fully from globalisation. Intriguingly,
government effectiveness in terms of a transparent regulation not subject to the arbitrariness
of bribery, seems to be a much more promising way in fostering economic development than
reducing the size of government via deregulation.