the power of 'and' · car parc fe fuel use u.s. car parc ... although solar is more...
TRANSCRIPT

Praveen KedarGlobal Program Manager, Fuel Cell Propulsion System
Nov 16, 2009Delivering Renewable Hydrogen Workshop

2
The Power of “AND” vs. “OR”
• The Challenge - Petroleum AND GHG Reduction
• Role of Hydrogen - Transportation AND (Renewable) Energy
• Advanced Propulsion Portfolio
• Key Takeaways / “AND” Question

3
Source: DOE Energy Information Agency
MBDOE: Millions of barrels per day oil equivalent
The Challenge
– Global energy demand exceeds our current glide path for supply
– There are several risks thatcan disrupt the existing supply
• Above ground infrastructure
• Natural disasters
• Wars
• Hostile regimes
– Growing concern aboutglobal warming due to CO2
– Potential for regulations that exceedboth technical capability and business feasibility
Global increase 2% / year,71% increase over 2003
EnergyDemand(MBDOE)
0
50
100
150
200
250
300
350
400
2003 2030
Developing
Developed
88
111 146
195

4
United States Light Duty Vehicle Transportation2050 Greenhouse Gas Reduction Goal
LDV 2050 GHG Goal is 244 million tons CO2 equivalent
U.S. goal is 80% reduction from 1990 levels by 2050• Assuming light duty transportation must reduce its GHG footprint in equal
proportion to other contributing sectors of economy:
1990 fuel use
105 billion gallons
1990 GHG
1,220 million tons CO2
equivalent
2050 GHG goal
244 million tons CO2 equivalent (or less)
80% reduction

5
US Light Duty Vehicle TransportationDOE EIA 2030 Outlook
DOE EIA 2030 Outlook – Reference Case
• Continued steady growth in Vehicle Miles Traveled (VMT)
• Upward fuel price trend (highly uncertain)
• Fuel economy improvements offset growth in VMT
• Fuel use remains relatively flat (this is a break from past 40 year trend)
DOE EIA ProjectionsActuals
Vehicle Miles Traveled
Fuel Price
Car Parc FE
Fuel Use
U.S. Car Parc
2010 = 245M
2050 = 363MLinear
Extrapolationof DoE Projection
to 2050

6
Base Case – Petroleum World (2010-2050)
• EIA Annual Energy Outlook 2009 data– Includes aggressive fuel economy improvements
– Includes assumption that higher energy prices drive mix shift from trucks to cars
– Fuel economy improvement & vehicle-miles-traveled growth rates @ 1.5% / year
– Petroleum consumption & GHG emissions stay flat 2010 - 2050
Technology improvement & more efficient market mix hold petroleum consumption & GHG levels constant, but no progress toward goal
Petroleum Consumption GHG Emissions
with FE improvements and mix shift with FE improvements and mix shift
GHG emissions – petroleum Petroleum
Goal – 80% reduction from 1990 level by 2050
If the current and future car parc were gasoline only
DOE extrapolation DOE extrapolation

7
All Options in Play - - Power of “AND” (2010-2050)
• Cellulosic biomass ramps to high volume; BEVs / EREVs make 40% of VMT electric; FCEVs penetrate to 40% of parc by 2050
– Petroleum out of picture by 2032
– LDV parc mostly transitioned to electric drive and ZEV solutions
– US grid GHG modeled at 80% lower than 2008 levels
– Hydrogen from cellulosic biomass or clean electricity
Start soon with early options; finish with strongest long-term portfolio
Petroleum Consumption GHG Emissions
with FE improvements and mix shift with FE improvements and mix shift
Biomass GHG reduction - biomass
GHG emissions –petroleum / biomass / electricity / hydrogen production
Goal – 80% reduction from 1990 level by 2050
PetroleumElectricity
Electricity
Hydrogen
Hydrogen
DOE extrapolation DOE extrapolation

8
Energy & Technology Options
Energy
Resource
Energy
Carrier
Propulsion
SystemConversion
1st & 2nd Gen Biofuels
Hydrogen
Electricity
LiquidFuels
ICE Hybrid
Battery Electric
Plug-In Hybrid ICE
Fuel-Cell Electric
Conventional ICE:
Gasoline / Diesel
Range-Extended EV:
IC Engine / Fuel-Cell
Synthetic Fuels (XTL)
Petroleum Fuels
Nuclear
Coal
Natural Gas
Oil (Conventional)
Oil (Non-Conventional)
Syngas
CO, H2
Renewables(Solar, Wind, Hydro)
BiomassRegional Niche
Gaseous
Fuels
Ele
ctr
ific
ation
Critical D
ependency o
n B
attery
Technolo
gy
Despite Variety of Resources, 3 Predominant Energy Carriers

9
46 L 260 L
43 kg 125 kg
System System
670 L
830 kg
SystemCell
540 kg
360 L
46 L 260 L
43 kg 125 kg
System System
Lithium Ion Battery100 kWh electrical energy
Fuel Fuel
33 kg 6 kg
37 L 170 L
Diesel Compressed Hydrogen 700 bar6 kg H2 = 200 kWh chemical energy
Energy Carrier Properties: Onboard StorageWhy is petroleum the dominant transportation fuel?
Weight & Volume of Energy Storage System for 300 mile Range
The challenge is to balance electric drive efficiency and energy cost advantages vs. energy system storage mass, volume & refuel time penalties

Relationship between H2 & RenewablesGermany Case Study – Wind Energy in Germany 2008
Renewable energy sources fluctuate dramatically
Although solar is more predictable, its $/kWh is 5X more than wind
Placing significant wind energy on line necessitates an energy buffering strategy
1) DEWI-Report, 30.6.20082) Bundesverband Windenergie e.V., 20.11.2008

E.ON control area:40% of installed wind energy in Germany
Germany - Case StudyWind Energy and the Electric Grid
1) DEWI-Report, 30.6.20082) Bundesverband Windenergie e.V., 20.11.2008
German Wind Energy Example
Quantity: 19,868 turbines
Capacity: 23,044 MW1)
Electricity production 2007: 39.6 TWh2)
(7.2% of annual consumption)
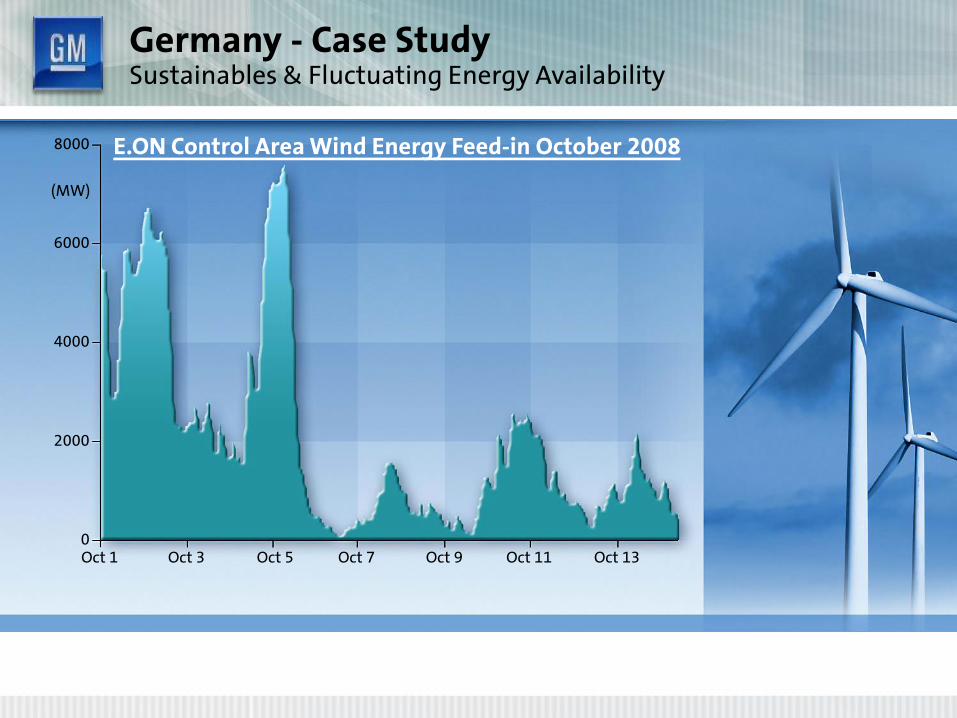
Germany - Case StudySustainables & Fluctuating Energy Availability
Oct 1 Oct 3 Oct 5 Oct 7 Oct 9 Oct 11 Oct 13
E.ON Control Area Wind Energy Feed-in October 2008
0
2000
4000
6000
8000
(MW)

This much could be fed into a large pump storage:
8,480 MWh = 1M Chevy Volt vehicles
Fluctuating Wind EnergyCompared to Conventional Pump Storage Capacity
Pump storage Goldisthal, Thüringen
Buffer capacity for some minutes / hours
Oct 1 Oct 3 Oct 5 Oct 7 Oct 9 Oct 11 Oct 130
2000
4000
6000
8000
(MW)

This much could be fed into an underground compressed air storage (2 Mio m3 salt cavern):
4,000 MWh
Source: KBB underground
Store Fluctuating Wind Energy:Storage of Compressed Air in Salt Caverns
Buffer capacity for some minutes / hours
Oct 1 Oct 3 Oct 5 Oct 7 Oct 9 Oct 11 Oct 130
2000
4000
6000
8000
(MW)

This much could be fed into an underground hydrogen reservoir (2 Mio m3 salt cavern):
600,000 MWh(equals 3.6 Mio tank fills)
HydrogenThe Energy Buffer in the Renewable Energy System
Only hydrogen offers storage capacity for several days
Source: KBB underground
Oct 1 Oct 3 Oct 5 Oct 7 Oct 9 Oct 11 Oct 130
2000
4000
6000
8000
(MW)

16
The Power of “AND” - Advanced Propulsion Portfolio
ImprovedVehicle Fuel Economy &Emissions
DisplacePetroleum
Hybrid ElectricVehicles (including
Plug-In HEV)IC Engine andTransmission
Improvements
Hydrogen Fuel Cell
Petroleum (Conventional & Alternative Sources)
Alternative Fuels (Ethanol, Bio-diesel, CNG, LPG)
Hydrogen
Electricity (Conventional & Alternative Sources)
Battery ElectricVehicles (EREV)
Time
EnergyDiversity
GM’s Advanced Propulsion Strategy comprehends the Power of “AND”

Application Map
Light Load
Drive Cycle
Du
ty C
ycle
ContinuousStop-and-go
High Load
City HighwayIntra-urban Highway-cycle
There is no single silver bullet technology

GM’s Hydrogen Fuel Cell TechnologyZero Emissions, Zero Petroleum, 2X Efficiency
FUEL CELL TECHNOLOGY
Zero emissions & zero petroleum
Compared to internal combustion engine:• More than twice as efficient
• Comparable precious metal content
• Comparable durability, range (300 miles), & performance
• Fast refueling – within 3 minutes
• 60% fewer part numbers
• 90% fewer moving parts
Cold & hot operation capability
Family sized vehicles
Synergy with renewable energy sources

Project Driveway – World’s Largest Fuel Cell Vehicle Fleet
REAL WORLD DATAOver 80,000 customers applied
116 vehicles in four countries
80 customer drivers
Over 10,000 people total have driven the vehicles
13,000 fills/30,000 kg of H2 = 60,000 gal of gasoline saved
Performed through 2 winters
Vehicles with over 25,000 miles
Over 1 MILLION miles
and Counting

20
Takeaways
• Meeting customer requirements AND GHG reduction goals AND reducing petroleum use requires a Portfolio of propulsion technologies
• Energy diversity key for BOTH energy AND transportation - -Hydrogen plays a key role
• Stable government policy is key to infrastructure & vehicle programs
Key AND Question:
“How can we work together with a collective will to enable all promising
technology solutions to quickly and efficiently reach market “tipping points”
and deliver their optimal interdependent value to consumers and the world?”
Larry Burns, retired GM VP, GM R&D & Planning