the potential of high resolution satellite interferometry ... potential of high resolution satellite...
TRANSCRIPT
15th
European Symposium on Improved Oil Recovery — Paris, France
27 – 29 April 2009
The Potential of High Resolution Satellite Interferometry for Monitoring
Enhanced Oil Recovery
Urs Wegmüller a
Lutz Petrat b
Karsten Zimmermann c
Issa al Quseimi d
1 Introduction
Over the last years land surface deformation monitoring using space-borne SAR interferometry
became operational. Sensors used include mainly the C-band (ERS-1, ERS-2, ENVISAT, Radarsat-1)
and L-band SAR Systems (JERS-1 and ALOS). Over the last year a new generation of SAR satellites
(e.g. TerraSAR-X, Radarsat-2) was launched and interferometric data series are now operationally
available. These new SAR sensors are characterized by high resolution modes. Furthermore, repeat-
intervals shorter than the typical 35-day interval known from the widely used European C-band SAR
systems are available.
High temporal and spatial resolution of these new SAR sensors reveal the potential of monitoring
small-scale and highly dynamic surface movements, which are expected to be useful for monitoring
more dynamic ground movements as occurring for example in the context of improved oil recovery
methods.
To evaluate this potential we used high resolution TerraSAR-X SAR data for monitoring surface
displacements over an oil field in the Middle East. To additionally support the quality of TerraSAR-X
results a comparison with high precise DGPS measurements was performed. This contribution
describes the processing done and summarizes the study results.
2 Objective
The objective of the study was to discuss data processing issues and results related to the differential
interferometric processing of high resolution TerraSAR-X SAR data acquired over an oil field in the
Middle East.
3 Input Data
3.1 TerraSAR-X Data
The TerraSAR-X satellite, launched in June 2007, is an X-Band SAR operating in different imaging
modes. For our experiment a series of StripMap data sets was acquired over an oilfield in The Middle
East. TerraSAR-X data were programmed and ordered by Infoterra Germany. The TerraSAR-X
repetition cycle of 11-days was exploited as much as possible, yielding a data stack of 16 StripMap
acquisitions between January and August 2008 (see Figure 1).
a GAMMA Remote Sensing AG, Switzerland, Email: [email protected] b Infoterra GmbH, Germany, Email: [email protected] c DMT GmbH & Co. KG, Germany, Email: [email protected] d Petroleum Development of Oman, Oman, Email: [email protected]

15th
European Symposium on Improved Oil Recovery — Paris, France
27 – 29 April 2009
TerraSAR-X Scenes
27.01.
07.02.
18.02.
29.02.
11.03.
22.03.
02.04.
24.04.
05.05.
07.06.
18.06.
29.06.
10.07.
21.07.
01.08.
12.08.
Sep Okt Nov Dez Jan Feb Mrz Apr Mai Jun Jul Aug Sep Okt Nov
Q4 '07 Q1 '08 Q2 '08 Q3 '08 Q4 '08
Figure 1: Acquisition Dates of available TerraSAR-X data
3.2 DGPS Data
GPS data were acquired by the oilfield operator at 74 locations in the oil field area. 69 of these points
were measured campaign wise as rover stations at the time periods illustrated in Figure 2.
DGPS Campaigns 109 Tage?
Campaign 1 10 Tage
Campaign 2 10 Tage
Campaign 2 10 Tage
Okt Nov Dez Jan Feb Mrz Apr Mai Jun Jul Aug
Q4 '07 Q1 '08 Q2 '08 Q3 '08
Figure 2: GPS campaigns in The Middle East oilfield
In total, 5 DGPS points (BAS1, REM1, REM2, REM3, REM4) were observed permanently,
providing a daily set of coordinates.
4 Data Processing
4.1 Differential Radarinterferometry
4.1.1 SLC Data, Multi-looking, Geocoding
Single Look Complex (SLC) TerraSAR-X data were obtained (so called TerraSAR-X Single-look
Slant-range Complex (SSC) data product). For the interferometric processing the GAMMA software
was used.
Averaged multi-look intensity images of the full scene and the section chosen for the deformation
monitoring are shown in Figure 3.

15th
European Symposium on Improved Oil Recovery — Paris, France
27 – 29 April 2009
Figure 3: Multi-Look Intensity Image of (a) Full TerraSAR-X StripMap scene; (b) Area of Interest
Geocoding was performed on the multi-look intensity image for the area of interest. No special
treatment was necessary and the state vectors looked accurate. As geometric reference representing
the map geometry in the lookup table refinement a geocoded Landsat PAN image was used. The
offsets which are corrected in the refinement step were only about 15 m in azimuth direction and
about 8 m in slant-range (12 m in ground-range). The standard deviation of the individual offset
estimates used in the refinement was below 2.5 m.
4.1.2 SLC Co-Registration
For SLC Co-registration, an approach was used, which considers local topography. This is expected to
be relevant at this very high spatial resolution. The heights used in our case were SRTM heights
which were transformed into the SAR multi-look geometry using the refined geocoding lookup table.
This co-registration approach includes also a refinement step using actual offset estimates between the
data sets and it provides error statistics. The SLC section on 5-May-2008 was used as reference
geometry. Offsets determined in a test for the co-registered SLC's showed a very low standard
deviation below 0.05 SLC pixels.
4.1.3 Differential Interferogram Generation
Initially, differential interferograms for all combinations and the entire area were generated. This was
done for several reasons:
� Estimation of orbital phase trends,
� derivation of dependence of coherence on ground cover, baseline and time interval,
� collection of experience regarding level, spatial scale, and location of deformation, atmospheric
effects, and other phase effects (e.g. caused by incorrect DEM),
� data quality checking.
Examples of a differential interferogram and of an RGB composite of coherence (red), backscatter
(green) and backscatter ratio (blue) are shown in Figure 4 for a 11-day pair in summer (Figure 4 (a),
(b), respectively.
BAFA Az. 424 - 12.00-1100031

15th
European Symposium on Improved Oil Recovery — Paris, France
27 – 29 April 2009
The specific differential interferometric phase shown includes:
� 1-2 phase cycles of residual orbital phase
� atmospheric phase (of the order of 1 phase cycle)
� deformation phase
� residual topographic phase
Deformation phase is only clearly visible locally in areas where it dominates over the typical level of
atmospheric phase.
The X-band coherence is high for most of the area over the 11-day periods considered. Over longer
periods the coherence gets reduced and in local areas with high deformation rates it gets difficult to
correctly resolve the interferometric phase.
Because of these observations, it was decided to use differential interferograms for a series of
consecutive intervals for the further analysis, i.e. A-B, B-C, C-D, etc. For the late winter pairs these
11 or 22-day differential interferograms could be efficiently unwrapped after an initial strong multi-
looking. This approach is well suited to estimate the spatially lower resolution component of the
differential interferometric phase. This lower resolution component corresponds mainly to
atmospheric phase, but it can, of course, also include deformation. For TerraSAR-X the spatial
resolution is high, so that the typical deformation cones are included in this low-resolution
component. This approach worked well for most of the area. The exception were small but very
important areas with strong deformation and very high phase gradients (= high deformation
gradients). For these local areas spatial unwrapping was done at the full resolution of the data without
prior multi-looking of the interferograms. Furthermore, the solutions were manually checked and in a
few cases corrected for obvious ambiguity errors.
Figure 4: (a) Differential Interferogram derived from TerraSAR-X acquisitions 21/07/2008 and
01/08/2008; (b) RGB of coherence σ°, σ°-ratio related to (c)
(a) (b)

15th
European Symposium on Improved Oil Recovery — Paris, France
27 – 29 April 2009
For the sub-section this processing was applied for a chain of subsequent pairs (A-B, B-C, C-D, …) of
11 days temporal baselines. For each of these pairs orbital phase was unwrapped and orbital phase
was subtracted. In order not to subtract deformation at low spatial scale no atmospheric phases were
subtracted. The unwrapped phases relative to a selected reference point were then converted to
vertical displacements (LOS component converted to total displacement under assumption that
movement is in vertical direction).
4.2 DGPS
Precise GPS measurements and a state of the art post processing analysis enable to determine high
accuracy point coordinates. Results can be mathematically evaluated regarding their quality, i.e. their
internal and external accuracy.
The accuracy of GPS point measurement depends among other things on the accuracy of the satellite
orbit and atmospheric interferences of signal transmission. Latest available software incorporates
these factors very well due to precise orbit data, latest atmospheric models and noise eliminating
techniques during data processing.
Figure 5 gives an example for the high external accuracy and shows the coordinate differences of
daily solutions of station REM 1 in relation to the fixed reference station BAS 1. The daily solutions
have horizontal coordinate differences lower then 1 mm and height difference lower then 2 mm.
Joining all daily solutions to a weekly solution leads to accuracies of sub-millimeter level.
-5,00
-4,00
-3,00
-2,00
-1,00
0,00
1,00
2,00
3,00
4,00
5,00
24/04 25/04 26/04 27/04 28/04 29/04 30/04
REM 1 - N (Total RMS Week: 0,6 mm)
REM 1 - E (Total RMS Week: 0,8 mm)
REM 1 - U (Total RMS Week: 1,2 mm)
Figure 5: Repeatability of daily solutions of GPS station REM 1 (ordinate in mm)
All GPS rover points were analyzed campaign wise in order to enable a large scale comparison of
results with the corresponding TerraSAR-X deformation map. During the acquisition period of
TerraSAR-X the reference station (BAS1) and four locations (REM1, REM2, REM3, REM4) were
processed in more detail and provided with a daily sampling of coordinates to also enable monitoring
of dynamic ground movements.
15th
European Symposium on Improved Oil Recovery — Paris, France
27 – 29 April 2009
5 Results
5.1 Monitoring of large scale subsidence pattern
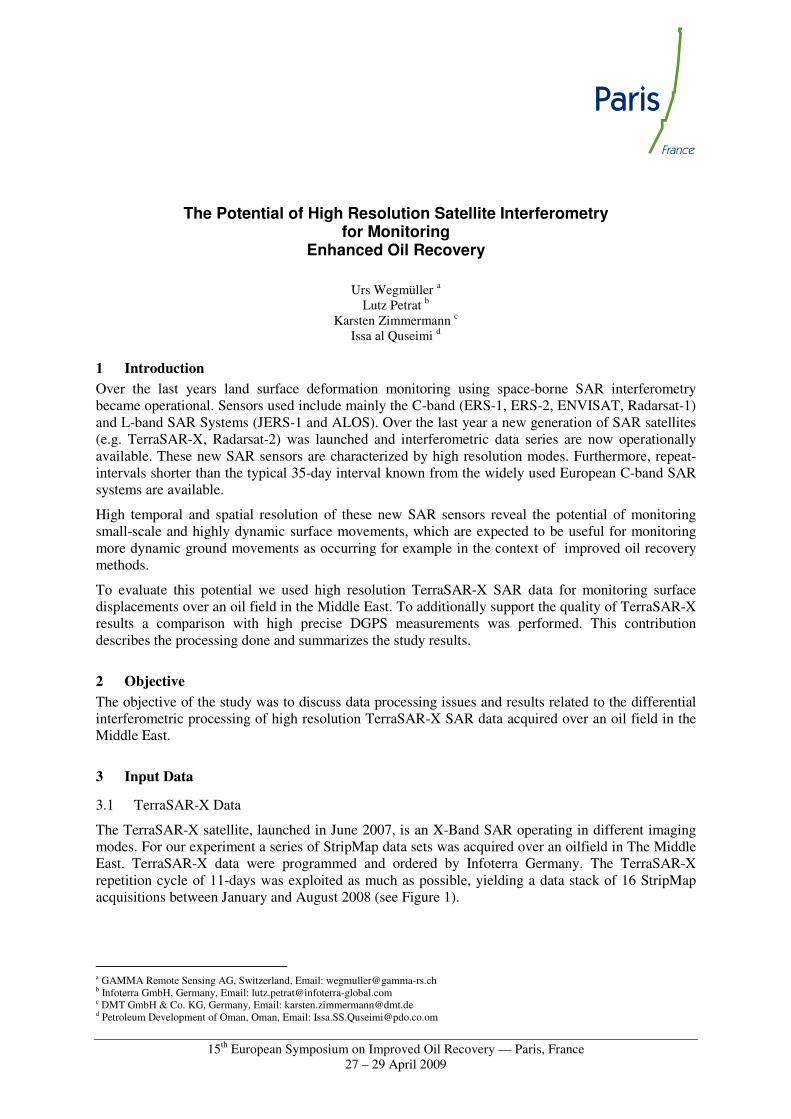
In the short interval pairs the atmospheric distortions are severe. Only strong local deformation can
reliably be identified and quantified. There remains an atmosphere related error of the order of 1 cm.
In the integrated solution the relative importance of the atmospheric path delay heterogeneity is
reduced because more deformation (and consequently deformation phase) occurs over longer periods.
The large scale subsidence in the center of the area shown becomes clearly visible. About 5 cm of
subsidence is observed in this area which dominates clearly over the typical 1 cm atmospheric error
(Figure 6).
Figure 6: TerraSAR-X derived large scale and uniform surface movements and area of interest of
highly dynamic surface movements (red rectangle)
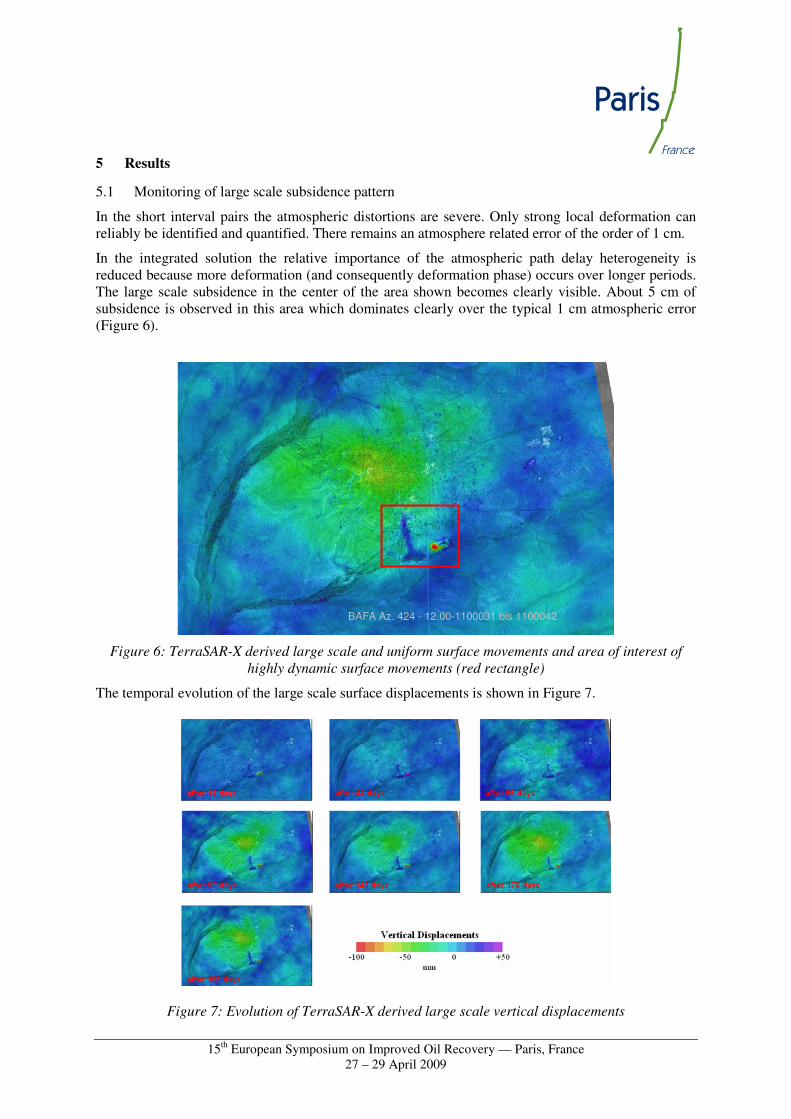
The temporal evolution of the large scale surface displacements is shown in Figure 7.
Figure 7: Evolution of TerraSAR-X derived large scale vertical displacements
BAFA Az. 424 - 12.00-1100031 bis 1100042

15th
European Symposium on Improved Oil Recovery — Paris, France
27 – 29 April 2009
5.2 Localized, Highly Dynamic Surface Movements
Apart from the large scale surface movement above the oilfields we observed localized areas of
specific surface movement phenomena. Highly dynamic surface movements were identified in a sub-
set area marked with a red rectangle in Figure 6.
The illustration of the temporal evolution of surface displacements shown in Figure 7 demonstrates
the high dynamic of the surface movement in this area. Two signals can be identified in each surface
displacement map of this figure, which can be separated due to their different temporal behavior:
First, a strong uplift signal in the west can be identified in the beginning of the observation period.
Uplift decreases after a duration of approx. 22 days. This initial uplift detected by TerraSAR-X can be
well approved by GPS measurements. Permanently measured GPS point “REM 1” is located near to
the uplift zone. Figure 11 shows the location and almost identical vertical movement detected by both
GPS and TerraSAR-X.
Second, a signal which is very rapidly changing from subsidence to uplift can be observed in the
eastern part of the chosen sub-set in Figure 7. It has an extent of about 1200 m in length and approx.
400 m in width. This signal changes during the observed period from subsidence to uplift then again
to subsidence and again to uplift with temporally varying but high movement rates. Displacement
maps derived from the last 11 days interferogram indicate that the signal decayed to an uplift of lower
amplitude.
Figure 8: Oilfield related anomaly and sample evolution of TerraSAR-X – 11 days vertical
displacements
The consecutive short-term vertical displacements extracted for one specific point (see black cross in
Figure 8, first displacement map in time series), illustrate the temporal evolution of the movement
(see Figure 9). Daily vertical displacements were calculated by dividing the displacement value at the
chosen point by the temporal baseline (in days) of the related interferogram.
These daily vertical displacements were then related to the intermediate between the two SAR
acquisition dates used for interferogram calculation. This approach allows estimating the temporal
behavior of the signal.
The dynamic character of the signal with uplift and subsidence at rates up to approx. 10 mm/day is
clearly visible. Unfortunately, there was no GPS point in this area for comparison.

15th
European Symposium on Improved Oil Recovery — Paris, France
27 – 29 April 2009
-15
-10
-5
-
5
10
16
.01
.08
31
.01
.08
15
.02
.08
01
.03
.08
16
.03
.08
31
.03
.08
15
.04
.08
30
.04
.08
15
.05
.08
30
.05
.08
14
.06
.08
29
.06
.08
14
.07
.08
29
.07
.08
Date
Ve
rt. D
isp
lace
me
nt [m
m/D
ay]
Figure 9: Evolution of displacements on one specific point of interest (indicated by black cross in
Figure 8) using selected interferograms with temporal baselines of 11 days
5.3 Comparison with DGPS data
For a large scale comparison of TerraSAR-X and GPS results, the 1. GPS campaign (23/01/2008 –
05/02/2008) was set as reference epoch for GPS analysis. The time period of the first GPS campaign
is almost identical to the time period related to the first TerraSAR-X interferogram used as reference
for integrated DInSAR results. The measured vertical movements of GPS points during the following
campaigns were compared to the integrated results of TerraSAR-X. Figure 10 shows the differences
of vertical movements of the 2. GPS campaign and the corresponding integrated DInSAR result of
24/04/2008. The points are categorized into classes with respect to the difference between DInSAR
and GPS analyzes. It can be seen that the maximum difference of vertical movements derived from
GPS and DInSAR is below 2 cm. The majority of the points show differences clearly below 1 cm.
Figure 10: Differences (in [m]) of vertical surface displacement between TerraSAR-X integrated
deformation map (20080424) and results of 2. GPS campaign (20080410 – 20080423)
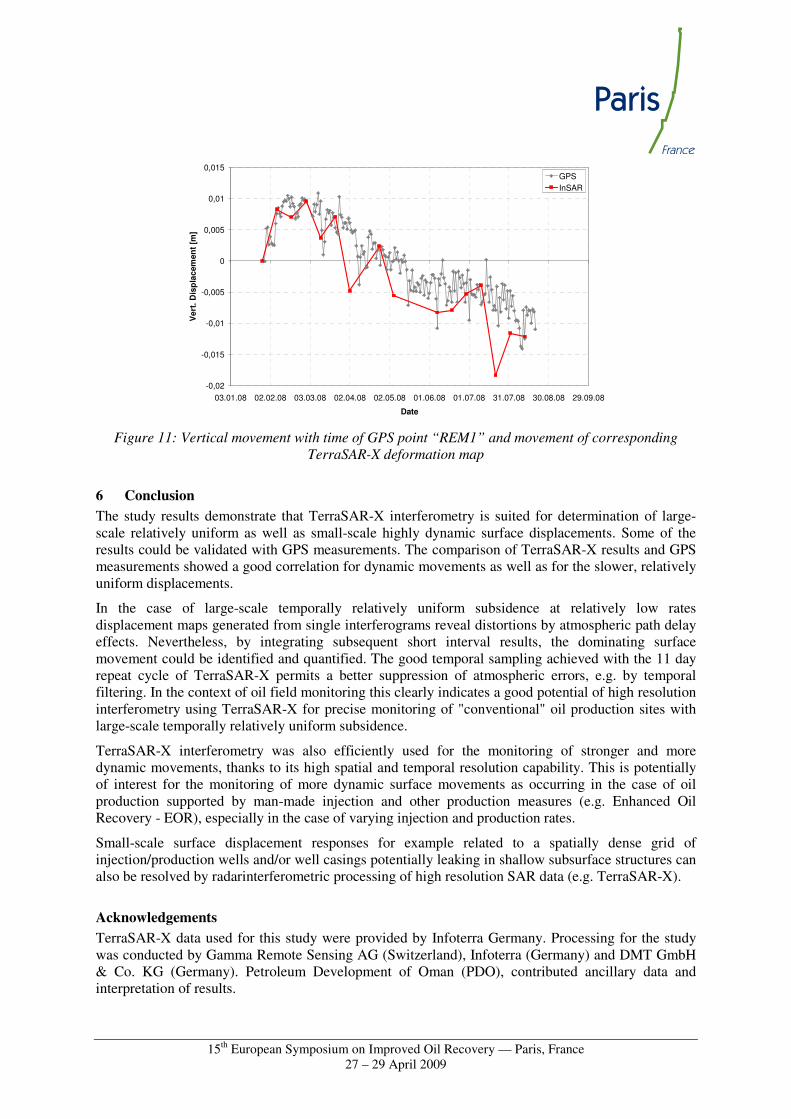
The permanently observed GPS points REM 1 to REM 4 were compared to TerraSAR-X DInSAR
derived vertical movements. Figure 11 shows the corresponding illustration for the time series of
vertical displacements at GPS point REM 1 in comparison to TerraSAR-X derived results. Except for
deviations due to atmospheric phase a good correlation between GPS and TerraSAR-X results can be
stated.
15th
European Symposium on Improved Oil Recovery — Paris, France
27 – 29 April 2009
-0,02
-0,015
-0,01
-0,005
0
0,005
0,01
0,015
03.01.08 02.02.08 03.03.08 02.04.08 02.05.08 01.06.08 01.07.08 31.07.08 30.08.08 29.09.08
Date
Ve
rt.
Dis
pla
cem
en
t [m
]
GPS
InSAR
Figure 11: Vertical movement with time of GPS point “REM1” and movement of corresponding
TerraSAR-X deformation map
6 Conclusion
The study results demonstrate that TerraSAR-X interferometry is suited for determination of large-
scale relatively uniform as well as small-scale highly dynamic surface displacements. Some of the
results could be validated with GPS measurements. The comparison of TerraSAR-X results and GPS
measurements showed a good correlation for dynamic movements as well as for the slower, relatively
uniform displacements.
In the case of large-scale temporally relatively uniform subsidence at relatively low rates
displacement maps generated from single interferograms reveal distortions by atmospheric path delay
effects. Nevertheless, by integrating subsequent short interval results, the dominating surface
movement could be identified and quantified. The good temporal sampling achieved with the 11 day
repeat cycle of TerraSAR-X permits a better suppression of atmospheric errors, e.g. by temporal
filtering. In the context of oil field monitoring this clearly indicates a good potential of high resolution
interferometry using TerraSAR-X for precise monitoring of "conventional" oil production sites with
large-scale temporally relatively uniform subsidence.
TerraSAR-X interferometry was also efficiently used for the monitoring of stronger and more
dynamic movements, thanks to its high spatial and temporal resolution capability. This is potentially
of interest for the monitoring of more dynamic surface movements as occurring in the case of oil
production supported by man-made injection and other production measures (e.g. Enhanced Oil
Recovery - EOR), especially in the case of varying injection and production rates.
Small-scale surface displacement responses for example related to a spatially dense grid of
injection/production wells and/or well casings potentially leaking in shallow subsurface structures can
also be resolved by radarinterferometric processing of high resolution SAR data (e.g. TerraSAR-X).
Acknowledgements
TerraSAR-X data used for this study were provided by Infoterra Germany. Processing for the study
was conducted by Gamma Remote Sensing AG (Switzerland), Infoterra (Germany) and DMT GmbH
& Co. KG (Germany). Petroleum Development of Oman (PDO), contributed ancillary data and
interpretation of results.