the potential of deriving tree-ring-based field … · the potential of deriving tree-ring-based...
TRANSCRIPT

The Potential of Deriving Tree-Ring-Based Field Reconstructions of Droughtsand Pluvials over Fennoscandia*,1
KRISTINA SEFTIGEN
Regional Climate Group, Department of Earth Sciences, University of Gothenburg, Gothenburg, Sweden
EDWARD R. COOK
Lamont-Doherty Earth Observatory, Palisades, New York
HANS W. LINDERHOLM, MAURICIO FUENTES, AND JESPER BJÖRKLUND
Regional Climate Group, Department of Earth Sciences, University of Gothenburg, Gothenburg, Sweden
(Manuscript received 2 December 2013, in final form 16 October 2014)
ABSTRACT
Moisture availability has been identified as one of the most important factors in the context of future climate
change. This paper explores the potential of applying a multiproxy approach to dendroclimatology to infer the
twentieth-century moisture variability over Fennoscandia. Fields of the warm-season (June–August) standardized
precipitation evapotranspiration index (SPEI) were developed from a dense network of precipitation-sensitive
annually resolved tree-ring width (TRW), maximum density (MXD), and stable carbon (d13C) and oxygen (d18O)
isotope chronologies using a point-by-point local regression technique (PPR). Two different approaches were
tested for selecting candidate tree-ring predictors of SPEI for each gridpoint reconstruction: a search radiusmethod
and a search spatial correlation contourmethod.As confirmed by a range ofmetrics of reconstruction fidelity, both
methods produced reconstructions showing a remarkably high accuracy in a temporal sense, but with some minor
regional differences. As a whole, the spatial skill of the reconstructed fields was generally quite good, showing the
greatest performance in the central and southern parts of the target region. Lower reconstruction skills were
observed in northern part of the study domain. Regional-scale moisture anomalies were best captured by the
reconstructions, while local-scale features were not as well represented. The authors speculate that a spatially and
temporally varying tree-ring proxy response to temperature and precipitation in the region may cause some un-
certainties in a Fennoscandian hydroclimatic reconstruction; this needs further investigation. Overall, this study
shows a great potential for making long-term spatiotemporal reconstructions of moisture variability for the
Fennoscandian region using tree-ring data.
1. Introduction
Observations of increased global temperatures, re-
duction in ice and snow covers, and rising global sea level
are all unambiguous evidences of a warming climate sys-
tem. It is well recognized that the global mean surface
temperature has increased during the past century (e.g.,
Hansen et al. 2010; Lawrimore et al. 2011; Jones et al. 2012;
Rohde et al. 2013), and, according to future climate pro-
jections, will continue to rise over the twenty-first century
(IPCC 2013). A warmer climate will lead to an increased
risk of hydroclimatological extremes (Wetherald and
Manabe 2002). While northern Europe has already shown
Denotes Open Access content.
* Lamont-Doherty Earth Observatory Contribution Number
7866 and Contribution Number 28 from the Sino-Swedish Centre
for Tree Ring Research (SISTRR).1 Supplemental information related to this paper is available at
the Journals Online website: http://dx.doi.org/10.1175/JCLI-D-13-
00734.s1.
Corresponding author address: Kristina Seftigen, Regional Cli-
mate Group, Department of Earth Sciences, University of Goth-
enburg, Box 460, SE-405 30 Gothenburg, Sweden.
E-mail: [email protected]
1 MAY 2015 S E F T IGEN ET AL . 3453
DOI: 10.1175/JCLI-D-13-00734.1
� 2015 American Meteorological Society

a 10%–40% increase in precipitation over the twentieth
century, projections indicate that mean rainfall and in-
tensity will continue to increase in mid and high latitudes
(Meehl et al. 2005). Annual average runoff is projected to
increase in northernEuropewith up to 22%until the 2070s
(Alcamo et al. 2007), and an increase in rainfall amounts
and intensities is likely to lead to increased risks of flooding
(EEA 2004). Flood events not only pose a fundamental
threat to human life and property but may also have
a significant impact on the natural environment. Increased
rainfall intensity will affect the water quality through
greater rates of erosion (Rumsby and Macklin 1994), an
increased soil washout and spread of pollutants and fer-
tilizers (Fisher 2000; Boorman 2003), and an intensified
acidification of water bodies as a result of increased at-
mospheric deposition (Ferrier and Edwards 2002; Gilvear
et al. 2002; Soulsby et al. 2002). It is apparent that climate
variability and change already pose a challenge to Eu-
rope’s economic sectors, production systems, and ecosys-
tems. Given the future climate projections there is a great
need to prepare for an intensification of these impacts.
To be able to assess the possible implications of future
changes in the hydrological cycle, and be able to plan and
mitigate the impacts of related extremes, firm knowledge
about past natural moisture variability is needed. This
includes an understanding of both the temporal nature
and spatial characteristics of extreme moisture events,
and the factors controlling them.Data from trees growing
under harsh climatic conditions can be used as powerful,
annually resolved, proxies of past climatic events, such as
drought or floods (Fritts 2001). The wide geographical
distribution of tree-ring chronologies offers the potential
not only to reconstruct local climate variability, but also
to infer past large-scale climatic patterns. Recently, two
successful attempts have been made to reconstruct ‘‘at-
lases’’ of past moisture variability from densely sampled
networks of moisture-sensitive tree-ring chronologies:
the North American Drought Atlas (NADA; Cook et al.
1999, 2004) and the Monsoon Asia Drought Atlas
(MADA; Cook et al. 2010). These reconstructions have
not only provided valuable information of past hydro-
climatic characteristics (e.g., understanding of major
drought regions and the severity, frequency, and general
footprint of major droughts), but have also revealed the
occurrence of past, previously unknown, megadroughts
over North America and Southeast Asia, respectively.
Moreover, the NADA has contributed essential back-
ground data for unraveling the underlyingmechanisms of
North American drought variability, such as the key role
of tropical Pacific Ocean, and also indications of the im-
portance of the North Pacific and Atlantic Ocean as
controls on the regional drought patterns (e.g., Herweijer
et al. 2007; Cook et al. 2007; Woodhouse et al. 2009).
Tree-ring data from the Fennoscandian region have
previously been considered of limited use in reconstructing
past hydroclimatic conditions (Erlandsson 1936; Eklund
1954). This is because tree growth in moist and cool envi-
ronments is generally not limited by precipitation, but
rather reflects the thermal conditions of the surrounding
environment. Hence, in the Nordic countries a great deal
of research has been focused on developing temperature-
sensitive tree-ring width, maximum latewood density, and,
to a lesser extent, tree-ring d13C and d18O chronologies, to
infer past temperature variability (Linderholm et al. 2010).
Comparatively few efforts have beenmade to provide tree-
ring-based hydroclimatological reconstructions for this
region (Helama and Lindholm 2003; Linderholm et al.
2004; Linderholm andMolin 2005; Helama et al. 2009;
Jönsson and Nilsson 2009; Drobyshev et al. 2011; Sefti-
gen et al. 2013) and, up to this point, no attempts to
make tree-ring-based gridded moisture reconstructions
for the Fennoscandian region have yet been made.
The aim of this study was to assess the potential
of using tree-ring data from Fennoscandia to make
a spatiotemporal reconstruction of past moisture var-
iability, as expressed by the standardized precipitation
evapotranspiration index (SPEI). When using a proxy to
reconstruct past climate, the potential of the proxy is
usually measured through the strength of the linear cor-
relation between the measured proxy and the climate
parameter. There is, however, no clear guidance in the
literature as to how strong the linear relationshipmust be.
Here we applied a range of calibration and validation
diagnostic approaches commonly used in dendroclimatic
reconstruction to assess the spatial reconstruction per-
formance. The feasibility of using a point-by-point
regression approach (PPR), the same reconstruction
methodology previously used in the NADAandMADA,
to produce past moisture variability patterns for the re-
gion was explored. Previous studies have shown that by
combining multiple tree-ring parameters tuned to the
same dominant environmental control, it may be possible
to produce reconstructions that are more accurate than
those derived from a single tree-ring variable (Gagen
et al. 2004, 2006; McCarroll et al. 2003, 2011, 2013).
Hence, the objective of the current study was to apply
a multiparameter approach to dendroclimatology in or-
der to infer information about twentieth-century mois-
ture variability.
2. Data and methods
a. Study region
The study region covers Norway, Sweden, and Fin-
land, and is located within 558200–718110N and 48290–318350E. The climate in the area is strongly influenced
3454 JOURNAL OF CL IMATE VOLUME 28

by the adjacent North Atlantic Ocean and the hetero-
geneous topography of the region (altitude range from
sea level to 2217m above sea level (Fig. 1a). The Scan-
dinavian Mountains range, which runs in a southwest–
northeast direction through Norway and the central and
northern parts ofwestern Sweden, separates themaritime
area to the west from a more continental area in the east.
The highest annual precipitation is found along the
Norwegian coast, where locally the total annual pre-
cipitation may reach 2500mm or more, and on the
windward west side of the mountain range where a re-
lease of orographic precipitation is caused by the forced
uplift of approaching air masses (Smith 1979; Fig. 1b).
The eastern leeward side of the mountain divide is drier
and has a more pronounced continental climate. The in-
fluence of continentality generally increases toward the
east-northeast, with a slight decrease around the Baltic
Sea and toward the Arctic Ocean in the north (Fig. 1c).
The atmospheric circulation is the main forcing for the
regional climate variability. Busuioc et al. (2001) identi-
fied three main large-scale circulation mechanisms con-
trolling the Swedish spatial rainfall variability: 1) the
North Atlantic Oscillation (NAO) representing a west-
erly (easterly) flow and causing positive (negative)
anomalies over the entire region, 2) cyclonic (anticy-
clonic) structure centered generally over the British Isles
and leading to positive (negative) precipitation anomalies
over almost the entire region, and 3) a west–east monthly
sea level pressure dipole structure causing ether a north–
south or west–east gradient in rainfall depending on
the position and extension of the pressure anomalies.
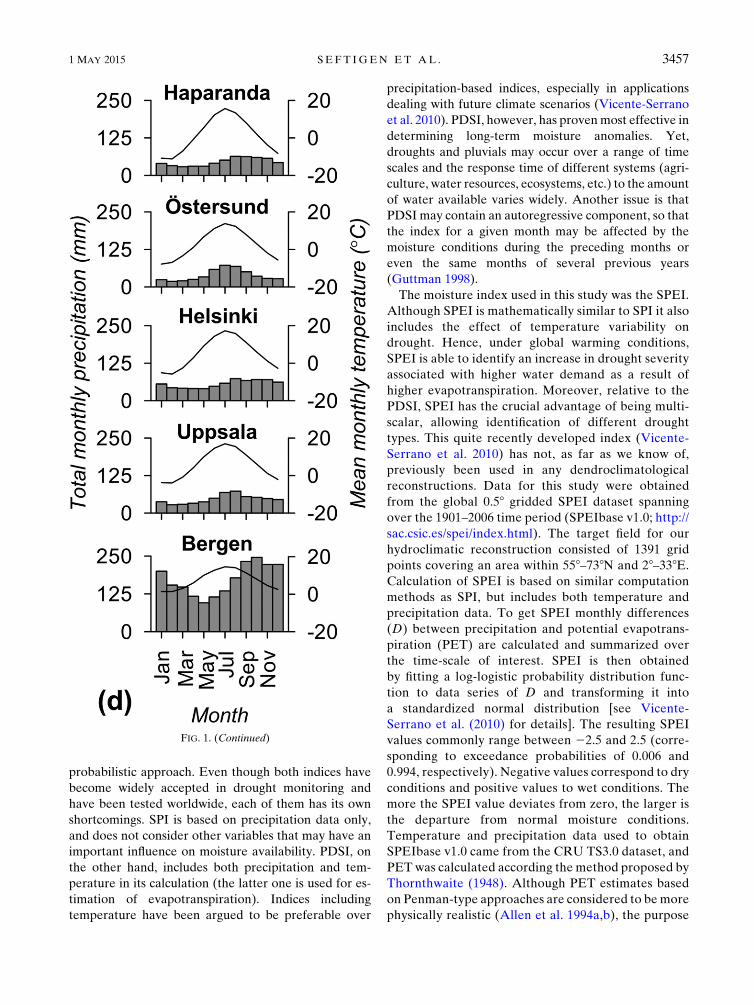
Convective rainfall mainly occurs in the warm season,
while frontal rainfall is more important in winter com-
pared to summer (Hofstra and New 2009). Late summer
to autumn is the time of themost abundant rainfall in the
region (Fig. 1d).
b. Tree-ring network
Twenty-three new Scots pine (Pinus sylvestris L.)
tree-ring chronologies were collected from southern and
central Sweden for the purpose of reconstructing past
hydroclimatic conditions. The sites are mostly located in
a transition zone between the boreal and temperate bi-
omes, and so both coniferous and deciduous trees are
common elements of the vegetation. The individual
sampling sites were selected to maximize the moisture
signal in the tree growth. Bare rocks and thin, nutrient-
poor soil layers with limited water holding capacity
characterize these sites. The vegetation is dominated by
a dry Scots pine forest with scattered Norway spruce
(Picea abies Karst) and downy birch (Betula pubescens
Ehrh.) and aspen (Populus tremulaL.) in themoremesic
parts of the terrain. The sparse field layer has typically
a low species diversity and is dominated by various
dwarf-shrubs, such as Vaccinium spp. and Empetrum
spp. All the sites showed more or less noticeable signs of
agrarian colonization, modern forest exploitation, and
human collecting activities. Logging on a larger scale
took place throughout the country in the late nineteenth
century, whereupon much of the forested areas were
cleaned of dead and diseased trees. Amajor obstacle for
compiling long tree-ring chronologies in the region is
thus the low abundance of dead wood and old trees. The
strategy of the current study was to increase the number
of moisture-sensitive tree-ring chronologies throughout
southern and central Sweden, and to focus the sampling
on living trees only. Two cores from each tree were ex-
tracted using an increment borer. The number of trees
sampled varied between 20 and 50 trees per site, cov-
ering all age classes. The samples were prepared and
cross-dated according to standard dendrochronological
procedures (Stokes and Smiley 1968), and the width of
each annual ring was measured to the nearest 0.001mm.
In addition to the newly sampled chronologies, vir-
tually all available chronologies from the study area
were downloaded from the International Tree-Ring
Data Bank (ITRDB; www.ncdc.noaa.gov/paleo/
treering.html; Grissino-Mayer and Fritts 1997). Data
that were not downloaded included chronologies of
questionable quality and/or with a temporal coverage
outside the period targeted by this study. In addition to
the ITRDB downloaded data, many chronologies were
kindly contributed by colleagues. A network con-
taining 156 chronologies was retained for the analysis,
including annually resolved tree-ring width (TRW),
maximum density (MXD), and stable carbon (d13C)
and oxygen (d18O) isotope chronologies from Scots
pine, Norway spruce (Picea abies L.), and pedunculate
oak (Quercus robur L.). A large number of the ITRDB
downloaded chronologies have an ending year around
1970–80. The time domain of the current study was
therefore restricted to the 1901–76 period, which is the
time period common for the tree-ring and climate
data.
The focus of this study was to assess the potential of
tree-ring data to estimate regional moisture variations
on the interannual to decadal scale, which is why anal-
yses only dealt with the high-frequency portion of data.
Most of the low-frequency information, related to mul-
tidecadal or longer-term trends, was removed from the
tree-ring data through standardization. This was ac-
complished by fitting a 35-yr cubic smoothing spline with
50% frequency-response cutoff to each individual series
(Cook and Peters 1981), and then dividing (or in the case
of MXD, subtracting) the tree-ring data by the corre-
sponding value of the fitted spline for each year. The
1 MAY 2015 S E F T IGEN ET AL . 3455

resulting dimensionless series were averaged arithmet-
ically into mean site chronologies.
c. Data selection
Precipitation is the main meteorological element
influencing droughts and pluvials (Wilhite and Glantz
1985; Chang and Cleopa 1991; Heim 2002; Lloyd-
Hughes and Saunders, 2002). Variables such as tem-
perature, evapotranspiration, wind speed, and soil water
holding capacity may also play an important role in
determining the severity of dryness and wetness. Po-
tential candidate tree-ring predictors for a hydroclimatic
field reconstruction were therefore preselected based on
the criteria requiring the tree-ring data to have a signif-
icant relationship (either positive or negative) with
current year rainfall over a 6-month window, extending
from April to September. All tree-ring chronologies
were prescreened (referred to as screening 1) against
instrumental temperature and precipitation data from
the 0.58 3 0.58 CRU TS3.0 gridded dataset covering the
1901–2006 time period (Harris et al. 2013). Pearson
correlation coefficients were calculated between each
tree-ring chronology and climate data from the grid box
centered on the chronology location, over the common
1902–76 period. The aim was to assess the relationship
between growth and climate on an interannual time
scale. Hence, both climate and tree-ring data were de-
trended by taking the first differences of the original
data prior to the correlation analysis. The precipitation
and temperature data for the study region showed, in
general, a significant negative correlation during the
summer season. Because of this dependence, partial
correlations were calculated between tree-ring variables
and temperature (holding the precipitation constant)
and precipitation (holding the temperature constant).
The method described by Meko et al. (2011), and
available as part of theMATLAB function seascorr, was
used to obtain the confidence intervals for partial cor-
relations. Using a Monte Carlo approach, each tree-ring
chronology was simulated 1000 times by exact simula-
tion (Percival and Constantine 2006), preserving the
spectral properties of the series. Partial correlations
were calculated between climate and simulated tree-ring
data, and the empirical cumulative distribution func-
tions of the resulting simulation-based partial correla-
tions were used to establish two-sided 95% confidence
intervals [see Meko et al. (2011) for details].
d. Climate field
A variety of quantitative measures have been de-
veloped for the purpose of defining and measuring
wetness and dryness. Many tree-ring studies have suc-
cessfully reconstructed drought indices such as the
Palmer Drought Severity Index (PDSI; Palmer 1965;
e.g., Stockton and Meko 1975, 1983; Cook and Jacoby
1977; Blasing and Duvick 1984; Cook et al. 1988, 1992;
Meko 1992; Stahle et al. 1985, 1988; Cook et al. 1996),
and/or, to a lesser extent, the standardized precipitation
index (SPI; McKee et al. 1993; e.g., Linderholm and
Molin 2005; Touchan et al. 2005; Seftigen et al. 2013;
Levani�c et al. 2013), the former being based on a soil
water balance equation and the latter on a precipitation
FIG. 1. (a) Location of the tree-ring network sites, superimposed on a topographical map over the study region, (b) May–August
precipitation totals, (c) continentality (defined here as the difference between July and January average temperatures), and (d) in-
terannual distribution of monthly-mean temperature and total precipitation at selected climate stations [location shown in map in (b)].
Note that (b) and (c) are based on the CRU TS3 dataset over the 1901–2006 time period, and (d) is based on station data from the
Nordklim database covering the period from 1890 to present.
3456 JOURNAL OF CL IMATE VOLUME 28
probabilistic approach. Even though both indices have
become widely accepted in drought monitoring and
have been tested worldwide, each of them has its own
shortcomings. SPI is based on precipitation data only,
and does not consider other variables that may have an
important influence on moisture availability. PDSI, on
the other hand, includes both precipitation and tem-
perature in its calculation (the latter one is used for es-
timation of evapotranspiration). Indices including
temperature have been argued to be preferable over
precipitation-based indices, especially in applications
dealing with future climate scenarios (Vicente-Serrano
et al. 2010). PDSI, however, has provenmost effective in
determining long-term moisture anomalies. Yet,
droughts and pluvials may occur over a range of time
scales and the response time of different systems (agri-
culture, water resources, ecosystems, etc.) to the amount
of water available varies widely. Another issue is that
PDSI may contain an autoregressive component, so that
the index for a given month may be affected by the
moisture conditions during the preceding months or
even the same months of several previous years
(Guttman 1998).
The moisture index used in this study was the SPEI.
Although SPEI is mathematically similar to SPI it also
includes the effect of temperature variability on
drought. Hence, under global warming conditions,
SPEI is able to identify an increase in drought severity
associated with higher water demand as a result of
higher evapotranspiration. Moreover, relative to the
PDSI, SPEI has the crucial advantage of being multi-
scalar, allowing identification of different drought
types. This quite recently developed index (Vicente-
Serrano et al. 2010) has not, as far as we know of,
previously been used in any dendroclimatological
reconstructions. Data for this study were obtained
from the global 0.58 gridded SPEI dataset spanning
over the 1901–2006 time period (SPEIbase v1.0; http://
sac.csic.es/spei/index.html). The target field for our
hydroclimatic reconstruction consisted of 1391 grid
points covering an area within 558–738N and 28–338E.Calculation of SPEI is based on similar computation
methods as SPI, but includes both temperature and
precipitation data. To get SPEI monthly differences
(D) between precipitation and potential evapotrans-
piration (PET) are calculated and summarized over
the time-scale of interest. SPEI is then obtained
by fitting a log-logistic probability distribution func-
tion to data series of D and transforming it into
a standardized normal distribution [see Vicente-
Serrano et al. (2010) for details]. The resulting SPEI
values commonly range between 22.5 and 2.5 (corre-
sponding to exceedance probabilities of 0.006 and
0.994, respectively). Negative values correspond to dry
conditions and positive values to wet conditions. The
more the SPEI value deviates from zero, the larger is
the departure from normal moisture conditions.
Temperature and precipitation data used to obtain
SPEIbase v1.0 came from the CRU TS3.0 dataset, and
PET was calculated according the method proposed by
Thornthwaite (1948). Although PET estimates based
on Penman-type approaches are considered to bemore
physically realistic (Allen et al. 1994a,b), the purpose
FIG. 1. (Continued)
1 MAY 2015 S E F T IGEN ET AL . 3457

of including PET in the SPEI calculation is to obtain
a relative temporal estimation, and therefore the method
used to compute PET is not crucial here (Vicente-Serrano
et al. 2010). For example, Mavromatis (2007) recently
showed that the use of simple or complex methods to
calculate PET provides similar results when a drought
index, such as the PDSI, is calculated.
e. Point-by-point regression method
Simple correlation analysis between the tree-ring data
and different seasonal combinations of SPEI identified
June–August SPEI, calculated over a 3-month time
scale, as the best target season for a hydroclimatic re-
construction over the study region. A point-by-point
regression approach (PPR; Cook et al. 1999, 2004) was
used to reconstruct the SPEI field from the tree-ring
data. PPR is a form of a multiple linear regression
technique in which the predictors are orthogonal prin-
cipal components of the tree-ring data and the pre-
dictand is a field of climate variables. Most of the
previous PPR based hydroclimatic reconstructions (e.g.,
Cook et al. 1999, 2004, 2010; Touchan et al. 2011) have
used a search radius (SR)method to select tree-ring data
for each gridpoint reconstruction from a network of
tree-ring sites. A circle with a fixed radius is centered
over each climate grid point. Chronologies from sites
that fall within this circle are selected as candidate tree-
ring predictors of drought at that specific point. The
premise behind the SRmethod is that climate is more or
less homogeneous in space. However, a complex topo-
graphical landscape may cause a marked climatic gra-
dient throughout a region, especially a high spatial
heterogeneity in soil moisture distribution, thereby
causing spatially variable patterns in the tree-ring data
response to climate. Fang et al. (2011) introduced
a ‘‘search spatial correlation contour’’ (CC) method to
select tree-ring chronologies for a PPR reconstruction of
precipitation in northwest China, a region of variable
climate and complex topographical landscape. The idea
behind this method is to use correlation maps to de-
termine the similarity of climate between the target grid
point for reconstruction and the surrounding areas, and
then to select the tree-ring chronologies located in areas
with comparable climate regime to the target climate
grid point. In this study both the SR and CC methods
were tested in order to identify the most appropriate
approach for a PPR-based moisture reconstruction over
the Fennoscandian region.
It is not uncommon for tree-ring data to reflect a mix
of current and previous years’ environmental conditions
(Fritts 2001). Hence, in order to correct for the differ-
ence in the short-lag persistence in tree-ring and climate
data, all precipitation-sensitive tree-ring chronologies
(selected through prescreening 1) and observed SPEI
data were autoregressive (AR) prewhitened over the
1901–76 common period, using a low-order AR model
(maximum order 5 3; the order of the model was de-
termined using the Akaike information criterion;
Akaike 1974). The prewhitening procedure reduced the
climate and tree-data overlap to the 1904–76 period.
Spatial CC maps were calculated between SPEI and
tree-ring data over the 1904–76 period. Previous studies
have used a dynamic SR and CC (Cook et al. 1999; Fang
et al. 2011) when locating tree-ring chronologies for
each gridpoint reconstruction, so that if no (or too few)
chronologies are located around each grid, the CC and
SR will expand until a prescribed number of chronolo-
gies have been found. This approach could be preferable
if the tree-ring network is patchy, implying that some
areas of the grid will require smaller SR/CC than other
areas to locate the tree-ring data. The PPR approach in
the current studywas slightly different from the previous
ones in that it used a fixed SR and CC. This option was
chosen because 1) there is relatively dense and even
tree-ring network over the Fennoscandian region and
2) a consistency in the SR and CC makes a comparison
among the gridpoint reconstructions more straightfor-
ward. Candidate tree-ring chronologies located within
a defined CC and SR around each specific grid point
were retained for an additional screening prior to the
regression analysis (referred to as screening 2). The
purpose of this screening was to eliminate tree-ring
chronologies insensitive to SPEI at each specific grid
point. It was accomplished by correlating prewhitened
tree-ring chronologies with prewhitened SPEI data over
the calibration period. Only the response of tree-ring
data to SPEI in the current year (t) was considered in the
screening, and a two-tailed screening probability of a50.05 was used as the selection criterion. Principal com-
ponent analysis (PCA) was performed on the retained
chronologies whereby orthogonal eigenvectors were
generated. The lower-order tree-ring eigenvalues
(.1.0), accounting for most of the common variance,
were entered into a multivariate stepwise linear re-
gression based on the R2 statistic. The quality and tem-
poral stability of the regression models was assessed
through a split-sample method (Gordon 1982) that di-
vided the period of climate and tree data overlap (1904–
76) into two subsets of roughly equal length (1904–40
and 1941–76). Calibration and verification statistics
were calculated for the first and the second half of the
base period, respectively. The calibration and verifica-
tion periods were then exchanged and the process re-
peated. The final models were derived over the full
1904–76 period. The validation of the regression
models was performed by means of the calibration and
3458 JOURNAL OF CL IMATE VOLUME 28

verification R2, the reduction of error (RE) and co-
efficient of efficiency (CE) statistics (National Research
Council 2006). Only grid points that produced signifi-
cant calibration regression models (p value of the F
statistic , 0.05) and had both a CE and RE values ex-
ceeding a zero threshold value were used to produce the
final full-period calibration models.
f. Selection of the search radius and correlationcontour
To determine the ideal SR and CC for a SPEI re-
construction over the Fennsocandian region, multiple
PPR runs were conducted in which the SR and CC
varied over a wide range of values. The similarity be-
tween all gridpoint reconstructions, produced by the
full-period calibration models for each SR and CC run
respectively, were assessed through correlation and
plotted as a function of distance between the grid points.
The same procedure was done for observed SPEI data
from overlapping grids. The SR and CC that were able
to capture the spatial decorrelation pattern of observed
SPEI were selected for reconstructing drought across
Fennoscandia.
g. Spatial comparison of observed and reconstructedSPEI
Three different metrics were used to assess the
agreement between yearly fields of reconstructed and
observed SPEI data: 1) mean field comparison of ob-
served and reconstructed SPEI over time, 2) Pearson
correlation coefficient, and 3) map congruence. The
former was obtained by simply averaging the recon-
structed field for every year, and comparing it with the
yearly mean of observed SPEI data from overlapping
grid points. The difference between Pearson product
moment correlation and the congruence coefficient is
that the former provides a measure of how well the
relative spatial patterns of two climate fields covary,
while the latter is a measure of the similarity in the ab-
solute spatial patterns between the two fields. The only
difference in the computation of these two metrics is
that, unlike the calculation of the correlation co-
efficients, the computation of the congruence co-
efficients does not require the means of the
reconstructed and observed climate fields to be removed
[detailed descriptions on how to calculate the co-
efficients can be found in Cook et al. (1999)]. Correla-
tion and congruence coefficients were calculated
between each annual pair of reconstructed and observed
SPEI field. The reconstructed SPEI field was divided
into three subregions: southern (lat. , 60.58; 159 grid
points), central (60.58# lat., 66.08; 371 grid points) and
northern (lat. . 66.08; 318 grid points) regions. The
spatial extent of the southern subregion was set to in-
clude all the newly sampled xeric site chronologies, and
the other two regions were arbitrarily set to roughly
equal size. Mean field, map correlations, and congru-
ences were calculated for the entire reconstructed re-
gion, and for each subregion.
3. Results
a. SPEI reconstruction
A network of 125 precipitation-sensitive site chro-
nologies, out of a total number of 179 screened chro-
nologies, was preselected (screening 1) for the PPR run.
The network comprises 85 TRW chronologies, 29 MXD
chronologies, and six d13C and four d18O chronologies
(Fig. 2). (Chronology information is available online as
supplementary material, at http://dx.doi.org/10.1175/
JCLI-D-13-00734.s1).
Figure 3 compares spatial decorrelation patterns, av-
eraged over 50-km blocks, of observed and re-
constructed SPEI fields resulting frommultiple PPR test
runs in which the CC and SR have been varied over
a range of values. A 0.76 CC and a 210-km SR produce
spatial coherence patterns that most closely resemble
the observed [lowest mean absolute error (MAE)].
Correlation magnitudes are slightly overestimated for
the reconstructed datasets compared to the observed
one for distances up to approximately 700 km, and un-
derestimated for the SR reconstruction at distances ex-
ceeding 1400km. Reconstructions that are produced
using search radii and correlation contours above (be-
low) the r 5 0.76 and 210-km threshold values exhibit
correlograms with systematically larger (smaller) co-
herence over distance than the correlogram developed
from the observed SPEI data. This overestimation
(underestimation) of observed spatial autocorrelation
pattern is most likely due to a high (small) number of
tree-ring predictors that are shared between each grid-
point reconstruction. Consequently, the results indicate
that a CC of 0.76 and an SR of 210 km are optimal,
producing reconstructions that capture the true spatial
autocorrelation patterns of droughts and pluvials in the
Fennoscandian region. The following results are based
on these search criteria.
b. Calibration and verification results
Contour maps of split-sample calibration and verifi-
cation statistics for the SR and CCmethods are shown in
Fig. 4. The PPR runs using a 210-km SR and a 0.76 CC
produces rather similar patterns in its overall re-
construction skill. Significant calibration models are
obtained for about 75% of the SPEI grid net for both
early and late calibration periods. The rest of the grid
1 MAY 2015 S E F T IGEN ET AL . 3459

FIG. 2. Partial correlation between various tree-ring proxies and best-fit temperature and
precipitation data (5target season). The proxy data are tree-ring width (TRW), maximum
density (MXD), and stable carbon (d13C) and oxygen (d18O) isotopes from Scots pine (PISY)
andNorway spruce (PCAB). The climate data were divided into individual months as well as all
possible seasonal combinations over a 6-month window, extending from April to September of
the current year. The month and season giving the highest correlation coefficient are presented
here. Only the magnitudes of the correlation are indicated, and not the length and timing of the
target season. Correlation analysis is based on first differences over the 1902–76 common period;
p, 0.05 for significant coefficients. Climate data are obtained from the CRU TS3.0 dataset.
3460 JOURNAL OF CL IMATE VOLUME 28

points fail to reconstruct either because no chronologies
are located within the SR/CC, or because the gridpoint
regression model fail to pass the significance testing (F
value . 0.05). There is a considerable regional vari-
ability in the calibration/verification statistics. The best
calibration areas are located in south-central and
northern Sweden, and southeastern and southwestern
Finland, while the weakest calibration areas include
Norway and western Sweden. Slightly better calibration
and verification results are obtained for the early sub-
period (1904–40) compared to the later one (1941–76).
Median calibration and verification, R2, and CE are
approximately 40%, 35%, and 0.25, respectively.
Roughly 10% and 15% of the reconstructed grid points,
produced by the CC and SRmethods respectively, fail to
verify in the validation periods (CE and RE , 0). The
weakest validation areas include the Norwegian coast,
eastern Finland, and the southernmost and northern-
most parts of the target domain.
Full period (1904–76) calibration was performed only
on those grid points that were successfully calibrated
and validated in the early and late subperiods. That in-
cluded 827 grid points for the SR run and 848 grid points
for CC run, predominantly located over Sweden and
Finland. The contour method calibration R2 values
range between 13% and 65%, with a median value of
37% (Fig. 5a). The regression models obtained by the
SR method explain between 13% and 60% of the SPEI
variance, with a median of 36% (map not shown). Both
methods produce coherent areas with the highest R2
values along the southwestern coast of Finland, and in
the interior of the northernmost parts of the target do-
main. The regression models produced by the radius
method explains slightly more of the variance in ob-
served SPEI over Sweden and Norway compared to the
contour method, while the latter performs better over
Finland and the northern portion of the target domain
(Fig. 5b). Topography causes the spatial precipitation
distribution to be rather heterogeneous over Norway
and western part of Sweden (Fig. 1b). A CC of r 5 0.76
thus produces relatively narrow contour areas over the
region.Hence, in contrast to the SR, theCCmethod fails
to include some of the tree-ring data that may have an
actual relationship with drought at each specific grid
point. On the other hand, the method is shown to be
superior to the SR over northern and central parts of
Finland, where the tree-ring network is less dense and
where drought is more homogenous in space (Fig. 5c).
Consequently, this affects the number of chronologies
that passed the PPR screening, and, as seen in Fig. 5b,
results in additional reconstruction skill. As the re-
constructed SPEI fields produced by the SR and CC
FIG. 3. Correlation between time series from the gridded SPEI field, as a function of distance between the grid
points. The correlation has been calculated for observed (red lines) and reconstructed (black and gray lines) data,
and averaged over 50-km intervals. Gray lines are correlation curves obtained from PPR runs where the SR has
varied from 100 to 400 km and the CC from 0.65 to 0.90. Mean absolute error (MAE) shows how closely the
correlation curve of the reconstructed fields follows the observed one. Black lines are the correlation curve for the
lowest MAE. All the correlation curves, regardless of the method used, are based on exactly the same grid points
(number of grid points5 580). The full-period calibration model (1904–76) has been used to reconstruct the SPEI,
for grid points that were retained after the split-sample verification and calibration procedure.
1 MAY 2015 S E F T IGEN ET AL . 3461

FIG. 4. Maps of calibration and verification statistics for the two subperiods (1904–40 and 1941–76) used in the
split-sample calibration/verification procedure. Two different methods were used in the PPR approach to locate
chronologies around each specific grid point: the search radius and correlation contour methods.
3462 JOURNAL OF CL IMATE VOLUME 28

FIG. 5. (a) Full-period (1904–76) calibration R2 using the CC method. Only grid points that
have passed the split-sample calibration and verification procedure have been retained for the
final full-period calibration. (b) The difference between full-period calibration R2 values ob-
tained by the SRmethod and the CCmethod. (c) The difference in the number of chronologies
located for each gridpoint reconstruction using the two methods.
1 MAY 2015 S E F T IGEN ET AL . 3463
methods in general show similar patterns, only results
produced by the CC method will be discussed hereafter.
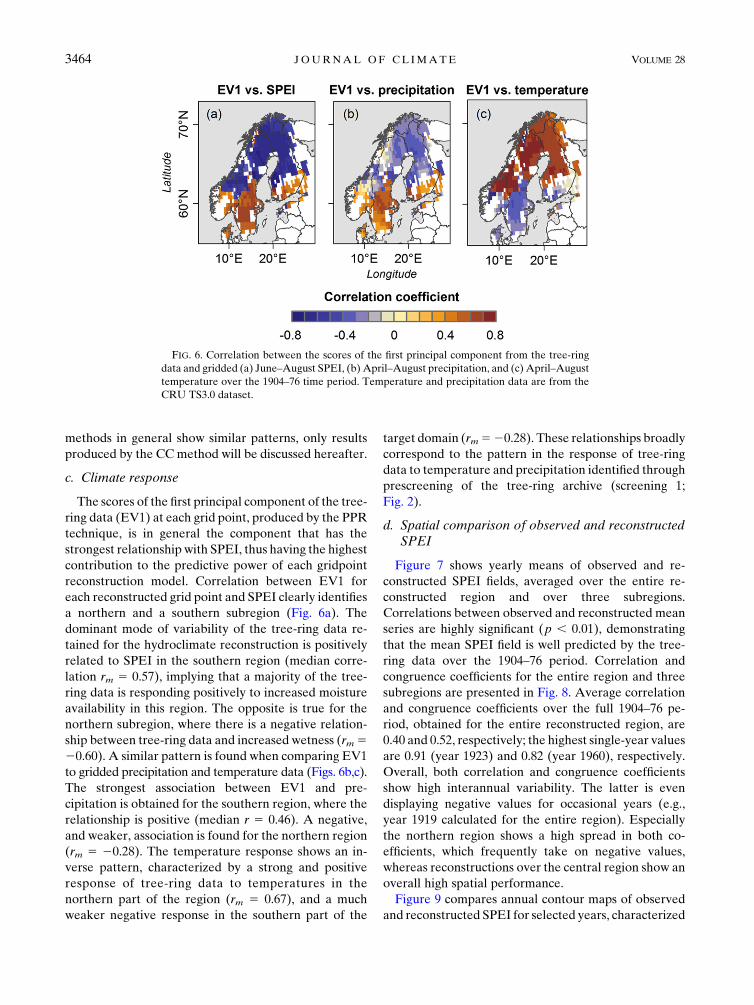
c. Climate response
The scores of the first principal component of the tree-
ring data (EV1) at each grid point, produced by the PPR
technique, is in general the component that has the
strongest relationship with SPEI, thus having the highest
contribution to the predictive power of each gridpoint
reconstruction model. Correlation between EV1 for
each reconstructed grid point and SPEI clearly identifies
a northern and a southern subregion (Fig. 6a). The
dominant mode of variability of the tree-ring data re-
tained for the hydroclimate reconstruction is positively
related to SPEI in the southern region (median corre-
lation rm 5 0.57), implying that a majority of the tree-
ring data is responding positively to increased moisture
availability in this region. The opposite is true for the
northern subregion, where there is a negative relation-
ship between tree-ring data and increased wetness (rm520.60). A similar pattern is found when comparing EV1
to gridded precipitation and temperature data (Figs. 6b,c).
The strongest association between EV1 and pre-
cipitation is obtained for the southern region, where the
relationship is positive (median r 5 0.46). A negative,
and weaker, association is found for the northern region
(rm 5 20.28). The temperature response shows an in-
verse pattern, characterized by a strong and positive
response of tree-ring data to temperatures in the
northern part of the region (rm 5 0.67), and a much
weaker negative response in the southern part of the
target domain (rm520.28). These relationships broadly
correspond to the pattern in the response of tree-ring
data to temperature and precipitation identified through
prescreening of the tree-ring archive (screening 1;
Fig. 2).
d. Spatial comparison of observed and reconstructedSPEI
Figure 7 shows yearly means of observed and re-
constructed SPEI fields, averaged over the entire re-
constructed region and over three subregions.
Correlations between observed and reconstructed mean
series are highly significant (p , 0.01), demonstrating
that the mean SPEI field is well predicted by the tree-
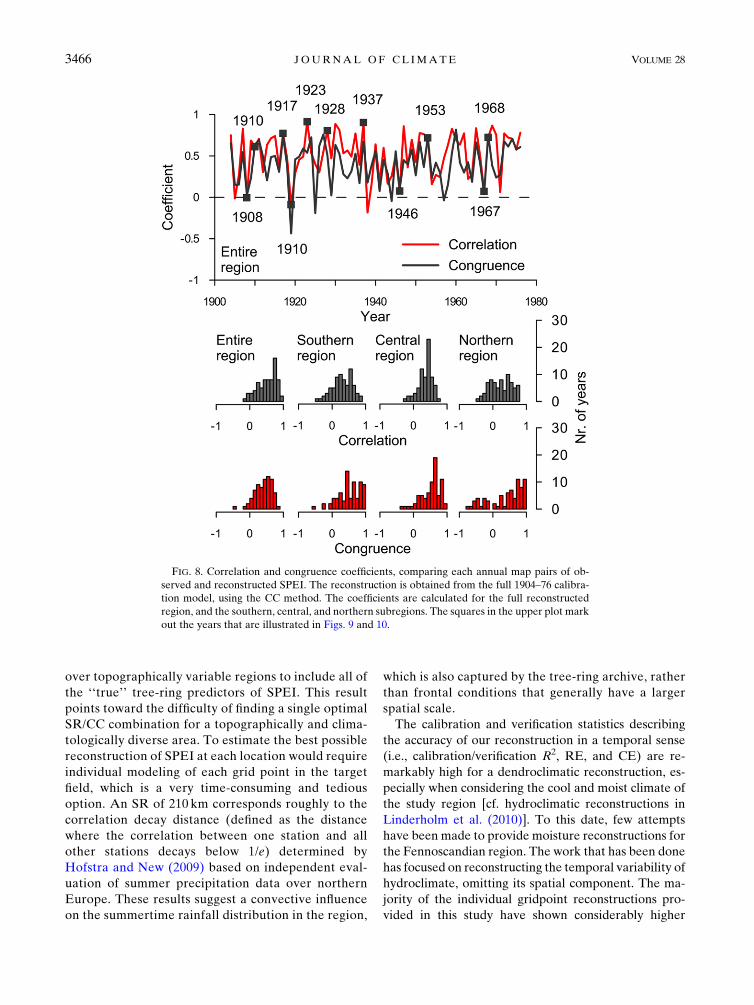
ring data over the 1904–76 period. Correlation and
congruence coefficients for the entire region and three
subregions are presented in Fig. 8. Average correlation
and congruence coefficients over the full 1904–76 pe-
riod, obtained for the entire reconstructed region, are
0.40 and 0.52, respectively; the highest single-year values
are 0.91 (year 1923) and 0.82 (year 1960), respectively.
Overall, both correlation and congruence coefficients
show high interannual variability. The latter is even
displaying negative values for occasional years (e.g.,
year 1919 calculated for the entire region). Especially
the northern region shows a high spread in both co-
efficients, which frequently take on negative values,
whereas reconstructions over the central region show an
overall high spatial performance.
Figure 9 compares annual contour maps of observed
and reconstructed SPEI for selected years, characterized
FIG. 6. Correlation between the scores of the first principal component from the tree-ring
data and gridded (a) June–August SPEI, (b) April–August precipitation, and (c) April–August
temperature over the 1904–76 time period. Temperature and precipitation data are from the
CRU TS3.0 dataset.
3464 JOURNAL OF CL IMATE VOLUME 28

by high congruence and correlation coefficients. The
reconstructed fields are able to capture the general
spatial features of observed moisture distribution. Dis-
tinctive subregional drought and pluvial cells (e.g., years
1910 and 1953), as well as more or less regional-wide
episodes (years 1923 and 1937), are replicated by the
tree-ring reconstructions. A few anomalies, pre-
dominantly located over the northern portion of the
target domain, are underestimated (e.g., years 1910,
1937, and 1968). Annual contour maps of observed and
reconstructed SPEI for poorly modeled years are shown
in Fig. 10. It is evident that the reconstruction fails to
adequately estimate the spatial pattern and the magni-
tude of observed data these years, especially the smaller-
scale SPEI anomalies.
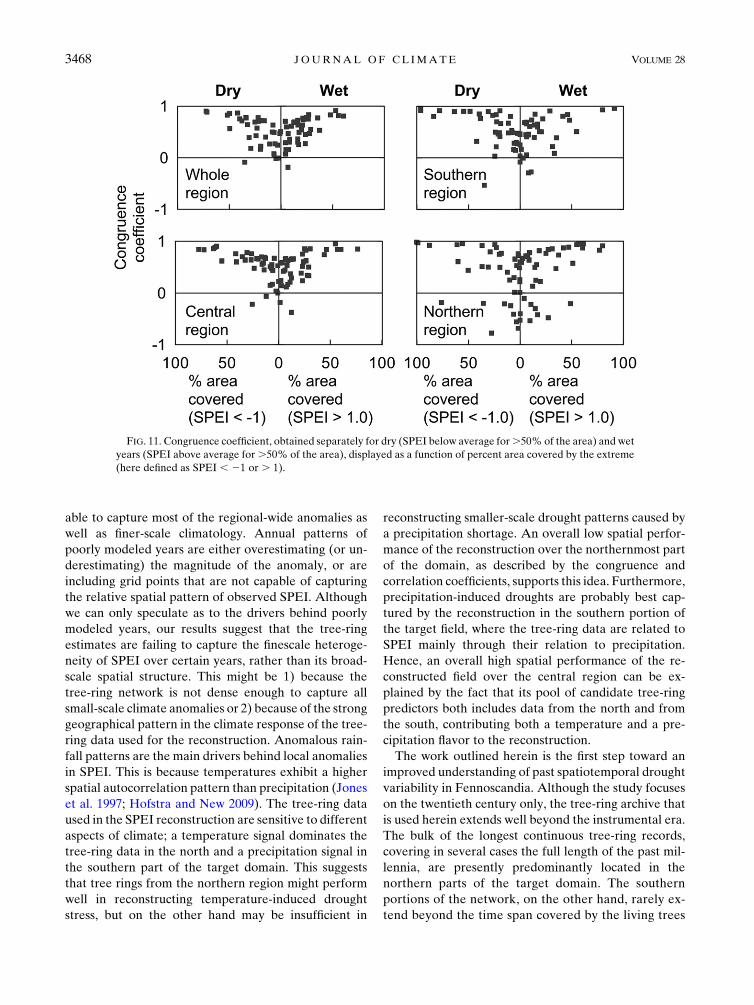
Individual years were classified as being either dry or
pluvial. The classification was based on observed SPEI
data, over the 1904–76 period, from grid points that had
successfully been used in the reconstruction. A year
was classified as being dry (pluvial) if SPEI was below
(above) average for more than half of the grid net. The
intensity of the anomaly was assessed by quantifying
the size of the area (number of grid points) covered by
observed SPEI values below 21 (for dry years) or
above 1 (for pluvial years). Figure 11 shows the size of
the area (denoted as % of the total 848 grid points)
versus the congruence coefficient of each individual
year (the years are marked out in Fig. 8). There is
a clear positive relationship between the spatial ex-
tension of the anomaly of each year and the ability of
the reconstructed grid to capture the magnitude of the
anomaly in observed SPEI data.
4. Discussion
This study is the first to assess the potential of ap-
plying a dendroclimatological multiproxy approach to
reconstruct past spatial patterns of hydroclimatic
variability in the Fennoscandian region, using a point-
by-point multiple nested regression approach (Cook
et al. 1999). We tested both a fixed SR and a CC
method to locate candidate tree-ring chronologies for
each gridpoint reconstruction. As confirmed by sev-
eral metrics of reconstruction fidelity, there are some
regional differences between the reconstructions
produced by both methods. These mainly arise from
the spatial properties of the target climate field.
In contrast to what can be expected, the SR is supe-
rior to the CC method in mountainous western
Fennoscandia, whereas the opposite is true over the
lowlands in the eastern-northeastern parts of the tar-
get domain. Our results suggests that even though
a CC of 0.76 (SR of 210 km) might produce on average
the best reconstructions across the grid and capture
the general spatial autocorrelation patterns of ob-
served SPEI, it is not screening large enough areas
FIG. 7. SPEI field averaged over each year over the whole reconstructed region, and the southern, central, and
northern subregions. Mean values of the observed SPEI data comes from overlapping grid points.
1 MAY 2015 S E F T IGEN ET AL . 3465
over topographically variable regions to include all of
the ‘‘true’’ tree-ring predictors of SPEI. This result
points toward the difficulty of finding a single optimal
SR/CC combination for a topographically and clima-
tologically diverse area. To estimate the best possible
reconstruction of SPEI at each location would require
individual modeling of each grid point in the target
field, which is a very time-consuming and tedious
option. An SR of 210 km corresponds roughly to the
correlation decay distance (defined as the distance
where the correlation between one station and all
other stations decays below 1/e) determined by
Hofstra and New (2009) based on independent eval-
uation of summer precipitation data over northern
Europe. These results suggest a convective influence
on the summertime rainfall distribution in the region,
which is also captured by the tree-ring archive, rather
than frontal conditions that generally have a larger
spatial scale.
The calibration and verification statistics describing
the accuracy of our reconstruction in a temporal sense
(i.e., calibration/verification R2, RE, and CE) are re-
markably high for a dendroclimatic reconstruction, es-
pecially when considering the cool and moist climate of
the study region [cf. hydroclimatic reconstructions in
Linderholm et al. (2010)]. To this date, few attempts
have been made to provide moisture reconstructions for
the Fennoscandian region. The work that has been done
has focused on reconstructing the temporal variability of
hydroclimate, omitting its spatial component. The ma-
jority of the individual gridpoint reconstructions pro-
vided in this study have shown considerably higher
FIG. 8. Correlation and congruence coefficients, comparing each annual map pairs of ob-
served and reconstructed SPEI. The reconstruction is obtained from the full 1904–76 calibra-
tion model, using the CC method. The coefficients are calculated for the full reconstructed
region, and the southern, central, and northern subregions. The squares in the upper plot mark
out the years that are illustrated in Figs. 9 and 10.
3466 JOURNAL OF CL IMATE VOLUME 28

temporal accuracy than the earlier hydroclimatic
reconstructions from the region (e.g., Helama and
Lindholm 2003; Linderholm and Molin 2005; Jönssonand Nilsson 2009; Drobyshev et al. 2011; Seftigen et al.
2013). The successful application of tree-ring data from
temperate and subarctic Fennoscandia in the current
reconstructions is likely a product of the nature of SPEI.
Tree-ring data from the region describe signals related
to both temperature and precipitation, and a re-
construction of a drought index that combines both
variables is thus likely to yield an overall better result
than estimations of precipitation and temperatures
separately, or estimations of a precipitation-based
drought index such as SPI. In Fig. 12 a PPR-produced
calibration R2 map, over the target region where the
SPEI target climate field has been replaced with SPI, is
shown. The general ability of the tree-ring proxy data to
reconstruct this precipitation-based drought index is
indeed poorer than a temperature- and precipitation-
based index such as the SPEI (median calibration
R2 5 18%; cf. Fig. 5a). The performance peaks in the
southern part of the domain, whereas the calibration
skill in the north, where the tree-ring data are mainly
temperature dependent, is in general quite poor.
While each individual gridpoint reconstruction is
reasonably accurate, it is not a guarantee that the
reconstructed fields will be valid in a spatial sense. Our
results, however, clearly demonstrate that the mean
fields of observed SPEI are estimated exceptionally well
over the twentieth century by the reconstruction.
Moreover, the mean correlation and congruence co-
efficients over the full calibration period are only mar-
ginally lower than those identified in NADA (Cook
et al. 1999), comparing observed and estimated PDSI
over the entire continental United States. These values
support a long-term overall spatial representativeness of
the reconstructed field. The ability to replicate annual
spatial patterns is, however, not consistent throughout
time, but shows variability on an interannual basis.
There is no doubt that those years that performs well are
FIG. 9. Maps of reconstructed and observed SPEI for selected years, characterized by high congruence and correlation coefficients
(obtained for the entire reconstructed region).
FIG. 10. As in Fig. 9, but for poorly modeled years.
1 MAY 2015 S E F T IGEN ET AL . 3467
able to capture most of the regional-wide anomalies as
well as finer-scale climatology. Annual patterns of
poorly modeled years are either overestimating (or un-
derestimating) the magnitude of the anomaly, or are
including grid points that are not capable of capturing
the relative spatial pattern of observed SPEI. Although
we can only speculate as to the drivers behind poorly
modeled years, our results suggest that the tree-ring
estimates are failing to capture the finescale heteroge-
neity of SPEI over certain years, rather than its broad-
scale spatial structure. This might be 1) because the
tree-ring network is not dense enough to capture all
small-scale climate anomalies or 2) because of the strong
geographical pattern in the climate response of the tree-
ring data used for the reconstruction. Anomalous rain-
fall patterns are the main drivers behind local anomalies
in SPEI. This is because temperatures exhibit a higher
spatial autocorrelation pattern than precipitation (Jones
et al. 1997; Hofstra and New 2009). The tree-ring data
used in the SPEI reconstruction are sensitive to different
aspects of climate; a temperature signal dominates the
tree-ring data in the north and a precipitation signal in
the southern part of the target domain. This suggests
that tree rings from the northern region might perform
well in reconstructing temperature-induced drought
stress, but on the other hand may be insufficient in
reconstructing smaller-scale drought patterns caused by
a precipitation shortage. An overall low spatial perfor-
mance of the reconstruction over the northernmost part
of the domain, as described by the congruence and
correlation coefficients, supports this idea. Furthermore,
precipitation-induced droughts are probably best cap-
tured by the reconstruction in the southern portion of
the target field, where the tree-ring data are related to
SPEI mainly through their relation to precipitation.
Hence, an overall high spatial performance of the re-
constructed field over the central region can be ex-
plained by the fact that its pool of candidate tree-ring
predictors both includes data from the north and from
the south, contributing both a temperature and a pre-
cipitation flavor to the reconstruction.
The work outlined herein is the first step toward an
improved understanding of past spatiotemporal drought
variability in Fennoscandia. Although the study focuses
on the twentieth century only, the tree-ring archive that
is used herein extends well beyond the instrumental era.
The bulk of the longest continuous tree-ring records,
covering in several cases the full length of the past mil-
lennia, are presently predominantly located in the
northern parts of the target domain. The southern
portions of the network, on the other hand, rarely ex-
tend beyond the time span covered by the living trees
FIG. 11. Congruence coefficient, obtained separately for dry (SPEI below average for.50% of the area) and wet
years (SPEI above average for.50% of the area), displayed as a function of percent area covered by the extreme
(here defined as SPEI , 21 or . 1).
3468 JOURNAL OF CL IMATE VOLUME 28

(;250–350yr). Hence, an important future direction for
Fennoscandian tree-ring-based hydroclimate field re-
constructions is an extension of the temporal coverage of
the moisture-sensitive tree-ring network, to enable as-
sessments of hydroclimate over longer time scales. This
could potentially be done by combining living tree-ring
series with relict wood extracted from small lakes
throughout the region. This has previously been done by
Helama and Lindholm (2003) and Helama et al. (2009),
who were able to push the tree-ring archive in southern
Finland beyond the past millennia by using tree logs
preserved in lacustrine sediments. Ongoing collections
throughout the target domain, especially in areas that are
now weakly modeled, should also continuously improve
the capability to study spatial patterns of droughts and
pluvials in Fennoscandia.
5. Concluding remarks
This study is the first attempt to derive tree-ring-based
field reconstructions of twentieth-century moisture vari-
ability for the Fennoscandian region. The reconstructions
show a remarkably high accuracy in a temporal sense,
especially considering the climatological settings of the
region. The overall spatial performance of the recon-
structed field is generally quite good. Our validation re-
sults suggest that the reconstruction has the greatest
spatial skill in central and southern Fennoscandia. A
relatively low reconstruction skill, by contrast, is found in
the northern part of the target region. We caution that
a complicating factor for a tree-ring-based spatial SPEI
reconstruction in the Fennoscandian region might be
a geographically varying response of tree-ring data to
temperature versus precipitation. The severity of this
factor has not been conclusively investigated, and needs
further attention.
This exploratory study has demonstrated that
a point-by-point regression method can be applied to
dendrochronological data to explore past moisture
conditions in Fennoscandia. The future direction in
the field will be to provide a long-term context for
the Fennoscandian hydroclimate by producing re-
constructions extending beyond the observational
record.
Acknowledgments. We thank Dr. Scott St. George,
two anonymous reviewers, and the journal editor for
their constructive input on the submitted manuscript.
We also would like to thank the Swedish county ad-
ministrations of Kalmar, Kronoberg, Västra Götaland,Jönköping, Örebro, Östergötland, Södermanland,Uppsala, and Gävleborg for sampling permissions;Alexander Saplin, Peter Seftigen, and Petter Stridbeckfor their energetic help in the field; Rune Groven andSamuli Helama for valuable advice; and Riikka Salo,Hilasvuori Emmi, Eloni Sonninen, Neil J. Loader, andGiles H. F. Young for kindly providing their data. Wealso gratefully acknowledge the numerous researcherswho have contributed their data to the ITRDB. Thisresearch has been supported by the Swedish Researchcouncils Vetenskapsrådet and FORMAS (grants toHans W. Linderholm). The paper contributes to theSwedish strategic research areas Modelling the Regionaland Global Earth System (MERGE) and Biodiversityand Ecosystem Services in a Changing Climate (BECC).
REFERENCES
Akaike, H., 1974: A new look at the statistical model identification.
IEEE Trans. Autom. Control, 19, 716–723, doi:10.1109/
TAC.1974.1100705.
Alcamo, J., M. Flörke, and M. Märker, 2007: Future long-term
changes in global water resources driven by socio-economic
and climatic changes. Hydrol. Sci., 52, 247–275, doi:10.1623/
hysj.52.2.247.
Allen, R. G., M. Smith, A. Perrier, and L. S. Pereira, 1994a: An
update for the definition of reference evapotranspiration.
ICIDBulletin,No. 43, International Commission on Irrigation
and Drainage, New Delhi, India, 1–34.
——,——,——, and——, 1994b: An update for the calculation of
reference evapotranspiration. ICID Bulletin, No. 43, In-
ternational Commission on Irrigation and Drainage, New
Delhi, India, 35–92.
Blasing, T. J., andD. Duvick, 1984: Reconstruction of precipitation
history in North American corn belt using tree rings. Nature,
307, 143–145, doi:10.1038/307143a0.
FIG. 12. Calibration R2 map, using a 3-month June–August SPI
as the target climate field. The calibration has been performed over
the 1904–76 interval, using an SR of 210 km to locate the tree-ring
data.
1 MAY 2015 S E F T IGEN ET AL . 3469

Boorman, D. B., 2003: LOIS in-stream water quality modelling.
Part 2. Results and scenarios. Sci. Total Environ., 314–316,
397–409, doi:10.1016/S0048-9697(03)00065-2.
Busuioc, A., D. Chen, and C. Hellström, 2001: Temporal and
spatial variability of precipitation in Sweden and its link with
the large-scale atmospheric circulation. Tellus, 53A, 348–367,
doi:10.1034/j.1600-0870.2001.01152.x.
Chang, T. J., and X. A. Cleopa, 1991: A proposed method for
drought monitoring. J. Amer. Water Resour. Assoc., 27, 275–
281, doi:10.1111/j.1752-1688.1991.tb03132.x.
Cook, E. R., and G. C. Jacoby, 1977: Tree-ring-drought relation-
ships in the Hudson Valley, New York. Science, 198, 399–401,
doi:10.1126/science.198.4315.399.
——, and K. Peters, 1981: The smoothing spline: A new approach
to standardizing forest interior tree-ring width series for den-
droclimatic studies. Tree-Ring Bull., 41, 45–53.
——, M. A. Kablack, and G. C. Jacoby, 1988: The 1986 drought
in the southeastern United States: How rare an event was
it? J. Geophys. Res., 93, 14 257–14 260, doi:10.1029/
JD093iD11p14257.
——, D. W. Stahle, and M. K. Cleaveland, 1992: Dendroclimatic
evidence from eastern North America. Climate since 1500,
R. S. Bradley and P. D. Jones, Eds., Routledge, 331–348.
——,D.M.Meko, D.W. Stahle, andM. K. Cleaveland, 1996: Tree-
ring reconstructions of past drought across the coterminous
United States: Tests of a regression method and calibration/
verification results. Tree Rings, Environment and Humanity;
Proceedings of the International Conference, Tucson, Arizona,
17–21May 1994, J. S. Dean, D. M. Meko, and T. W. Swetnam,
Eds., Radiocarbon, Dept. of Geosciences, University of Tuc-
son, 155–169.
——, ——, ——, and ——, 1999: Drought reconstructions for
the continental United States. J. Climate, 12, 1145–1162,
doi:10.1175/1520-0442(1999)012,1145:DRFTCU.2.0.CO;2.
——, C. A. Woodhouse, C. M. Eakin, D. M. Meko, and D. W.
Stahle, 2004: Long-term aridity changes in the western United
States. Science, 306, 1015–1018, doi:10.1126/science.1102586.
——, R. Seager, M. A. Cane, and D. W. Stahle, 2007: North
American droughts: Reconstructions, causes and con-
sequences. Earth-Sci. Rev., 81, 93–134, doi:10.1016/
j.earscirev.2006.12.002.
——, K. J. Anchukaitis, B. M. Buckley, R. D. D’Arrigo, J. C.
Jacoby, and W. E. Wright, 2010: Asian monsoon failure and
megadrought during the last millennium. Science, 328, 486–
489, doi:10.1126/science.1185188.
Drobyshev, I., M. Niklasson, H. W. Linderholm, K. Seftigen,
T. Hickler, and O. Eggertsson, 2011: Reconstruction of a re-
gional drought index in southern Sweden since AD 1750.
Holocene, 21, 667–679, doi:10.1177/0959683610391312.
EEA, 2004: Impacts of Europe’s changing climate: An indicator-
based assessment. EEA Rep. 2/2004, European Environment
Agency, 107 pp.
Eklund, B., 1954: Årsringsbreddens klimatiskt betingade variationhos tall och gran inom norra Sverige åren 1900–1944 (The
climatically induced variation of tree-ring width for pine and
spruce in northern Sweden during 1900–1944). Medd. Statens
Skogsforskningsinst., 44, 150 pp.
Erlandsson, S., 1936: Dendrochronological studies. Stockholm’s
College Geochronological Institute Rep. 23, 116 pp.
Fang, K., X. Gou, F. Chen, E. Cook, J. Li, B. Buckley, and
R. D’Arrigo, 2011: Large-scale precipitation variability over
northwest China inferred from tree rings. J. Climate, 24, 3457–
3468, doi:10.1175/2011JCLI3911.1.
Ferrier, R., and A. Edwards, 2002: Sustainability of Scottish water
quality in the early 21st century. Sci. Total Environ., 294, 57–
71, doi:10.1016/S0048-9697(02)00052-9.
Fisher, A., 2000: Preliminary findings from the mid-Atlantic re-
gional assessment. Climate Res., 14, 261–269, doi:10.3354/
cr014261.
Fritts, H. C., 2001. Tree Rings and Climate. Blackburn Press,
584 pp.
Gagen, M., D. McCarroll, and J.-L. Edouard, 2004: The effect of
site conditions on pine tree ring width, density and d13C series
in a dry sub-alpine environment. Arct. Antarct. Alp. Res., 36,
166–171.
——,——, and——, 2006: Combining tree ring width, density and
stable carbon isotope series to enhance the climate signal in
tree-rings: An example from the French Alps. Climatic
Change, 78, 363–379, doi:10.1007/s10584-006-9097-3.
Gilvear, D., K. Heal, and A. Stephen, 2002: Hydrology and the
ecological quality of Scottish river ecosystems. Sci. Total En-
viron., 294, 131–159, doi:10.1016/S0048-9697(02)00060-8.
Gordon, G., 1982. Verification of dendroclimatic reconstructions.
Climate fromTreeRings,M.K.Hughes et al., Eds., Cambridge
University Press, 58–61.
Grissino-Mayer, H. D., and H. C. Fritts, 1997: The International
Tree-Ring Data Bank: An enhanced global database serving
the global scientific community.Holocene, 7, 235–238, doi:10.1177/
095968369700700212.
Guttman, N. B., 1998: Comparing the Palmer Drought Index and
the Standardized Precipitation Index. J. Amer. Water Resour.
Assoc., 34, 113–121, doi:10.1111/j.1752-1688.1998.tb05964.x.
Hansen, J., R. Ruedy, M. Sato, and K. Lo, 2010: Global surface
temperature change. Rev. Geophys., 48,RG4004, doi:10.1029/
2010RG000345.
Harris, I., P. D. Jones, T. J. Osborn, and D. H. Lister, 2013: Up-
dated high-resolution grids of monthly climatic observations—
The CRU TS3.10 dataset. Int. J. Climatol., 34, 623–642,
doi:10.1002/joc.3711.
Heim, R. R., 2002: A review of twentieth-century drought
indices used in the United States. Bull. Amer. Meteor.
Soc., 83, 1149–1165, doi:10.1175/1520-0477(2002)083,1149:
AROTDI.2.3.CO;2.
Helama, S., andM. Lindholm, 2003: Droughts and rainfall in south-
eastern Finland since AD 874, inferred from Scots pine ring-
widths. Boreal Environ. Res., 8, 171–183.
——, J. Merilainen, and H. Tuomenvirta, 2009: Multicentennial
megadrought in northern Europe coincided with a global El
Niño–Southern Oscillation drought pattern during the Medi-
eval Climate Anomaly. Geology, 37, 175–178, doi:10.1130/
G25329A.1.
Herweijer, C., R. Seager, E. R. Cook, and J. Emile-Geay, 2007:
North American droughts of the last millennium from
a gridded network of tree-ring data. J. Climate, 20, 1353–1376,
doi:10.1175/JCLI4042.1.
Hofstra, N., and M. New, 2009: Spatial variability in correlation
decay distance and influence on angular-distance weighting
interpolation of daily precipitation over Europe. Int. J. Cli-
matol., 29, 1872–1880, doi:10.1002/joc.1819.
IPCC, 2013: Summary for policymakers.Climate Change 2013: The
Physical Science Basis, T. F. Stocker et al., Eds., Cambridge
University Press, 1–29.
Jones, P. D., T. J. Osborn, and K. R. Briffa, 1997: Estimating
sampling errors in large-scale temperature averages. J. Cli-
mate, 10, 2548–2568, doi:10.1175/1520-0442(1997)010,2548:
ESEILS.2.0.CO;2.
3470 JOURNAL OF CL IMATE VOLUME 28

——,D. H. Lister, T. J. Osborn, C. Harpham,M. Salmon, and C. P.
Morice, 2012: Hemispheric and large-scale land-surface air
temperature variations: An extensive revision and an update
to 2010. J. Geophys. Res., 117, D05127, doi:10.1029/
2011JD017139.
Jönsson, K., and C. Nilsson, 2009: Scots pine (Pinus sylvestrisL.) on
shingle fields: A dendrochronologic reconstruction of early
summer precipitation in mideast Sweden. J. Climate, 22, 4710–4722, doi:10.1175/2009JCLI2401.1.
Lawrimore, J. H., M. J. Menne, B. E. Gleason, C. N. Williams,
D. B. Wuertz, R. S. Vose, and J. Rennie, 2011: An overview of
the Global Historical Climatology Network monthly mean
temperature data set, version 3. J. Geophys. Res., 116,D19121,
doi:10.1029/2011JD016187.
Levani�c, T., I. Popa, S. Poljan�sek, and C. Nechita, 2013: A 323-year
long reconstruction of drought for SW Romania based on
black pine (Pinus nigra) tree-ring widths. Int. J. Biometeor., 57,
703–714, doi:10.1007/s00484-012-0596-9.
Linderholm, H. W., and T. Molin, 2005: Early nineteenth century
drought in east central Sweden inferred from dendrochro-
nological and historical archives. Climate Res., 29, 63–72,
doi:10.3354/cr029063.
——, M. Niklasson, and T. Molin, 2004: Summer moisture vari-
ability in east central Sweden since themid-eighteenth century
recorded in tree rings. Geogr. Ann., 86, 277–287, doi:10.1111/
j.0435-3676.2004.00231.x.
——, J. A. Björklund, K. Seftigen, B. E. Gunnarson, H. Grudd,
J.-H. Jeong, I. Drobyshev, and Y. Liu, 2010: Dendroclimatology
in Fennoscandia—From past accomplishments to future po-
tential. Climate Past, 6, 93–114, doi:10.5194/cp-6-93-2010.Lloyd-Hughes, B., and M. A. Saunders, 2002: A drought clima-
tology for Europe. Int. J. Climatol., 22, 1571–1592, doi:10.1002/
joc.846.
Mavromatis, T., 2007: Drought index evaluation for assessing fu-
ture wheat production in Greece. Int. J. Climatol., 27, 911–924,
doi:10.1002/joc.1444.
McCarroll, D., and Coauthors, 2003: Multiproxy dendroclimatol-
ogy: A pilot study in northern Finland.Holocene, 13, 829–838,
doi:10.1191/0959683603hl668rp.
——,M. Tuovinen, R. Campbell, M. Gagen, H. Grudd, R. Jalkanen,
N. J. Loader, and I. Robertson, 2011: A critical evaluation of
multi-proxy dendroclimatology in northern Finland. J. Quat.
Sci., 26, 7–14, doi:10.1002/jqs.1408.
——, and Coauthors, 2013: A 1200-year multiproxy record of tree
growthand summer temperature at thenorthernpine forest limit of
Europe.Holocene, 23, 471–484, doi:10.1177/0959683612467483.
McKee, T. B. N., J. Doesken, and J. Kleist, 1993: The relationship
of drought frequency and duration to time scales.Eighth Conf.
on Applied Climatology, Anaheim, CA, Amer. Meteor. Soc.,
179–184.
Meehl, G. A., J. M. Arblaster, and C. Tebaldi, 2005: Understanding
future patterns of precipitation intensity in climate model simula-
tions.Geophys. Res. Lett., 32, L18719, doi:10.1029/2005GL023680.
Meko, D.M., 1992: Dendroclimatic evidence from theGreat Plains
of the United States. Climate since A.D. 1500, R. S. Bradley
and P. D. Jones, Eds., Routledge, 312–330.
——, R. Touchan, and K. J. Anchukaitis, 2011: Seascorr: A
MATLAB program for identifying the seasonal climate signal
in an annual tree-ring time series. Comput. Geosci., 37, 1234–
1241, doi:10.1016/j.cageo.2011.01.013.
National Research Council, 2006: Surface Temperature Re-
constructions for the Last 2,000 Years. National Academies
Press, 196 pp.
Palmer, W. C., 1965: Meteorological droughts. U.S. Department of
Commerce Weather Bureau Research Paper 45, 58 pp.
Percival, D. B., andW. L. B. Constantine, 2006: Exact simulation of
Gaussian time series from nonparametric spectral estimates
with application to bootstrapping. Stat. Comput., 16, 25–35,
doi:10.1007/s11222-006-5198-0.
Rohde, R., and Coauthors, 2013: A new estimate of the aver-
age Earth surface land temperature spanning 1753 to
2011. Geoinfor. Geostat. Overview, 1 (1), doi:10.4172/
2327-4581.1000101.
Rumsby, B. T., and M. G. Macklin, 1994: Channel and floodplain
response to recent abrupt climate change: The Tyne Basin,
northern England. Earth Surf. Processes Landforms, 19, 499–
515, doi:10.1002/esp.3290190603.
Seftigen, K., H. W. Linderholm, I. Drobyshev, and M. Niklasson, 2013:
Reconstructed drought variability in east-central Sweden since the
1650s. Int. J. Climatol., 33, 2449–2458, doi:10.1002/joc.3592.
Smith, R. B., 1979: The influence of mountains on the atmosphere.
Advances in Geophysics, Vol. 21, Academic Press, 87–230.
Soulsby, C., C. Gibbins, A.Wade, R. Smart, and R. Helliwell, 2002:
Water quality in the Scottish uplands: A hydrological per-
spective on catchment hydrochemistry. Sci. Total Environ.,
294, 73–94, doi:10.1016/S0048-9697(02)00057-8.Stahle, D. W., M. K. Cleaveland, and J. G. Hehr, 1985: A 450-year
drought reconstruction for Arkansas, United States. Nature,
316, 530–532, doi:10.1038/316530a0.——, ——, and ——, 1988: North Carolina climate changes from
tree rings: A.D. 372 to 1985. Science, 240, 1517–1519, doi:10.1126/
science.240.4858.1517.
Stockton, C. W., and D. M. Meko, 1975: A long-term history of
drought occurrence in western United States as inferred from
tree rings. Weatherwise, 28, 244–250, doi:10.1080/
00431672.1975.9931775.
——, and ——, 1983: Drought recurrence in the Great Plains as re-
constructed from long-term tree-ring records. J. Climate Appl.
Meteor., 22, 17–29, doi:10.1175/1520-0450(1983)022,0017:
DRITGP.2.0.CO;2.
Stokes,M.A., and T. L. Smiley, 1968:An Introduction to Tree-Ring
Dating. University of Chicago Press, 73 pp.
Thornthwaite, C. W., 1948: An approach toward a rational classi-
fication of climate.Geogr. Rev., 38, 55–94, doi:10.2307/210739.Touchan, R., G. Funkhouser, M. K. Hughes, and N. Erkan, 2005:
Standardized precipitation index reconstructed from Turkish
tree-ring widths. Climatic Change, 72, 339–353, doi:10.1007/
s10584-005-5358-9.
——, K. J. Anchukaitis, D. M. Meko, M. Sabir, S. Attalah, and
A. Aloui, 2011: Spatiotemporal drought variability in north-
western Africa over the last nine centuries. Climate Dyn., 37,
237–253, doi:10.1007/s00382-010-0804-4.
Vicente-Serrano, S. M., S. Beguería, and J. I. López-Moreno, 2010:A multiscalar drought index sensitive to global warming: The
standardized precipitation evapotranspiration index. J. Cli-
mate, 23, 1696–1718, doi:10.1175/2009JCLI2909.1.
Wetherald, R. T., and S. Manabe, 2002: Simulation of hydrologic
changes associated with global warming. J. Geophys. Res., 107,
4379, doi:10.1029/2001JD001195.
Wilhite, D. A., andM. H. Glantz, 1985: Understanding the drought
phenomenon: The role of definitions. Water Int., 10, 111–120,
doi:10.1080/02508068508686328.
Woodhouse, C. A., J. L. Russell, and E. R. Cook, 2009: Twomodes
of North American drought from instrumental and paleo-
climatic data. J. Climate, 22, 4336–4347, doi:10.1175/
2009JCLI2705.1.
1 MAY 2015 S E F T IGEN ET AL . 3471