the potential application of the tfl direct vision
TRANSCRIPT

Looking out for vulnerable road users
The potential application of the TfL Direct Vision Standard in
UNECE regulation – Reporting results of tasks assigned in the 13th meeting
Loughborough University Design School (LDS): Design Ergonomics Research Group
Research Sponsored by Transport for London
Dr. Steve Summerskill – Senior Lecturer in Industrial design and ergonomics
Dr. Russell Marshall, Dr Abby Paterson, Anthony Eland, James Lenard, Steve Reed
VRU-Proxi-14-08 Rev1

Looking out for vulnerable road users
Contents
• Main points to be covered at the 14th meeting
• Review of tasks assigned at the 13th meeting
• Reporting results with extra vehicle data added – The VRU simulation with head being visible
– The simulation of the Physical test
• Explore the possibilities and results of two potential approaches for
utilising the LDS volumetric approach
• Reporting the findings of the analysis of the performance when
Mirrors and Wipers are removed
• Summary

Looking out for vulnerable road users
Review of tasks assigned at the 13th meeting
Key tasks
1. Complete the data set for the revised VRU simulations where the head being visible is the new limit. (40 vehicles now in
the dataset)
2. Complete the data set for simulation of the LDS Physical test method. (50 vehicles now in the sample)
3. Explore the possibilities and results of two potential approaches for utilising the LDS volumetric approach
1. Utilise an approach where vision to the Front & Passenger side must separately meet a minimum requirement as defined by the
volume for an average distance of the VRU simulations, where the distance is defined as the limits of the Class V and VI mirror zone
for the passenger and front. For the driver’s side a value has been selected for demonstration.
2. Utilise an approach where the volume to the Front, Driver’s side and Passenger side can be combined to give an overall volumetric
score but those volumes are defined by a reduced distance of the VRU simulations (see UK Contracting Party proposal from the 13th
meeting). Note: The updated results from Task 1 completed this task, and the key question of limits that can be acceptable to all remains.The updated graph will be made available at the meeting
with the same equations that allow the results different options to be seen.
4. Explore the effect of removing mirrors and windscreen wipers.

Looking out for vulnerable road users
Task 1. Add to the data set for the revised VRU simulations for head and neck only
40 vehicles now in the sample. Pearson's Correlation coefficient = 0.964 between volume and VRU distance. Therefore using VRU simulations where
the head is visible as opposed to head and shoulders is proposed for determining the minimum volumetric limits for the UNECE version of the DVS.
Looking out for vulnerable road users
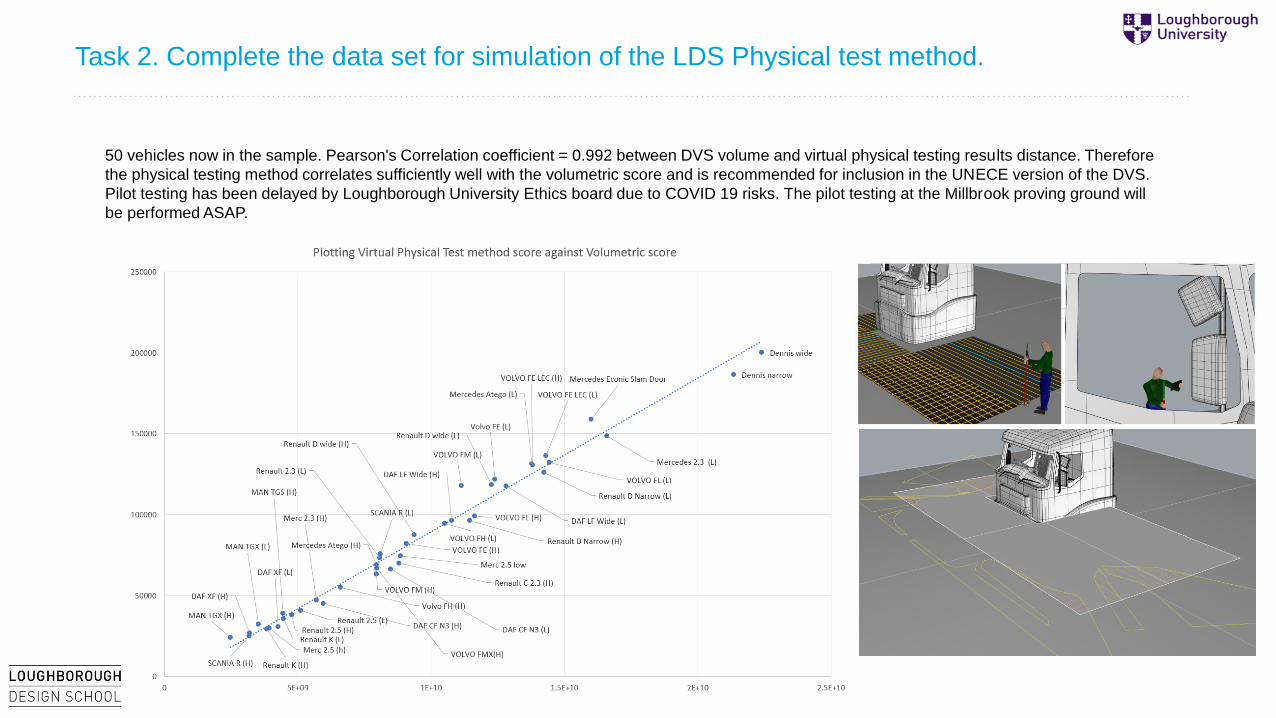
Task 2. Complete the data set for simulation of the LDS Physical test method.
50 vehicles now in the sample. Pearson's Correlation coefficient = 0.992 between DVS volume and virtual physical testing results distance. Therefore
the physical testing method correlates sufficiently well with the volumetric score and is recommended for inclusion in the UNECE version of the DVS.
Pilot testing has been delayed by Loughborough University Ethics board due to COVID 19 risks. The pilot testing at the Millbrook proving ground will
be performed ASAP.
Looking out for vulnerable road users
• Task 3.1: Utilise an approach where vision to the Front & Driver’s side must
separately meet a minimum requirement as defined by the volume for an average
distance of the VRU simulations. The distance is defined as the limits of the Class V
and VI mirror zone for the passenger and front. For the driver’s side a value has
been selected for demonstration.
• The following three slides show the previous results separated into three different
directions of view i.e. plotting the average VRU distance and volume to the driver’s
side, passenger side and front of the vehicle.

Looking out for vulnerable road users
Explore the possibilities and results of two potential approaches for utilising the
LDS volumetric approach – separated approach
Step 1. Identify the volumes that would be required as visible to each side. Therefore plot the HEAD ONLY VRU distances against volume
for each side of the vehicle. Passenger side
Looking out for vulnerable road users
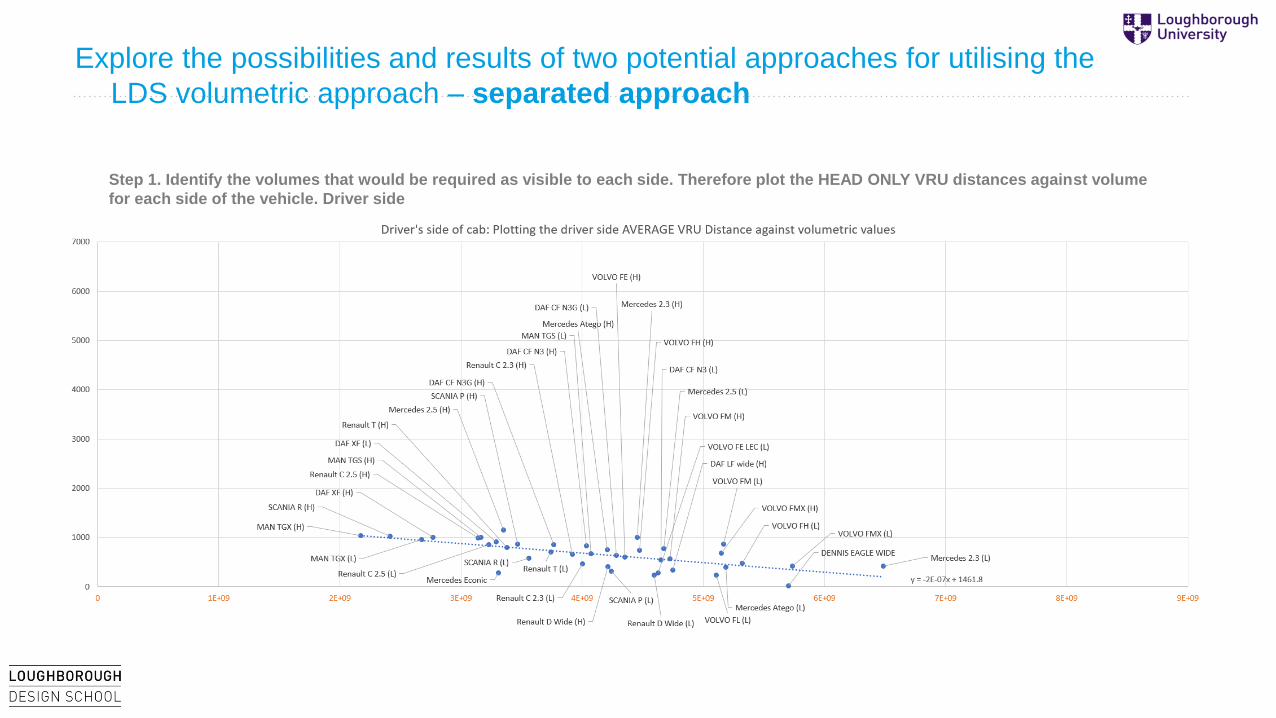
Explore the possibilities and results of two potential approaches for utilising the
LDS volumetric approach – separated approach
Step 1. Identify the volumes that would be required as visible to each side. Therefore plot the HEAD ONLY VRU distances against volume
for each side of the vehicle. Driver side
Looking out for vulnerable road users
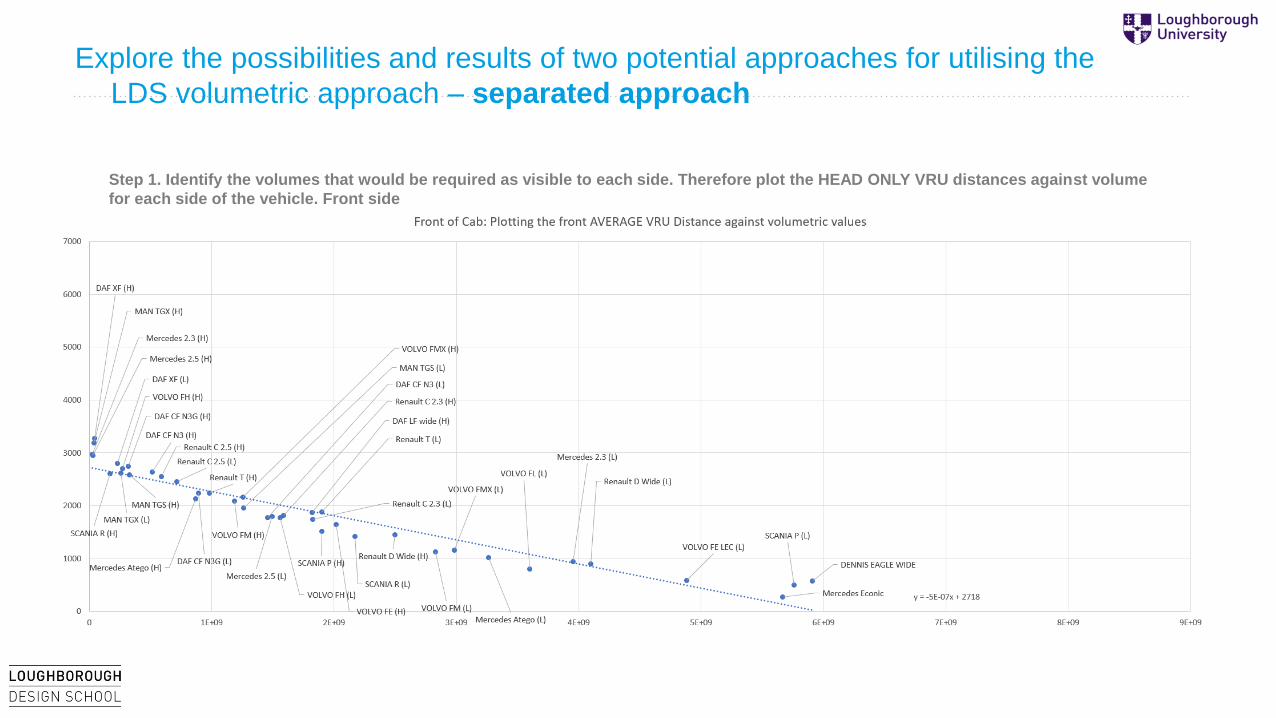
Explore the possibilities and results of two potential approaches for utilising the
LDS volumetric approach – separated approach
Step 1. Identify the volumes that would be required as visible to each side. Therefore plot the HEAD ONLY VRU distances against volume
for each side of the vehicle. Front side

Looking out for vulnerable road users
Comparing the volumes to each side
Each graph uses the same scale values to allow direct comparison.
The correlations between the VRU distance and volume are as follows, where
values above 0.5 are considered strong and 1 is perfect.
Passenger side = -0.956
Driver’s side =-0.67
Front = -0.93
A review of why the correlation for the Drivers side is slightly weaker
highlighted that the mirror mounting position within the window apertures from
the drivers eye point has a strong effect, where mirrors which are mounted
higher allow the VRUs to be located closer to the vehicle.

Looking out for vulnerable road users
Explore the possibilities and results of two potential approaches for utilising the
LDS volumetric approach – separated approach
Two different methods have been used to define the minimum requirement to each side.
1. The method discussed at the last meeting, i.e. using the equation of the trend line in the graph to derive the volumetric value from the
associated MAXIMUM AVERAGE VRU distance to each side. (e.g. 4500mm to the passenger side and 2000mm to the front)
The 4500mm and 2000mm values are associated with the mirror coverage areas but there is no equivalent value to the driver’s side.
This makes selecting a limit to the driver’s side problematic as the decision is arbitrary. We have used a distance of 1000mm in the
analysis below. This can be varied as to the wishes of the VRU Proxy Group.
2. Using the volumetric score for the vehicle which has the AVERAGE VRU distance just below the values above.
Note: These values can be adjusted for whatever values the UNECE VRU Proxy group deem to be necessary
Looking out for vulnerable road users
VRU VOL
Mercedes Econic 266.0 5.66E+09
SCANIA P (L) 500.3 5.76E+09
DENNIS EAGLE WIDE 572.0 5.91E+09
VOLVO FE LEC (L) 586.7 4.88E+09
VOLVO FL (L) 797.3 3.60E+09
Renault D Wide (L) 891.3 4.10E+09
Mercedes 2.3 (L) 942.7 3.95E+09
Mercedes Atego (L) 1012.0 3.26E+09
VOLVO FM (L) 1129.0 2.83E+09
VOLVO FMX (L) 1152.3 2.98E+09
SCANIA R (L) 1415.7 2.17E+09
Renault D Wide (H) 1445.0 2.50E+09
SCANIA P (H) 1517.0 1.90E+09
VOLVO FE (H) 1645.3 2.02E+09
Renault C 2.3 (L) 1744.7 1.83E+09
DAF CF N3 (L) 1769.0 1.46E+09
VOLVO FH (L) 1776.0 1.56E+09
Mercedes 2.5 (L) 1790.7 1.49E+09
Renault C 2.3 (H) 1816.3 1.59E+09
DAF LF wide (H) 1867.3 1.82E+09
Renault T (L) 1881.7 1.90E+09
MAN TGS (L) 1951.7 1.26E+09
VOLVO FM (H) 2084.0 1.18E+09
Mercedes Atego (H) 2126.3 8.68E+08
VOLVO FMX (H) 2156.3 1.26E+09
Renault T (H) 2238.7 9.80E+08
DAF CF N3G (L) 2239.3 8.91E+08
Renault C 2.5 (L) 2453.3 7.13E+08
Renault C 2.5 (H) 2546.7 5.90E+08
MAN TGS (H) 2582.0 3.26E+08
SCANIA R (H) 2599.3 1.67E+08
MAN TGX (L) 2619.7 2.58E+08
DAF CF N3 (H) 2641.0 5.14E+08
VOLVO FH (H) 2696.7 2.74E+08
DAF CF N3G (H) 2743.3 3.19E+08
DAF XF (L) 2803.0 2.29E+08
Mercedes 2.5 (H) 2952.3 2.99E+07
Mercedes 2.3 (H) 2970.0 2.35E+07
MAN TGX (H) 3189.0 3.64E+07
DAF XF (H) 3275.3 4.17E+07
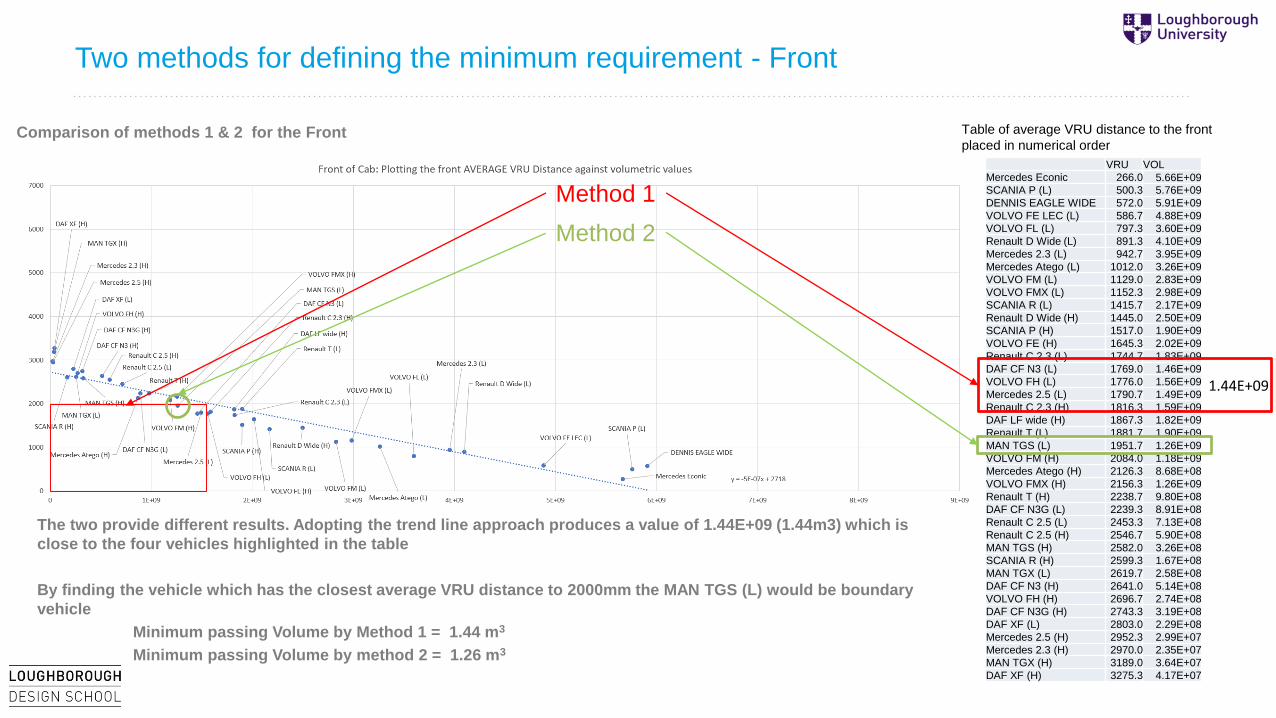
Two methods for defining the minimum requirement - Front
Comparison of methods 1 & 2 for the Front Table of average VRU distance to the front
placed in numerical order
The two provide different results. Adopting the trend line approach produces a value of 1.44E+09 (1.44m3) which is
close to the four vehicles highlighted in the table
By finding the vehicle which has the closest average VRU distance to 2000mm the MAN TGS (L) would be boundary
vehicle
Minimum passing Volume by Method 1 = 1.44 m3
Minimum passing Volume by method 2 = 1.26 m3
Method 2
Method 1
1.44E+09

Looking out for vulnerable road users
VRU VOL
Mercedes Econic 383.6 7.39E+09
DENNIS EAGLE WIDE 385.2 8.20E+09
Mercedes Atego (L) 1651.4 5.32E+09
Mercedes 2.3 (L) 1962.2 6.15E+09
SCANIA P (L) 2008.2 4.16E+09
VOLVO FL (L) 2143.8 5.73E+09
DAF LF wide (H) 2414.6 4.20E+09
VOLVO FH (L) 2419.526 3.63E+09
VOLVO FMX (L) 2479.4 3.37E+09
VOLVO FE LEC (L) 2549.4 4.79E+09
Renault D Wide (L) 2679.6 4.29E+09
Mercedes 2.5 (L) 2821.8 2.68E+09
Renault D Wide (H) 2984 3.59E+09
Mercedes Atego (H) 2991 2.87E+09
SCANIA R (L) 3092 2.36E+09
VOLVO FE (H) 3107.8 3.67E+09
DAF CF N3 (L) 3111 2.38E+09
Renault C 2.3 (L) 3250.6 3.33E+09
Renault C 2.3 (H) 3308.6 3.22E+09
VOLVO FM (L) 3318 3.32E+09
VOLVO FH (H) 3353.8 1.86E+09
SCANIA P (H) 3431 1.79E+09
DAF CF N3G (L) 3487 1.63E+09
VOLVO FMX (H) 3516.764 1.97E+09
VOLVO FM (H) 3718.2 2.05E+09
Renault T (L) 3726.6 2.08E+09
MAN TGS (L) 3835 2.05E+09
DAF CF N3 (H) 3889 1.40E+09
Renault T (H) 4037 1.42E+09
Mercedes 2.3 (H) 4188 1.22E+09
Renault C 2.5 (L) 4221.8 2.79E+09
DAF XF (L) 4308.6 7.38E+08
Renault C 2.5 (H) 4309.4 2.72E+09
SCANIA R (H) 4362.99 5.97E+08
MAN TGS (H) 4517.4 9.54E+08
DAF CF N3G (H) 4522 9.85E+08
Mercedes 2.5 (H) 4866.4 5.56E+08
DAF XF (H) 4929.4 2.89E+08
MAN TGX (L) 5062.2 5.87E+08
MAN TGX (H) 5837 2.69E+08
Two methods for defining the minimum requirement – Passenger side
Comparison of methods 1 & 2 for the Passenger side Table of average VRU distance to the
passenger side placed in numerical order
The two methods provide different results. Adopting the trend line approach produces a result of 7.16E+08 (0.7m3)
equivalent to the DAF XF (L).
By finding the vehicle which has the closest average VRU distance to 4500mm, the SCANIA R (H) would be the
Boundary vehicle
Minimum passing Volume by Method 1 = 0.7 m3
Minimum passing Volume by method 2 = 0.6 m3
Method 2
Method 1
7.16E+08

Looking out for vulnerable road users
VRU VOL
DENNIS EAGLE
WIDE 17.8 5.70E+09
Renault D Wide (L) 231.4 4.59E+09
VOLVO FL (L) 235.8 5.10E+09
Mercedes Econic 275.6 3.31E+09
VOLVO FE LEC (L) 284.2 4.63E+09
SCANIA P (L) 316.6 4.24E+09
DAF LF wide (H) 338.4 4.75E+09
Mercedes Atego (L) 399.8 5.19E+09
Renault D Wide (H) 405 4.21E+09
Mercedes 2.3 (L) 413.582 6.48E+09
VOLVO FMX (L) 422.8 5.74E+09
Renault C 2.3 (L) 464.2 4.00E+09
VOLVO FH (L) 472 5.32E+09
DAF CF N3 (L) 540 4.65E+09
VOLVO FM (H) 564.8 4.72E+09
SCANIA R (L) 573 3.56E+09
VOLVO FE (H) 597 4.35E+09
DAF CF N3G (L) 634 4.28E+09
Renault C 2.3 (H) 656.6 3.92E+09
MAN TGS (L) 674.256 4.07E+09
VOLVO FMX (H) 677.35 5.15E+09
Renault T (L) 706.2 3.74E+09
VOLVO FH (H) 739 4.47E+09
Mercedes Atego (H) 755.4 4.21E+09
Mercedes 2.5 (L) 767 4.67E+09
Renault T (H) 795.4 3.38E+09
DAF CF N3 (H) 828 4.03E+09
Renault C 2.5 (L) 847.6 3.23E+09
DAF CF N3G (H) 856.6 3.76E+09
SCANIA P (H) 861 3.47E+09
VOLVO FM (L) 868.6 5.17E+09
DAF XF (L) 913.52 3.29E+09
MAN TGX (L) 960.6 2.67E+09
Renault C 2.5 (H) 994 3.14E+09
DAF XF (H) 1002.8 2.77E+09
MAN TGS (H) 1004.6 3.16E+09
Mercedes 2.3 (H) 1007.2 4.45E+09
SCANIA R (H) 1028.176 2.41E+09
MAN TGX (H) 1040.6 2.17E+09
Mercedes 2.5 (H) 1146.6 3.35E+09
Two methods for defining the minimum requirement – Driver’s side
Comparison of methods 1 & 2 for the driver side Table of average VRU distance to the
Driver side placed in numerical order
The two provide different results. Adopting the trend approach products a result of 2.25E+09 (2.25m3)
which is between the values for the MAN TGX (H) and the Scania R High.
By finding the vehicle which has the closest average VRU distance to 1000mm the Renault C2.5 (H) would be the
boundary vehicle.
Minimum passing Volume by Method 1 = 2.25 m3
Minimum passing Volume by method 2 = 3.14 m3
Method 2
Method 1
2.25E+09

Looking out for vulnerable road users
Which method is appropriate?
• The two methods explored provide approaches for defining the minimum volumes to be seen to each side.
• The trend line approach uses data from all vehicles in the sample using the equation of the trend line to define the values
and is the preferred approach by the LDS team.
• Therefore from the analysis performed and limits used the volumetric minimum requirement for a separated approach would
require the following volumes to be visible to each side using a separated approach.
• Front = 1.44 m3
• Drivers side = 2.25 m3
• Passenger side = 0.7 m3
• Total = 4.39m3
• This is much less than the TfL 1 star at 10.4m3 and the EMSR at 8m3. The reason for this is defined on the next slide.
• There are negatives in taking this approach. Here we have set limits by a separated approach which are equivalent to having
the VRU distance values at the edge of the assessment volume, as requested at the last meeting, which in turn requires the
driver to have the mirrors adjusted accurately to allow the VRUs closer to the edges of the assessment volume to be seen.
• The result from this process is that we expect to see more from the driver’s side (low risk of an accident) than we do from the
passenger side, high accident risk.
Looking out for vulnerable road users
VRU VOL
Mercedes Econic 266.0 5.66E+09
SCANIA P (L) 500.3 5.76E+09
DENNIS EAGLE WIDE 572.0 5.91E+09
VOLVO FE LEC (L) 586.7 4.88E+09
VOLVO FL (L) 797.3 3.60E+09
Renault D Wide (L) 891.3 4.10E+09
Mercedes 2.3 (L) 942.7 3.95E+09
Mercedes Atego (L) 1012.0 3.26E+09
VOLVO FM (L) 1129.0 2.83E+09
VOLVO FMX (L) 1152.3 2.98E+09
SCANIA R (L) 1415.7 2.17E+09
Renault D Wide (H) 1445.0 2.50E+09
SCANIA P (H) 1517.0 1.90E+09
VOLVO FE (H) 1645.3 2.02E+09
Renault C 2.3 (L) 1744.7 1.83E+09
DAF CF N3 (L) 1769.0 1.46E+09
VOLVO FH (L) 1776.0 1.56E+09
Mercedes 2.5 (L) 1790.7 1.49E+09
Renault C 2.3 (H) 1816.3 1.59E+09
DAF LF wide (H) 1867.3 1.82E+09
Renault T (L) 1881.7 1.90E+09
MAN TGS (L) 1951.7 1.26E+09
VOLVO FM (H) 2084.0 1.18E+09
Mercedes Atego (H) 2126.3 8.68E+08
VOLVO FMX (H) 2156.3 1.26E+09
Renault T (H) 2238.7 9.80E+08
DAF CF N3G (L) 2239.3 8.91E+08
Renault C 2.5 (L) 2453.3 7.13E+08
Renault C 2.5 (H) 2546.7 5.90E+08
MAN TGS (H) 2582.0 3.26E+08
SCANIA R (H) 2599.3 1.67E+08
MAN TGX (L) 2619.7 2.58E+08
DAF CF N3 (H) 2641.0 5.14E+08
VOLVO FH (H) 2696.7 2.74E+08
DAF CF N3G (H) 2743.3 3.19E+08
DAF XF (L) 2803.0 2.29E+08
Mercedes 2.5 (H) 2952.3 2.99E+07
Mercedes 2.3 (H) 2970.0 2.35E+07
MAN TGX (H) 3189.0 3.64E+07
DAF XF (H) 3275.3 4.17E+07
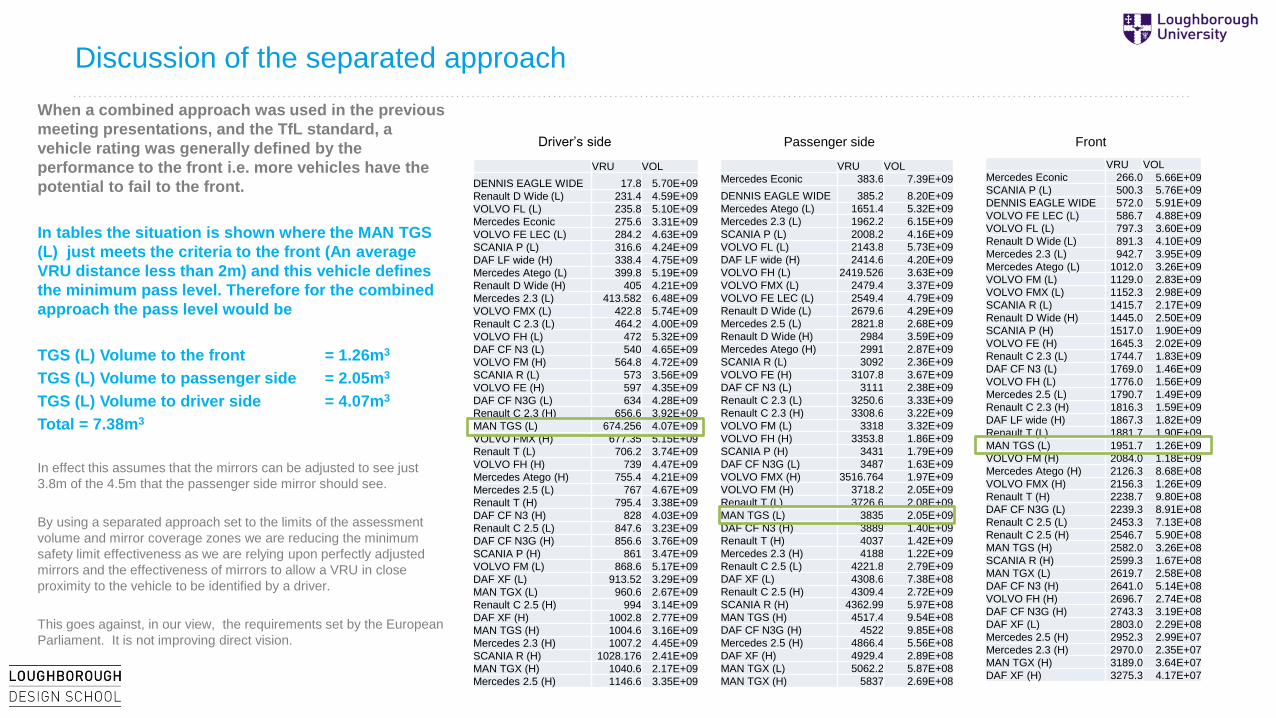
Discussion of the separated approach
Front
When a combined approach was used in the previous
meeting presentations, and the TfL standard, a
vehicle rating was generally defined by the
performance to the front i.e. more vehicles have the
potential to fail to the front.
In tables the situation is shown where the MAN TGS
(L) just meets the criteria to the front (An average
VRU distance less than 2m) and this vehicle defines
the minimum pass level. Therefore for the combined
approach the pass level would be
TGS (L) Volume to the front = 1.26m3
TGS (L) Volume to passenger side = 2.05m3
TGS (L) Volume to driver side = 4.07m3
Total = 7.38m3
In effect this assumes that the mirrors can be adjusted to see just
3.8m of the 4.5m that the passenger side mirror should see.
By using a separated approach set to the limits of the assessment
volume and mirror coverage zones we are reducing the minimum
safety limit effectiveness as we are relying upon perfectly adjusted
mirrors and the effectiveness of mirrors to allow a VRU in close
proximity to the vehicle to be identified by a driver.
This goes against, in our view, the requirements set by the European
Parliament. It is not improving direct vision.
VRU VOL
Mercedes Econic 383.6 7.39E+09
DENNIS EAGLE WIDE 385.2 8.20E+09
Mercedes Atego (L) 1651.4 5.32E+09
Mercedes 2.3 (L) 1962.2 6.15E+09
SCANIA P (L) 2008.2 4.16E+09
VOLVO FL (L) 2143.8 5.73E+09
DAF LF wide (H) 2414.6 4.20E+09
VOLVO FH (L) 2419.526 3.63E+09
VOLVO FMX (L) 2479.4 3.37E+09
VOLVO FE LEC (L) 2549.4 4.79E+09
Renault D Wide (L) 2679.6 4.29E+09
Mercedes 2.5 (L) 2821.8 2.68E+09
Renault D Wide (H) 2984 3.59E+09
Mercedes Atego (H) 2991 2.87E+09
SCANIA R (L) 3092 2.36E+09
VOLVO FE (H) 3107.8 3.67E+09
DAF CF N3 (L) 3111 2.38E+09
Renault C 2.3 (L) 3250.6 3.33E+09
Renault C 2.3 (H) 3308.6 3.22E+09
VOLVO FM (L) 3318 3.32E+09
VOLVO FH (H) 3353.8 1.86E+09
SCANIA P (H) 3431 1.79E+09
DAF CF N3G (L) 3487 1.63E+09
VOLVO FMX (H) 3516.764 1.97E+09
VOLVO FM (H) 3718.2 2.05E+09
Renault T (L) 3726.6 2.08E+09
MAN TGS (L) 3835 2.05E+09
DAF CF N3 (H) 3889 1.40E+09
Renault T (H) 4037 1.42E+09
Mercedes 2.3 (H) 4188 1.22E+09
Renault C 2.5 (L) 4221.8 2.79E+09
DAF XF (L) 4308.6 7.38E+08
Renault C 2.5 (H) 4309.4 2.72E+09
SCANIA R (H) 4362.99 5.97E+08
MAN TGS (H) 4517.4 9.54E+08
DAF CF N3G (H) 4522 9.85E+08
Mercedes 2.5 (H) 4866.4 5.56E+08
DAF XF (H) 4929.4 2.89E+08
MAN TGX (L) 5062.2 5.87E+08
MAN TGX (H) 5837 2.69E+08
Passenger side
VRU VOL
DENNIS EAGLE WIDE 17.8 5.70E+09
Renault D Wide (L) 231.4 4.59E+09
VOLVO FL (L) 235.8 5.10E+09
Mercedes Econic 275.6 3.31E+09
VOLVO FE LEC (L) 284.2 4.63E+09
SCANIA P (L) 316.6 4.24E+09
DAF LF wide (H) 338.4 4.75E+09
Mercedes Atego (L) 399.8 5.19E+09
Renault D Wide (H) 405 4.21E+09
Mercedes 2.3 (L) 413.582 6.48E+09
VOLVO FMX (L) 422.8 5.74E+09
Renault C 2.3 (L) 464.2 4.00E+09
VOLVO FH (L) 472 5.32E+09
DAF CF N3 (L) 540 4.65E+09
VOLVO FM (H) 564.8 4.72E+09
SCANIA R (L) 573 3.56E+09
VOLVO FE (H) 597 4.35E+09
DAF CF N3G (L) 634 4.28E+09
Renault C 2.3 (H) 656.6 3.92E+09
MAN TGS (L) 674.256 4.07E+09
VOLVO FMX (H) 677.35 5.15E+09
Renault T (L) 706.2 3.74E+09
VOLVO FH (H) 739 4.47E+09
Mercedes Atego (H) 755.4 4.21E+09
Mercedes 2.5 (L) 767 4.67E+09
Renault T (H) 795.4 3.38E+09
DAF CF N3 (H) 828 4.03E+09
Renault C 2.5 (L) 847.6 3.23E+09
DAF CF N3G (H) 856.6 3.76E+09
SCANIA P (H) 861 3.47E+09
VOLVO FM (L) 868.6 5.17E+09
DAF XF (L) 913.52 3.29E+09
MAN TGX (L) 960.6 2.67E+09
Renault C 2.5 (H) 994 3.14E+09
DAF XF (H) 1002.8 2.77E+09
MAN TGS (H) 1004.6 3.16E+09
Mercedes 2.3 (H) 1007.2 4.45E+09
SCANIA R (H) 1028.176 2.41E+09
MAN TGX (H) 1040.6 2.17E+09
Mercedes 2.5 (H) 1146.6 3.35E+09
Driver’s side

Looking out for vulnerable road users
VRU VOL
Mercedes Econic 266.0 5.66E+09
SCANIA P (L) 500.3 5.76E+09
DENNIS EAGLE WIDE 572.0 5.91E+09
VOLVO FE LEC (L) 586.7 4.88E+09
VOLVO FL (L) 797.3 3.60E+09
Renault D Wide (L) 891.3 4.10E+09
Mercedes 2.3 (L) 942.7 3.95E+09
Mercedes Atego (L) 1012.0 3.26E+09
VOLVO FM (L) 1129.0 2.83E+09
VOLVO FMX (L) 1152.3 2.98E+09
SCANIA R (L) 1415.7 2.17E+09
Renault D Wide (H) 1445.0 2.50E+09
SCANIA P (H) 1517.0 1.90E+09
VOLVO FE (H) 1645.3 2.02E+09
Renault C 2.3 (L) 1744.7 1.83E+09
DAF CF N3 (L) 1769.0 1.46E+09
VOLVO FH (L) 1776.0 1.56E+09
Mercedes 2.5 (L) 1790.7 1.49E+09
Renault C 2.3 (H) 1816.3 1.59E+09
DAF LF wide (H) 1867.3 1.82E+09
Renault T (L) 1881.7 1.90E+09
MAN TGS (L) 1951.7 1.26E+09
VOLVO FM (H) 2084.0 1.18E+09
Mercedes Atego (H) 2126.3 8.68E+08
VOLVO FMX (H) 2156.3 1.26E+09
Renault T (H) 2238.7 9.80E+08
DAF CF N3G (L) 2239.3 8.91E+08
Renault C 2.5 (L) 2453.3 7.13E+08
Renault C 2.5 (H) 2546.7 5.90E+08
MAN TGS (H) 2582.0 3.26E+08
SCANIA R (H) 2599.3 1.67E+08
MAN TGX (L) 2619.7 2.58E+08
DAF CF N3 (H) 2641.0 5.14E+08
VOLVO FH (H) 2696.7 2.74E+08
DAF CF N3G (H) 2743.3 3.19E+08
DAF XF (L) 2803.0 2.29E+08
Mercedes 2.5 (H) 2952.3 2.99E+07
Mercedes 2.3 (H) 2970.0 2.35E+07
MAN TGX (H) 3189.0 3.64E+07
DAF XF (H) 3275.3 4.17E+07
Discussion of the separated approach
FrontThe tables illustrate that if a separated approach is
taken using the limits of 4.5m (passenger side), 2m
(front), and 1m (Driver’s Side), there we would be a
requirement for designs to be improved to allow
better direct vison to the front of the cab.
However, as can be seen by the passenger side
result, the majority of vehicles on the road would be
meet the minimum requirement for vision. But we
know that the passenger side is the area of greatest
risk for accidents with pedestrians and cyclists.
These thresholds would therefore result in future
designs which would improve vison to the front, but
would not provide a strong impetus for improving
vision to the sides.
The following slides reproduce the options discussed
in the OSAKA meeting.
VRU VOL
Mercedes Econic 383.6 7.39E+09
DENNIS EAGLE WIDE 385.2 8.20E+09
Mercedes Atego (L) 1651.4 5.32E+09
Mercedes 2.3 (L) 1962.2 6.15E+09
SCANIA P (L) 2008.2 4.16E+09
VOLVO FL (L) 2143.8 5.73E+09
DAF LF wide (H) 2414.6 4.20E+09
VOLVO FH (L) 2419.526 3.63E+09
VOLVO FMX (L) 2479.4 3.37E+09
VOLVO FE LEC (L) 2549.4 4.79E+09
Renault D Wide (L) 2679.6 4.29E+09
Mercedes 2.5 (L) 2821.8 2.68E+09
Renault D Wide (H) 2984 3.59E+09
Mercedes Atego (H) 2991 2.87E+09
SCANIA R (L) 3092 2.36E+09
VOLVO FE (H) 3107.8 3.67E+09
DAF CF N3 (L) 3111 2.38E+09
Renault C 2.3 (L) 3250.6 3.33E+09
Renault C 2.3 (H) 3308.6 3.22E+09
VOLVO FM (L) 3318 3.32E+09
VOLVO FH (H) 3353.8 1.86E+09
SCANIA P (H) 3431 1.79E+09
DAF CF N3G (L) 3487 1.63E+09
VOLVO FMX (H) 3516.764 1.97E+09
VOLVO FM (H) 3718.2 2.05E+09
Renault T (L) 3726.6 2.08E+09
MAN TGS (L) 3835 2.05E+09
DAF CF N3 (H) 3889 1.40E+09
Renault T (H) 4037 1.42E+09
Mercedes 2.3 (H) 4188 1.22E+09
Renault C 2.5 (L) 4221.8 2.79E+09
DAF XF (L) 4308.6 7.38E+08
Renault C 2.5 (H) 4309.4 2.72E+09
SCANIA R (H) 4362.99 5.97E+08
MAN TGS (H) 4517.4 9.54E+08
DAF CF N3G (H) 4522 9.85E+08
Mercedes 2.5 (H) 4866.4 5.56E+08
DAF XF (H) 4929.4 2.89E+08
MAN TGX (L) 5062.2 5.87E+08
MAN TGX (H) 5837 2.69E+08
Passenger side
VRU VOL
DENNIS EAGLE WIDE 17.8 5.70E+09
Renault D Wide (L) 231.4 4.59E+09
VOLVO FL (L) 235.8 5.10E+09
Mercedes Econic 275.6 3.31E+09
VOLVO FE LEC (L) 284.2 4.63E+09
SCANIA P (L) 316.6 4.24E+09
DAF LF wide (H) 338.4 4.75E+09
Mercedes Atego (L) 399.8 5.19E+09
Renault D Wide (H) 405 4.21E+09
Mercedes 2.3 (L) 413.582 6.48E+09
VOLVO FMX (L) 422.8 5.74E+09
Renault C 2.3 (L) 464.2 4.00E+09
VOLVO FH (L) 472 5.32E+09
DAF CF N3 (L) 540 4.65E+09
VOLVO FM (H) 564.8 4.72E+09
SCANIA R (L) 573 3.56E+09
VOLVO FE (H) 597 4.35E+09
DAF CF N3G (L) 634 4.28E+09
Renault C 2.3 (H) 656.6 3.92E+09
MAN TGS (L) 674.256 4.07E+09
VOLVO FMX (H) 677.35 5.15E+09
Renault T (L) 706.2 3.74E+09
VOLVO FH (H) 739 4.47E+09
Mercedes Atego (H) 755.4 4.21E+09
Mercedes 2.5 (L) 767 4.67E+09
Renault T (H) 795.4 3.38E+09
DAF CF N3 (H) 828 4.03E+09
Renault C 2.5 (L) 847.6 3.23E+09
DAF CF N3G (H) 856.6 3.76E+09
SCANIA P (H) 861 3.47E+09
VOLVO FM (L) 868.6 5.17E+09
DAF XF (L) 913.52 3.29E+09
MAN TGX (L) 960.6 2.67E+09
Renault C 2.5 (H) 994 3.14E+09
DAF XF (H) 1002.8 2.77E+09
MAN TGS (H) 1004.6 3.16E+09
Mercedes 2.3 (H) 1007.2 4.45E+09
SCANIA R (H) 1028.176 2.41E+09
MAN TGX (H) 1040.6 2.17E+09
Mercedes 2.5 (H) 1146.6 3.35E+09
Driver’s side

Looking out for vulnerable road users
Options to be considered by the UNECE Proxy GroupOption 1. Contracting parties suggestion: Front Limit = 1700mm, Passenger side limit = 2500mm, Drivers side limit = 500mm
Fail Pass
Fail Pass
Fail Pass
Total volume that must be seen = 10.9m3, equivalent to TfL 1 star
Looking out for vulnerable road users
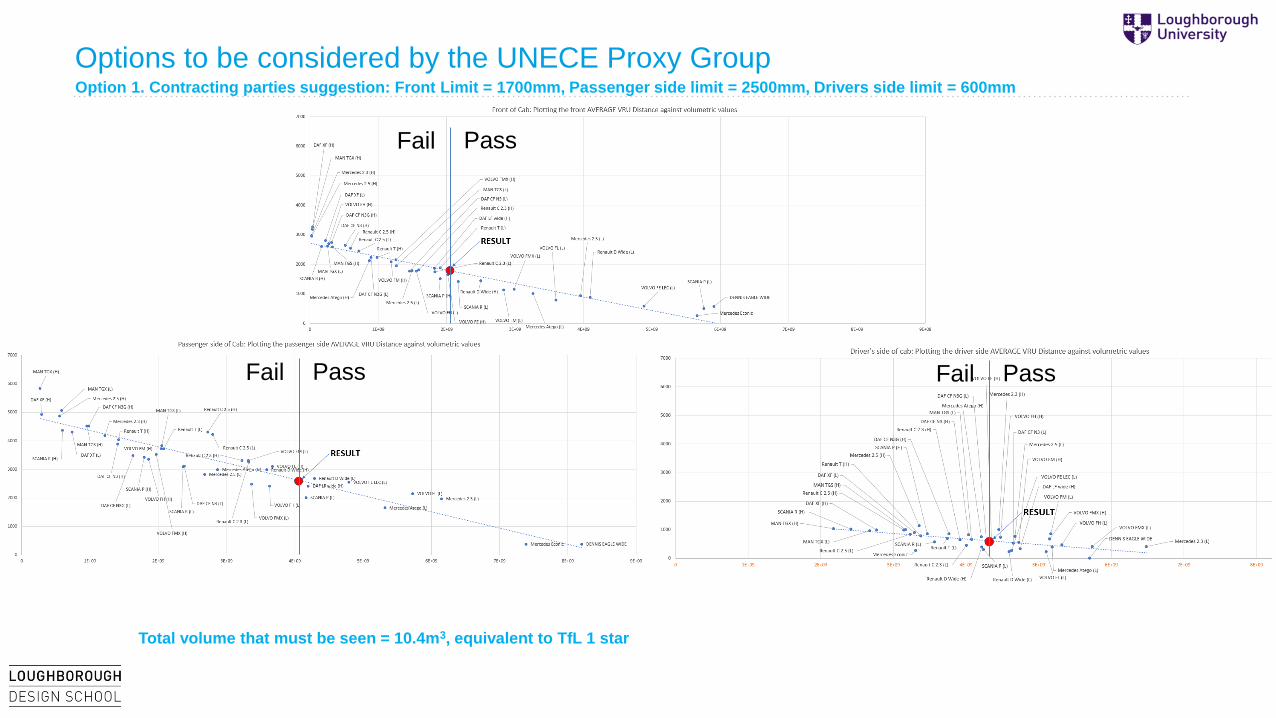
Options to be considered by the UNECE Proxy GroupOption 1. Contracting parties suggestion: Front Limit = 1700mm, Passenger side limit = 2500mm, Drivers side limit = 600mm
Fail Pass
Fail Pass
Fail PassFail Pass
Total volume that must be seen = 10.4m3, equivalent to TfL 1 star
Looking out for vulnerable road users
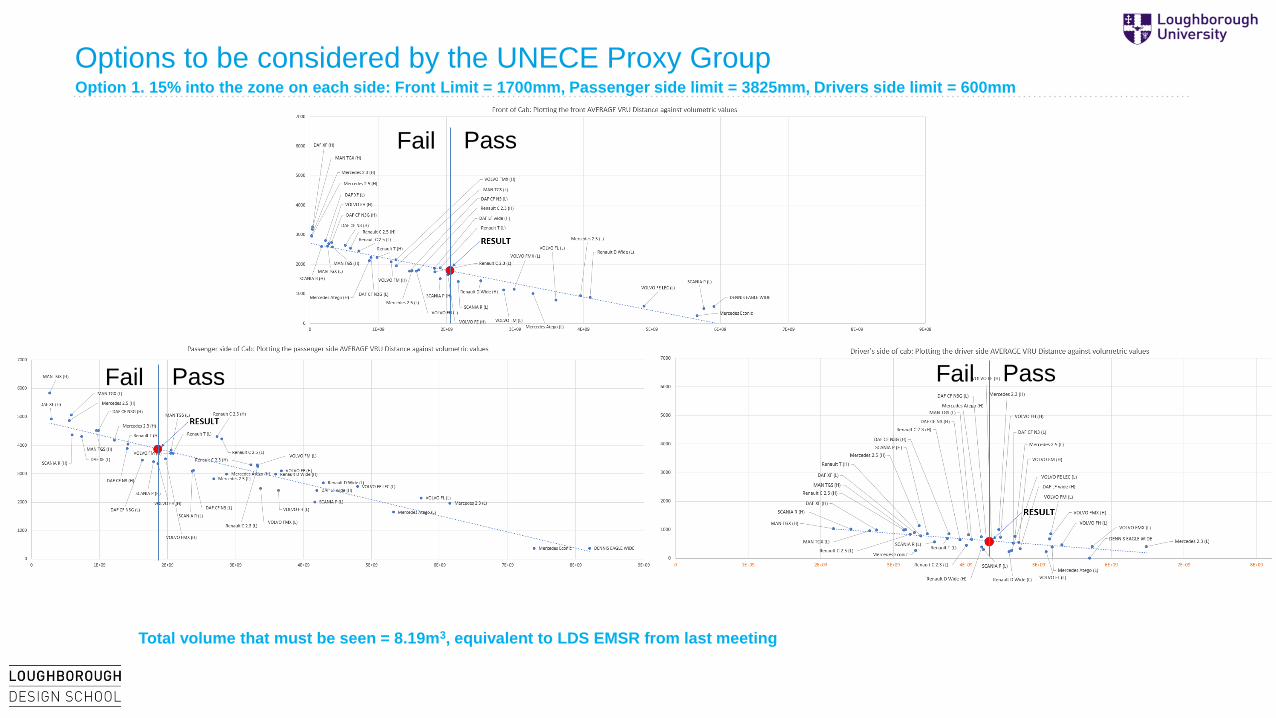
Options to be considered by the UNECE Proxy GroupOption 1. 15% into the zone on each side: Front Limit = 1700mm, Passenger side limit = 3825mm, Drivers side limit = 600mm
Fail Pass
Fail Pass
Fail PassFail Pass
Total volume that must be seen = 8.19m3, equivalent to LDS EMSR from last meeting

Looking out for vulnerable road users
Options to be considered by the UNECE Proxy GroupOption 1. 30% into the zone on each side: Front Limit = 1400mm, Passenger side limit = 3150mm, Drivers side limit = 600mm
Fail Pass
Fail Pass
Fail PassFail Pass
Total volume that must be seen = 9.91m3

Looking out for vulnerable road users
• We are happy to run this spreadsheet live if you would like to suggest other limits to
see the effect

Looking out for vulnerable road users
Which method is appropriate?
It is our view that the separated approach should be using limits that are closer to the side of the vehicle than 4500mm
average VRU distance for the passenger side to determine the minimum volumetric score.
What evidence do we have for how well mirrors are adjusted to be able to meet the minimum requirements for UNECE regulation
46?
Our own work in 2015 highlighted that if the mirrors are setup perfectly for a taller driver, that these mirrors would then need to be
adjusted for a smaller driver to ensure that blind spots are removed. Our own discussions with fleet operators highlighted that
mirrors are not always adjusted during a handover of the same vehicle between two drivers.

Looking out for vulnerable road users
Task 4: Explore the effect of removing mirrors and windscreen wipers.
• We have removed the mirrors and wipers (on the premise that they can be designed to have a resting position below the windscreen) for 14
vehicles across the range of the full sample
• The following results show how this can improve the rating of a vehicle

Looking out for vulnerable road users
Showing effects of removing mirrors and wipers on the star rating
Dennis Eagle, 5star
Volvo Fl (L) improves from 3 star to 4 star
Volvo FM (L) improves from 1 star to 4 star
Volvo FH (L) improves from 1 star to 2 star
Merc Atego (L) improves from 2 star to 4 star
Ren C 2.3 (L) improves from EMSR star to 1 star
Ren T (L) improves from Zero star to 1 star
Merc Atego (H) improves from Zero star to EMSR
Volvo FH (H), zero star
Ren T (H), Zero star
DAF CF N3 (H), Zero star
DAF XF (L), Zero star
MAN TGX (L), Zero Star
DAF XF (H), Zero Star
MAN TGX (H), Zero Star
Head only VRU 1 star

Looking out for vulnerable road users
Summary for removing mirrors and lowering wipers where required.
• It is clear that removing mirrors and lowering wipers improves direct vision.
• The biggest improvement is for the Volvo FM (L) which improves from TfL 1 star to TfL 4 star.
• The largest improving effect is found by removing the mirrors, and so it is clearly possible for a vehicle to improve performance to the sides
without improving performance to the front, especially in a case where the wipers are already set below the windscreen.
• Therefore the separate approach is recommended in order to reduce the possibility of vehicles passing the minimum requirement in a
combined approach whilst having a vehicle which does not meet the minimum requirement to the front.

Looking out for vulnerable road users
Final summary
• The analysis of the separated approach highlights that if vehicle designs are to be improved to the passenger side in particular, then the
identification of the minimum volume to that side needs to use a VRU average distance that is less than 4.5m.
• Where the limit should be set needs to be further explored and discussed in the meeting.
• However the separated approach does have advantages and we would recommend it for the identification of volumetric limits.
• The analysis of the situation where mirrors are removed and wipers are mounted below the windscreen line, highlighted that DVS scores can
be significantly improved e.g. the Renault T (L) improves from zero star to 1 star but fails to the front. This improvement would be
predominantly to the sides of the truck, and therefore it is possible for a vehicle to pass to the sides but not the front if this approach was used
for a combined approach.
• Therefore the separated approach is recommended.
• It is our opinion that this analysis highlights that a Differentiated approach to the application of DVS limits to different vehicles types would
improve the effectiveness of the DVS as opposed to a ‘one size fits all’ minimum requirement.