the post-crisis landscape (in 3 snapshots) eduardo levy yeyati utdt & barclays capital
TRANSCRIPT

The post-crisis landscape (in 3 snapshots)Eduardo Levy Yeyati
UTDT & Barclays Capital

The growth outlook

3
Ranking recessions: Big…
Note: GDP gap for past crises estimated using by gap between actual GDP and GDP assuming growth at the potential rate since the beginning of the recession. EM Crisis include Argentina, Brazil, Mexico, Thailand, Korea and Singapore. Source: Haver, Barclays Capital.
-6.0 -6.1
-8.3-7.6
-4.8
-1.8-0.4
-10.5
-3.8
-12.6-14
-12
-10
-8
-6
-4
-2
0
US Euro Japan UK Brazil China India Russia Avg USReces.
Avg EMCrisis
%
Estimated GDP gap (relative to trend) in past crises
Estimated GDP gap (relative to trend) since 2Q08

4
…synchronized…
0.0
0.1
0.2
0.3
0.4
0.5
0.6
0.7
0.8
0.9
1.0
72 75 78 81 84 87 90 93 96 99 02 05 08-10
-5
0
5
10
15
20
25Proportion of countries where GDPcontracted q/ q (LHS)
Global gdp (% q/ q saar, RHS)
Measure of global synchronicity
5
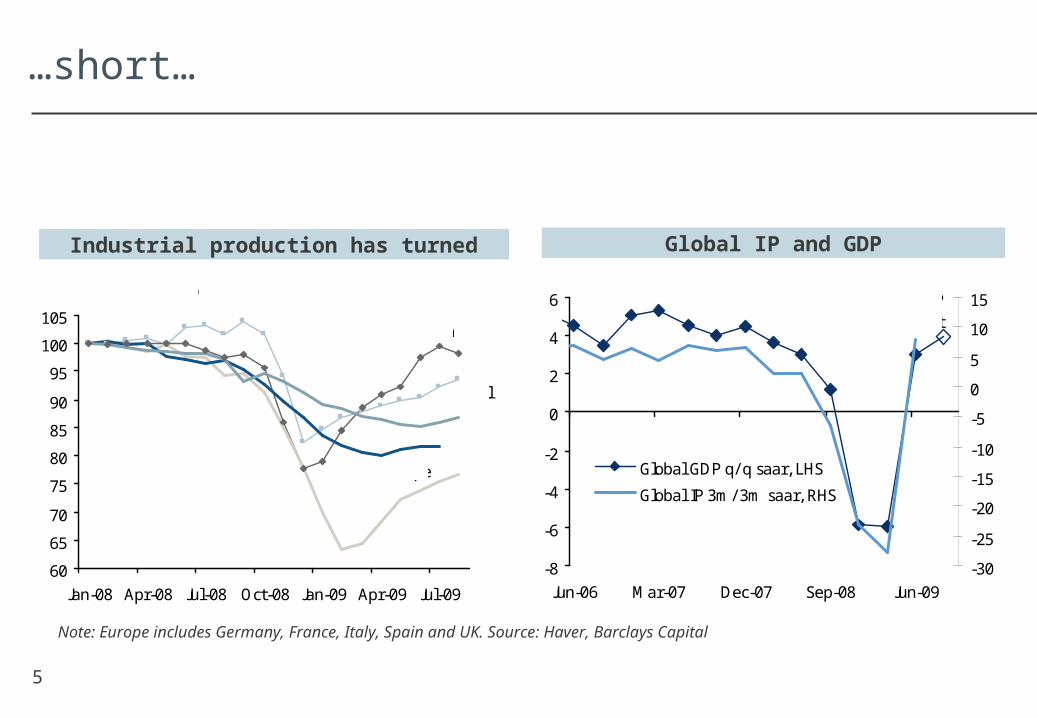
…short…
Note: Europe includes Germany, France, Italy, Spain and UK. Source: Haver, Barclays Capital
Industrial production has turned Global IP and GDP
-8
-6
-4
-2
0
2
4
6
Jun-06 Mar-07 Dec-07 Sep-08 Jun-09
-30
-25
-20
-15
-10
-5
0
5
10
15
Global GDP q/ q saar, LHS
Global IP 3m/ 3m saar, RHS
Q3 GDP forecast
60
65
70
75
80
85
90
95
100
105
Jan-08 Apr-08 Jul-08 Oct-08 Jan-09 Apr-09 Jul-09
Japan
Brazil
Europe
US
Korea
IP index: May 08 = 100

6
…buffered by stimulus (China and the US)
Expected month of end of recession
Jan Feb Mar Apr May Jun Jul Aug Sep Oct Nov Dec Jan Feb Mar Apr
Japan Brazil Germany Chile US Argentina UK S. Africa Russia Hungary Spain
China India France Mexico Canada Turkey Poland
Korea Italy
Indonesia
Taiwan
Australia
2009 2010

777
What next?
• The Lehman panic has been undone by countercyclical policy
• …funded by savings (China, Chile), as well as debt and money printing (US, UK)
• What will be trend growth once the cyclical rebound is over?

8
For now…not impressive
98
102
106
110
114
T-6 T-5 T-4 T-3 T-2 T-1 T T+1 T+2 T+3 T+4 T+5 T+6 T+7 T+8
Quarters After Trough
Index
1957 1974 1981 Current Cycle
9.5
6.1
7.7
2.9
Source: BEA, Haver, Barclays Capital. Note for figure on the right: Typical recovery GDP growth is a weighted average of growth following uncertainty shocks (1/2), the ERM crisis (1/3) and EM crises (1/6). Assumes current crisis in began in 3Q09. Source of typical uncertainty shock recovery comes from Bloom, Nicholas.
-10
-8
-6
-4
-2
0
2
4
6
8
10
1 2 3 4 5 6 7 8 9 10
Typical recovery Developed economies today
GDP grow th (q-o-q saar %)
Dotted line indicates forecasts
US GDP index level after recession trough GDP growth during recoveries from crises

999
What next?
• The Lehman panic has been undone by countercyclical policy
• …funded by savings (China, Chile), as well as debt and money printing (US, UK)
• What will be trend growth once the cyclical rebound is over?
• The cyclical rebound surprised the market; the post-crisis trend is likely tro disappoint
• When will the stimulus be switched off (and what is going to happen then)?
• When will QE be mopped up and interest rates normalize?
• …which bring us to…

The new global balance

Predictable: Rates & USD selloff
Yields The recent evolution of USD

Less predictable: QE and the rates-USD decoupling
Net Supply of riskless US assets (net of Fed purchases) QE behind the summer breakdown of the recovery trade

The CA and the savings drain
CA deficit, and private and public savings
(2002 – today), all as a share of GDP
The impact of the global fiscal stimulus over
global imbalances – the savings “drain”
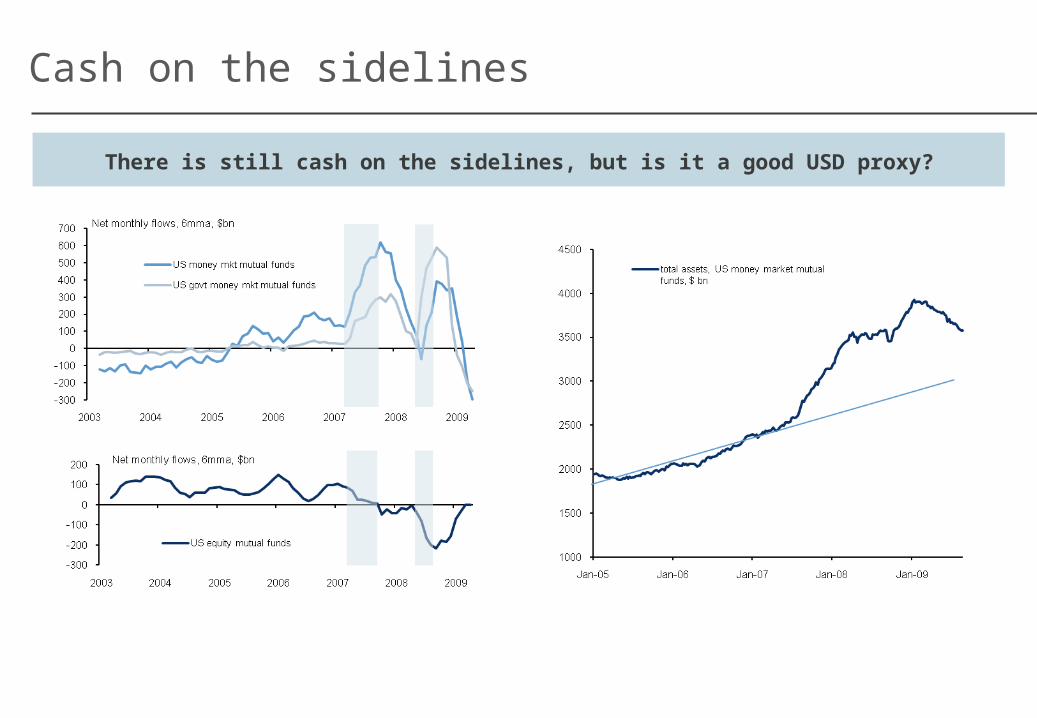
Cash on the sidelines
There is still cash on the sidelines, but is it a good USD proxy?

Why the USD may strengthen in 2010
• Undoing of QE + H2 tightening• The end of cheap funding of risky assets• Fear of asset inflation may trigger tightening before inflation shows its
face
• Growth disappointments down the road• Moderate risk appetite
• The failure of the IMF as ILLR• Good try with the FCL• But no takers (Mexico, Poland, Colombia) and fewer users• Self insurance will continue to be the norm
• UST delivered• Good hedge (even if for circular, self-fulfilling reasons)

Advanced Emerging Markets

Emerging markets: What’s new
• Lessons from the 90s• De-dollarization• De-leverage• Liquidity hoarding• Leaning-against-the-wind exchange rate policy
• Lessons from the 80s• Institutional building• Monetary and fiscal credibility• Ability to conduct countercyclical policies

Leaning against the wind ER policy
Brazil’s Exchange Rate Policy The path of less resistance: EM vs G10
1.2
1.4
1.6
1.8
2.0
2.2
2.4
2.6
Jan-07 Jul-07 Jan-08 Jul-08 Jan-09 Jul-09-400
-200
0
200
400
600
800
CB Intervention in spot market (RHS) BRL
0.80
0.85
0.90
0.95
1.00
1.05
1.10
Aug-08 Mar-09 Aug-09 Sep-09
LatAm REER EMEA REER
Asia REER AUD/ ZAR/ CAD
DXY

The newborn policy autonomy
Policy Rates monthly Policy Rates monthly

Decoupling or growth convergence?
EM and G7 Growth relationship5 year rolling correlation between EM and G7
growth

The couple moves East
Decoupling and Convergence: EM growth as a function of G7 and Chinese growth (y/y quarterly data)
EM medians BR MX ID TR SA
(G7) 0.085 1.569 -0.021 1.217 1.182 2.114 -0.318 0.716 -0.431 1.569 1.137 2.055
0.07 0.01 0.94 0.00 0.00 0.00 0.07 0.23 0.21 0.11 0.04 0.04
(G7_late) 0.229 -1.312 0.25-
1.217 -0.568 -1.62 0.631 -0.532 0.556 -1.768 0.204 -0.859
0.07 0.06 0.28 0.00 0.07 0.00 0.00 0.38 0.14 0.09 0.64 0.39
() 0.327 0.375 0.016 0.113 0.618 0.3
0.00 0.00 0.86 0.41 0.00 0.08
(China_late) 0.151 0.182 0.144 0.149 0.311 0.143
0.06 0.00 0.02 0.15 0.06 0.23
0.012 -0.029 0.012-
0.038 0.002 -0.011 0.028 0.005 0.02 -0.065 0.003 -0.037
0.00 0.01 0.00 0.00 0.48 0.38 0.00 0.63 0.00 0.03 0.52 0.07Observations 67 64 67 64 67 64 48 48 67 64 67 64
R-squared 0.191 0.436 0.037 0.432 0.191 0.222 0.257 0.394 0.02 0.285 0.219 0.274
Note: Median values from country-by-country regressions. p-values in italics. G7 growth computed as the average of individual growth rates weighed by the dollar GDP of the previous year. The EM sample includes: Argetina, Brazil, Chile, Colombia, Mexico, Peru, Honk Kong, India, Indonesia, Malaysia, Philippines, Singapur, Taiwan, Thailand, Czech Republic, Hungary, Poland, Turkey, and South Africa. Source: IMF, Barclays Capital.

The high beta-high alpha pattern also in markets
Developed economies and the New Emerging Markets: An index view

Growth convergence in action
EM Contribution to global growth
Real GDP (% y/ y)
-2.0
-1.0
0.0
1.0
2.0
3.0
4.0
5.0
1980 1984 1988 1992 1996 2000 2004 2008 2012
EM Contribution Non-EM contribution

Growth convergence in action (and in markets)
EM and G7 shares of world GDP EM’s growing Market Share

The glass half empty: Institutions…
Institutional Indicators Macro Risk
-2.00
-1.50
-1.00
-0.50
0.00
0.50
1998 2000 2002 2004 2006 2008
Overall Rating in LatAm Overall Rating in EMEAOverall Rating in Asia
B3/ B-
B2/ B
Ba3/ BB-
Ba2/ BB
Baa3/ BBB-
Baa2/ BBB

…and income
Growth Stats Contagion within EM: No more Russias
EM median G7 medianPeriod Early Late Early Late
Mean 4.20% 3.68% 2.10% 1.20%
Vol. 3.77% 3.17% 1.30% 2.24%
Skew -0.99 -0.64 -0.71 -1.92
Kurtosis 0.60 -0.20 0.68 4.19
Sharpe Ratio 1.16 1.22 1.54 0.68
Poverty headcount (at 2$ PPP)
28% 24% n.a. n.a.
Income share of the lower quintile
6.9% 7.5% 7.6% 7.9% 0
200
400
600
800
1000
1200
1400
1600
Jan-98 Jan-01 Jan-04 Jan-07Emerging Markets Stripped Treasury Spread (bp)
Russian default
Ecuadorian default
Argentine default

The price of risk remains above pre-Lehman levels…
Risk appetite: Spreads over the cycle

…but the relocation to risky assets favors EM
Em Assets fed by the growing risk appetite MM vs EM Equity fund flows
0
20
40
60
80
100
120
140
160
2004 2004 2004 2005 2005 2005 2006 2006 2006 2007 2007 2007 2008 2008 2008 2009 20091.5
2.0
2.5
3.0
3.5
4.0
4.5
EM Asia LatAm EMEA Money Market AUM (USD trn) RHS

Advanced Emerging Markets
• The EM lable is obsolete There is a new “advanced” group of countries, halfway between EM and G10
• No mean reversion Convergence should continue in the next five years• Solved the financial front, the agenda should move towards
income and institutions.
• The post-crisis landscape is bound to accelerate this process.

Thank you