the post-apartheid labour market: 1995 -2004
TRANSCRIPT

The Post-Apartheid Labour Market: 1995 -2004
Morné OosthuizenDevelopment Policy Research Unit
University of Cape [email protected]
De vel op ment Pol icy Re search Unit February 2006Work ing Pa per 06/103 ISBN 1-920055-22-3

Abstract
This paper seeks to investigate some of the changes that have occurred within the SouthAfrican labour market in the post-apartheid era between 1995 and 2004 and some of thechallenges the labour market presents in the attainment of shared growth, updating previous work by Bhorat and Oosthuizen (2004). The two main sources of data are the OctoberHousehold Survey of 1995 and the Labour Force Survey of September 2004. The paper has found that while the unemployment rate has risen over the period, total employment hasincreased, bringing into question the notion of jobless growth. Unemployment, however,continues to be concentrated in specific demographically and geographically definedgroups, most notably rural dwellers, Africans, females, the poorly educated and the youngand, for many, represents a long-term problem. Disturbingly, unemployment has continuedto grow rapidly amongst relatively educated members of the labour force, despite the skillsshortage faced by the country. An individual’s probability of being employed is found todepend on his or her race, gender, age, location and level of education. However, it appearsthat gender plays less of a role in determining the probability of employment in 2004 than in1995, although this is not true of race.
Acknowledgements
The useful comments from numerous individuals on this paper in its various forms aregratefully acknowledged. I am particularly indebted to Haroon Bhorat and Alan Hirsch fortheir advice.
Information about our Working Papers and otherpublished titles are available on our website at:
http://www.commerce.uct.ac.za/dpru/
Development Policy Research Unit
Tel: +27 21 650 5705Fax: +27 21 650 5711

Table of Contents1. Introduction.........................................................................................................................................1
2. The South African Labour Force.........................................................................................................2
2.1 Growth and Employment Trends: Have We Experienced Jobless Growth?..................................2
2.2 The Characteristics of the Labour Force........................................................................................11
2.3 Labour Force Participation............................................................................................................20
3. Employment.......................................................................................................................................22
3.1 Demographic and Locational Characteristics of the Employed.....................................................22
3.2 Sectoral, Occupational and Skills Breakdown of Employment Change..........................................25
3.3 Formal and Informal Sector Employment.......................................................................................34
3.4 Summary.......................................................................................................................................35
4. Unemployment...................................................................................................................................37
4.1 D emographic Characteristics of the Unemployed..........................................................................37
4.2 Household Attachment and the Unemployed................................................................................47
4.2 Summary........................................................................................................................................51
5. A Multivariate Analysis of Employment...........................................................................................53
6. Conclusion.........................................................................................................................................58
References.........................................................................................................................................60
Appendix A.........................................................................................................................................62
Appendix B.........................................................................................................................................63
Appendix C.........................................................................................................................................65

The Post-Apartheid Labour Market: 1995 -2004
1. Introduction
The performance of the South African labour market holds the key in many ways to thesuccess of government strategies aimed at raising incomes and reducing poverty andinequality. These aims, however, cannot be attained via the labour market withoutemployment growth, which in turn requires significant output growth in the broadereconomy. Employment growth has been one of the top items on the national agenda for aconsiderable amount of time, particularly since the country’s first multiracial elections in1994. It is within this context that the Government’s macroeconomic plan, unveiled in 1996,and named “Growth, Employment and Redistribution” (or GEAR) predicted, amongst otherthings, employment growth averaging 270 000 jobs per annum from 1996 to 2000, with 409000 jobs to be created in 2000 alone (National Treasury 1996).
At the same time, numerous significant policy changes aimed at, amongst others, addressing past injustices and neglect and improving competitiveness as the national economy becameincreasingly integrated into the international economy. For a variety of reasons, many ofGEAR’s projections were not realised. In fact, in terms of the labour market, the experience of the second half of the 1990s appears to have fallen short of even the baseline scenariocontained in the GEAR document, which projected a net increase in (non-agricultural formal)employment of slightly more than 100 000 jobs per annum. Thus, despite the fact that theeconomy has been growing and jobs have been created, unemployment, however it isdefined, has continued to rise.
The optimism of the mid-1990s was therefore followed by disappointment, as post-apartheideconomic growth was termed “jobless growth”, and the labour market and policies that affectit have come under increased scrutiny. Recently, there also appears to be a growingemphasis on ensuring that growth is shared. Shared growth entails a process of economicgrowth that is beneficial to all groups in society, which is considered essential for sustaininggrowth through improved ‘buy-in’ from all sectors of society. Thus, while “political elites[foster] growth by encouraging high savings, long term investments, and upgradedorganisation, technology and management”, the process of shared growth requires that“highly visible wealth sharing mechanisms – such as universal primary education, landreform, and free basic health care – [are] put in place to induce non-elites to support thegrowth process” (Page 2004: 13). However, ensuring that the benefits of growth are shared isnot an easy task, particularly where the labour market, which constitutes the primary interface between individuals and households on the one hand and the macroeconomy on the otherhand, suffers from severe distortions, as is the case in South Africa.
This paper’s chief objective is the analysis of some of the changes in the South Africanlabour market in the post-apartheid era and the challenges the labour market presents in thesuccessful attainment of shared growth. Section 2 looks at the labour force, quantifyingemployment, unemployment and thereby the labour force. The first part of the section places employment trends within the context of economic growth, rejecting the jobless growth
1

DPRU Working Paper 06/103 Morné Oosthuizen
characterisation of recent economic performance. The section then describes some of themain characteristics of the labour force and details changes in the labour force participationrates of various groups. In section 3, employment is analysed, with reference specifically tosector, occupation, skills and education, and location, while section 4 focuses on thecharacteristics of the unemployed, as well as the households in which they find themselves.Finally, section 5 presents a multivariate analysis of labour force participation andemployment, using several of the variables used in the descriptive analysis.
2. The South African Labour Force
2.1 Growth and Employment Trends: Have We Experienced Jobless Growth?
The labour market is one of the critical interfaces through which individuals interact with thebroader economy. Furthermore, its performance directly impacts on poverty and inequalityvia employment and incomes. Consequently, good, or poor, economic performance willlargely affect poverty and inequality within a society by impacting on employment. Therelationship between economic performance, specifically economic growth, andemployment, therefore, is a critical relationship to understand, particularly in the context ofthe expectation that economic growth will result in new job opportunities, thereby improvingpoverty and, hopefully, inequality indicators. A weak relationship between economic andemployment performance has important ramifications for the extent to which growth isshared amongst all members of society and for the way in which policy is formulated.
Since 1994, a growing number of economists have pointed to the inability of the South African economy to create meaningful numbers of jobs despite sustained economic growth over theperiod (see, for example, Sellars (2000), Moolman (2003), Altman (2003), and Mahadea(2003)). The general perception is that South Africa’s post-apartheid economic performancehas been characterised by ‘jobless growth’. The term ‘jobless growth’ can be interpreted intwo ways, although generally the distinction is not explicitly made, which representrespectively a very strict and a very broad interpretation of the term. Growth may be joblesswhen the general economy is expanding but the absolute employment level is stagnant orfalling. Alternately, the term may describe a situation where general economic growth isaccompanied by a rising unemployment rate (Altman 2003: 12), although this definition is notoften intended in the current debate.
The evidence from national household survey data does not support the jobless growthargument over the post-apartheid period. In 2000 Rands, GDP totalled R804 billion in 1995and increased by 30.2 per cent to stand at R1 046 billion nine years later (Table 1),
2

The Post-Apartheid Labour Market: 1995 -2004
representing an average rate of economic growth of a respectable 3.0 per cent. This increase is significantly greater than the growth in both the total population (17.2 per cent growth overthe period) and the working-age population (20.9 per cent).1 In 1995, 24.2 million SouthAfricans, representing 61.2 per cent of the total population, were between the ages of 15 and65 years and thus eligible to form part of the labour force. By 2004, this had risen to 29.3million (63 per cent of the population). Employment growth has lagged economic growth,although not by a large margin. Total employment in South Africa grew from 9.5 million to justunder 11.6 million, representing an increase of around 22.4 per cent, equivalent to anaverage annual growth rate of approximately 2.3 per cent. Clearly, therefore, the first (andstrictest) definition of jobless growth is not satisfied in South Africa for the 1995 to 2004period.
The number of broadly unemployed individuals increased by 90.7 per cent between 1995and 2004, from 4.2 million to 8.1 million.2 Over the same period, narrow unemploymentdoubled from 2.0 million to 4.1 million, representing a 103.6 per cent increase in theirnumbers. However, by September 2004, narrow unemployment had begun falling from itspeak of 5.25 million in March 2003 and 4.57 million in September 2003 (Statistics SA 2004b:iii), the latter being a better period with which to compare because of the seasonal variationsinherent in March-September comparisons. The narrow labour force has consequentlyexpanded by just over one-third (36.6 per cent) over the period to 15.8 million people. Broadlabour force growth has been slightly more rapid (43.4 per cent and, by September 2004, the broad labour force included 19.7 million people. The difference between these twodefinitions of the labour force gives rise to the group of people referred to as discouragedworkseekers, who no longer actively seek employment, but who would accept and be able to start employment immediately. The number of discouraged workseekers grew extremelyrapidly, from 2.2 million to 3.9 million, equivalent to an annual growth rate of 6.7 per cent or78.9 per cent over the period.
3
1 This paper uses two nationally representative household surveys conducted by Statistics South Africa. Data for1995 is obtained from the October Household Survey (OHS) of that year. In 2000, the OHS series wasdiscontinued and replaced by the Labour Force Surveys. Consequently, data for 2004 is derived from the LabourForce Survey (LFS) of September 2004. The OHS 1995 surveyed 126 283 individuals in 29 583 households.Using the national population estimates of Census 1996, these individuals and households are weighted torepresent the full estimated population of 38.2 million in 1995. The LFS September 2004 surveyed 109 888individuals in 28 594 households. The national population estimates of Census 2001 are utilised to weight the data to represent the full estimated population of 46.5 million.
2 Two standard definitions of unemployment are utilised, namely the narrow definition of unemployment (used asthe official definition in South Africa by government and Statistics SA) and the broad definition of unemployment.Individuals are narrowly unemployed if they “(a) did not work during the seven days prior to the interview, (b) wantto work and are available to start work within a week of the interview, and (c) have taken active steps to look forwork or to start some form of self-employment in the four weeks prior to the interview” (Statistics SA StatisticalRelease P0210 2002: xv). The expanded (or broad) definition of unemployment does not include criterion (c).

Table 1: The South African Labour Force, 1995 and 2004
Source: OHS 1995, LFS 2004:2 (Statistics SA).
Both narrow and expanded unemployment rates have risen since 1995. The narrowunemployment rate has risen from 17.6 per cent to 26.2 per cent, slightly down from the 31.2per cent and 28.2 per cent of March and September 2003 respectively (Statistics SA2004b: iii), while broad unemployment has increased from 30.8 per cent of the labour force to41.0 per cent, which is also slightly off its September peak in 2003 of 41.8 per cent. Both ofthese increases in the unemployment rate, as indicated in greater detail in section , are highlystatistically significant, although it is apparent that the unemployment rate has at leaststabilised, if not improved. It is clear, therefore, that the South African economy continues toface an important challenge in terms of job creation. If one uses the second, very broaddefinition of jobless growth, then the existence of jobless growth in post-apartheid SouthAfrica can not be disputed.
Returning to the strict definition of jobless growth, which is also the most commonly useddefinition, national household data clearly refutes the jobless growth argument. In the contextof economic growth averaging 3.0 per cent per annum over the period and given the fact thataverage annual employment growth has outpaced population growth and the growth in theworking-age population, it appears that the rising unemployment rates are resulting fromsome other trend. In fact, it is the high rate of growth of the labour force vis-à-vis employmentthat has resulted in rising unemployment rates. The labour force, however it is defined, hasbeen growing at a rapid pace that will see it double every 19 years or so. At the same time,employment growth has averaged around 2.3 per cent per annum. It is this gap betweenemployment growth and labour force growth that is largely responsible for the rapidly risingnumbers of unemployed individuals.
Employment growth since 1995, therefore, should be seen in a more positive light than isgenerally the case. It does not lag economic growth by too large a margin and it hasoutstripped growth in both the population and the working-age population. The
DPRU Working Paper 06/103 Morné Oosthuizen
4
Total Change1995 2004Absolute Percentage
Real GDP (R million, 2000 prices) 803 713 1 046 087 242 374 30.2Population (000s ) 39 725 46 545 6 820 17.215-65 year olds (000s) 24 231 29 305 5 074 20.9Employed (000s) 9 515 11 643 2 128 22.4Narrow Unemployed (000s) 2 032 4 135 2 104 103.6Broad Unemployed (000s) 4 239 8 083 3 845 90.7Narrow Labour Force (000s) 11 547 15 778 4 232 36.6Broad Labour Force (000s) 13 754 19 726 5 972 43.4Narrow Unemployment Rate (%) 17.6 26.2 8.6 -Broad Unemployment Rate (%) 30.8 41.0 10.2 -Discouraged Workseekers ('000s) 2 207 3 948 1 741 78.9

The Post-Apartheid Labour Market: 1995 -2004
unemployment problem is linked to rapid labour force growth, which has its roots in increasedlabour force participation, indicating that when the growth in participation slows (as itinevitably must, since it cannot exceed complete participation), it will become easier to makeinroads into the pool of the unemployed, ceteris paribus. In order to address the issue of rising rates of unemployment, it is important to look at the various factors that drive the labour forceparticipation decision, an issue that deserves further attention.
The relationship between output and employment, referred to as the output-employmentelasticity, is determined through the econometric estimation of a labour demand equation3,which can be derived at various levels such as nationally or sectorally. One of the mostrecent cross-sectoral employment elasticity studies in South Africa is that of Fields et al.(2000). The authors, in standard fashion, estimate an equation of the form:
where L is employment, w the wage rate, r the user cost of capital and Q output – all
represented at time t. The output-employment elasticity is represented by the value of the
coefficient β3 . The authors’ underlying data, details of which are provided in the paper,
cover non-agricultural formal employment.
Table 2 : Output-Employment Elasticity Estimates, Non-Agricultural Formal Employment (1980-1998)
Source: Fields et al. (2000Notes: 1. A.A refers to the fact that this equation was estimated with an autocorrelation
adjustment.** Significant at the 1 per cent level.
5
ttttt QrwL εββββ ++++= lnlnlnln 321
Category 1980-89 1990-98Aggregate 0.53 ** -0.06Aggregate with A.A 0.29 ** -0.20Public Sector 0.47 ** 0.47Private Sector 0.36 ** 0.44
3 See Hammermesh (1993) for a more detailed theoretical background to the theory of labour demand and anoverview of international estimates of these elasticities.

What is immediately evident from the estimates is that while a high level of significance wasachieved for the elasticities in the 1980-89 period, all coefficients for the 1990-98 periodwere insignificant. We cannot therefore, strictly speaking, say anything with confidenceabout the relationship between output and employment in at least part of the post-apartheidperiod. The results for the 1980s suggest that for the economy as a whole a one per centincrease in output was associated with a 0.29 per cent increase in employment. Thecoefficient is positive and significant, irrespective of the cut on the data and the econometrictechnique utilised. Importantly, however, the elasticity estimates across all the equationsestimated by the authors are not significantly different from zero. In the context of thisdiscussion, the ‘jobless growth’ argument rests on the assumption firstly that theoutput-employment elasticity is negative and significantly different from zero. On both thesecounts, irrespective of the period under consideration, it is clear that this assumption isincorrect.
While aggregate employment growth may seem relatively lacklustre, this is not necessarilytrue on a sectoral level. For example, Fedderke and Mariotti (2002) calculate labourdemand function for 28 three-digit SIC version five manufacturing sectors over the period1970-1997, expressing employment as a function of the real wage, the user cost of capitaland output. The output elasticity of employment in these sectors was found to be around one (see Table 3), indicating that a one per cent rise in output was associated with employmentgrowth of approximately one per cent ceteris paribus, leading the authors to point out that“[it] cannot, therefore, be claimed that South African manufacturing growth is jobless”(Fedderke & Mariotti 2002: 861).
DPRU Working Paper 06/103 Morné Oosthuizen
6

Table 3: Selected Output-Employment Elasticities
Note: * Assumes 5 per cent depreciation on capital.** Assumes 10 per cent depreciation on capital.
What is clear from much of the previous work on aggregate output-employment elasticities is that they are less than one. This means that greater output is being produced by eachworker. Moolman (2003) finds evidence of capital deepening in large sections of theeconomy with the coefficients of output in her estimated total employment equations oftenbeing less than one. Thus, increases in output result in less than proportional increases inemployment and consequent decreases in the employment-output ratio over time (Moolman 2003: 23).
The jobless growth argument essentially derives from the familiar graph presented inFigure 1, illustrating the movement of indices of real GDP and non-Agricultural formalemployment from 1967 to 2002. From the start of the series until the early 1990s,employment has tracked the movement of real GDP relatively closely. Output growth wasassociated with employment growth, while economic recessions saw stagnant or fallinglevels of employment. The economic recession of the early 1990s saw a sharp decline innon-Agricultural formal employment. Whereas prior to 1990, economic upswings wereaccompanied by rising employment levels, the economic expansion that occurred from themid-1990s was not. Instead, employment continued its downward trend throughout thedecade, falling by more than 12 per cent between 1994 and 2002, leaving non-Agriculturalformal sector employment almost one-fifth lower in 2002 than its 1989 peak.
The Post-Apartheid Labour Market: 1995 -2004
7
Study Period Sectors Elasticity
28 manufacturing sectors * 0.857Fedderke & Mariotti (2002) 1970-97
28 manufacturing sectors ** 1.002
Coal Mining 0.64
Food, Beverage and Tobacco 0.43
Apparel 0.37
Motor Vehicles, Parts & Accessories 0.70
Finance and Insurance 0.62
Business Services 1.89
Moolman (2003) 1970-2001
Medical, Dental & Veterinary Services 0.31

Figure 1: Non-Agricultural Formal Employment and Real GDP, 1967-2002
Source: Own calculations using SARB Quarterly Bulletins.Note: 1. The employment indices published in the SARB Quarterly Bulletins are based on Statistics SA data from two
sets of surveys: the Manpower Surveys and the Surveys of Employment and Earnings (from 1998 onwards).
Space does not allow for the estimation of formal output-employment elasticities. Instead,without recourse to any formal modelling framework, ‘simple elasticity’ estimates thatdescribe the relationship between output and employment since 1970 are presented.4 Thefigures in Table 4 are directly derived from the trends in Figure 1. They indicate firstly, thatprior to 1990, output expansion was accompanied by employment growth. Thus, between1970 and 1980, a one per cent increase in real GDP was associated with a 0.76 per centincrease in employment. For the 1980-1990 period, employment grew at half the rate ofoutput (0.49 per cent for each one per cent expansion in output). Graphically, thiscorresponds with the broadly similar movements of GDP and non-Agricultural formalemployment. In contrast, the figures for the period after 1990 are negative: between 1990and 1996 it was -0.55 and for the 1996-2002 period it fell further to -1.29. The latter estimate
DPRU Working Paper 06/103 Morné Oosthuizen
8
50.0
60.0
70.0
80.0
90.0
100.0
110.0
120.0
130.0
EmploymentGDP
4 Of course, formal modelling is required to control for the variety of different variables that may impact on therelationship between output and employment. Consequently, the numbers presented are not output-employmentelasticities.

implies that for every one per cent growth in real GDP, non-Agricultural formal employmentfell by 1.3 per cent.
Table 4: Simple GDP ‘Elasticity’ of Non-Agricultural Formal Employment
Source: Loots (1998: 330) and own calculations (for 1996-2002) using SARB Quarterly Bulletins.Notes: 1. The ratio of employment growth to GDP growth presented in the final column is not a true output elasticity of
employment.
Figure 1 and Table 4 represent the central ‘evidence’ for jobless growth. Econometric studies, as mentioned earlier, have however not found supportive evidence once various otherfactors have been accounted for. Further, the underlying employment data renders theconclusion of jobless growth problematic. These problems lie not in the deductions made onthe basis of the data presented, but rather more in the coverage and reliability of theunderlying data.5
It is possible, though, to construct a picture of total employment in the South Africaneconomy between 1995 and 2004 using the October Household Surveys and the recentLabour Force Surveys, conducted by Statistics SA. By sampling households, these surveysare able to provide a better picture of total employment than surveys, such as the Survey ofEmployment and Earnings (SEE), that sample firms. These figures, in the first instanceprovide a contrasting overview of employment shifts in the post-apartheid period. Hence, forthe period October 1995 to September 2004, which utilises the October Household Surveyfor 1995 and the Labour Force Survey for the 2004 estimates, these figures reveal that
The Post-Apartheid Labour Market: 1995 -2004
9
Annual Percentage Change in:
Formal Employment GDP
1970-1980 2.75 3.6 0.761980-1990 0.98 2.0 0.491990-1996 -0.55 1.0 -0.551996-2002 -1.90 2.5 -1.29
Annual Percentage Change in:
Formal Employment GDP
1970-1980 2.75 3.6 0.761980-1990 0.98 2.0 0.491990-1996 -0.55 1.0 -0.551996-2002 -1.90 2.5 -1.29
GDP
Employment∆
∆
5 Oosthuizen and Bhorat (forthcoming) expose a variety of problems with the employment data presented inFigure 1 that render the conclusion of jobless growth unsound.
! The real GDP data represents total output of the South African economy, while the employment data explicitly excludes the Agriculture sector, the country’s fourth biggest employment sector, as well as the informal sector.
! The Survey of Employment and Earnings (SEE) data, which forms the basis of the official employment series, omits a large number of sectors and these omissions can vary from survey to survey. The surveyexplicitly ignores small firms, while being unable to properly capture employment in newly establishedfirms, resulting in relatively poor SMME coverage.

aggregate employment has increased from 9.56 million in 1995 to 11.64 million in 2004,translating into a growth in employment of 22.4 per cent over the period. This is of coursestarkly contradictory to the SEE figures shown above, and indeed begins to seriouslyquestion the notion of jobless growth. Using these total employment figures to calculate theGDP elasticity of total employment, a very different picture therefore emerges (Table 5).
Table 5: Simple GDP ‘Elasticity’ of Total Employment
Source: Loots (1998: 331) for 1990-1995 figures. For 1995-2002 figures, own calculations using SARB Quarterly Bulletins, Statistics SA (2000, 2002), and Bhorat (2003a).
Notes: 1. The ratio of employment growth to GDP growth presented in the final column is not a true output elasticity of employment.
According to the household survey figures, it appears that total employment has grown by an average of 2.3 per cent per annum, which, as mentioned earlier, is relatively close to the rateof economic expansion. Consequently, the simple ‘output elasticity of total employment’ forthe period 1995 to 2004 is 0.76, indicating that for every one per cent of GDP growth, totalemployment increased by 0.76 per cent. This stands in sharp contrast to the elasticity of-0.64 for formal employment between 1995 and 2002.6 This 1995-2004 ‘elasticity’ is alsosignificantly higher than the 1990-1995 ‘elasticity’ calculated by Loots (1998). This is not tosay that the South African economy is coping well in terms of absorbing new labour marketentrants into employment and these figures should not be used to lighten the severity of theunemployment problem in South Africa.
In summary, therefore, economic growth in South Africa over the post-apartheid period wasnot jobless. According to household survey data, which is more comprehensive andarguably better able to capture employment than the surveys underlying the‘Non-Agricultural Formal Employment’ data series, total employment in South Africaexpanded by 2.3 per cent per annum on average. Instead of being simply a problem of poor
DPRU Working Paper 06/103 Morné Oosthuizen
10
GDPEmployment
∆∆
0.761995-2004
0.161990-1995
GDPTotal Employment
Annual Percentage Change in:
3.02.27
0.80.13
6 For 1995 to 2002, the relevant household survey-based ‘elasticity’ is 0.81.

The Post-Apartheid Labour Market: 1995 -2004
labour absorptive capacity of economic growth, it appears that the rising rates of both narrowand broad unemployment may have more to do with the rapid increase in labour forceparticipation, i.e. the proportion of the working-age population that is a member of the labourforce, that has occurred across gender and race groups. Hoping not to pre-empt lateranalysis, the following simplistic example attempts to put the rapid increase in labour forceparticipation into perspective. In 2004, 67.3 per cent of the working-age population was in thelabour force, compared to 56.8 per cent in 1995. If broad labour force participation hadremained at 56.8 per cent in 2004, the broad labour force would have numbered 16.6 millioninstead of 19.7 million, the broadly unemployed would have numbered five million instead ofeight million, the broad unemployment rate would have been approximately 30 per cent asopposed to 41 per cent, and the economy’s employment performance would have beenviewed in a more positive light. This issue is investigated in greater detail in section 2.3 below.
2.2 The Characteristics of the Labour Force
The composition of the broad labour force is presented in Table 6.7 As mentioned above, thebroad South African labour force grew by some 6.0 million individuals between 1995 and2004. The labour force is dominated by African individuals (more than 75 per cent in 2004),with Whites accounting for around 11 per cent in 2004, down from 14.4 per cent in 1995. Theirdominance within the labour force and faster rate of entry into the labour force means thatAfricans account for over 87 per cent of the increase in the size of the labour force over theperiod. By 2004, the labour force was almost evenly split between males and females (52.0per cent vs. 48.0 per cent). The increasing share of women in the labour force, often referredto as ‘labour force feminisation’, was identified by Casale and Posel (2002: 164), whoestimated the 1999 female share of the broad labour force at 48.2 per cent based on OHS1999. This rise in the female share of the labour force is due to a very rapid rise in the femalelabour force participation rate and means that females account for more than 55 per cent ofthe net increase in the labour force. This pattern is in evidence within all race groups.
11
7 Although the narrow definition of unemployment is the official definition, there is a strong argument that indeveloping countries such as South Africa it is more appropriate to use the expanded definition of unemployment.Thus, although details of narrow unemployment are provided, most of the analysis that follows will use theexpanded definition.

Table 6: Snapshot of the South African Labour Force (Broadly Defined), 1995 and 2004
Source: OHS 1995, LFS 2004:2 (Statistics SA).
The bulk of the labour force, around three out of five labour force members, are between theages of 25 and 44 years, with the proportion in 2004 of 58.6 per cent slightly lower than thatof 1995. This change is related to the increase in the proportion of labour force members inthe 15 to 24 year age-group, which accounted for 27.7 per cent of labour force growth overthe period. The two youngest age-groups accounted for most of the growth in the labourforce (around 63 per cent), with the two oldest age-groups managing to hold their ground, ifnot slightly increasing their share of the labour force. Consequently, the share of the labourforce accounted for by 34 to 44 year olds fell to under 23 per cent.
It appears that the South African labour force is slowly becoming more educated on average.The proportion of individuals with completed secondary education rose from 20.9 per cent in1995 to 26.2 per cent in 2004, while completely uneducated individuals now account forunder six per cent of the labour force, compared to 8.6 per cent in 1995, having also declinedin absolute terms. However, the increase in the number of tertiary educated labour forcemembers has been unable to keep pace with the rate of total labour force growth, while 12.7per cent of the net increase in the labour force is comprised of individuals with complete orincomplete primary education. Those with incomplete and complete secondary educationaccounted for almost 70 per cent of the growth in the labour force, compared to their 1995share of the labour force of 54.1 per cent.
DPRU Working Paper 06/103 Morné Oosthuizen
12
1995 2004 Change000s> Share 000s> Share 000s> Share
TOTAL 13 754 100.0 19 726 100.0 5 972 100.0African 9 875 71.8 15 096 76.5 5 221 87.4Coloured 1 485 10.8 1 866 9.5 380 6.4Asian 417 3.0 529 2.7 113 1.9
By Race...
White 1 976 14.4 2 198 11.1 221 3.7Male 7 598 55.2 10 250 52.0 2 651 44.4By
Gender... Female 6 155 44.8 9 466 48.0 3 310 55.415-24 years 2 403 17.5 4 060 20.6 1 657 27.725-34 years 4 977 36.2 7 064 35.8 2 086 34.935-44 years 3 670 26.7 4 498 22.8 828 13.945-54 years 1 941 14.1 2 916 14.8 975 16.3
By Age...
55-65 years 762 5.5 1 188 6.0 426 7.1No education 1 182 8.6 1 062 5.4 -120 -2.0Incomplete Primary 2 441 17.8 2 876 14.6 435 7.3Complete Primary 1 017 7.4 1 342 6.8 325 5.4Incomplete Secondary 4 573 33.2 7 019 35.6 2 446 41.0Complete Secondary 2 873 20.9 5 159 26.2 2 286 38.3Tertiary 1 430 10.4 1 959 9.9 529 8.9
ByEducationLevel...
Other/Unknown 237 1.7 308 1.6 71 1.2

The majority of the labour force is located in urban areas, with only 36 per cent in rural areasin 2003. Unfortunately, the LFSs are no longer published with the definitionally problematicurban/rural classification and therefore comparable figures for 2004 are not available. Theproportion of the labour force in rural areas remained relatively constant between 1995 and2003, an interesting fact given the continued urbanisation of rural jobseekers over the period.This phenomenon is likely to be linked to the increased labour force participation of females.In fact, rural African females account for almost one-quarter of the increase in the labour force between 1995 and 2002, although it is impossible to determine this group’s full contributiondue to migration to urban areas.
In summary, therefore, the surveys indicate that growth in the labour force during thepost-apartheid era can be broadly ascribed to predominantly African new job-seekers whoare increasingly female, living in urban areas with some level of secondary education (eitherincomplete or matric) and, in the main, under the age of 35 years.
The trends presented above are not independent of race and therefore sometimes verydifferent patterns can be observed within race groups. Table 7 presents the age andeducation breakdowns for African and White individuals.8 The gender breakdowns for thefour race groups are very similar with females accounting for around 55 per cent of thegrowth in the labour force, and are therefore not included here.
Population growth rate differences amongst the race groups have resulted in markeddifferences in the age structure of the labour force and in the contribution of differentage-groups to labour force growth. The bulk of the African and White labour force is between the ages of 25 and 44 years. The major difference between these two groups lies in theage-groups responsible for labour force growth. Amongst Africans, more than one-third oflabour force growth occurred in the 25 to 34 year age-group, with a further 31.1 per centoccurring amongst 15 to 24 year olds. The three youngest age-groups account for over 79per cent of African labour force growth. The falling proportion of 35 to 44 year olds in thelabour force seen earlier is evident amongst Africans: although this group accounted for 27per cent of the labour force in 1995, it accounted for a mere 12.5 per cent of labour forcegrowth up to 2004. In contrast, the bulk of net White labour force growth occurred in the older age-groups: 44 per cent in the 55 to 65 year age-group and 25 per cent in the 45 to 54 yearage-group. Interestingly, though, 25 to 34 year olds accounted for 39 per cent of labour forcegrowth, which is in stark contrast to the 15 to 24 year age-group, whose share of the labourforce shrank. This could partly be due to the declining birth rate amongst Whites and, when
The Post-Apartheid Labour Market: 1995 -2004
13
8 The full table for African, Coloured, Asian and White individuals and including the gender breakdown can be foundin Appendix A.

seen in the context of the growth of the 25 to 34 year age-group, possibly partly due to youngindividuals continuing with their education longer than in 1995.
Table 7: Snapshot of the SA Labour Force (Broadly Defined) by Race, 1995 and 2004
Source: OHS 1995, LFS 2004:2 (Statistics SA).
The validity of the latter possibility is confirmed by the fact that tertiary educated individualsaccounted for almost 85 per cent of net White labour force growth over the period, with thosewith completed secondary education accounting for nearly two-thirds. This was balancedout by a sharp decline in the number of White labour force participants with incompletesecondary education. This meant that by 2004, over 83 per cent of the White labour forcepossessed either complete secondary (47.3 per cent) or tertiary (35.8 per cent) education.African labour force growth, in contrast, derived largely from the rapid increase in thenumber of African labour force participants with incomplete and complete secondaryeducation (with growth shares of 46.2 per cent and 34.0 per cent respectively). Only 28.6 per cent of African labour force members had completed secondary or tertiary education, withthe proportion of tertiary educated individuals falling marginally to 6.4 per cent of the Africanlabour force.
DPRU Working Paper 06/103 Morné Oosthuizen
14
1995 2004 Change
000s>Share of
RaceTotal
000s>Share of
RaceTotal
000s>Share of
RaceTotal
By Race and Age-group...15-24 years 1 628 16.5 3 251 21.5 1 624 31.125-34 years 3 728 37.8 5 587 37.0 1 859 35.635-44 years 2 678 27.1 3 332 22.1 654 12.545-54 years 1 317 13.3 2 091 13.8 773 14.8
African
55-65 years 524 5.3 835 5.5 311 6.015-24 years 312 15.8 249 11.3 -63 -28.525-34 years 576 29.2 663 30.2 86 39.035-44 years 541 27.4 585 26.6 45 20.245-54 years 388 19.6 444 20.2 56 25.2
White
55-65 years 159 8.0 256 11.7 97 44.0By Race and Education...
No education 1 087 11.0 999 6.6 -88 -1.7Incomplete Primary 2 133 21.6 2 628 17.4 495 9.5Complete Primary 844 8.5 1 163 7.7 319 6.1Incomplete Secondary 3 375 34.2 5 789 38.3 2415 46.2Complete Secondary 1 574 15.9 3 349 22.2 1775 34.0
African
Tertiary 682 6.9 968 6.4 286 5.5No education 1 0.0 2 0.1 1 0.4Incomplete Primary 7 0.3 7 0.3 0 0.0Complete Primary 1 0.1 11 0.5 10 4.5Incomplete Secondary 423 21.4 294 13.4 -130 -58.6Complete Secondary 900 45.6 1 040 47.3 140 63.1
White
Tertiary 599 30.3 787 35.8 188 84.9

By definition, labour force growth translates into a combination of two phenomena, namelyincreased absolute employment and/or increased absolute unemployment. Whileemployment has expanded, it has been unable to keep pace with labour force growth,meaning that the increase in the labour force has largely translated into increasingunemployment. Just over one-third of the net increase in the broad labour force representsexpanded employment, while for the narrow labour force the proportion is slightly more thanone-half. As a consequence, both broad and narrow unemployment rates have increasedsince 1995 (Figure 2). Broad unemployment rose to 41.8 per cent of the labour force in 2002and 2003, from 30.8 per cent in 1995, although it is slightly lower in 2004. The narrowunemployment rate increased from 17.6 per cent in 1995 to 30.5 per cent in 2002, sincewhich it has fallen by more than four percentage points. In absolute numerical terms, narrowunemployment rose to 4.8 million in 2002 and has since declined to 4.1 million, while broadunemployment rose to 8.3 million in 2003.9 Estimates of total employment of individualsbetween the ages of 15 and 65 years have fluctuated within a band of between 10.8 and 11.8 million people since 2000. Once agriculture (commercial, subsistence and small-scale), theinformal sector and domestic workers are excluded, this variability becomes lesspronounced (Statistics SA Statistical Release P0210 2004b: iv). The relative stability inaggregate employment implies that all of the recorded increase in employment over the1995 to 2004 period has occurred between the 1995 OHS and the 2000 LFS. This raisesnumerous questions as to the extent to which the recorded rise in employment over theperiod is due to changes in survey design and quality, as opposed to real employmentincreases (see Oosthuizen and Bhorat (forthcoming) for discussion of this issue). It isimportant that this issue remain in mind when analysing employment change as inferred fromthese surveys later in this paper.
The Post-Apartheid Labour Market: 1995 -2004
15
9 It should be noted that Statistics SA has yet to release weights based on the 2001 Census for the earlier LFSs. The September LFSs of 2003 and 2004 were released with 2001 Census population weights, but the 2000, 2001 and2002 LFSs are weighted with 1996 Census population weights. It is unclear, however, to what degree theseoutdated weights impact on the patterns exhibited in Figure 2.

Figure 2: Employment and Unemployment, 1995-2004
Source: OHS 1995, LFS 2000-2004 (Statistics SA).
The inability of the economy to create jobs at the same pace at which the labour force hasbeen growing is clearly illustrated in Table 8. The table compares employment, broad andnarrow unemployment and the total labour force over the nine years between 1995 and 2004.Growth in unemployment over the period has been rapid, with the rates of broad and narrowunemployment growth exceeding that of employment growth by factors of 4.0 and 4.6respectively, albeit from a relatively smaller base.
DPRU Working Paper 06/103 Morné Oosthuizen
16
0
1000
2000
3000
4000
5000
6000
7000
8000
9000
10000
11000
12000
0.0
4.0
8.0
12.0
16.0
20.0
24.0
28.0
32.0
36.0
40.0
44.0
48.0
Employment 9515 11713 10829 11029 11622 11643
Broad Unemployment 4239 6560 7698 7925 8332 8083
Narrow Unemployment 2032 4082 4525 4837 4571 4135
Broad Unemployment 30.8 35.9 41.6 41.8 41.8 41.0
Narrow Unemployment 17.6 25.8 29.5 30.5 28.2 26.2
OHS '95 LFS Sep '00 LFS Sep '01 LFS Sep '02 LFS Sep '03 LFS Sep '040
1000
2000
3000
4000
5000
6000
7000
8000
9000
10000
11000
12000
0.0
4.0
8.0
12.0
16.0
20.0
24.0
28.0
32.0
36.0
40.0
44.0
48.0
Employment 9515 11713 10829 11029 11622 11643
Broad Unemployment 4239 6560 7698 7925 8332 8083
Narrow Unemployment 2032 4082 4525 4837 4571 4135
Broad Unemployment 30.8 35.9 41.6 41.8 41.8 41.0
Narrow Unemployment 17.6 25.8 29.5 30.5 28.2 26.2
OHS '95 LFS Sep '00 LFS Sep '01 LFS Sep '02 LFS Sep '03 LFS Sep '04

Table 8: Employment and Labour Force Growth, 1995-2004
Source: OHS 1995, LFS 2004:2 (Statistics SA).
Merely comparing growth rates does not always provide a clear impression of employmentperformance and the table also present the target growth rate of employment and theemployment absorption rate for the period (following Bhorat 2003b: 11). The target growthrate (TGR) measures how fast employment would have had to expand in order to providework for all net entrants to the labour market over a given period (say between time t and t +1), and is defined as follows:
where EAPk refers to the economically active population of group k, defined by any givencovariate, and Lk is the number of employed group k individuals. Because this target growthrate captures the growth required to provide employment to only new entrants since 1995, itis independent of the rate or level of unemployment in the base year (1995). Employmentgrowth at the target rate would result in a reduction in the relevant group’s overallunemployment rate.10 The employment absorption rate (EAR) is the ratio between actualemployment growth and the desired or target rate, expressed as a percentage:
The Post-Apartheid Labour Market: 1995 -2004
17
ChangeCategory
1995(Oct)
( 000s)>
2004(Sep)
( 000s)>Absolute( 000s)>
Per cent
TargetGrowth
Rate
EmploymentAbsorption
RateBroad Definition Estimates
Employment 9 515 11 643 2 128 22.4Unemployment (broad) 4 239 8 083 3 845 90.7Labour Force 13 754 19 726 5 972 43.4
62.8 35.6
Official Definition EstimatesEmployment 9 515 11 643 2 128 22.4Unemployment (narrow) 2 032 4 135 2 104 103.6Labour Force 11 547 15 778 4 232 36.6
44.5 50.3
tk
tktkk L
EAPEAPTGR
,
,1, −= +
10 This is because, considering new labour market entrants as a group on their own, if employment grew at the targetgrowth rate, thereby absorbing all new entrants into employment, their unemployment rate would be zero. The fact that, in reality, not all new jobs go to new entrants does not impact on this reduction in the overall unemploymentrate.

DPRU Working Paper 06/103 Morné Oosthuizen
It denotes the proportion of the net increase in the labour force that finds employment. Thehigher the employment absorption rate, the better the actual relative to the desiredemployment performance. An EAR of 100 denotes a situation where the increase in thelabour force is fully accounted for by an increase in employment. An EAR of greater than 100is possible where employment grows more than the labour force in absolute terms, i.e. whereemployment is growing and unemployment falling in numerical terms.
In order for all net entrants to the labour force between 1995 and 2004, employment wouldhave had to increase by almost two-thirds (62.8 per cent), using the broad definition ofunemployment. Using the official definition, employment would have had to grow by 44.5 per cent. In reality, however, actual employment grew at slightly more than one-third (35.6 percent) of the required rate using the broad definition and, using the official definition ofunemployment, the EAR was only 50.3 per cent. These figures again refute the joblessgrowth argument since they indicate that employment has increased and, by extension,more jobs were created over the period than were lost.
However, this aggregated view obscures the varied experiences of groups definedaccording to race, gender and other covariates. In Figure 3, the target and actual rates ofemployment growth, and the resultant employment absorption rates, for groups defined byrace, gender and province are presented. Unsurprisingly, the target growth rates fornon-White workers are relatively high, at 33.1 per cent for Coloureds, 31.3 per cent forAsians and a staggering 85.0 per cent for African individuals. This translates to an annualgrowth rate target of between 3.1 per cent and 7.1 per cent. The target growth rate for Whiteworkers is significantly lower at under 12 per cent. These differences may be traced todemographic differences, specifically the relatively low birth rate amongst Whites comparedto the other race groups during the 1980s, as well as changed labour force participationrates. Actual employment growth has been higher amongst Africans and Asians. However,the interaction between target and actual employment growth means that employmentabsorption has been significantly higher for White individuals at 69.3 per cent. The EARs forAfricans, Coloureds and Asians are 33.1 per cent, 39.7 per cent and 53.0 per centrespectively. Thus, for example, actual employment of Africans has grown at aroundone-third of the target rate. Simply stated, Whites continue to reap relatively more of thebenefits in the post-apartheid era in terms of employment growth than any other group, while African job-seekers seem, still, to be marginalised in this respect.
18
tktk
tktk
tk
tktk
tk
tktk
kEAPEAP
LL
L
EAPEAP
L
LL
EAR,1,
,1,
,
,1,
,
,1,
−−
=−
−
=+
+
+
+

Figure 3: Target and Actual Employment Growth, 1995-2004
Source: OHS 1995, LFS 2004:2 (Statistics SA).Notes: 1. Labour force figures used here are based on the broad definition of unemployment.
The nine years up to the end of 2004 has seen a large increase in the number of femalelabour market participants in South Africa. As a result, the target growth rate to ensure that allfemale net entrants are employed is more than 89 per cent, or 7.3 per cent annually. Incontrast, the target growth rate for male workers is only 45.7 per cent. Employment of womenhas increased more rapidly than that of men, with the former increasing by almost 31 per centover the period. As a result, employment absorption for both males and females is 36.7 percent and 34.7 per cent respectively. However, employment absorption is not similar acrossrace groups within gender groups. A comparison of employment absorption amongst Africanand White males and females reveals a substantial gap in the employment absorption ratesbetween African females and White females (31.3 per cent vs. 82.5 per cent respectively)and between African males and White males (35.4 per cent vs. 52.1 per cent respectively).This means that target and actual employment growth are most closely matched for Whitefemales and least closely matched for African females. The rapid growth in the number offemale labour force participants is evidenced by the target employment growth rate forAfrican females of 122.5 per cent, indicating that employment would have had to more thandouble to accommodate the net increase in the number of African females in the labour force.
The overarching message to be gleaned from these figures is, therefore, that the growth inthe number of jobs has been far outstripped by the expanding labour force. Whileemployment for some groups has grown rapidly relative to the increase in the size of the
The Post-Apartheid Labour Market: 1995 -2004
19
0.0
10.0
20.0
30.0
40.0
50.0
60.0
70.0
80.0
90.0
100.0
110.0
120.0
130.0
TGR 85.0 33.1 31.3 11.9 45.7 89.1 61.4 122.5 8.4 16.6
Actual Growth 28.1 13.2 16.6 8.2 16.8 30.9 21.7 38.3 4.4 13.7
EAR 33.1 39.7 53.0 69.3 36.7 34.7 35.4 31.3 52.1 82.5
African Coloured Asian White Male Female AfricanMale
AfricanFemale
WhiteMale
WhiteFemale

labour force, resulting in relatively high labour absorption rates (specifically, non-Africansand White females in particular), none of the groups investigated experienced actualemployment growth even in the region of the target growth rates. Thus, unemployment rateshave continued to rise for these groups. The fact that the economy has been unable toprovide sufficient employment opportunities for the South African population in the face ofthe rapid increase in labour force participation means that even greater demand for rapidjob-creation will be placed on the economy in the medium-term.
2.3 Labour Force Participation
The initial evidence presented above suggests that an important root of unemployment is the fact that the labour force is growing at a rate in excess of both the working-age population(between the ages of 15 and 65 years) and total employment. In particular, growth in thenumber of labour force members has to a large extent occurred mainly amongst the younger sections of the population. This means that the probability of an individual being a member of the labour force is increasing over time. This overall probability is measured by the labourforce participation rate (LFPR) and is defined as the proportion of labour force memberswithin the total number of individuals between the ages of 15 and 65 years.
Table 9 presents broad labour force participation rates for the South African economy in1995 and 2004 by various demographic and other characteristics. Overall, the proportion ofindividuals between the ages of 15 and 65 years who are members of the broadly definedlabour force rose from 56.8 per cent in 1995 to 67.3 per cent in 2004, with the narrow LFPRincreasing by 6.1 percentage points to 53.8 per cent. In general, labour force participation ishighest amongst White and Coloured adults11 at 70.9 per cent and 69.5 per centrespectively in 2004. Just under 63 per cent of females are labour force members, compared with 72.2 per cent of males. This gap may be overestimated due to the fact that the femaleretirement age is 60 years, five years earlier than that of males. Research has found thatlabour force participation amongst urban dwellers is significantly higher than amongst ruraldwellers (Oosthuizen & Bhorat 2004: 7), although this gap has narrowed substantially since1995. This urban-rural pattern is manifest in the provincial LFPR variations, with provinceswith more urbanised adult populations such as Gauteng and the Western Cape havinghigher LFPRs than those with more predominant rural adult populations. Labour forceparticipation is lowest in the Eastern Cape (59.1 per cent) and Limpopo (61.7 per cent). Asexpected, labour force participation is lowest amongst the youngest and oldest age-groups(in the low 40 per cents in 2004), due respectively to relatively higher rates of attendance of
DPRU Working Paper 06/103 Morné Oosthuizen
20
11 For the sake of convenience, individuals between the ages of 15 and 65 years are referred to as ‘adults’, thosebelow 15 years as ‘children’ and those over 65 years as ‘elderly’.

educational institutions and retirement. In 2004, approximately 54 per cent of 15 to 24 yearolds were attending some type of educational institution, with around 94 per cent of theseindividuals being outside of the labour force. Almost nine in ten 25 to 44 year olds areeconomically active, up from around eight in ten in 1995.
Table 9: Broad Labour Force Participation Rates in South Africa, 1995-2004
Source: OHS 1995, LFS 2004:2 (Statistics SA).
Several groups have seen substantial increases in labour force participation over the period.The key group here is probably African females, whose LFPR increased from 47.0 per cent to 63.1 per cent between 1995 and 2004. The reason why it is regarded as ‘key’ is that theimpact of increased labour force participation amongst this group is evident in groups definedaccording to other characteristics. Adult females accounted for 54 per cent of all rural adultsin 2002 (African adult females alone were 51 per cent of the rural adult population) andconsequently, the rural LFPR increased by almost fourteen percentage points, from 47.6 percent to 61.5 per cent between 1995 and 2002 (Oosthuizen & Bhorat 2004: 9). At the sametime, provinces with more rural adult populations, e.g. Limpopo, Mpumalanga and theEastern Cape experienced the greatest increases in labour force participation. Largeincreases were also found to have occurred amongst the two youngest age-groups, namely15 to 24 year olds and 25 to 34 year olds. Relative to 1995 levels, labour force participationhas increased most rapidly amongst Limpopo adults (equivalent to a 55 per cent increase onthe 1995 LFPR), 15 to 24 year olds (46 per cent), African females (34 per cent), females ingeneral (29 per cent), Eastern Cape adults (25 per cent) and Mpumalanga adults (23 percent).
A significant part of the current unemployment problem derives from the rapid increase in the propensity for individuals to enter the labour force. The enormous task in terms of jobcreation is therefore clearly evident. The economy has to grow at a sufficiently rapid pace todeal with the original deficit in jobs from 1995 as well as the rapid increase in the number of
The Post-Apartheid Labour Market: 1995 -2004
21
Category 1995 2004 Change Category 1995 2004 ChangeAfrican 54.3 66.7 12.4 15-24 years 29.4 42.9 13.6Coloured 65.4 69.5 4.1 25-34 years 77.5 89.6 12.2Asian 58.4 64.3 5.9 35-44 years 79.1 86.1 6.9White 64.6 70.9 6.4 45-54 years 69.9 75.1 5.2Male 65.8 72.2 6.4 55-65 years 34.6 41.6 7.0Female 48.5 62.7 14.2 Western Cape 66.5 72.9 6.4African Male 62.5 70.4 8.0 Eastern Cape 47.3 59.1 11.9African Female 47.0 63.1 16.2 Northern Cape 59.7 66.4 6.7Coloured Male 73.9 74.8 0.9 Free State 62.6 66.8 4.2Coloured Female 57.6 64.8 7.2 KwaZulu-Natal 53.1 62.7 9.6Asian Male 77.9 80.3 2.4 North-West 56.4 66.2 9.8Asian Female 40.2 48.0 7.9 Gauteng 68.7 77.4 8.7White Male 76.3 80.3 4.0 Mpumalanga 54.9 67.7 12.8White Female 53.2 61.6 8.4 Limpopo 39.9 61.7 21.8
Total Broad LFPR 56.8 67.3 10.6 Total Narrow LFPR 47.7 53.8 6.2

labour force members since. Thus, the target is not a stationary one, but continues to move.In order to address the rapidly increasing unemployment rate, it is key for analysts to focuson understanding the reasons underlying the dramatic increase in labour force participationin a relatively short period, particularly in this context in which unemployment has been highand rising for an extended period of time. Unfortunately, these are questions that the LFSsare unable to answer.
3. Employment
3.1 Demographic and Locational Characteristics of the Employed
Generally, the net increase of 2.1 million jobs has been concentrated in certaindemographically and geographically defined groups, as detailed by Table 10. More thanfour-fifths or 1.7 million of these jobs were filled by Africans, which is more or less in line withthe group’s 77 per cent share of the adult (working age) population. At 7.9 million, employedAfricans account for 67.6 per cent of all employed individuals in 2004, with Whitesaccounting for another 2.0 million or 17.3 per cent. Similarly, the net increase in femaleemployment over the period totalled more than 1.1 million jobs, thereby raiding females’share of employment to 41.8 per cent in 2004 from 9.1 per cent nine years earlier.
DPRU Working Paper 06/103 Morné Oosthuizen
22

Table 10: Demographic Characteristics of the Employed, 1995 and 2004
Source: OHS 1995, LFS 2004:2 (Statistics SA).
The bulk of the net increase in employment occurred amongst individuals in the 25 to 34
year and 45 to 54 year age-groups, with both groups recording employment gains inexcess of 650 000 jobs. These two groups represent just over half of the total labour force growth (see Table 6) and 63 per cent of employment growth. The major losers wereindividuals under the age of 25 years who accounted for 27.7 per cent of total labourforce growth between 1995 and 2004, but only 7.6 per cent of employment growth. The
two cohorts over 45 years of age have seen their shares of employment rise substantiallyover the period, from 23.6 per cent to 28.1 per cent. As was seen in the broad labourforce, the 35 to 44 year age-group has seen its share of employment eroded over theperiod from 30.1 per cent to 26.9 per cent. The evidence therefore seems to pointtowards an ageing of the South African workforce, with only the oldest cohorts
experiencing increases in their relative shares of total employment.
The Post-Apartheid Labour Market: 1995 -2004
23
1995 2004 Change000s> Share (%) >000s Share (%) 000s> Share (%)
Total 9 515.0 100.0 11 642.7 100.0 2 127.7 100.0By Race...- African 6 145.3 64.6 7 874.4 67.6 1 729.2 81.3- Coloured 1 147.4 12.1 1 298.4 11.2 151.0 7.1- Asian 359.5 3.8 419.1 3.6 59.6 2.8- White 1 862.8 19.6 2 016.3 17.3 153.5 7.2By Gender...- Male 5 798.4 60.9 6 771.7 58.2 973.2 45.7- Female 3 716.6 39.1 4 865.9 41.8 1 149.3 54.0By Age-Group...- 15 to 24 years 1 126.1 11.8 1 288.5 11.1 162.3 7.6- 25 to 34 years 3 281.0 34.5 3 948.0 33.9 667.0 31.3- 35 to 44 years 2 862.6 30.1 3 133.6 26.9 271.0 12.7- 45 to 54 years 1 589.6 16.7 2 268.9 19.5 679.2 31.9- 55 to 65 years 655.6 6.9 1 003.8 8.6 348.2 16.4By Province...- Western Cape 1 355.5 14.2 1 691.1 14.5 335.7 15.8- Eastern Cape 919.0 9.7 1 277.6 11.0 358.6 16.9- Northern Cape 213.7 2.2 228.8 2.0 15.1 0.7- Free State 753.6 7.9 777.1 6.7 23.4 1.1- KwaZulu-Natal 1 715.7 18.0 2 092.4 18.0 376.7 17.7- North-West 750.6 7.9 834.8 7.2 84.2 4.0- Gauteng 2 639.4 27.7 3 069.5 26.4 430.1 20.2- Mpumalanga 585.4 6.2 788.7 6.8 203.2 9.6- Limpopo 582.0 6.1 882.7 7.6 300.7 14.1By Education Level...- None 772.1 8.1 696.8 6.0 -75.3 -3.5- Incomplete Primary 1 541.3 16.2 1 591.5 13.7 50.1 2.4- Complete Primary 637.5 6.7 739.1 6.3 101.7 4.8- Incomplete Secondary 2 949.8 31.0 3 479.2 29.9 529.3 24.9- Complete Secondary 2 096.8 22.0 3 140.9 27.0 1 044.1 49.1- Tertiary 1 335.7 14.0 1 754.9 15.1 419.3 19.7- Other/Unspecified 181.8 1.9 240.3 2.1 58.5 2.7

Employment remains concentrated in Gauteng, KwaZulu-Natal, the Western Cape and theEastern Cape, which are also the provinces with the largest economies, accounting for 33.0,16.5, 14.5 and 8.1 per cent of GDP respectively in 2003 (Statistics SA 2004a: 19). In 2004,these provinces were home to almost 70 per cent of all employed adults, which very similar tothe 1995 proportion and to these provinces’ 72 per cent contribution to national GDP in 2003.These provinces also accounted for the bulk of employment expansion over the 1995-2004period, a net increase of around 1.5 million jobs, or 71 per cent of the total. This cannot beseparated from the fact that these four provinces were in the top five contributors to economic growth (the top five being Gauteng, KwaZulu-Natal, the Western Cape, Limpopo and theEastern Cape), accounting for more than three-quarters of national economic growth (owncalculations, Statistics SA 2004a). Employment increased at rates slower than the nationalaverage in the Northern Cape, Free State, North-West and Gauteng, which means that theseprovinces have lost ground in terms of national employment shares. It is encouraging thatmuch of the employment growth and some of the most rapid increases have occurred insome of the country’ poorer provinces, although this may, in fact, be more related toimprovements in data quality over the period.
Fewer people with no education at all were employed in 2004 than in 1995. This isarguably due to the changing mix of skills required by employers, as well as the fact thatindividuals that lack any form of education tend to be significantly older than those with
some or other level of education. In 2004, the average adult (aged 15 years or more)without education was aged 56 years, compared to just over 37 years for all adults. Themajority of jobs were created for individuals with complete secondary education (1.0million or 49.1 per cent of net employment growth), and this educational categoryappears poised to overtake incomplete secondary education as the largest educational
category amongst the employed. The increasing share of tertiary educated individuals inemployment (up 1.1 percentage points to 15.1 per cent in 2004) in conjunction with therapid growth amongst individuals with complete secondary education again confirms thestructural shift towards higher skilled labour.
DPRU Working Paper 06/103 Morné Oosthuizen
24

3.2 Sectoral, Occupational and Skills Breakdown of Employment Change
While real GDP growth averaged 3.0 per cent annually for the economy as a whole, theexperiences of the various sectors within the economy were often quite different. Using
real gross value added (GVA) at basic prices as the measure of output, Table 11 presents sectoral economic performance over the post-apartheid period ending in 2004. It is clearthat it is primarily the tertiary sector that has been responsible for that attainment of threeper cent GDP growth over the period. The primary sector grew at an average annual rate
of 1.3 per cent and the secondary sector at 2.2 per cent, compared to 3.7 per cent for thetertiary sector as a whole. As a result, of total output expansion between 1995 and 2004,the tertiary sector accounted for 78 per cent, or almost four-fifths, despite onlyaccounting for 63 per cent of total GVA in 1995. All the main primary and secondarysectors accounted for a smaller proportion of output expansion than their original
proportions of 1995 output.
Table 11: Sectoral Economic Performance (Gross Value Added), 1995-2004
Source: SARB (2005), Statistics SA (2004a).
Within the tertiary sectors, it is clear that Transport and Communication, Finance and InternalTrade were the best performing sectors over the period, each growing GVA in excess of fourper cent per annum and accounting for a massive 70 per cent of total output expansion. Thisis particularly impressive given the fact that these three sectors accounted for only 39 percent of GVA in 1995. Increased output puts upward pressure on labour demand and, hence,increased employment would be a result that is reasonably expected.
The Post-Apartheid Labour Market: 1995 -2004
25
1995(R mil, 2000
prices)
2004(R mil,2000
prices)
ChangeShare of Change
(Percent)
Share of 1995 GVA (Percent)
Total
000s
Total(Percent)
Ave. Ann. Rate
(Percent)Primary 85 417 96 362 10 945 12.8 1.3 4.9 11.7Agric/Forestry/Fishing 20 850 26 926 6 076 29.1 2.9 2.7 2.9Mining/Quarrying 64 567 69 436 4 869 7.5 0.8 2.2 8.9Secondary 181 870 220 302 38 432 21.1 2.2 17.0 25.0Manufacturing 140 877 171 563 30 686 21.8 2.2 13.6 19.3Utilities 20 592 22 521 1 929 9.4 1.0 0.9 2.8Construction 20 401 26 218 5 817 28.5 2.8 2.6 2.8Tertiary 461 113 637 355 176 242 38.2 3.7 78.1 63.3Internal Trade 99 994 145 392 45 398 45.4 4.2 20.1 13.7Transport & Comm. 58 923 103 695 44 772 76.0 6.5 19.8 8.1Finance 125 955 194 093 68 138 54.1 4.9 30.2 17.3Gen. Gov. Services 132 945 135 502 2 557 1.9 0.2 1.1 18.3Personal Services 43 298 58 673 15 375 35.5 3.4 6.8 5.9Total 728 400 954 019 225 619 31.0 3.0 100.0 100.0

This variance in the performance of the different sectors of the economy, because of thediffering implications for labour demand at the sectoral level, holds important implications for the ability of individuals and households to benefit from economic growth and for the extentto which accelerated growth will be shared across all groups. Many individuals andhouseholds are reliant for their survival on a single sector and, as a result, are particularlyvulnerable to poor performance in that sector. Good examples are agriculture and otherresource extraction sectors (the primary sector) where output growth has generally laggedbehind the average. Conversely, individuals and households that are unable to ‘lock’themselves into the tertiary sector through employment may be constrained in their ability toderive direct benefits from the favourable growth performance of these sectors.
The sectoral shift that characterised the output structure of the South African economy fromthe 1970s through the mid-1990s, from primary and secondary activities to tertiary sectoractivities, continued after 1995 until the present. Consequently, as is evident from Figure 4,employment growth since 1995 was unevenly distributed between the various sectors, withmost growth occurring in the tertiary sector. Tertiary sector employment grew by 1.8 million,representing more than 85 per cent of the net increase in employment over the period.
Within the primary sectors, employment has contracted substantially, losing over 360 000jobs or one-fifth of the 1995 total of 1.8 million. Both the Agriculture, Forestry and Fishingsector and the Mining and Quarrying sector have lost jobs, the former losing around 173 000jobs and the latter 188 000 jobs. However, given the difference in the sizes of these twosectors, relative employment contraction has been more severe in the Mining and Quarrying sector at a rate of -4.2 per cent per annum on average as opposed to –1.7 per cent inAgriculture. These trends, though, are continuations of historical trends and not newdevelopments. Secondary sector employment, in contrast, grew by 31.6 per cent over theperiod, equivalent to an average annual rate of 3.3 per cent. This indicates somewhat of arecent turnaround in this sector. Oosthuizen and Bhorat (2004: 13) found that secondarysector employment grew by a total of 16.0 per cent between 1995 and 2002, or 2.1 per centper annum, implying a substantial improvement in the employment performance of thesecondary sectors in the period since. The largest number of jobs was created in theConstruction sector, where employment almost doubled from 446 000 to 824 000, anincrease of around 378 000 jobs. On its own, Construction accounted for 17.8 per cent ofoverall net employment creation over the 1995 to 2004 period. Employment inManufacturing also expanded, by around 277 000 jobs, equivalent to a rate slightly lowerthan the overall growth rate, while there was little change in employment in the Utilitiessector.
DPRU Working Paper 06/103 Morné Oosthuizen
26

Figure 4: Employment Expansion by Sector, 1995-2004
Source: OHS 1995, LFS 2004:2 (Statistics SA).Notes: 1. Mining figures for 1995 adjusted using official Chamber of Mines figures, given the exclusion of hostel
dwellers in the 1995 OHS as in Bhorat (2003a).2. Individuals whose sectors were insufficiently defined or unspecified, or who are classified as working in the Exterior Organisations and Foreign Government sector were omitted.
The bulk of employment expansion between 1995 and 2004 occurred in the tertiary sectors.Together, these sectors added 1.8 million jobs over the period, representing an averageannual rate of growth of 3.1 per cent. Three sectors added jobs at a rate higher than thetertiary sector average, namely Finance, Internal Trade and Private Households (i.e. theDomestic Worker sector). Employment in Finance almost doubled over the period,representing an increase of just under 570 000 jobs, while growth in the Internal Trade sector of 870 000 jobs occurred at a rate of 52 per cent or 4.8 per cent annually. The rapid growth ofemployment of domestic workers between 1995 and 2004 seems contradictory to generalperceptions, possibly in part related to an improvement in the ability of the surveys tocorrectly identify domestic workers. This would be consistent with the decline in employment in Community, Social and Personal Services, of which Private Households would generallyform part. While employment expansion in Finance and Internal Trade was most rapid, these sectors also accounted for a net increase of 1.44 million jobs over the period.
The Post-Apartheid Labour Market: 1995 -2004
27
-400
0
400
800
1200
1600
2000
2400
-40.0
-20.0
0.0
20.0
40.0
60.0
80.0
100.0
Total Change Percentage Change

Employment changes are closely related to the general and sector-specific economicconditions prevalent during a given period. Thus, one would expect that sectors thatexperience favourable economic conditions and increasing output would be more likely tocreate jobs than sectors that face a less favourable set of conditions. In Figure 5, growth inoutput and growth in employment are related sectorally in a manner that better identifiessectors that have performed best in terms of creating employment. Each of the nine majorsectors is represented by a circle in the figure. For each sector, the rate of growth of realgross value added and the rate of sectoral employment growth are used for the co-ordinatesof the centre of the relevant circle. The size of each circle represents the relative size ofemployment in that sector in 1995. Thus a large circle represents a sector employing morepeople than a smaller circle.
The figure can be divided into four quadrants. The upper right quadrant is characterised byboth GVA and employment expansion, while the lower left quadrant will contain sectorswhere both GVA and employment have been in decline. In the lower right quadrant, GVA isgrowing but employment is declining, while the opposite is true of the upper left quadrant.Further, the 45° line divides the figure into two sections. The upper section represents pointswhere employment expansion is more rapid than GVA expansion, while the lower sectionrepresents points where employment expansion has been slower than GVA growth.Naturally, on this line employment growth and GVA growth are identical. The interpretation of these two areas can be extended further and conclusions may be reached regarding thelabour intensity of gross value added and labour productivity. For example, GVA in a sectorabove the 45° line has become more labour intensive over the period, since employment has grown more rapidly than GVA. Put differently, such a sector will have seen GVA per workerdecline over the period. The opposite is true for sectors below the 45° line, which will haveseen a decline in the labour intensity of GVA or a rise in GVA per worker.
Most sectors in the South African economy have experienced growth in both GVA andemployment over the period. Only three sectors saw declining employment between 1995and 2004, namely Agriculture, Forestry and Fishing, Mining and Quarrying and CSPServices, despite the fact that GVA growth across all sectors was positive. At the same time,gross value added per worker has risen in five of the nine sectors. In the Finance, Wholesaleand Retail Trade, Construction and Utilities sectors, GVA per worker has fallen asemployment has grown at a higher rate than has GVA over the period. Interestingly,according to our calculations, GVA per worker has grown fastest in the Mining and Quarrying (72.6 per cent over the period), CSP Services (52.7 per cent) and Transport andCommunication (34.3 per cent) sectors, despite (but also related to) the former two beingsectors that have shed jobs.
DPRU Working Paper 06/103 Morné Oosthuizen
28

Figure 5: Gross Value Added and Employment Growth by Sector, 1995-2004
Source: OHS 1995, LFS 2004:2 (Statistics SA); SARB (2005).Notes: 1. Community, Social and Personal Services include domestic workers in Private Households, and individuals
whose sectors were insufficiently defined or unspecified, or who are classified as working in the Exterior Organisations and Foreign Government sector.2. GVA data is calculated as a three-year moving average of the SARB’s GVA estimates, where possible (for 2004, the value is an average for 2003/2004).
While output expansion or contraction at the sectoral level is an important correlate ofsectoral employment change, what is also relevant in terms of labour demand patterns is theparticular configuration of skills needs that can be identified within each sector. Thisprovides another important layer in understanding the unevenness of employment growth atthe sectoral level. The evidence shows that while different sectors have fared differently inrespect to the relationship between output change and employment change, theseresponses mask significant differences within individual sectors when employment is
The Post-Apartheid Labour Market: 1995 -2004
29
Transport andCommunication
Financial Intermediationetc
Agr/For/Fishing
Utilities
Mining and Quarrying
Construction
Manufacturing
Wholesale and RetailTrade
CSP Services
-7.0
-6.0
-5.0
-4.0
-3.0
-2.0
-1.0
0.0
1.0
2.0
3.0
4.0
5.0
6.0
7.0
8.0
9.0
10.0
-2.0 -1.0 0.0 1.0 2.0 3.0 4.0 5.0 6.0 7.0 8.0 9.0 10.0Average Annual Gross Value Added Growth (%)

divided into skilled, semi-skilled and unskilled employment.12 Appendix B replicatesFigure 5 for the three categories of employment for all the sectors except Mining.13
Of the eight sectors, the experience of several indicates a substitution process wherebylower skilled workers are displaced by more skilled workers. This can occur throughemployment contraction in lower-skilled occupations in the sector or through relativelyslower growth amongst these occupations. For example, Agriculture has seen job losses forunskilled workers, accompanied by rapid employment expansion for semi-skilled and skilled workers. In the Utilities sector, both unskilled and semi-skilled workers have experienced job losses, while skilled employment has expanded. There are sectors, though, that have seenthe opposite trend, with lower skilled workers increasing their share of sectoral employment.Transport and Communication has seen substantially more rapid growth for lower skilledoccupations, as has Internal Trade, Construction and, interestingly, Finance. In the cases ofthe five fastest growing sectors in terms of GVA, namely Manufacturing, Construction,Internal Trade, Finance and Transport and Communication, employment for all three skillsgroupings has expanded. This is an important point to highlight: although sectors may beskills biased, this does not preclude them from creating employment across the skillsspectrum. Overall, however, it is clear that output growth in various sectors over the pastnine years has been accompanied by a continuation of the historical trend of skills-biasedemployment growth.
Table 12 also documents the changing nature of employment by three broad skillscategories at the sectoral level. The national figure reflects a marginal change in the skillsprofile of employment between 1995 and 2004. This stands in contrast to previous analysesof different time periods (see Oosthuizen and Bhorat 2004, for the 1995-2002 period, andBhorat 2003a), which revealed more noticeable differences for the three categories. In 2004, there is a slight increase in the proportion of skilled workers within the employed, from 20 per cent to 22 per cent, with semi-skilled workers accounting for 48 per cent of employment inboth years and unskilled workers seeing their share fall marginally from 31 per cent to30 per cent.
DPRU Working Paper 06/103 Morné Oosthuizen
30
12 Skilled refers to ISOC codes 1-3; Semi-Skilled refers to ISOC codes 4-8; Unskilled refers to ISOC code 9.
13 This exercise is not possible for the Mining and Quarrying sector due to the fact that the OHS 1995 employmentdata for this sector is unreliable.

Table 12: Skills Breakdown of Employment by Sector, 1995 and 2004
Source: OHS 1995, LFS 2004:2 (Statistics SA).Notes: 1. Skilled refers to ISOC codes 1-3; Semi-Skilled refers to ISOC codes 4-8; Unskilled refers to ISOC code 9.
Unspecified occupations were omitted from the analysis.
At the sectoral level, however, the experiences are varied. In Agriculture and Mining andQuarrying, employment shifted significantly in favour of semi-skilled occupations andagainst unskilled occupations. In these sectors, the proportions of semi-skilled workersincreased by 20 and six percentage points respectively, while those of unskilled workersdeclined by 24 and six percentage points. In Manufacturing, Utilities and CSP Services, thepattern was one of skilled jobs displacing semi-skilled jobs and sometimes unskilled jobstoo. In contrast, in the Construction, Internal Trade, Transport and Communication andFinance sectors, unskilled employment grew more rapidly than other types of employment,resulting in an increase in the proportion of unskilled workers in these sectors. InConstruction, the share of unskilled employment rose by four percentage points to 23 percent in 2004, at the cost of the share of semi-skilled employment. In Internal Trade, the share of unskilled employment grew by ten percentage points to 30 per cent, at the cost of theshares of both skilled and semi-skilled employment. In the Finance sector, semi-skilledworkers have seen their share of employment decline in the face of the rising shares ofemployment of both skilled and unskilled workers.
Pressures on the South African stock of skills are likely to continue to mount in the nearfuture, as several of the sectors with the fastest employment expansion (e.g. Finance andConstruction) are also increasing their employment of skilled and/or semi-skilled workersrelative to unskilled workers. Internal Trade, while the third fastest growing sector in terms of
The Post-Apartheid Labour Market: 1995 -2004
31
Year Skilled Semi-Skilled Unskilled Total1995 0.01 0.22 0.77 1.00Agriculture, Hunting, Forestry and
Fishing 2004 0.05 0.42 0.53 1.001995 0.07 0.74 0.18 0.99Mining and Quarrying2004 0.07 0.80 0.12 1.001995 0.12 0.68 0.19 1.00Manufacturing2004 0.17 0.64 0.19 1.001995 0.18 0.67 0.13 0.98Utilities (Electricity, Gas and Water
Supply) 2004 0.39 0.50 0.10 0.991995 0.09 0.71 0.19 1.00Construction2004 0.09 0.68 0.23 1.001995 0.17 0.64 0.20 1.00Internal Trade2004 0.14 0.56 0.30 1.001995 0.26 0.62 0.11 0.99Transport, Storage and
Communication 2004 0.23 0.62 0.14 1.001995 0.38 0.56 0.06 1.00Financial Intermediation, Insurance,
Real Estate and Business Services 2004 0.39 0.50 0.11 1.001995 0.45 0.39 0.15 0.99Community, Social and Personal
Services 2004 0.50 0.35 0.15 1.001995 0.00 0.02 0.97 1.00Private Households2004 0.00 0.00 1.00 1.001995 0.20 0.48 0.31 0.99Total2004 0.22 0.48 0.30 1.00

employment, has seen a rise in the proportion of unskilled workers at the cost of employmentof more highly skilled workers. This highlights the impact that informal sector growth has onaggregate employment data. Since informal vendors are classified as part of the Internal (orWholesale and Retail) Trade sector, informal sector growth has resulted in a deterioration inthe skills profile of this sector. Similarly, the two sectors where total employment has fallenover the period, namely Agriculture and Mining and Quarrying, are cutting unskilled jobs at ahigher rate than skilled and semi-skilled jobs, as is evident from the shift in the skillcomposition of employment.
The above indicates a dual challenge for the domestic economy, in terms of producing anadequate economic growth strategy. Firstly, there is the challenge of sustaining, and raising, the current higher rates of economic growth and output expansion. Secondly, though, itremains likely that the nature of labour uptake as a result of economic growth will continue:namely the disproportionate uptake of semi-skilled and skilled workers, relative to unskilledworkers. This unevenness of growth requires the upgrading of supply characteristics ofthose individuals entering the labour market each year in search of employment.
The skills levels of the employed are largely reflected in breakdowns of employment byindividuals’ level of education (Figure 6). Six educational categories are presented, namelyno education, incomplete primary, completed primary, incomplete secondary, completedsecondary and tertiary education. Here again the apartheid legacy is easily discernible. Whiteworkers are, in general, much better educated on average. In 1995, more than 31 per centhad a tertiary qualification, while a further 46 per cent had completed matric. This meant thatvery few employed Whites have lower levels of education. The profile of White employmenthas also shifted markedly between 1995 and 2004. The proportion of employed Whites withtertiary education grew to 38 per cent, while the proportion with incomplete secondaryeducation or less declined substantially from just over 20 per cent to just under 13 per cent.
Overall, the pattern of Asian employment in the figure most closely resembles that of Whiteemployment, although there are marked differences between the two. Specifically, amongstAsian workers there are, relative to White workers, fewer with tertiary education andsignificantly more with complete and incomplete secondary education. The 1995-2004 period has seen an increase of around nine percentage points in the share of employment of Asianswith matric certificates, with falls in the share of workers with less than matric education.
The patterns of African and Coloured employment are quite similar and differ markedly fromthe other two population groups. African and Coloured employment, in line with the skillsprofile of the labour force, consists of large proportions of individuals with education levelsranging from no education at all to incomplete secondary education. These categoriesrepresented almost 70 per cent of African employment and around 63 per cent of Colouredemployment in 2004. A larger proportion of Coloured workers have matric certificates,relative to Africans in both years, while relatively more employed Africans have tertiaryeducation. While both groups have seen increases in the proportions of workers with higher
DPRU Working Paper 06/103 Morné Oosthuizen
32

levels of education, the increase has been more pronounced for Coloureds. Specifically, theproportion of Coloured workers with completed secondary education almost doubled from15.8 per cent in 1995 to 29.9 per cent in 2004, while that of African workers increased from14.8 per cent to 20.3 per cent.
Figure 6: Educational Breakdown of Employed by Race (Percentage), 1995 and 2004
Source: OHS 1995, LFS 2004:2 (Statistics SA).
Overall in 2004, 15 per cent of the employed had a tertiary qualification, 27 per cent had amatric certificate and a further 30 per cent had incomplete secondary education. Thus, 42per cent of the employed had a complete secondary or tertiary education, up from 36 percent in 1995. At the same time, the proportion of workers with a primary education or less fellslightly from 31 per cent in 1995 to 26 per cent in 2004. The education levels of the employed as a group have changed since 1995, with a larger proportion of workers with tertiary andcompleted secondary educations. However, changing education levels amongst theemployed are a manifestation of demand trends rather than supply trends and beforejudgement can be passed on whether the South African population is adjusting to the greater demand for more highly skilled workers, attention must be focussed on education levelsamongst the unemployed as well. If similar changes have occurred amongst theunemployed, then this adjustment is likely to be occurring.
The Post-Apartheid Labour Market: 1995 -2004
33
0.0
10.0
20.0
30.0
40.0
50.0
60.0
70.0
80.0
90.0
100.0
Tertiary 10.0 10.1 6.8 7.3 16.5 20.0 31.4 38.0 14.0 15.1
Complete Secondary 14.8 20.3 15.8 29.9 41.2 50.5 45.9 46.4 22.0 27.0
Incomplete Secondary 32.5 33.6 39.8 37.9 34.9 23.5 20.0 11.9 31.0 29.9
Complete Primary 8.2 7.9 10.3 7.6 3.5 1.8 0.0 0.5 6.7 6.3
Incomplete Primary 21.1 18.2 20.0 11.3 2.6 1.9 0.3 0.3 16.2 13.7
No Education 11.3 8.2 6.6 3.5 0.6 0.6 0.0 0.1 8.1 6.0
1995 2004 1995 2004 1995 2004 1995 2004 1995 2004
African Coloured Asian White Total

3.3 Formal and Informal Sector Employment
The distribution of jobs between the formal and informal sectors is an important question inSouth Africa, as expressed in the ‘two economies’ discussion. Further, because of theirvulnerable and unprotected positions, informal sector workers are arguably less likely to reapthe full benefits of increased economic activity. Unfortunately, however, the differentiationbetween formal and informal sector employment is a difficult task, both in South Africa andinternationally. This is due to a number of reasons, such as the fact that individuals may notalways view their informal sector activities as work. Furthermore, surveys that aim to provideestimates of the size of the informal sector are almost certain to underestimate theimportance of the sector, not least because of the overlap between the informal sector andillegal economic activities.
In South Africa, survey estimates of the size of the informal sector are often incomparablebecause of the evolution of the questions that attempt to identify informal sectoremployment. As a consequence, for example, the 1995 survey is unable to provide a reliable estimate of the magnitude of informal employment. Improved questions designed to pick upinformal work have enabled the LFSs to better distinguish between the formal and informalsectors. Estimates of these sectors are provided in Table 13. According to the LFSs, around20 per cent of total employment in South Africa is to be found in the informal sector, a sharethat appears to have remained relatively stable since 2001. In 2004, approximately 2.4million workers were engaged in informal sector employment, slightly up on the numbers inprevious years.
Table 13: Formal and Informal Sector Employment, 2000-2004
Source: Own calculations, various LFSs (Statistics SA).Notes: 1. Total employment includes domestic workers and those with unknown/unspecified sectors.
2. Total non-formal employment refers to the sum of the informal and the domestic worker sectors.
These figures have separated domestic workers from the formal and informal sectors, as the fit between domestic workers and the formal or informal sectors is not perfect. In 2004, therewere approximately 881 000 domestic workers in South Africa, representing 7.6 per cent oftotal employment. This proportion is marginally lower than the proportions in previous years.Differentiating between the formal sector on the one hand and the non-formal sector on the
DPRU Working Paper 06/103 Morné Oosthuizen
34
As a Share of Total EmploymentFormalSector(000s)>
InformalSector( 000s)>
DomesticWorkers(000s)>
Total( 000s)> Informal
SectorDomesticWorkers
Total Non-Formal
LFS 2000: 2 7 509 2 899 999 11 713 24.7 8.5 33.3LFS 2001: 2 7 539 2 232 916 10 829 20.6 8.5 29.1LFS 2002: 2 7 845 2 223 875 11 029 20.2 7.9 28.1LFS 2003: 2 8 292 2 249 1 023 11 622 19.4 8.8 28.2LFS 2004: 2 8 318 2 372 881 11 643 20.4 7.6 27.9

other hand, approximately 28 per cent of employment can be regarded as non-formalemployment in 2004. In comparison with previous years, it appears that formal sectoremployment is gradually displacing non-formal sector employment, in contrast to generalperceptions as to the performance of formal sector employment vis-à-vis non-formal sectoremployment. This can be seen in the declining proportion of total non-formal employmentwithin total employment, which fell from 33.3 per cent in 2000 to 27.9 per cent in 2004.
3.4 Summary
This section has focussed on national employment trends between 1995 and 2004.Although growth in the South African economy during the post-apartheid period is oftentermed ‘jobless’, national household survey data has revealed this characterisation to beincorrect. Total employment, as recorded in the 1995 OHS and the September 2004 LFS,increased by 2.1 million people over the period, at an average annual rate of 2.3 per centcompared to average economic growth of 3.0 per cent per annum. Consequently, joblessgrowth cannot be said to have characterised the post-apartheid South African economy.
Employment growth over the period was concentrated in the tertiary sectors, which were alsoresponsible for the bulk of output growth, with the greatest absolute increases havingoccurred in the Internal Trade and Finance sectors. However, employment in theConstruction sector also expanded rapidly, representing the third largest increase in absolute terms and the second largest in percentage growth terms. On aggregate, employment growth in the secondary sectors was moderate in absolute terms (although similar in percentagegrowth terms to tertiary sector employment growth), while jobs were shed in both primarysectors. The rapid increase in employment in the Internal Trade sector provides some handleon employment change in parts of the informal sector, since this sector includes informalsector traders and other such groups. The skills bias of total employment growth, usingoccupational categories, was not as pronounced as previous studies found, although interms of the education levels of the employed, the trend is clearer.
A worrying trend observed in section is that, while 15 to 24 year olds accounted for 11.8 percent of employment in 1995, only 7.6 per cent of the net increase in employment accrued tothis age-group. Similarly, 12.7 per cent of net employment increase that accrued to 35 to 44year olds compares poorly with this age-group’s 30.1 per cent share of total employment in1995. In total, almost half of net new jobs accrued to 45 to 65 year olds, while individuals inthis age-group accounted for less than one-quarter of employment in 1995. Unlessindividuals in the other age-groups are remaining out of the labour force in greater numbers,unemployment for these groups is likely to rise.
In terms of the objective of ensuring that growth is shared by all members of society, thefindings presented above highlight some important issues for consideration. Firstly, overalleconomic growth figures obscure the varying experiences at a sectoral level and it is not
The Post-Apartheid Labour Market: 1995 -2004
35

unreasonable to expect that this would be true at the sub-sectoral level. As a result,individuals employed in these sectors and the households that they belong to are likely todiffer in their abilities to benefit from broad economic growth. In particular, ensuring thatgrowth is shared will meet challenges in situations where individuals are employed or solelyemployable in declining sectors. Secondly, via its impact on labour demand, economicgrowth at the sectoral level may not be ‘substitutable’, i.e. growth in a specific sector is notnecessarily equivalent to growth in another. This is due to the differing skills composition ofemployment change, with some sectors growing employment in highly skilled occupationalcategories and others growing skills in lower skilled categories. If growth is concentrated inskills-intensive sectors, it will be more difficult to ensure that such growth is shared, given thecurrent skills shortage in South Africa.
DPRU Working Paper 06/103 Morné Oosthuizen
36

4. Unemployment
In order to be effective, labour market policy aimed at addressing the problem ofunemployment in South Africa needs to be informed as to the characteristics of this part ofthe labour force. Further, the objective of shared growth is more difficult to attain if individuals are systematically excluded from employment due to a certain characteristic, whether it bediscrimination or, for example, the lack of skills. In this section, the most important attributesof the broadly unemployed are presented.
4.1 Demographic Characteristics of the UnemployedIn section 2.1, it was shown that the rate of broad unemployment rose dramatically between1995 and 2004, from 30.8 per cent to 41.0 per cent of the labour force, to 7.9 millionunemployed individuals between the ages of 15 and 65 years. However, it was also notedthat the unemployment rate in 2004 was slightly off its highest levels, indicating that thebroad unemployment rate may be stabilising. In terms of race and gender, the picture is veryconsistent with all race-gender groups experiencing higher rates of unemployment in 2004than in 1995, and females being more often unemployed than males (Figure 7). The highestrates of unemployment are experienced by African labour force members at almost 48 percent in 2004, up ten percentage points since 1995. Unemployment rates amongst the otherraces are significantly lower at 30.4 per cent, 20.8 per cent and 8.3 per cent for Coloureds,Asians and Whites respectively in 2004. All race groups have seen a rise in unemploymentrates over the period.
The Post-Apartheid Labour Market: 1995 -2004
37

Figure 7: Unemployment Rates by Race and Gender, 1995 and 2004
Source: OHS 1995, LFS 2004:2 (Statistics SA).Note: 1. Standard errors may be found in Appendix C.
Within each race-group, females experience higher unemployment rates than do males. In2004, nearly 56 per cent of African females were unemployed, more than any other group.They are followed by African males, two-fifths of whom were unemployed in 2004 and whoare the race-gender group with the largest percentage point increase in unemployment(more than ten percentage points). Coloured females and Asian females are the next mostlikely individuals to be unemployed. At the other end of the spectrum, the lowestunemployment rates were experienced by White males and females (7.0 per cent and 9.8per cent respectively in 2004).
The distribution of unemployment across race and gender has remained relatively constantbetween 1995 and 2004 (Table 14). Females, with their higher unemployment rates, account for around 57 per cent of total unemployment. This is quite a large proportion seeing thattheir share of the labour force was about 48 per cent in 2004 and only 45 per cent in 1995.Similarly, almost nine in ten unemployed people are African, five of whom are female. Asianand Whites make up less than four per cent of the unemployed, while Coloureds constitutearound seven to eight per cent. What is clear from this is that unemployment is concentratedamongst African members of the labour force in general and African females in particular.
DPRU Working Paper 06/103 Morné Oosthuizen
38
0.0
10.0
20.0
30.0
40.0
50.0
60.0
1995 29.5 47.6 37.8 17.9 28.4 22.8 10.0 20.6 13.8 3.7 8.7 5.8 23.7 39.6 30.8
2004 40.1 55.9 47.8 25.8 35.1 30.4 17.2 27.1 20.8 7.0 9.8 8.3 33.9 48.6 41.0
Male Female Total Male Female Total Male Female Total Male Female Total Male Female Total
African Coloured Asian White Total

Table 14: Distribution of Unemployment by Race and Gender (Percent Shares), 1995 and 2004
Source: OHS 1995, LFS 2004:2 (Statistics SA).
As mentioned already, rural-urban analysis is no longer directly possible in the LFSs and it isnot possible to determine whether rural or urban areas experience higher rates ofunemployment. However, Oosthuizen and Bhorat (2004: 21) found that unemployment rates in urban areas are generally lower than in rural areas, with 37 per cent of urban labour forcemembers unemployed in 2002, as opposed to nearly 50 per cent of rural labour forcemembers, and that the gap had widened since 1995. Provincially, unemployment variessubstantially, being in part a reflection of these urban-rural differences (Table 15). TheWestern Cape has the lowest unemployment rate in both 1995 and 2004. At 26.3 per cent, itis ten percentage points lower than the unemployment rate of Gauteng, which has thesecond lowest rate of unemployment. Several provinces have seen statistically significantincrease in their unemployment rates. These are the Northern Cape (up to 39.3 per cent in2004), the Free State (39.1 per cent), KwaZulu-Natal (43.7 per cent), the North-West (47.5per cent), Gauteng (36.7 per cent) and Limpopo (54.3 per cent).
The provinces’ differing histories under apartheid also seem to have influencedunemployment rates. Specifically, provinces that include areas previously designated as‘homelands’ or ‘self-governing territories’ under the apartheid system have higher rates ofunemployment than other provinces. In 2004, the highest rates of unemployment were to befound in Limpopo (54 per cent), the North-West (48 per cent) and the Eastern Cape (46 percent). It is therefore clear that previous governments’ neglect of homeland areas continuesto manifest itself in high levels of unemployment in those areas, while economicdecentralisation policies seem to have had a limited effect on unemployment rates in theseareas.
The Post-Apartheid Labour Market: 1995 -2004
39
1995 2004Male Female Total Male Female Total
African 37.4 50.6 88.0 38.2 51.1 89.3Coloured 3.4 4.6 8.0 3.0 4.0 7.0Asian 0.6 0.7 1.4 0.7 0.7 1.4White 1.0 1.7 2.7 1.1 1.2 2.3Total 42.5 57.5 100.0 43.0 56.9 100.0

Table 15: Unemployment by Location, 1995 and 2004
Source: OHS 1995, LFS 2004:2 (Statistics SA).Notes: 1. Figures in parentheses are 95 per cent confidence intervals, corrected according to frequency weights, the
primary sampling unit and, in the case of 2004, sampling stratification.
An individual’s level of education has been found to be an important indicator of whether heor she is unemployed or not. The South African economy’s increasing appetite for highlyskilled labour, its continued mechanisation of manufacturing and industrial processes and its pursuit of international competitiveness means that lower skilled and poorly educatedworkers are likely to bear the brunt of unemployment (Bhorat 2003a, 2003b, Oosthuizen2003). This is clear from Table 16, which presents unemployment rates by individuals’highest level of education. What is immediately evident is that unemployment rates haveincreased across every education category over the period. Higher than average rates ofunemployment were experienced in both periods by individuals in the four categories belowmatric. By 2004, one in two individuals in the labour force with incomplete secondaryeducation were unemployed (up from 35.5 per cent in 1995), while two in five labour forcemembers with matric certificates were unable to find employment (up from 27.0 per cent).The former group numbers around 3.5 million individuals and constitutes more than 43.8 percent of the unemployed. High levels of unemployment amongst those with matric certificateare particularly disturbing in that although education (with a matric certificate beingconsidered an important goal for learners) is promoted as a ‘ticket’ to a job and a better life,the unemployment rate amongst matriculants has increased by 12 percentage points, oralmost 50 per cent. Thus, in 2004, 2.0 million of the 8.1 million individuals without a job (25.0per cent) were holders of matric certificates. The rise in the unemployment rates of matriccertificate holders again points to issues of quality, whether perceived or actual: in a
DPRU Working Paper 06/103 Morné Oosthuizen
40
1995 200420.0 26.3Western Cape
(16.255, 23.709) (22.598, 30.067)42.6 46.1Eastern Cape
(38.052, 47.095) (43.589, 48.532)29.5 39.3Northern Cape
(24.529, 34.476) (35.631, 42.894)26.8 39.1Free State
(24.385, 29.245) (35.283, 42.931)34.3 43.7KwaZulu-Natal
(30.018, 38.68) (41.189, 46.298)33.8 47.5North-West
(27.065, 40.515) (44.015, 50.909)24.1 36.7Gauteng (20.09, 28.058) (34.141, 39.302)34.7 40.1Mpumalanga
(30.145, 39.238) (37.025, 43.145)42.2 54.3Limpopo
(34.954, 49.429) (51.281, 57.419)30.8 41.0Total
(28.845, 32.792) (39.891, 42.065)
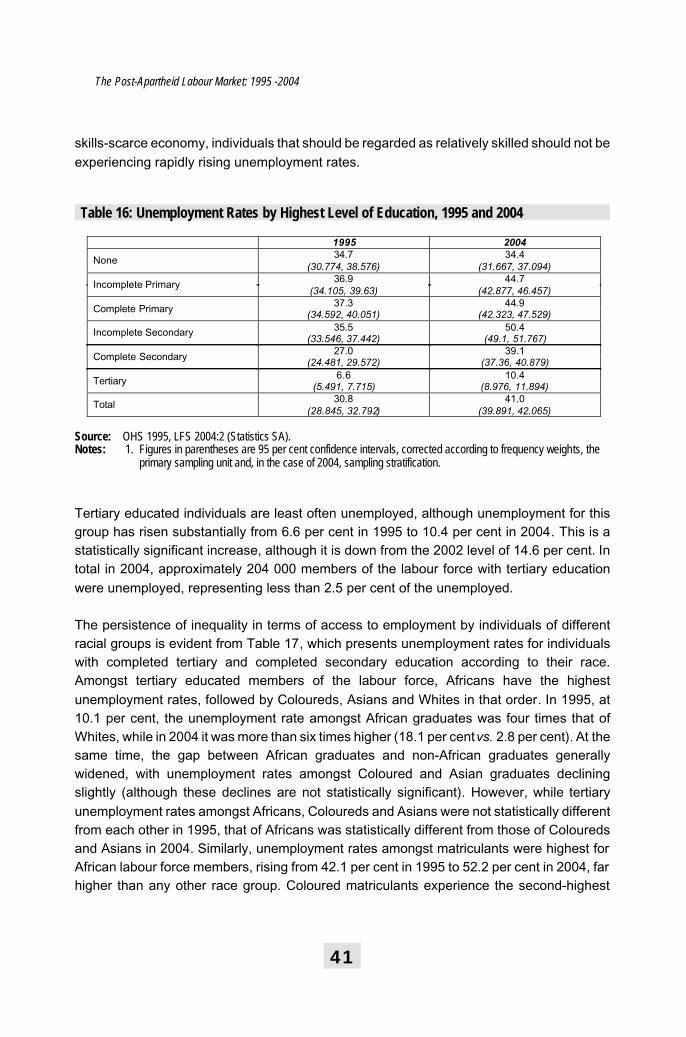
skills-scarce economy, individuals that should be regarded as relatively skilled should not be experiencing rapidly rising unemployment rates.
Table 16: Unemployment Rates by Highest Level of Education, 1995 and 2004
Source: OHS 1995, LFS 2004:2 (Statistics SA).Notes: 1. Figures in parentheses are 95 per cent confidence intervals, corrected according to frequency weights, the
primary sampling unit and, in the case of 2004, sampling stratification.
Tertiary educated individuals are least often unemployed, although unemployment for thisgroup has risen substantially from 6.6 per cent in 1995 to 10.4 per cent in 2004. This is astatistically significant increase, although it is down from the 2002 level of 14.6 per cent. Intotal in 2004, approximately 204 000 members of the labour force with tertiary educationwere unemployed, representing less than 2.5 per cent of the unemployed.
The persistence of inequality in terms of access to employment by individuals of differentracial groups is evident from Table 17, which presents unemployment rates for individualswith completed tertiary and completed secondary education according to their race.Amongst tertiary educated members of the labour force, Africans have the highestunemployment rates, followed by Coloureds, Asians and Whites in that order. In 1995, at10.1 per cent, the unemployment rate amongst African graduates was four times that ofWhites, while in 2004 it was more than six times higher (18.1 per cent vs. 2.8 per cent). At the same time, the gap between African graduates and non-African graduates generallywidened, with unemployment rates amongst Coloured and Asian graduates decliningslightly (although these declines are not statistically significant). However, while tertiaryunemployment rates amongst Africans, Coloureds and Asians were not statistically differentfrom each other in 1995, that of Africans was statistically different from those of Colouredsand Asians in 2004. Similarly, unemployment rates amongst matriculants were highest forAfrican labour force members, rising from 42.1 per cent in 1995 to 52.2 per cent in 2004, farhigher than any other race group. Coloured matriculants experience the second-highest
The Post-Apartheid Labour Market: 1995 -2004
41
1995 200434.7 34.4None
(30.774, 38.576) (31.667, 37.094)36.9 44.7Incomplete Primary
(34.105, 39.63) (42.877, 46.457)37.3 44.9Complete Primary (34.592, 40.051) (42.323, 47.529)35.5 50.4Incomplete Secondary
(33.546, 37.442) (49.1, 51.767)27.0 39.1Complete Secondary (24.481, 29.572) (37.36, 40.879)6.6 10.4Tertiary (5.491, 7.715) (8.976, 11.894)30.8 41.0Total
(28.845, 32.792) (39.891, 42.065)
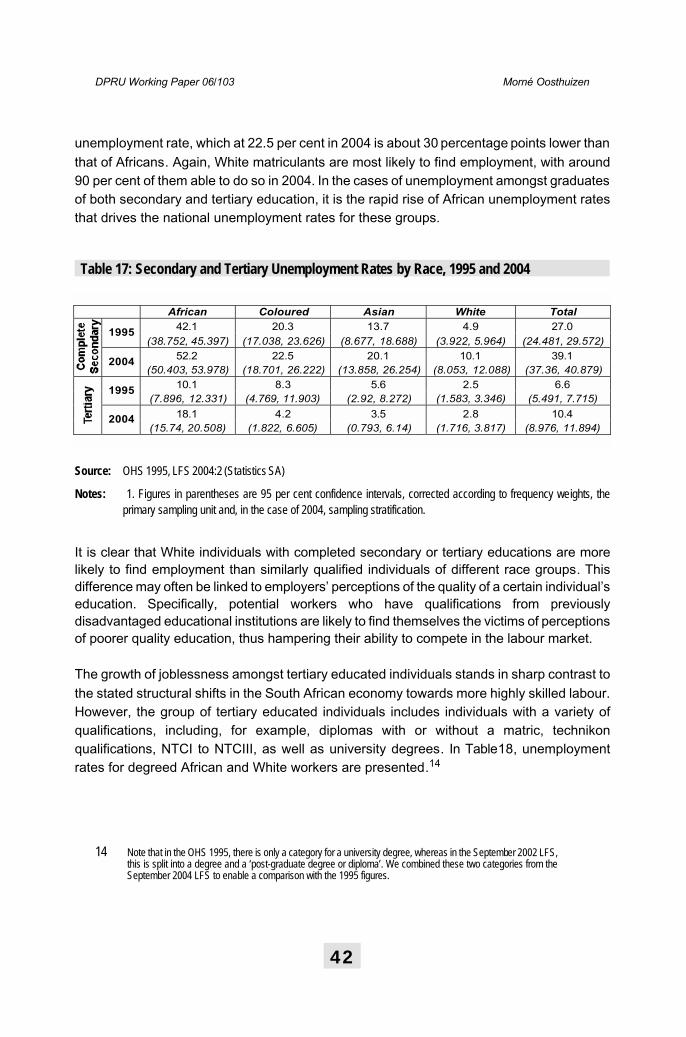
unemployment rate, which at 22.5 per cent in 2004 is about 30 percentage points lower thanthat of Africans. Again, White matriculants are most likely to find employment, with around90 per cent of them able to do so in 2004. In the cases of unemployment amongst graduatesof both secondary and tertiary education, it is the rapid rise of African unemployment ratesthat drives the national unemployment rates for these groups.
Table 17: Secondary and Tertiary Unemployment Rates by Race, 1995 and 2004
Source: OHS 1995, LFS 2004:2 (Statistics SA)
Notes: 1. Figures in parentheses are 95 per cent confidence intervals, corrected according to frequency weights, theprimary sampling unit and, in the case of 2004, sampling stratification.
It is clear that White individuals with completed secondary or tertiary educations are morelikely to find employment than similarly qualified individuals of different race groups. Thisdifference may often be linked to employers’ perceptions of the quality of a certain individual’s education. Specifically, potential workers who have qualifications from previouslydisadvantaged educational institutions are likely to find themselves the victims of perceptions of poorer quality education, thus hampering their ability to compete in the labour market.
The growth of joblessness amongst tertiary educated individuals stands in sharp contrast tothe stated structural shifts in the South African economy towards more highly skilled labour.However, the group of tertiary educated individuals includes individuals with a variety ofqualifications, including, for example, diplomas with or without a matric, technikonqualifications, NTCI to NTCIII, as well as university degrees. In Table18, unemploymentrates for degreed African and White workers are presented.14
DPRU Working Paper 06/103 Morné Oosthuizen
42
African Coloured Asian White Total42.1 20.3 13.7 4.9 27.01995
(38.752, 45.397) (17.038, 23.626) (8.677, 18.688) (3.922, 5.964) (24.481, 29.572)52.2 22.5 20.1 10.1 39.12004
(50.403, 53.978) (18.701, 26.222) (13.858, 26.254) (8.053, 12.088) (37.36, 40.879)10.1 8.3 5.6 2.5 6.61995
(7.896, 12.331) (4.769, 11.903) (2.92, 8.272) (1.583, 3.346) (5.491, 7.715)18.1 4.2 3.5 2.8 10.42004
(15.74, 20.508) (1.822, 6.605) (0.793, 6.14) (1.716, 3.817) (8.976, 11.894)
14 Note that in the OHS 1995, there is only a category for a university degree, whereas in the September 2002 LFS,this is split into a degree and a ‘post-graduate degree or diploma’. We combined these two categories from theSeptember 2004 LFS to enable a comparison with the 1995 figures.

Table 18: Unemployment of Degreed African and White Workers, 1995 and 2004
Source: OHS 1995, LFS 2004:2 (Statistics SA)
Notes: 1. Figures in parentheses are 95 per cent confidence intervals, corrected according to frequency weights, the primary sampling unit and, in the case of 2004, sampling stratification.2. The total column includes individuals of all races.
It is immediately evident that degreed workers are substantially less likely to be unemployedthan other individuals in the tertiary education category, with the unemployment rateamongst the former, at 4.5 per cent, less than half the rate of the latter in 2004. However,although the number of degreed unemployed individuals rose rapidly between 1995 and2004, the unemployment rates are not statistically significant. This finding differs fromOosthuizen and Bhorat (2004) who found substantial increases in the unemployment ratesof Africans in particular between 1995 and 2002, and may indicate that the uptake byemployers’ of African graduates has improved since 2002. As was seen earlier,unemployment rates differ markedly by race. White degreed unemployment was virtuallyunchanged over the period at slightly over two per cent, with little change in absolute terms.In contrast, the number of unemployed Africans with degrees more than doubled from underten thousand to around 25 000 over the period, although there was no statistically significantchange in the unemployment rate. Consequently, while Africans accounted for slightly overhalf of degreed unemployment in 1995, this proportion had risen to 70 per cent in 2004.These figures therefore suggest that the prediction of the “beginning of a graduateunemployment problem in South Africa” by Oosthuizen and Bhorat (2004), based on theLFS of September 2002, and by Bhorat (2003a), may in fact be less of a problem withdegreed jobseekers and more one of jobseekers with diplomas and certificates and othernon-degree qualifications.
As noted earlier, the South African economy has been unable to absorb sufficient numbersof new labour market entrants into employment, despite employment growth having beenadequate given economic growth. Analysis of the number of employed and unemployedlabour force participants shows that is particularly amongst younger individuals that
The Post-Apartheid Labour Market: 1995 -2004
43
African White TotalThousands 9.5 6.0 18.0
6.2 2.3 3.91995Unemployment Rate
(2.953, 9.347) (1.234, 3.438) (2.631, 5.142)Thousands 25.1 8.4 35.6
8.5 2.0 4.52004Unemployment Rate
(5.715, 11.258) (0.695, 3.378) (3.126, 5.913)Thousands 15.6 2.4 17.6ChangeGrowth (%) 164.0 39.6 97.8

absorption has been too low (Figure 8). The largest increase in the number of unemployedindividuals has clearly been amongst youth below the age of 35 years. Of the total increasein unemployment between 1995 and 2004, those aged between 18 and 25 years account for41 per cent, while those aged 26 to 35 account for a further 34 per cent. The number ofunemployed 18 to 35 year olds doubled over the period from 2.89 million in 1995 to 5.71million in 2004. When it is considered that the total number of individuals in this age-groupincreased by 2.4 million (from 12.1 million in 1995 to 14.5 million in 2004), the extent of theproblem becomes clear. Admittedly, there is a certain degree of frictional unemploymentamongst younger labour force members, as they move into and out of education institutions.However, this is unlikely to be a significant proportion of total unemployment numbers.
Figure 8: Broad Unemployment by Age, 1995 and 2004
Source: OHS 1995, LFS 2004:2 (Statistics SA).
While unemployment rates have increased for virtually every age-group between 1995 and2005, the increases have been particularly large for 19 to 29 year olds and range betweenten and 18 percentage points. In 2004, unemployment amongst 15 to 19 year olds was 76.7per cent, with broad unemployment rates falling below the average rate of 41.8 per cent forindividuals in the 30 to 34 year age-group and above. The specific age at which theunemployment rate falls below the average rate of 41.8 per cent is 30 years. In 1995, broadunemployment rates were below the average of 30.8 per cent for individuals aged 32 years
DPRU Working Paper 06/103 Morné Oosthuizen
44
0
50
100
150
200
250
300
350
400
450
500
15 20 25 30 35 40 45 50 55 60 65
Age (Years)
0.0
10.0
20.0
30.0
40.0
50.0
60.0
70.0
80.0
90.0
100.0
1995 Unemployed 2004 Unemployed 1995 Unemployment Rate 2004 Unemployment Rate

and older. Table 19 presents unemployment rates for the five main age-groups. The patternof falling rates of unemployment as age increases is again confirmed. In 2004, theunemployment rate for 15 to 24 year olds was 68.3 per cent, falling to 30.3 per cent for 35 to44 year olds and to 15.5 per cent amongst 55 to 65 year olds. This reflects a similar pattern to that in 1995, although all at higher levels respectively. The increases in unemployment ratesfor each group are all statistically significant, except amongst 55 to 65 year olds.
Table 19: Unemployment Rates by Age-group, 1995 and 2004
Source: OHS 1995, LFS 2004:2 (Statistics SA).
Notes: 1. Figures in parentheses are 95 per cent confidence intervals, corrected according to frequency weights, the primary sampling unit and, in the case of 2004 sampling stratification.
The differences in the age profiles of the employed and the unemployed are manifest in mean and median age statistics. The average employed person in 1995 was 36 years and 8 months old, compared to only 30 years and 9 months for the broadly unemployed15, a difference ofalmost six years. In 1995 the median age of an employed individual was 35 years, asopposed to 29 years for the unemployed. These median ages changed to 36 years and 28years respectively in 2004, implying a possible widening of the age gap between theemployed and the unemployed. This difference in ages may be related to the high proportionof young people who have left school and other educational institutions amongst theunemployed. It also appears that individuals in their fifties and sixties who do not haveemployment, may often opt out of the labour force instead of remaining unemployed andhence the low unemployment rates amongst this group.
The final aspect of unemployment investigated here is the length of time that unemployedindividuals have been without work. Figure 9 presents this according to the age-group for allbroadly unemployed individuals in 2004. It is clear that a substantial proportion of theunemployed have never had a job. Almost two-thirds of all the unemployed, irrespective of
The Post-Apartheid Labour Market: 1995 -2004
45
15 to 24 yrs 25 to 34 yrs 35 to 44 yrs 45 to 54 yrs 55 to 65 yrs Total53.1 34.1 22.0 18.1 14.0 30.8
1995 (50.248,56.038)
(31.696,36.468)
(20.291,23.699)
(16.351,19.849)
(12.019,15.962)
(28.845,32.792)
68.3 44.1 30.3 22.2 15.5 41.02004 (66.650,
69.887)(42.544,45.675)
(28.889,31.772)
(20.688,23.676)
(13.714,17.357)
(39.891,42.065)
15 Interestingly, the average age of the unemployed is not statistically different whether the unemployed are definedaccording to the official (narrow) or broad definitions, indicating that there is no correlation between the decision tostop looking for work and an unemployed individual’s age.

age, have never been employed. This is particularly true of younger individuals and theoverall proportion that has never had work is driven by their experience due to theirnumerical dominance. Thus, almost 85 per cent of unemployed individuals aged 15 to 24years have never had a job, as have 65 per cent of 25 to 34 year olds. This should not beunexpected, given that younger individuals are more likely to have entered the labour forcerelatively recently and have had less time to have held at least one job in the past.
Figure 9: Length of Time since Individual Last Worked, 2004
Source: LFS 2004:2 (Statistics SA).
However, greater proportions of older individuals have been without work for relatively longperiods of time. So, 94 000 unemployed individuals between the ages of 55 and 65 years last had a job more than three years prior to the survey, equivalent to 53 per cent. Similarly, 46per cent and 29 per cent of individuals in the 45 to 54 year and 35 to 44 year age-groups hadnot been employed for more than three years. Of course, this does not necessarily meanthat these individuals have been unemployed for more than three years (lack of employmentis not equivalent to unemployment since individuals may have exited the labour force).Nevertheless, this figure confirms that long-term unemployment is likely to be an important
DPRU Working Paper 06/103 Morné Oosthuizen
46
0%
20%
40%
60%
80%
100%
Never worked 2339 2001 561 179 41 512036 months plus 45 310 381 286 94 1114< 36 months 51 173 102 48 10 384< 24 months 86 183 95 31 9 404< 12 months 79 143 77 26 6 331< 6 months 67 122 58 21 5 272< 3 months 60 98 38 27 8 232< 1 month 33 35 18 10 4 100
15-24 yrs 25-34 yrs 35-44 yrs 45-54 yrs 55-65 yrs Total

characteristic of unemployment in South Africa, with critical implications for job creation andpoverty reduction strategies.
Labour force growth in South Africa since 1995 has been rapid, outpacing population growthand rendering the labour market incapable of absorbing labour force members intoemployment. This has resulted in a substantial increase in broad (and narrow)unemployment between 1995 and 2004. Broad unemployment rose 10.2 percentage pointsto 41.0 per cent, with increases recorded for both males and females as groups, and withinrace groups. Africans, and African females in particular, have far higher unemployment ratesthan any other group. In fact, around nine-tenths of the unemployed nationally are African.Locationally, the provinces of Limpopo, the Eastern Cape and the North-West have thehighest unemployment rates. However, even the Western Cape, where broad unemployment is around 26 per cent, the lowest provincial rate in the country, has very high unemploymentby international standards.
Perhaps the most disturbing trend uncovered in this section is the rising number of educatedunemployed people, particularly since the South African economy is skills constrained.Unemployment amongst tertiary and high school educated individuals is significantly higherin 2004, with the tertiary educated unemployment rate increasing substantially from 6.6 percent to 10.4 per cent over the period. The relatively large jump in tertiary educatedunemployment is due largely to the rapid increase in the number of unemployed Africangraduates, specifically those with non-degree qualifications. Variation in unemploymentrates along racial lines indicates that, across races, graduates differ or are perceived to differ resulting in varying probabilities of employment. Such differences may range fromemployers’ perceptions of differences in the quality of qualifications, which may be real ornot and are related to the institutions attended, to the mix of graduates’ fields of study withinindividual race groups. Importantly, monitoring of the Higher Education system shouldremain a critical component of employment promoting strategies.
4.2 Household Attachment and the Unemployed
In the absence of a fully-developed social security system, it seems that for unemployedindividuals an important source of resources would be the households in which they findthemselves. However, there is a critical question surrounding the ability of these householdsto provide support to their unemployed members. Hence, the focus in this section is theanalysis of the characteristics of households in which the unemployed find themselves.
A large proportion of the broad unemployed are members of households with few or nowage-earners, and this proportion has increased over the 1995-2004 period (Table 20). In2004, 4.0 million unemployed adults (49.4 per cent of the total) were members ofhouseholds without any wage-earners, up from 1.8 million (42.0 per cent) in 1995. Thus, thenumber of unemployed adults living in non-wage-earning households rose by 2.2 million, at
The Post-Apartheid Labour Market: 1995 -2004
47

an average rate of 9.0 per cent annually. A similar, though slightly slower, increase in number of unemployed adults in households with only one wage-earner also occurred. This meansthat in 2004 less than 12 per cent of the unemployed were members of households with twoor more wage-earners, down from 16.6 per cent in 1995. The evidence, therefore, points tothe increased marginalisation of the unemployed in households that have no or very littleaccess to wage-income.
Table 20: Distribution of the Unemployed across Wage-Earning Households, 1995 and 2004
Source: OHS 1995, LFS 2004:2 (Statistics SA)Notes: 1. Figures are based on weighted household samples in these two surveys.
It has been observed that, in the South African context, old-age pensions are often used tosupport the whole household, rather than only the pension recipient, and that pensionersoften represent the centre around which poorer households are constituted. Table 21 indicates that the unemployed have experienced increasing access to pension income overthe 1995-2004 period, in contrast to the case of wage-income. Overall, the proportion ofhouseholds with access to old-age pensions has increased from 10.5 per cent (1.0 millionhouseholds) to 17.3 per cent (2.2 million households), a remarkable achievement with thenumber of households involved more than doubling. Access rates have increased forhouseholds irrespective of the number of unemployed members. Specifically, householdswith three unemployed members saw access rates rise from 19.4 per cent to 27.5 per cent,while access rates for households with four unemployed members grew by 6.2 percentagepoints to 31.2 per cent. It is also evident that old-age pension access rates rise as thenumber of unemployed household members rises, providing some confirmation of theformation of poorer households around pensioners, although no conclusions aroundcausality can be made from the data.
DPRU Working Paper 06/103 Morné Oosthuizen
48
1995 2004 ChangeNumber of Employed in Household '000s Share '000s Share '000s Annual
Growth Rate0 1 780 42.0 3 996 49.4 2 216 9.41 1 563 36.9 3 179 39.3 1 616 8.22 541 12.8 712 8.8 171 3.13 120 2.8 152 1.9 32 2.74 + 43 1.0 44 0.5 1 0.3Total 4 239 100.0 8 083 100.0 3 844 7.4

Table 21: Household Access to Pensions according to Number of Unemployed in Household, 1995 and 2004
Source: OHS 1995, LFS 2004:2 (Statistics SA)Notes: 1. 2004 figures exclude households where respondents did not specify whether or not a household member
was receiving an old-age pension.2. Growth Rate is the average annual growth rate of the number of households with access to pensions.
Households with no unemployed members in 2004 represent 54.5 per cent of all householdswith access to old-age pensions, down from 60.3 per cent seven years earlier. In contrast,households with two or more unemployed members represent almost 21 per cent of allhouseholds with old-age pension access in 2004, up from under 17 per cent in 1995.
In a similar vein, the Labour Force Surveys provide information on households’ mainincome sources. Households’ answers to this question in September 2004 are presented in Figure 10 according to the number of broadly unemployed household members. Salariesand wages are the main source of income for the majority of households in South Africa(56.7 per cent). Amongst households with no unemployed members, salaries and wages are the main income source for 66.5 per cent, while for households with one unemployedmember, the figure is 48.3 per cent. For households with two or more broadly unemployedmembers, between 31 per cent and 39 per cent report salaries and wages to be their mainsource of income.
The Post-Apartheid Labour Market: 1995 -2004
49
1995 2004 ChangeNumber of Unemployedin Household '000s Access
Rate Share '000s AccessRate Share '000s Access
RateGrowth
Rate0 601 8.9 60.3 1 186 16.3 54.5 585 7.4 7.81 228 12.6 22.9 538 15.3 24.7 310 2.7 10.02 95 15.8 9.6 274 22.9 12.6 178 7.2 12.43 41 19.4 4.2 114 27.5 5.2 72 8.1 11.94+ 30 25.0 3.0 64 31.2 2.9 33 6.2 8.7Total 996 10.5 100.0 2 174 17.3 100.0 1 179 6.7 9.1

Figure 10: Households’ Main Income Source by Number of Broad Unemployed Household Members, 2004
Source: LFS 2004:2 (Statistics SA)
What is clear is that as the proportion of households reporting salaries and wages to be theirmain source of income declines, the number of broadly unemployed household membersrises, as does the proportion of households identifying pensions and grants as their mainincome source. In households with four or more unemployed members, pensions and grantsare the main source of income for more than two-fifths of households, declining slightly to 39per cent of households with two or three unemployed members. Only around one in fivehouseholds with fewer than two unemployed members report pensions and grants as theirmain income source.
The third and final major source of income is remittances. As is fair to expect, very fewhouseholds with no unemployed members (only 6.9 per cent) receive remittances as theirmajor income source. Around 19 per cent of households with one or two broadly unemployedmembers identify remittances as their main source of income, although this proportion fallsfor households with three or more unemployed members.
This section points to the continued, and indeed increased, marginalisation of theunemployed in households with no or very few wage earners. Further, increasing numbers of the unemployed are clustered in households with access to old age pensions and it was alsofound that households with one or more unemployed members have pensions, grants and
DPRU Working Paper 06/103 Morné Oosthuizen
50
0.0
10.0
20.0
30.0
40.0
50.0
60.0
70.0
80.0
90.0
100.0
No Income 0.5 3.5 3.6 2.3 2.9 1.7
Other non-farm Income 6.7 6.4 6.2 6.4 5.0 6.5
Sales of Farm Products 0.9 0.8 0.5 0.2 2.1 0.8
Pensions/Grants 18.3 22.0 39.2 39.3 43.4 22.4
Remittances 6.9 18.9 19.1 12.9 14.0 11.7
Salaries/Wages 66.5 48.3 31.4 38.8 32.6 56.7
0 1 2 3 4+ Total

remittances as their main source of income. Consequently, it is evident that the socialsecurity system is coming under increasing pressure to support destitute households, atrend which will continue, at least, over the medium term. Policymakers are becoming awareof this trend and require a greater understanding of the formation of households and howgrants are utilised to support non-recipients if the social security system is to cope in thecurrent context of rising joblessness.
4.2 Summary
The inability of the South African economy to generate new jobs at the pace required by therapid increase in the size of the labour force between 1995 and 2004, has led to a tenpercentage point rise in the broad unemployment rate. Unemployment rates have risen forvirtually every sub-group analysed and have become extremely severe in a number of cases.Amongst Africans, unemployment stood at almost 48 per cent in 2004, up from 38 per cent in1995. For example, more than 55 per cent of African females are unemployed, as are 54 percent of the Limpopo labour force and 47 per cent of the North-West labour force.
The skills bias of employment growth is evident in the rapidly rising rates of unemploymentamongst the poorly educated groups of the labour force. However, unemployment has risenacross all educational categories, indicating that even higher levels of education do notautomatically guarantee employment. This is particularly true for African labour forcemembers: unemployment for those with tertiary education stood at 18 per cent in 2004,compared to just three per cent amongst White tertiary graduates. More than 52 per cent ofAfrican matriculants were unemployed in 2004, compared to ten per cent of Whitematriculants.
Low employment growth amongst the youngest labour force members is reflected in amassive increase in the number of unemployed individuals, particularly for those between 18and 35 years of age. Nearly 70 per cent of 15 to 24 year olds and 44 per cent of 25 to 34 yearolds were unemployed in 2004. Furthermore, the overwhelming majority of unemployedindividuals have either never had a job before or have not worked for the past three years ormore. These trends have serious implications for the affected individuals themselves and forthe broader economy, since they are not raising their levels of education or skills nor are theyacquiring work experience.
The unemployed are also increasingly marginalised in households with no or littlewage-income, with nearly half of the unemployed residing in households without anyemployed members. At the same time, there is tentative evidence that the unemployed areincreasingly clustered around pension recipients, although this does not indicate anycausality in terms of household formation. Overall, households’ access to pensions hasincreased. In terms of main income sources, pensions are most often cited as the mainincome sources of households with two or more unemployed members. Pensions are
The Post-Apartheid Labour Market: 1995 -2004
51

followed by salaries and wages of employed household members and, to a lesser extent,remittances.
With a large part of the labour force unemployed, the challenge of ensuring that growth isshared is accentuated. This is particularly true because of the fact that, for many individuals,unemployment is a long-term phenomenon, evidenced by the large proportion of theunemployed who have never had employment or have not worked in three years or more.Long-term unemployment results in the erosion of an individual’s skills base and preventsthe accumulation of experience, reducing future employability and, therefore, theindividual’s ability to capture the benefits of economic growth via employment.Unemployment, not surprisingly, is most common amongst South Africa’s poorest and leastskilled groups and, with continued skills-biased employment growth, their chances ofaccessing employment opportunities are reduced. Finally, the fact that the unemployed findthemselves increasingly in households with little or no access to wage-income presents afurther challenge. This means that a large proportion of the population currently have nomeans of accessing the benefits of growth in, for example, the form of higher wages. Ofgreat concern, though, if these individuals are deemed ‘unemployable’, this currentmarginalisation from the benefits of economic growth will become a long-term problem.
DPRU Working Paper 06/103 Morné Oosthuizen
52

5. A Multivariate Analysis of Employment
Although important and useful, the preceding analysis is limited in that it takes into accountone or two variables when describing employment, unemployment or the labour force.However, a wide variety of variables acting together will determine whether an individualenters the labour force and finds work or remains unemployed. Ordinary cross-tabulationsare unable to deal with this issue, but fortunately it is possible to begin to disentangle thevarious effects econometrically.
The purpose of this section is to investigate the role of various factors in influencing whetheror not an individual is employed. This is achieved by estimating an employment probit.However, the sample of individuals in the labour force is not a random sample, since thisgroup has already undergone some kind of selection process whereby they decided to enterthe labour force while others opted out of the labour force. As shown above, employedindividuals differ from their unemployed counterparts and both are likely to differ fromnon-participants. Consequently, the estimated results will suffer from sample selection bias.To address this problem, the Heckman two-step approach is followed. First, a labour forceparticipation probit is estimated using, amongst others, certain household-specific variablesthat would affect an individual’s decision to enter the labour force. The labour forceparticipation equation allows the estimation of the inverse Mills ratio (lambda), which in turnis included in the employment probit, making it conditional on labour force participation.
Table 22 presents the results of the labour force participation probit. The referent variablesare:
! Age: 15 to 24 years! Race: African! Gender: Male ! Province: Eastern Cape.
The positive, statistically significant coefficients for the four age-groups in both yearsindicates that individuals aged 15 to 24 years are least likely to enter the labour force.However, it appears that this difference reduced slightly over the period, particularly amongst35 to 44 year olds. In 1995, Coloureds were almost three per cent more likely to enter thelabour force than their African counterparts, while Asians and Whites were respectively 9.1per cent and 13.7 per cent less likely to enter. By 2004, Africans were most likely to enter thelabour force, since all other race groups’ coefficients are negative and significant. Whiteswere only three-quarters as likely as Africans to be part of the labour force in 2004.
In terms of location, provinces were used in the probits. This is due to the fact that in 2004,urban-rural data is not included in the LFSs. The results demonstrate that only Limpoporesidents were less likely to enter the labour force than those in the Eastern Cape. Residentsof the Free State, Gauteng and the Western Cape were most likely to enter the labour force.This, however, had changed somewhat by 2004. Firstly, the coefficients for the Free State,
The Post-Apartheid Labour Market: 1995 -2004
53

KwaZulu-Natal and Limpopo are no longer statistically significant, indicating that residentsof those provinces are no more or less likely to enter the labour force than those of theEastern Cape. For the remaining provinces, except Mpumalanga, the greater likelihood ofentering the labour force relative to the Eastern Cape and measured in 1995 was reduced.
Table 22: Labour Force Participation Equations using the Broad Definition of Unemployment, 1995 and 2004
Source: OHS 1995, LFS 2004:2 (Statistics SA); own calculations.Notes: * Significant at the five per cent level.
** Significant at the one per cent level.
The effect of an individual’s education is captured by the education splines included in theprobit. In 1995, all education variables were statistically significant, except for Degree, whileall significant variables had positive coefficients. The positive coefficients indicate that higherlevels of educational attainment coincide with a higher probability of labour forceparticipation. Since the education variables are splines, the insignificant coefficient onDegree indicates that degreed individuals of working age are not different to those with
DPRU Working Paper 06/103 Morné Oosthuizen
54
1995 2004Marginal Effects x-bar Marginal Effects x-bar
25-34 years 0.6290 ** 0.1611 0.6136 ** 0.169435-44 years 0.6721 ** 0.1158 0.6065 ** 0.111645-54 years 0.6109 ** 0.0691 0.5453 ** 0.082655-65 years 0.3688 ** 0.0549 0.3414 ** 0.0611Coloured 0.0289 ** 0.0937 -0.0654 ** 0.0882Asian -0.0909 ** 0.0263 -0.2208 ** 0.0246White -0.1374 ** 0.1081 -0.2662 ** 0.0948Female -0.1413 ** 0.5194 -0.1138 ** 0.5085Western Cape 0.0963 ** 0.1016 0.0560 ** 0.0979Northern Cape 0.0827 ** 0.0212 0.0412 ** 0.0194Free State 0.0997 ** 0.0644 0.0081 0.0635KwaZulu-Natal 0.0438 ** 0.2036 0.0000 0.2068Gauteng 0.0971 ** 0.1705 0.0429 ** 0.1912North West 0.0625 ** 0.0859 0.0228 ** 0.0810Mpumalanga 0.0573 ** 0.0692 0.0584 ** 0.0686Limpopo -0.0581 ** 0.1238 0.0146 0.1205No education to Grade 6 0.0296 ** 3.8780 0.0467 ** 4.0665Grade 7 0.0168 ** 0.4877 0.0499 ** 0.5248Grade 8 to Grade 11 0.0118 ** 1.2599 0.0516 ** 1.4334Grade 12 0.1977 ** 0.1565 0.1817 ** 0.1919Diploma 0.0216 * 0.0456 0.0689 ** 0.0493Degree -0.0077 0.0293 -0.0252 ** 0.0542Children under 15 years -0.0217 ** 2.2230 -0.0271 ** 2.0224Adults over 60 years -0.0693 ** 0.3608 -0.0692 ** 0.3198
Observed Probability 0.3435 0.4265Predicted Probability (at x-bar) 0.2652 0.3894Number of Observations 125407 109309Chi 69972.12 70339.75Pseudo R 0.4337 0.4716

Diplomas in terms of their likelihood of being part of the labour force. In 2004, all educationsplines are statistically significant at the one per cent level. All splines also vary positively with the probability of participation, except for Degree, which has a negative coefficient.
The two household variables included, namely the number of children under the age of 15years that reside in the household and the number of adults over the age of 60 years thatreside in the household, appear to play a statistically significant role in the decision to enterthe labour force. The number of children under the age of 15 years has a negative coefficientin both years, indicating that a greater number of young children that reside in the household,the lower the probability that an individual will be part of the labour force. This is in somerespects somewhat counter-intuitive, since one could argue that the increased financialburden placed on households by young children would spur adults to enter the labour force.However, if the probits were run separately for males and females, the effect of the presenceof children in the household would perhaps be clearer. For example, Bhorat and Leibbrandt(2001: 119-120) find that the presence of young children in the household is insignificant indetermining the participation decision of males, while it is significant and negative forfemales, using the expanded definition of unemployment. Similarly, the number of adults over 60 years of age is also significantly negative in both years, meaning that the greater thenumber of pensionable-aged individuals in the household, the less likely working ageindividuals will be to participate in the labour force.
Having estimated the participation equation using various person- and household-relatedvariables, the sample of those individuals who do participate in the labour force is retainedand the employment equation, which estimates the probability that labour force members areemployed, is estimated. The same referent variables are utilised, namely 15 to 24 years,African, Male, and Eastern Cape.
Firstly, the results indicate that the coefficients in both years for lambda or the inverse Millsratio are both negative and statistically significant. Since the inverse Mills ratio is a measureof the extent to which the sample suffers from selectivity bias, this means that labour forcemembers do indeed differ from their counterparts who decide not to participate in the labourforce, and the two-step approach is therefore both justified and necessary.
The Post-Apartheid Labour Market: 1995 -2004
55

Table 23: Employment Equations using the Broad Definition of Unemployment, 1995 and 2004
Source: OHS 1995, LFS 2004:2 (Statistics SA); own calculations.Notes: * Significant at the five per cent level.** Significant at the one per cent level.
In 1995, 15 to 24 year olds were least likely to find employment relative to their oldercounterparts, all age-group coefficients being positive and statistically significant, except thecoefficient for 55 to 65 year olds which is insignificant. In 1995, individuals between 35 and 44years of age were 21 per cent more likely to be employed than their 15 to 24 year oldcounterparts. Interestingly, this general situation had changed somewhat by 2004. Firstly, thecoefficient for 24 to 35 year olds is no longer statistically significant, meaning that 24 to 35year olds were, ceteris paribus, no more or less likely to find employment than their youngercounterparts. Further, the coefficients of the 34 to 44 year age-group declined significantlyover the period. In 2004, 35 to 44 year olds were only 2.5 per cent more likely than 15 to 24year olds to be employed (down from 21 per cent). In contrast, the coefficient for 45 to 54 yearolds indicates that they were 16.5 per cent more likely than 15 to 24 year olds to be employed(up marginally from 15.0 per cent). Interestingly, the positive and significant coefficient for 55to 65 year olds indicated that these individuals were 11.8 per cent more likely than 15 to 24year olds to be employed.
DPRU Working Paper 06/103 Morné Oosthuizen
56
1995 2004Marginal Effects x-bar Marginal Effects x-bar
25-34 years 0.1623 ** 0.2370 0.0239 0.269635-44 years 0.2143 ** 0.1909 0.1288 ** 0.177645-54 years 0.1496 ** 0.1204 0.1651 ** 0.131455-65 years 0.0000 0.1042 0.1177 ** 0.0972Coloured 0.0988 ** 0.1000 0.1152 ** 0.0913Asian 0.0954 ** 0.0330 0.1871 ** 0.0281White 0.1046 ** 0.1423 0.2290 ** 0.1054Female -0.2005 ** 0.5122 -0.1347 ** 0.5163Western Cape 0.1030 ** 0.1151 0.0752 ** 0.1067Northern Cape 0.0196 0.0215 -0.0159 0.0194Free State 0.1272 ** 0.0681 0.0382 ** 0.0654KwaZulu-Natal 0.0384 ** 0.1974 0.0090 0.2035Gauteng 0.1469 ** 0.2018 0.0500 ** 0.2136North West 0.0557 ** 0.0849 -0.0190 * 0.0815Mpumalanga 0.0421 ** 0.0658 0.0558 ** 0.0661Limpopo -0.0320 ** 0.1065 -0.0368 ** 0.1068No education to Grade 6 -0.0119 ** 5.1514 -0.0253 ** 5.3573Grade 7 -0.0491 ** 0.7404 -0.0189 * 0.7756Grade 8 to Grade 11 -0.0209 ** 2.0347 -0.0195 ** 2.1952Grade 12 0.1253 ** 0.2580 0.0763 ** 0.2945Diploma 0.1344 ** 0.0827 0.2398 ** 0.0750Degree -0.0118 0.0533 0.0007 0.0822lambda -0.3811 ** 0.8762 -0.3960 ** 0.6400
Observed Probability 0.4745 0.3959Predicted Probability (at x-bar) 0.4481 0.3618Number of Observations 64627 67946Chi 28132.2 19466.91Pseudo R 0.3146 0.2134

In terms of race, all coefficients in both years are significantly positive, indicating that in bothperiods, Africans were least likely to be employed, ceteris paribus. In 1995, the coefficientsfor Coloureds, Asians and Whites were of similar magnitudes. However, by 2004, the gapbetween Africans and other race groups had widened, with the Coloured, Asian and Whitecoefficients higher than in 1995. Thus, in 2004, Whites were 23 per cent, Asians about 19 percent and Coloureds 11.5 per cent more likely than Africans to be employed. This is adisturbing trend that is manifested in rapidly rising unemployment rates amongst Africans,detailed earlier. Females were also less likely to be employed than males in both years,although it appears that this effect may be weakening as evidenced by the decline in the sizeof the coefficient from -0.2005 to -0.1347.
Location does seem to play a role in terms of the probability of being employed, although itseffect appears to be weakening. In 1995, only Limpopo residents were less likely thanEastern Cape residents to be employed. The coefficients of all other provinces werestatistically significant and positive, except for the Northern Cape whose coefficient was notsignificant. Gauteng, the Free State and the Western Cape had the highest coefficientvalues. By 2004, however, Eastern Cape residents were more likely to be employed thanboth Limpopo and North West residents, while their chances of employment were similar tothose of individuals in the Northern Cape and KwaZulu-Natal. Although the residents of theremaining provinces were more likely to be employed, the size of the coefficients was muchreduced. For example, in 1995, Gauteng had the highest coefficient at 0.1469 compared tothe highest coefficient in 2004 of a mere 0.0752 for the Western Cape. This seems toindicate a slow process of gradual normalisation in the labour market, with respect tolocation, with a narrowing of the range of coefficients, given that the provinces with thelowest probabilities of employment were also those provinces with the greatest homelandpopulations in 1995.
Finally, in terms of education, the splines indicate that levels of education below matric areassociated with lower likelihoods of finding employment. This is observed in both periods.The rapid increase in unemployment amongst holders of matric certificates is reflected herein the weakening of the positive coefficient of the Grade 12 variable. In 1995, the coefficientwas 0.1253, but this declined to 0.0763 in 2004. In contrast, the value of tertiary education inhelping individuals find employment appears to have strengthened, with a substantialincrease of the coefficient from 0.1344 in 1995 to 0.2398 in 2004. Interesting, though, is theinsignificance of the coefficients of Degree in both years. This indicates that having a degreedoes not raise one’s probability of employment above the probability of employment if onehas a diploma. Nevertheless, as mentioned, having a diploma has a significant positiveimpact on the probability of employment relative to having a matric certificate.
The labour market has therefore clearly been changing over the period. This is evidenced by the changes in the effects of the variables included in the probits. For example, genderappears to be playing less of a role in the employment equation in 2004 compared to 1995,although the same cannot be said of race. The current skills shortage is also detected in the
The Post-Apartheid Labour Market: 1995 -2004
57

increased effect of tertiary education within the employment equation. Such changes areimportant to monitor to help ensure that employment promotion policies are targeted atproperly identified problems.
6. Conclusion
The South African economy today, like that of 1995, faces some important challenges.Probably the most important, and one which has characterised the economies of both 1995and 2005, is the challenge of generating job opportunities in sufficient numbers so as to firsthalt the rise in unemployment and then reduce it. It has been shown that, while not jobless,economic growth has been unable to provide the necessary employment opportunitiesrequired by population growth and rising labour force participation rates, resulting in a rapidlyrising rate of unemployment, which stands at 41.0 per cent of the labour force. Actual labourabsorption has been far lower than the rates required just to keep unemployment levelsconstant.
Equality in the labour force is still a far way off in terms of access to employment.Unemployment is concentrated in specific demographically and geographically definedgroups. Thus, those worst affected by unemployment are African, female, poorly educated,and the young (15 to 24 year olds specifically). Provinces with relatively greater ruralpopulations are the worst hit regions. Even amongst groups who, in the past, would havefound employment relatively easily, for example Whites or highly educated people, jobs havebecome relatively scarcer. Unemployment in 2005 is also quite a permanent feature of life formany individuals, with almost eight in ten unemployed individuals having been unemployedfor more than three years or having never had a job at all. This phenomenon has seriousimplications for the human capital of these individuals as extended periods of unemploymenterode their skills or make their skills outdated, reducing their chances of re-employment evenfurther.
The paper has found there to be a rapidly growing number of unemployed workers withrelatively high levels of education (specifically matric and tertiary qualifications), despite the1995-2004 period seeing a continuation of previous employment trends biased towardstertiary sectors and more highly skilled and better educated workers. This problem isparticularly acute amongst Africans, which seems to indicate perceived differences in qualityof graduates from different race groups and may relate more to perceptions of inferior qualityof education provided at historically disadvantaged tertiary education institutions. Thus,despite a skills shortage in South Africa, there are increasing numbers of highly educatedpeople without employment. This represents one of the most important challenges facinggovernment: ensuring that the education system produces the mix of skills required by thelabour market, as well as ensuring quality education at all educational institutions. However,addressing these problems may still be insufficient as employers may still havemisconceptions and stereotypes about certain institutions in terms of education quality.Further investigation of institutions that award non-degree tertiary qualifications may be in
DPRU Working Paper 06/103 Morné Oosthuizen
58

order, given the fact that it is particularly graduates of these institutions who are unable to findemployment.
The labour market, as stated earlier, is an exceedingly important factor market with changesin it impacting on the lives of millions of people. It is also, arguably, one of the key arenas inwhich the success of shared growth policies will be determined. In terms of the labourmarket, access to incomes via employment and the generation of suitable employmentopportunities are critical for the sharing of growth. The analysis above, however, has shownthat whether an individual is employed or unemployed is related to a number of possiblecharacteristics of that person, including race, gender, age, location, and level of education,and that employment growth has not been evenly spread across all characteristics. Further,due to growing levels of ‘unemployability’ and their marginalisation in households with littleor no access to wage income, the unemployed are even less likely to be able to access thebenefits of economic growth. Of the jobs that were created over the period, it is important toremember that many were created in the informal sector, where jobs are often of low qualityand are less stable and lower paying than formal sector jobs. Successfully sharing growthrequires that those who previously did not benefit from economic growth are drawn in fromthe periphery and helped to engage effectively with the economy, via the labour market inparticular. In other words, the successful and sustainable sharing of growth will at least partly succeed or fail based on the extent to which employment opportunities are equitablyprovided to all members of society. It is clear, however, that this is an immense task, but onethat must be met with the full focus of our efforts.
The Post-Apartheid Labour Market: 1995 -2004
59

References
Altman, M., 2003. Employment Trends and Policy Implications. Paper presented at the TIPS/DPRU Conference, September 8-10. Johannesburg.
Bhorat, H., 2003a. Employment and Unemployment Trends in Post-Apartheid South Africa.Paper prepared for the Presidency Ten-Year Cabinet Review Process.
, 2003b. The Post-Apartheid Challenge: Labour Demand Trends in the South African Labour Market, 1995-1999. Development Policy Research Unit Working Paper No. 03/82. Available [online]: http://www.commerce.uct.ac.za/dpru/WorkingPapers/wpapers.asp.
Bhorat, H., & Leibbrandt, M., 2001. Modelling Vulnerability and Low Earnings in the South African Labour Market. In: Bhorat, H., Leibbrandt, M., Maziya, M., Van der Berg, S. and Woolard, I. Fighting Poverty: Labour Markets and Inequality in South Africa.Cape Town: UCT Press.
Casale, D., & Posel, D., 2002. The Continued Feminisation of the Labour Force in South Africa: An Analysis of Recent Data and Trends. South African Journal of Economics70(1): 156-184. March.
Fedderke, J.W., & Mariotti, M., 2002. Changing Labour Market Conditions in South Africa: A Sectoral Analysis of the Period 1970-1997. South African Journal of Economics70(5): 830-864.
Fields, G., Leibbrandt, M., & Wakeford, J., 2000. Key Labour Market Elasticities in South Africa. Research report for the South African Department of Finance (now National Treasury).
Loots, E., 1998. Job Creation and Economic Growth. South African Journal of Economics66(3): 319-336.
Mahadea, D., 2003. Employment and Growth in South Africa: Hope or Despair? SouthAfrican Journal of Economics 71(1): 21-48.
Moolman, E., 2003. An Econometric Analysis of Labour Demand at an Industry Level in South Africa. TIPS Working Paper Series WP5-2003. Available [online]: http://www.tips.org.za/research/papers/getpaper.asp?id=679
Muller, C., 2003. Measuring South Africa’s Informal Sector: An Analysis of National Household Surveys. Development Policy Research Unit Working Paper No. 03/71.Available [online]: http://www.commerce.uct.ac.za/dpru/WorkingPapers/wpapers.asp.
DPRU Working Paper 06/103 Morné Oosthuizen
60

National Treasury (formerly Department of Finance), 1996. Growth, Employment andRedistribution: A Macroeconomic Strategy. Pretoria: Government Printers.
Oosthuizen, M. J., 2003. Expected Labour Demand in South Africa: 1998-2003.Development Policy Research Unit Working Paper No 03/81. Available [online]: http://www.commerce.uct.ac.za/dpru/WorkingPapers/wpapers.asp.
Oosthuizen, M. J., & Bhorat, H., forthcoming. The Post-Apartheid Labour Market.In: Bhorat, H. and Kanbur, R. (eds), Poverty and Policy in Post-Apartheid South Africa.
, 2004. The Post-Apartheid South African Labour Market. SAGA Working Paper No. 176. Available [online]: http://www.saga.cornell.edu/saga/workpap.html.
Page, J., 2005. Strategies for Pro-Poor Growth: Pro-Poor, Pro-Growth or Both? Paper presented at “African Development and Poverty Reduction: The Macro-MicroLinkage”, the DPRU/TIPS Forum, hosted in association with Cornell University, Cape Town, 13-15 October 2004.
SARB, 2005. Quarterly Bulletin. No 236. September.
Sellars, C., 2000. Unemployment, Policy and Social Partnership. South African Journal of Economics 68(3): 484-513.
Statistics South Africa, 2004a. Gross Domestic Product. Statistical Release P0441. Pretoria: own publication. Available [online]: http://www.statssa.gov.za.
, 2004b. Labour Force Survey: September 2003. Statistical Release P0210. Pretoria: own publication. Available [online]: http://www.statssa.gov.za.
, 2002. Survey of Employment and Earnings, December 2002. Statistical Release P0271. Pretoria: own publication.
, 2000. October Household Survey 1999. Statistical Release P0317. Pretoria: own publication.
, various years. Labour Force Survey. Pretoria: own publication. Dataset.
, 1995. October Household Survey 1995. Pretoria: own publication. Dataset.
The Post-Apartheid Labour Market: 1995 -2004
61
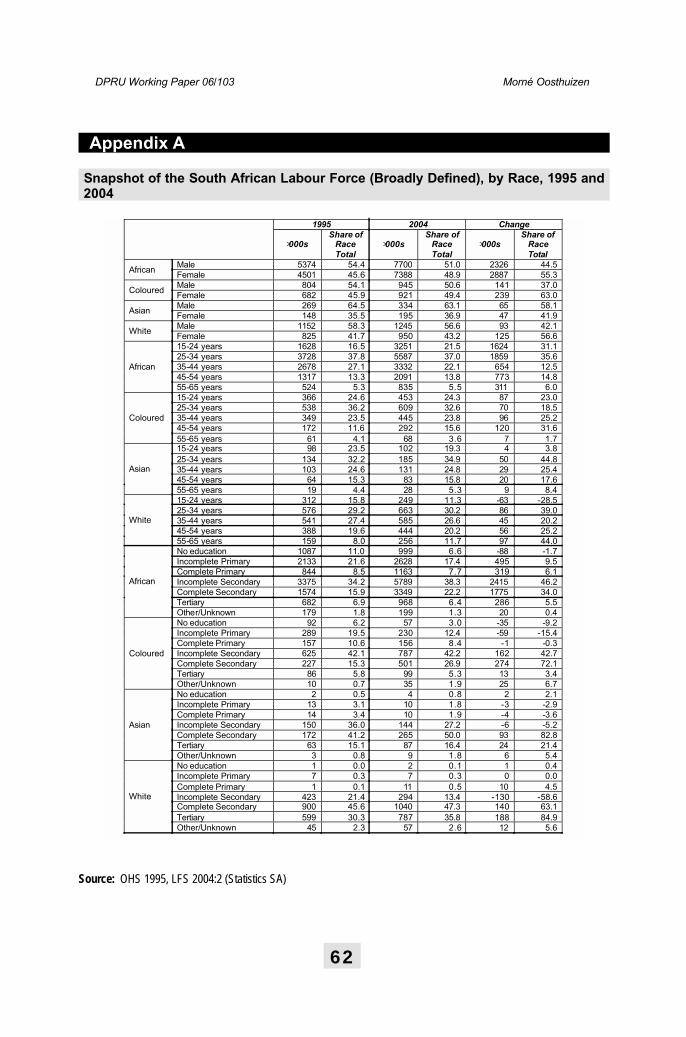
DPRU Working Paper 06/103 Morné Oosthuizen
Appendix A
Snapshot of the South African Labour Force (Broadly Defined), by Race, 1995 and2004
Source: OHS 1995, LFS 2004:2 (Statistics SA)
62
1995 2004 Change
>000sShare of
RaceTotal
>000sShare of
RaceTotal
>000sShare of
RaceTotal
Male 5374 54.4 7700 51.0 2326 44.5African
Female 4501 45.6 7388 48.9 2887 55.3Male 804 54.1 945 50.6 141 37.0
ColouredFemale 682 45.9 921 49.4 239 63.0Male 269 64.5 334 63.1 65 58.1
AsianFemale 148 35.5 195 36.9 47 41.9Male 1152 58.3 1245 56.6 93 42.1
WhiteFemale 825 41.7 950 43.2 125 56.615-24 years 1628 16.5 3251 21.5 1624 31.125-34 years 3728 37.8 5587 37.0 1859 35.635-44 years 2678 27.1 3332 22.1 654 12.545-54 years 1317 13.3 2091 13.8 773 14.8
African
55-65 years 524 5.3 835 5.5 311 6.015-24 years 366 24.6 453 24.3 87 23.025-34 years 538 36.2 609 32.6 70 18.535-44 years 349 23.5 445 23.8 96 25.245-54 years 172 11.6 292 15.6 120 31.6
Coloured
55-65 years 61 4.1 68 3.6 7 1.715-24 years 98 23.5 102 19.3 4 3.825-34 years 134 32.2 185 34.9 50 44.835-44 years 103 24.6 131 24.8 29 25.445-54 years 64 15.3 83 15.8 20 17.6
Asian
55-65 years 19 4.4 28 5.3 9 8.415-24 years 312 15.8 249 11.3 -63 -28.525-34 years 576 29.2 663 30.2 86 39.035-44 years 541 27.4 585 26.6 45 20.245-54 years 388 19.6 444 20.2 56 25.2
White
55-65 years 159 8.0 256 11.7 97 44.0No education 1087 11.0 999 6.6 -88 -1.7Incomplete Primary 2133 21.6 2628 17.4 495 9.5Complete Primary 844 8.5 1163 7.7 319 6.1Incomplete Secondary 3375 34.2 5789 38.3 2415 46.2Complete Secondary 1574 15.9 3349 22.2 1775 34.0Tertiary 682 6.9 968 6.4 286 5.5
African
Other/Unknown 179 1.8 199 1.3 20 0.4No education 92 6.2 57 3.0 -35 -9.2Incomplete Primary 289 19.5 230 12.4 -59 -15.4Complete Primary 157 10.6 156 8.4 -1 -0.3Incomplete Secondary 625 42.1 787 42.2 162 42.7Complete Secondary 227 15.3 501 26.9 274 72.1Tertiary 86 5.8 99 5.3 13 3.4
Coloured
Other/Unknown 10 0.7 35 1.9 25 6.7No education 2 0.5 4 0.8 2 2.1Incomplete Primary 13 3.1 10 1.8 -3 -2.9Complete Primary 14 3.4 10 1.9 -4 -3.6Incomplete Secondary 150 36.0 144 27.2 -6 -5.2Complete Secondary 172 41.2 265 50.0 93 82.8Tertiary 63 15.1 87 16.4 24 21.4
Asian
Other/Unknown 3 0.8 9 1.8 6 5.4No education 1 0.0 2 0.1 1 0.4Incomplete Primary 7 0.3 7 0.3 0 0.0Complete Primary 1 0.1 11 0.5 10 4.5Incomplete Secondary 423 21.4 294 13.4 -130 -58.6Complete Secondary 900 45.6 1040 47.3 140 63.1Tertiary 599 30.3 787 35.8 188 84.9
White
Other/Unknown 45 2.3 57 2.6 12 5.6

Appendix B
Gross Value Added and Employment Growth by Sector, 1995-2004: Skilled Workers
Gross Value Added and Employment Growth by Sector, 1995-2004: Semi-Skilled Workers
The Post-Apartheid Labour Market: 1995 -2004
63
Utilities
Agric
Mfg
Construction
TradeTransp. & Comm.
Finance
CSP
-14.0-12.0-10.0-8.0-6.0-4.0-2.00.02.04.06.08.0
10.012.014.016.018.020.022.024.026.028.0
0.0 1.0 2.0 3.0 4.0 5.0 6.0 7.0 8.0
Average Annual Gross Value Added Growth (%)
CSP
Agric
Mfg
Utilities
Construction
Trade
Transp. & Comm.
Finance
-14.0-12.0-10.0
-8.0-6.0-4.0-2.00.02.04.06.08.0
10.012.014.016.018.020.022.024.026.028.0
0.0 1.0 2.0 3.0 4.0 5.0 6.0 7.0 8.0
Average Annual Gross Value Added Growth (%)

Gross Value Added and Employment Growth by Sector, 1995-2004: Unskilled Workers
Source: OHS 1995, LFS 2004:2 (Statistics SA).
DPRU Working Paper 06/103 Morné Oosthuizen
64
CSP
Agric
Mfg
Utilities
Construction
Trade
Transp. & Comm.
Finance
-14.0-12.0-10.0
-8.0-6.0-4.0-2.00.02.04.06.08.0
10.012.014.016.018.020.022.024.026.028.0
0.0 1.0 2.0 3.0 4.0 5.0 6.0 7.0 8.0
Average Annual Gross Value Added Growth (%)

Appendix C
Unemployment by Race and Gender, 1995-2004
Source: OHS 1995, LFS 2004:2 (Statistics SA).Notes: Standard errors are in parentheses, and are corrected for according to frequency weights, the primary sampling
unit and, in the case of 2004, sampling stratification.
The Post-Apartheid Labour Market: 1995 -2004
65
1995Male Female Total
African 29.5 (1.092) 47.6 (1.119) 37.8 (1.060)Coloured 17.9 (1.027) 28.4 (1.548) 22.8 (1.122)Asian 10.0 (1.406) 20.6 (2.989) 13.8 (1.798)White 3.7 (0.318) 8.7 (0.729) 5.8 (0.386)Total 23.7 (0.925) 39.6 (1.168) 30.8 (1.004)
2004Male Female Total
African 40.1 (0.688) 55.9 (0.610) 47.8 (0.522)Coloured 25.8 (1.766) 35.1 (1.799) 30.4 (1.565)Asian 17.2 (2.434) 27.1 (4.351) 20.8 (2.387)White 7.0 (0.832) 9.8 (1.111) 8.3 (0.695)Total 33.9 (0.628) 48.6 (0.654) 41.0 (0.554)