the politics of development in the aftermath of britain's glorious
TRANSCRIPT
0
The Politics of Development in the Aftermath of Britain’s
Glorious Revolution
Dan Bogart
Department of Economics, UC Irvine, [email protected]
And
Robert Oandasan
Compass Lexecon, [email protected]
This Draft February 2013
Abstract
Economic development often generates conflict which can then undermine further economic
growth. In Britain after the Glorious Revolution the two main political parties, the Whigs and
Tories, had to mediate between opposing interests when deciding whether to approve large and
controversial infrastructure projects. Focusing on river navigation companies, we provide
evidence that politics biased approval decisions and the promotion of projects. However, we also
offer evidence that developmental or efficiency considerations were just as important in
determining approval and promotion. The results yield insights on why Britain was poised to
industrialize in the 1700s.
1 We would like to thank Thomas Wheeler, Amanda Compton, and Alina Shiotsu for providing valuable research
assistance. We also thank Stergios Skepardis, John Wallis, Steve Nafziger, David Chambers, and Gary Richardson
for helpful comments. Also we thank participants at the Caltech Early modern group 2012, the 2012 ISNIE
meetings, the Western Economic Association meetings, and seminar participants at UC Irvine, Lund University,
Oxford university, University of Edinburgh, Cambridge University, University of Arizona, UCLA, and the Institute
for Historical Research for their comments. All errors are our own.

1
I. Introduction
By the early 1700s Britain’s economy was on a path to industrialization. Real wages were rising,
domestic and international trade was expanding, and technological change was beginning.
Scholars have long wondered what made Britain special. One popular explanation emphasizes its
system of checks and balances and representative government. The Civil Wars of the mid-1600s
and the Glorious Revolution of 1688-9 weakened the Monarchy and solidified a strong and
active Parliament. It the wake of these events, investment flourished especially in sectors closely
tied to central government politics. 2 Although the literature’s focus on ‘constraining the
executive’ is revealing, it does not explain why conflicts between interest groups failed to stall
Britain’s development. For example, the East India Company and the Bank of England fought
with groups challenging their monopoly powers. In the infrastructure sector—the focus of this
paper—cities and developers sought to expand the network of navigable rivers, but they were
opposed by groups fearing property damage and trade diversion. Contests like these over
economic rents had great consequences for Britain’s subsequent growth.
Britain is not unique in experiencing conflict over development. In rich and poor
countries alike there are conflicts between incumbent firms and entrants, between planning
ministers and cities, between property owners and transportation authorities, and so on.
Governments are often called upon to resolve these conflicts making politics inevitably inter-
twined with development. One might expect that politicians will resolve disputes with political
objectives in mind. Following the logic of distributive politics, politicians could target approvals
or rejections over controversial projects to constituencies with core supporters or where there
2 The seminal paper on institutions is North and Weingast (1989). For more recent studies see Clark (1996), Wells
and Wills (2000), Klerman and Mahoney (2005), Zahedia (2011), Cox (2011), and Bogart (2011). For broader
discussion of Britain’s development see Allen (2011) and Mokyr (2009).

2
was recently a close election. On the other hand, there are settings where politicians place greater
weight on efficiency considerations. We investigate what type of politicians Britain had in the
decades following the Glorious Revolution.
Political parties are central to Britain’s politics in this period.3 The Whig and Tory
parties disagreed over religious, constitutional, and fiscal issues. They traded places as the
majority party in the House of Commons seven times between 1690 and 1715. They also
competed vigorously at the local level resulting in an unprecedented number of contested
elections. One of the key economic policy decisions concerned improvements in river
navigation. After 1689 it was increasingly common for acts of Parliament to grant river
navigation companies’ rights to levy tolls on barges and vessels, purchase land, and issue capital
to pay for improvements. Local groups like city mayors promoted projects through parliamentary
bills and often were named as trustees or owners of navigation companies. Their success is
indicated by the doubling of navigable waterways from 1660 to 1750 and the growth of internal
trade (Willan 1962). While many river navigation projects were beneficial to the economy, they
were also controversial. Powerful vested interests argued for the rejection of navigation bills in
Parliament and some succeeded.
We develop a theoretical framework to analyze a promoter’s decision to introduce a bill
for river navigation in Parliament and an opposition group’s decision to fight the bill. Our model
combines theories of persuasion and conflict (i.e. Skeperdas and Vaidya 2012) with
redistributive politics (i.e. Cox and Mcubbins 1986; Dixit and Londregan 1996). The expected
value of promoting and opposing depends on the benefits and costs of the project as well as the
3 See Holmes (1987), Horrowitz (1977), Harris (1993), Hoppit (2000), Pocock (1985), Davison et. al. (1992), Pincus
(2011), and Stasavage (2003).
3
bias towards promoters and opposition groups among the ruling political party. Our assumption
that ruling parties were biased to opposition groups in areas where they were more strongly
represented yields a testable prediction that greater ruling party strength near a constituency
lowered the probability it had a river navigation act and increased the probability of opposition.
We get similar predictions under the assumption that greater political competition near a
constituency encouraged politicians to favor opposition groups. The model also incorporates the
identity of the party in power. The assumption that the Whigs favored certain promoters implies
that acts were more probable under Whig majorities in the Commons.
We test our theories using new data on the party affiliation of all Members of Parliament
(MPs) representing municipal boroughs and county constituencies in the House of Commons
between 1690 and 1741. We also use the History of Parliament series (Cruickshanks, Handley,
and Hayton 2002 and Sedgwick 1970) to identify whether constituencies had contested elections.
With this information we construct measures of ruling party strength and political competition in
a constituency and its neighbors. From another data source we know which constituencies had
river improvement bills within their boundaries in each parliamentary session, which succeeded
and became acts of Parliament, and who promoted, supported, and opposed bills through
petitions. Measures of the market potential and locational characteristics of constituencies are
used to control for economic determinants of navigation projects.
The baseline model relates the probability of a river act or river bill occurring in a
constituency to its economic and political characteristics, like the number of ruling party MPs
and the number of contested elections near the constituency. The results consistently show that
having more ruling party MPs lowers the probability of a river act occurring in a constituency.
The same result holds for river bills and under other specifications including fixed effects.
4
Consistent with this finding we show that opposition to river navigation bills was more likely in
constituencies where the ruling party was strong. Together these two findings suggest that
promoters were reluctant to introduce bills where opposition groups could use their leverage with
the ruling party to block the bill.
Regarding the party in power, we find that parliaments where the Whigs had the majority
are associated with more river acts from 1690 to 1715 but not afterwards. Moreover we find that
when the Tories were in power their main political supporters, the landowning interest, were
more likely to promote bills and when the Whigs were in power, merchants were more likely to
introduce bills. Lastly we find that more contested elections lowered the probability of acts, but
the results are not always significant.
Our general conclusion is that Britain did not succeed economically in the aftermath of
the Glorious Revolution because it politicians were immune to the rent-seeking pressures of
vested interests. They responded to these pressures as did political actors in other settings where
development did not occur. Our results also cast doubt on the argument that the Whig party
contributed to Britain’s development over the long-run (see Pincus 2009 and Pincus and
Robinson 2012). Although the Whig party was generally favorable to river navigation projects
before 1715, they appear to have been more sensitive to the concerns of opposition groups and
thus their effect on river navigation projects was largely neutral.
What made Britain distinctive then? Our results suggest that the high degree of party
turnover was significant. Constituencies rarely remained under ruling party control for long and
therefore few experienced prolonged barriers to entry. Britain’s political actors also behaved as
though economic efficiency and growth were important considerations when making decisions

5
about project approval. MPs listened to economic arguments and sometimes followed the
recommendations of local groups and experts. Consistent with this view we find that river
navigation acts were more likely in constituencies with greater market potential. This latter
finding is quite significant because market potential is a key indicator of the social gains from
river navigation projects. In our view one of the most remarkable aspects of British politics in the
eighteenth century was its responsiveness to economic demands. Other work reaches a similar
conclusion when studying a broad range of economic legislation (Bogart and Richardson 2011).
Lastly, our results speak to theories related to open access. North, Wallis, and Weingast
(2009) argue that open access to markets and organizations is rare throughout history. In their
view, the natural state is one in which access is limited to prevent violence and maintain stability
between rival elites. We contribute to this literature in two ways. First, we develop a theoretical
and empirical framework to test whether a society is open or limited access. In our model open
access implies the irrelevance of political characteristics like ruling party strength. Second, as we
reject the previous condition we show that Britain was not open access in the aftermath of the
Glorious Revolution. However, as we note above, limits on access were not as substantial
because of party turnover and because great weight was placed on project benefits and costs.
The rest of the paper is organized as follows. The second section provides background
and the third lays out a theoretical framework. Section four discusses the data and five outlines
the estimation strategy. The empirical results follow along with some conclusions.
II. Background
The Glorious Revolution of 1688 marked a significant turning point in the political history of
Britain. Over the next two decades the House of Commons and Lords solidified a key role for
6
Parliament in governing the country. The House of Commons, in particular, developed the fiscal
and implicit constitutional power to check the authority of the Monarchy. The transition to
‘limited’ government was not harmonious and exposed divisions within British society. The
most poignant example is the conflict between the Whigs and Tories. Although both were drawn
from the elite of British society, the Whigs and Tories differed in several ways. First, the Tories
favored privileges for the Church of England, lower taxes, and small government debt. The
Whigs generally favored religious toleration and an aggressive foreign policy based on a well-
funded army. Second, the two parties differed in terms of their economic base. The Tories were
generally supported by landowners, while the Whigs drew more support from financial and
merchant interests. Third, the Whigs were led by a small group of party mangers known as the
‘Junto.’ They were particularly effective in mobilizing Whig MPs on key votes in the Commons.
Robert Harley is the best known leader of the Tories and was influential throughout the period.
Robert Walpole emerged as the new leader of the Whig party in the early 1720s following a split
amongst its leadership. Walpole’s rise marked the beginning of a long period of Whig
dominance lasting up to the 1760s.
From 1690 to 1715, the Whigs and Tories competed vigorously for seats in what historians
have described as the ‘Rage of Party.’ There were eleven elections and the majority party in the
Commons changed at least seven times (see table 1). Contested elections were also common. A
contested election is defined as an election with more candidates than seats. It was typical for a
constituency represented in the Commons to have two MPs and in these cases a contested
election had at least three and normally four candidates, often from opposing parties. The data
collected by Cruickshanks, Handley, and Hayton (2002) and Sedgwick (1970) published in the
History of Parliament show that the average parliament lasted a little over three years and 40
7
percent of the constituencies had their last election or by-election contested. Although 40 percent
does not seem like a high number, it was large compared to other periods in British history and it
was certainly high compared to other parts of Europe where representative institutions were
dormant (Bosker, Buringh, and Luiten van Zanden, 2011).
Table 1: Parliament and the Majority Party 1690-1741
Parliament Majority Party
Percentage of
constituencies where last
election was contested
1690-1695 Tory 46
1695-1698 Whig 35
1698-1700 Whig 43
Jan. 1701 Tory 35
Nov. 1701 Whig 34
1702-1705 Tory 36
1705-1708 Tory 44
1708-1710 Whig 38
1710-1713 Tory 50
1713-1715 Tory 36
1715-1722 Whig 47
1722-1727 Whig 54
1727-1734 Whig 47
1734-1741 Whig 48
Sources: Majority Party and contested elections are from Cruickshanks, Handley, and Hayton (2002) and
Sedgwick's (1970).
Notes: Percentage of constituencies with contested elections applies to England and Wales only.
Much of the literature on British political history in the aftermath of the Glorious Revolution
discusses how religious, constitutional, and fiscal policies were influenced by the relative
strength of the two parties in the Commons.4 For example, Stasavage (2003, 2007) shows that
government bond yields were generally higher in years when the Tories had a majority in the
4 See Holmes (1987), Horrowitz (1977), Harris (1993), Hoppit (2000), Pocock (1985), Davison et. al. (1992), Pincus
(2011).
8
Commons. Stasavage argues that government bondholders were a key part of the Whig coalition
and therefore the eventual dominance of the Whigs mattered for the credibility of sovereign debt.
Pincus and Robinson (2012) argue more strongly for the importance of the Whigs. In their view,
“The Tories would not have created the Bank of England, an institution that provided crucial
loans to new manufacturing initiatives. Tories would not have wanted a standing parliament that
could legislate over such a wide swath of social and economic life. The Tories would not have
passed the series of turnpike acts, for example, that did so much to improve Britain’s economic
infrastructure.”
We investigate the hypothesis that the Whigs favored a program of economic modernization
by studying river navigation acts—a key example of legislation changed Britain’s economic life
after 1689.5 River navigation acts are notable because they enabled the first significant
improvement in Britain’s transport infrastructure since the Middle Ages. In the early 1600s, most
rivers were under the authority of local governing bodies known as Sewer Commissions. Sewer
Commissions could compel landowners to cleanse waterways and could tax land along
riverbanks to pay for upkeep, but not tax individuals who traveled on the river and could not
purchase land along a waterway or divert its course. These limitations kept commissions from
improving and extending navigable waterways (Willan 1964). A river navigation act addressed
these problems by establishing a new special purpose organization. It endowed a company of
‘undertakers’ with rights to levy tolls and purchase land necessary for the project. The tolls were
subject to a price cap and there were conditions on how the project was to be carried out. There
were also provisions that allowed juries to determine the price of land if companies and property
owners could not come to an agreement.
5 See Hoppit (1997), Bogart (2011), and Bogart and Richardson (2011) for more on how the growth of
parliamentary legislation including the often discussed enclosures of the commons.
9
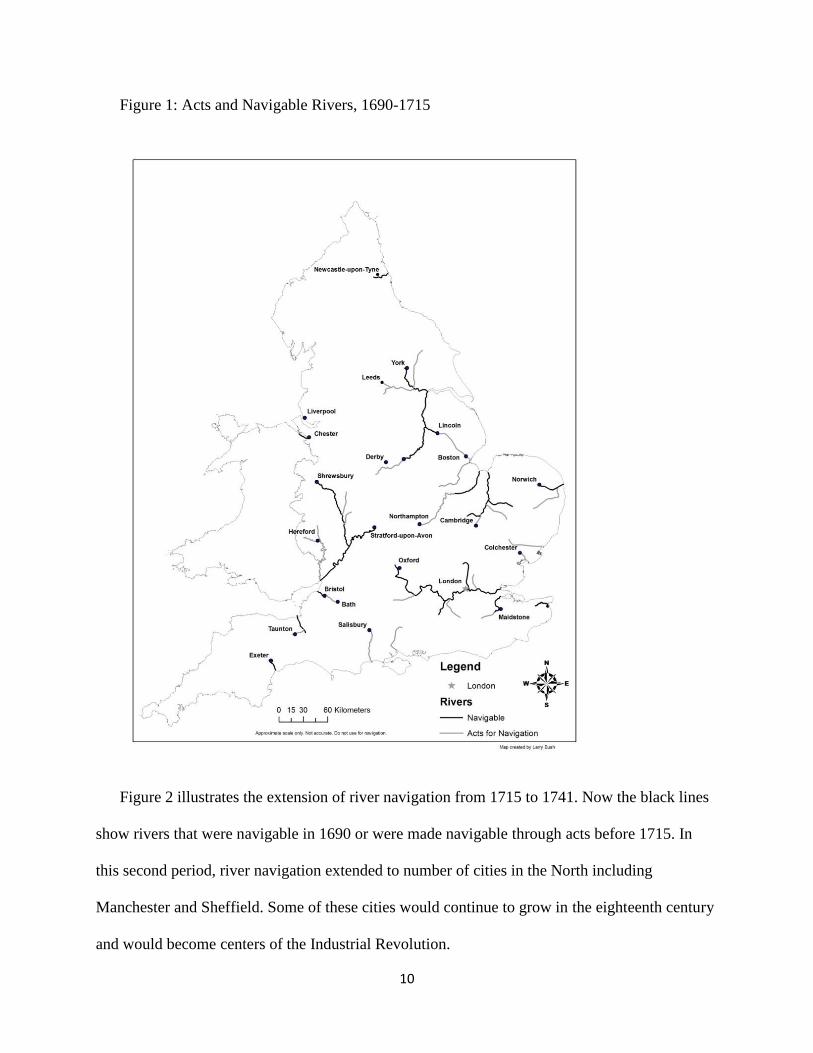
River navigation acts played a key role in the extension of inland waterways. With the aid of
their statutory powers, navigation companies dredged and straightened rivers resulting in
significantly lower transport costs. Freight rates on navigable rivers were approximately one-
third the freight rates by road in the early eighteenth century (Bogart 2012). For this reason, the
expansion of navigable waterways from 850 miles in 1660 to 1600 miles in 1750 was an
important factor in Britain’s early economic development. Figure 1 draws on Willan (1964) to
illustrate the extension of river navigation from 1690 to 1715. The black lines show rivers that
were navigable in 1690 and the grey lines depict rivers with acts enabling improvements in their
navigation. Acts were applied to rivers near the coast or as extensions of existing navigable
rivers. Many were connected to cities of importance in the early eighteenth century.
10
Figure 1: Acts and Navigable Rivers, 1690-1715
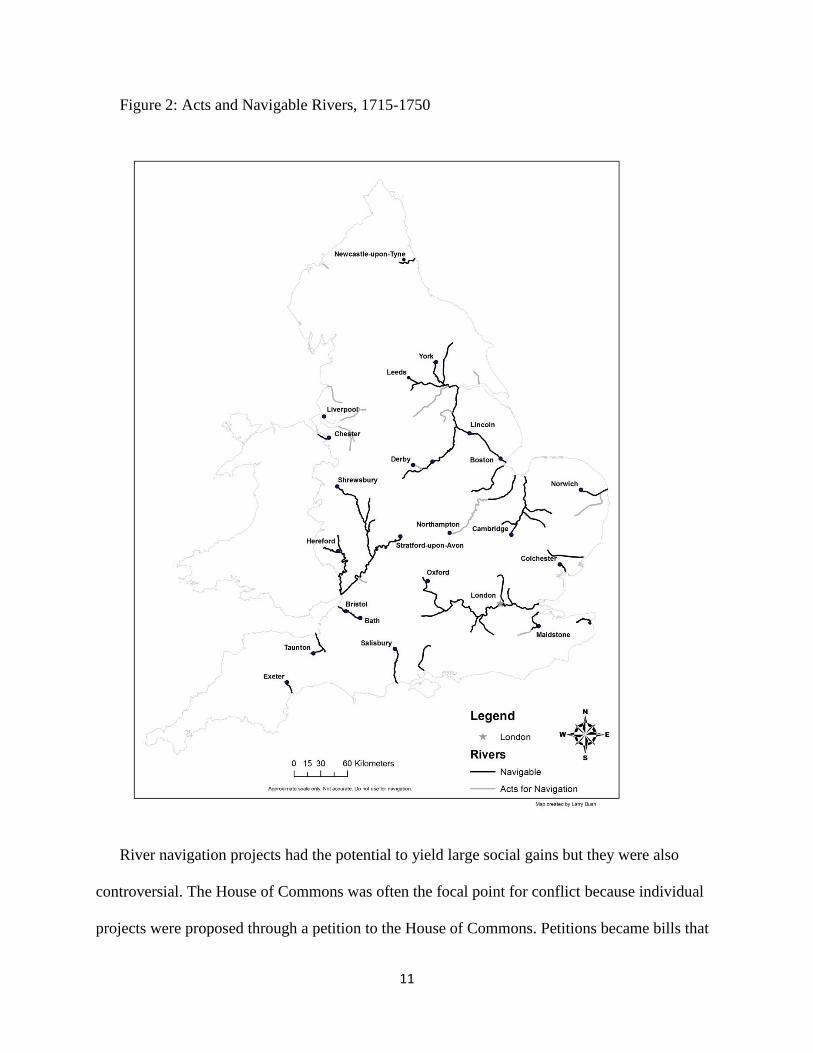
Figure 2 illustrates the extension of river navigation from 1715 to 1741. Now the black lines
show rivers that were navigable in 1690 or were made navigable through acts before 1715. In
this second period, river navigation extended to number of cities in the North including
Manchester and Sheffield. Some of these cities would continue to grow in the eighteenth century
and would become centers of the Industrial Revolution.
11
Figure 2: Acts and Navigable Rivers, 1715-1750
River navigation projects had the potential to yield large social gains but they were also
controversial. The House of Commons was often the focal point for conflict because individual
projects were proposed through a petition to the House of Commons. Petitions became bills that

12
would either fail or succeed in gaining approval, first by the Commons and then by the Lords and
Monarchy. Significantly, it was more common for river navigation bills to fail than succeed (see
table 2).6 The high failure rate partly reflects a handful of projects where bills failed and then
were reintroduced in the Commons. Some failed several times before succeeding and some never
passed.
Table 2: River Navigation Bills in the Commons, 1690-1739
1 2 3
Period Bills
% that
became
Acts
% that were formally
Opposed
1690-1699 25 30% 48%
1700-1709 12 25% 42%
1710-1719 16 19% 50%
1720-1729 11 72% 18%
1730-1739 13 38% 46%
Source: see text below.
Opposition was a key factor in the low success rate of river navigation bills. In total, 43
percent of river navigation bills between 1690 and 1739 were opposed by groups through
petitions to the House of Commons (see table 2). Opposition groups used a variety of arguments
including property damage, employment loss, and trade diversion. The River Avon bill provides
an example of their arguments. After a committee was formed in the House to consider the Avon
bill in January of 1712, there was a flurry of petitions opposing the bill or expressing concerns.7
Henry Parsons, who owned six mills on the river Avon, stated in a petition that his mills would
be rendered useless to the great loss of the poor and to himself. He prayed that ‘the bill may not
6 The sources for these tables will be discussed momentarily. It should also be noted that the failure rates are
consistent with what Hoppit (1997) has shown for all legislation from 1690 to 1739. 7 The details of the petitions related to this bill are available in the Journals of the House of Commons, 1712.

13
pass, or that such damages as the petitioner will sustain thereby may be made good to him by the
undertakers.’ The Mayor, Burgesses, and Common people of the city of Bristol stated that the
bill contained clauses that may be construed to interrupt their ancient Right, and encroach upon
the rights lately granted to the petitioners. The city had been given authority to make the Avon
navigable from Bristol to Hanham mills by an act of Parliament from a previous legislative
session. The gentlemen and freeholders of the county of Somerset, living near the River Avon,
stated the project will ‘be a great prejudice to all parts of the country near the Bath, by bringing
of corn, and other commodities, from Wales, and other parts, where the value of lands are low.’
They were also concerned about the ‘damages and trespasses they may sustain by making the
said River navigable.’ Similar arguments were made by the gentlemen and other inhabitants in
the neighboring counties of Wiltshire and Gloucester.
The arguments of opposition groups were countered by promoters and other supporters of
projects. Promoters would usually articulate the reasons why extending river navigation would
benefit the local area and the nation. For example, in the case of the river Avon the Mayor,
Aldermen, and citizens of the city of Bath argued that making the Avon navigable will employ
the poor, promote the trade of Bath, train persons for sea-service, and preserve the roads and
highways. After the Avon bill had been vigorously opposed by the groups discussed above the
freeholders, leaseholders, and occupiers of quarries near Bath submitted a petition in favor of the
bill arguing that it will ‘be a means to carry great quantities of wrought and unwrought stone
from the quarries near the said River into diverse parts of this kingdom.’
There are numerous other river navigation bills where promoters and their supporters argued
against opposition groups. Of equal importance there will several river bills that generated little
conflict in the Commons with only a single promoter advancing arguments in favor and no

14
opposition groups challenging its social utility. Therefore the level of opposition and support
needs to be explained. Our hypothesis is that party politics and local party representation
influenced the degree of opposition to bills and therefore influenced the promotion and approval
of river bills. A potential role for party politics has been noted by historians studying
parliamentary acts around 1700 but the issue has not been analyzed systematically (see Handley
1990, Hoppit 1996).
The structure of committees reviewing navigation bills provides one hint that parties
mattered. The committee stage was quite important as most bills that failed did so at this stage.
Using data from sources described in a later section we find that MPs on the committee are more
likely to come from the ruling party even after considering the overall proportion of ruling party
MPs in the Commons. For example, the two MPs who presented the river Avon bill to the House
of Commons in 1712 were Trotman and Codrington, both of whom represented the city of Bath
and were part of the Tory majority in the 1710-1713 Parliament. The over-representation of
ruling party MPs on committees suggests they were put there to serve someone’s interests. To
understand the role of politics better we propose a theoretical framework in the next section. It
gives a set of testable predictions that will help to explain some of the less obvious empirical
results that will follow.
III. Theoretical framework
Our theoretical analysis considers a setting where river navigation bills are promoted, opposed,
and either approved or rejected. The timing is as follows: a promoter decides whether to
introduce a bill, an opposition group decides whether to formally oppose the bill if introduced,
the promoter and opposition expend effort trying to persuade the Commons, who then approves

15
or rejects the bill. Every constituency has a single project with an exogenously given expected
financial return to the promoter b, a benefit to users coming from lower transport costs g, and
social losses to opposition groups l which we can think of as property damage or lost income
from trade diversion effects. If the project is approved then financial returns, user benefits, and
losses are realized otherwise all payoffs are normalized to 0. The social benefit to cost ratio for a
project is s=(b+g)/l. Efficient projects are those where s>1.
To study how politics and lobbying affected access to river navigation acts, we use a model
of persuasion developed by Skeperdas and Vaidya (2012). They motivate their model with a
court setting where plaintiffs and defendants produce evidence to influence a judge. Skeperdas
and Vaidya derive a tractable functional form for the probability a judge issues a guilty verdict
and show that it depends on three main factors: (1) the truth (actual innocence or guilt), (2) the
bias of the court, and (3) the plaintiff and defendant’s efforts in producing evidence.
There is a parallel to our setting where promoters and opposition groups made arguments to
MPs in the Commons trying to influence their decision on bills. Applying Skeperdas and
Vaidya’s model gives a function for the probability p that the Commons approves a bill:
, where is a function of the social benefit to cost ratio s,
corresponds to the bias of the Commons in favor of the project, and and are the
efforts of the promoter and opposition in producing evidence. Higher , higher , and more
effort by the promoter increases the probability of success all else equal. The efforts and
are endogenous and will be modeled momentarily. For the moment we focus on the two crucial
parameters and .

16
We think it is natural to assume that projects with higher benefits to costs will be more likely
to succeed all else equal. We let be a non-decreasing and differentiable function of where the
slope defines MPs increased preference for projects that have higher benefits to costs.
One could imagine that societies whose leaders try to balance development and efficiency would
exhibit a function that is more responsive to Other societies whose leaders are indifferent to
efficiency considerations would exhibit a function far less responsive to .
The parameter also relates to politics. If promoters operate in a world of open access then
would be constant for all, but if politics works to limit access then will vary with the promoter
and the constituency. We have three main channels in mind for the limited access setting. The
first involves party preferences. If the Whig party was more favorable to river navigation
projects then would be larger for all projects in years when the Whigs were the majority party
in the Commons. We call this the party preferences effect. Second, if a promoter has stronger
links with one party, say the Whigs, then would be larger for that promoter when the Whigs
are in power. We call this the ‘political connections’ effect. Third, we assume the ruling party
targets rejections to constituencies that had greater support for the ruling party in recent
elections. The aim is to satisfy or placate opposition groups in an effort to maintain their parties’
power. We label this channel the ‘blocking power of vested interests’ and it implies that is
lower for bills applying to constituencies where the ruling party was strong. An opposite
argument proposes that the ruling party targeted approvals to constituencies that had greater
support for the ruling party in recent elections. Here the political aim is to satisfy promoters.
Although such an assumption is common in models of redistributive politics (i.e. Cox and
Mcubbins 1986; Dixit and Londregan 1996), we believe it is less plausible here. Opposition
groups in early 18th
century Britain were often landowners or established cities and so their

17
interests were more strongly considered than promoters who were often new entrants to the
political and economic elite. Later we provide evidence consistent with this assumption.
The parameter also captures the effects of political competition. One hypothesis is that
parties faced greater pressure to appease opposition groups in areas where elections were
competitive. The idea is that opposition groups’ political support was especially valuable in these
areas and thus MPs would have been biased against promoters. Notice that our theory is
somewhat different from other models of political competition. Besley, Persson and Sturm
(2010) assume that more competition diminishes rent-seeking. Later we show little evidence for
such an effect.
We now turn to the efforts and which can be modeled using the standard tools of
contests.8 The objective function for the promoter is . The first term is the probability
the bill is approved
multiplied by the financial return . The promoter
earns only if the bill is approved and otherwise their payoff is normalized to 0. The second
term is the total cost of effort for the promoter, where is the marginal cost and is the effort
level. The objective function for the opposition is . The opposition loses the contest
with probability in which case they get l . If the opposition wins the contest and the bill fails
they get 0. The marginal cost of effort for the opposition is assumed to be the same as the
promoter.9
The effort decisions are made strategically and the Nash equilibrium is derived from best
response functions. The equilibrium efforts and
satisfy the following relationship:
8 We refer the reader to Konrad (2009) for a good overview of contests.
9 We could also model differences in the costs of effort between promoters and opposition groups. One approach
assumes the costs differ according to the density of ruling party MPs near the promoter and opposition. This
assumption gives qualitatively the same results as changes in so we do not model it here.
18
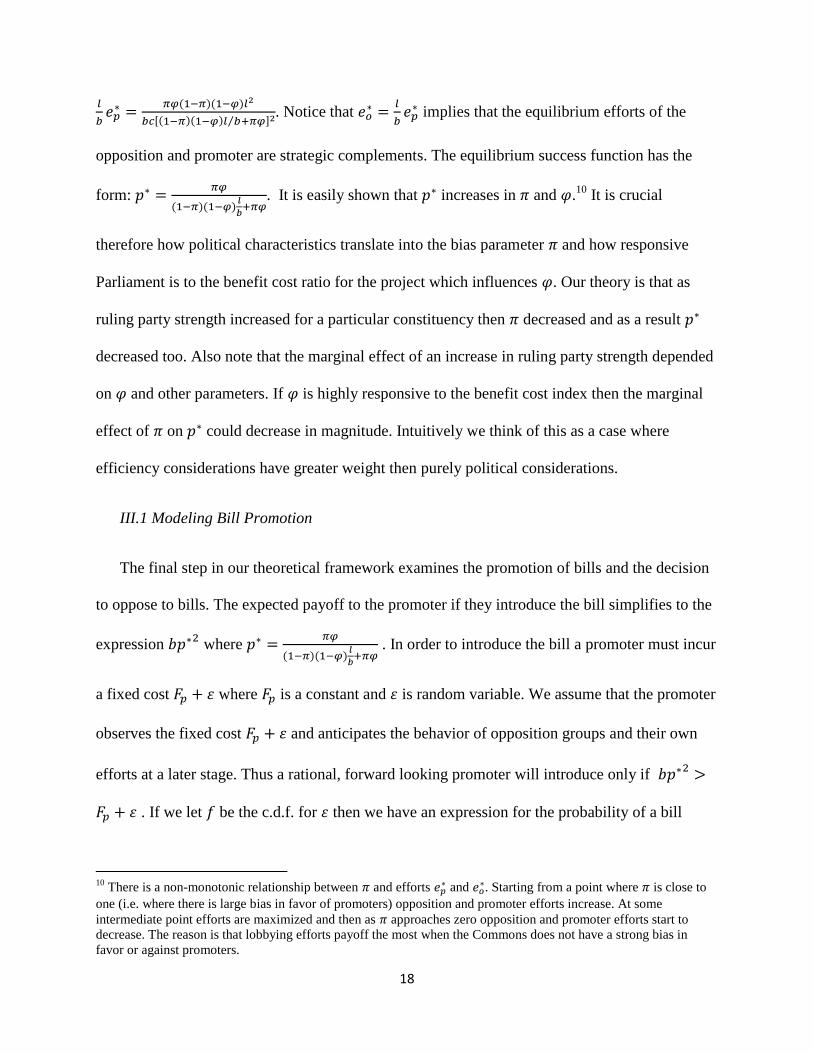
⁄ . Notice that
implies that the equilibrium efforts of the
opposition and promoter are strategic complements. The equilibrium success function has the
form:
. It is easily shown that increases in and .10
It is crucial
therefore how political characteristics translate into the bias parameter and how responsive
Parliament is to the benefit cost ratio for the project which influences . Our theory is that as
ruling party strength increased for a particular constituency then decreased and as a result
decreased too. Also note that the marginal effect of an increase in ruling party strength depended
on and other parameters. If is highly responsive to the benefit cost index then the marginal
effect of on could decrease in magnitude. Intuitively we think of this as a case where
efficiency considerations have greater weight then purely political considerations.
III.1 Modeling Bill Promotion
The final step in our theoretical framework examines the promotion of bills and the decision
to oppose to bills. The expected payoff to the promoter if they introduce the bill simplifies to the
expression where
. In order to introduce the bill a promoter must incur
a fixed cost where is a constant and is random variable. We assume that the promoter
observes the fixed cost and anticipates the behavior of opposition groups and their own
efforts at a later stage. Thus a rational, forward looking promoter will introduce only if
. If we let be the c.d.f. for then we have an expression for the probability of a bill
10
There is a non-monotonic relationship between and efforts and
. Starting from a point where is close to
one (i.e. where there is large bias in favor of promoters) opposition and promoter efforts increase. At some
intermediate point efforts are maximized and then as approaches zero opposition and promoter efforts start to
decrease. The reason is that lobbying efforts payoff the most when the Commons does not have a strong bias in
favor or against promoters.

19
being introduced equal to . Note that because is a function of b, l, , and and
because is an increasing function of our comparative statics are the same as . For
example, if is small because the ruling party is strong near a constituency then its likelihood of
having a bill is lower. Or if is large because the social benefits to costs of a project are large
then a bill is more probable.
We carry out a similar analysis for the opposition. It faces a choice whether or not to
approach the Commons and formally oppose bills. If so they must incur a fixed cost
where is a constant and is random variable. The opposition will formally oppose if their
expected payoff (
) exceeds . Following the logic for promoters, formal
opposition will be more likely if the ruling party is strong in their area.
III.2 Summary
Our model produces an expression for the probability of a bill’s success and the
probability of a bill being introduced: . Combining these two terms gives the
probability of an act in a constituency: where the success function
captures the effects of political bias and project benefits to costs. Following our assumptions we
get predictions regarding the relationship political characteristics and the probability of acts,
bills, and success rates. Table 3 summarizes those predictions relating to political connections,
the blocking power of vested interests and political competition.
20
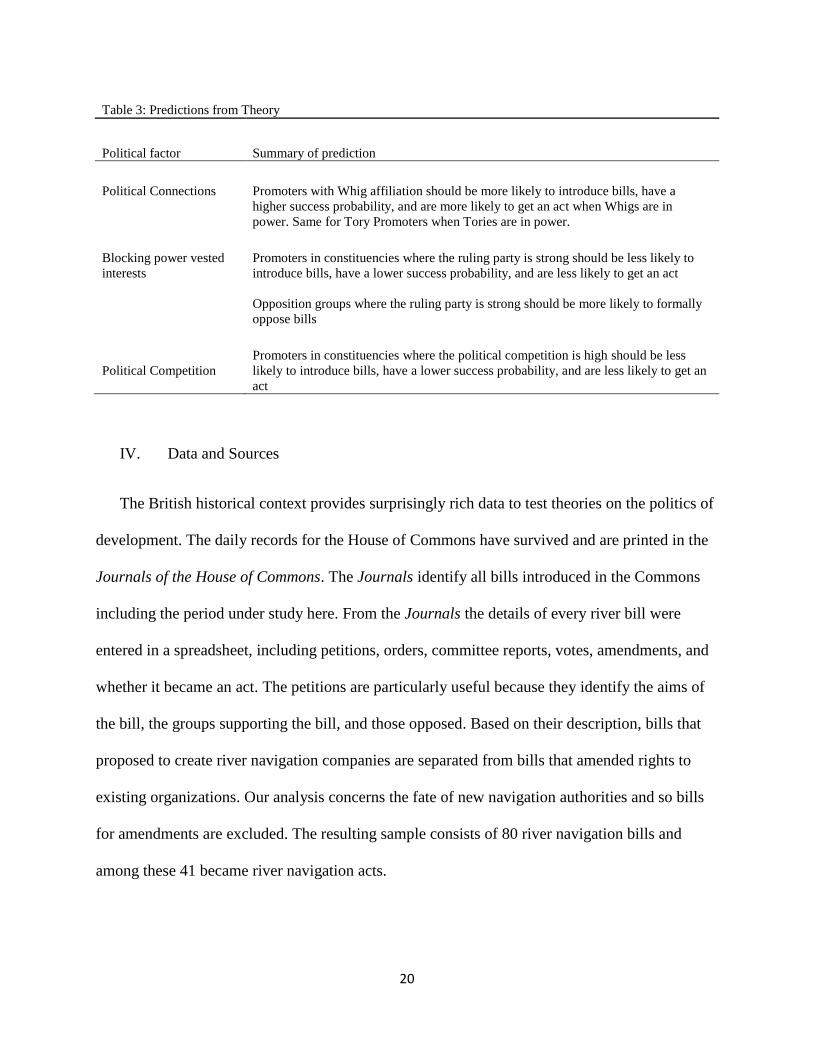
Table 3: Predictions from Theory
Political factor Summary of prediction
Political Connections
Promoters with Whig affiliation should be more likely to introduce bills, have a
higher success probability, and are more likely to get an act when Whigs are in
power. Same for Tory Promoters when Tories are in power.
Blocking power vested
interests
Promoters in constituencies where the ruling party is strong should be less likely to
introduce bills, have a lower success probability, and are less likely to get an act
Opposition groups where the ruling party is strong should be more likely to formally
oppose bills
Political Competition
Promoters in constituencies where the political competition is high should be less
likely to introduce bills, have a lower success probability, and are less likely to get an
act
IV. Data and Sources
The British historical context provides surprisingly rich data to test theories on the politics of
development. The daily records for the House of Commons have survived and are printed in the
Journals of the House of Commons. The Journals identify all bills introduced in the Commons
including the period under study here. From the Journals the details of every river bill were
entered in a spreadsheet, including petitions, orders, committee reports, votes, amendments, and
whether it became an act. The petitions are particularly useful because they identify the aims of
the bill, the groups supporting the bill, and those opposed. Based on their description, bills that
proposed to create river navigation companies are separated from bills that amended rights to
existing organizations. Our analysis concerns the fate of new navigation authorities and so bills
for amendments are excluded. The resulting sample consists of 80 river navigation bills and
among these 41 became river navigation acts.
21
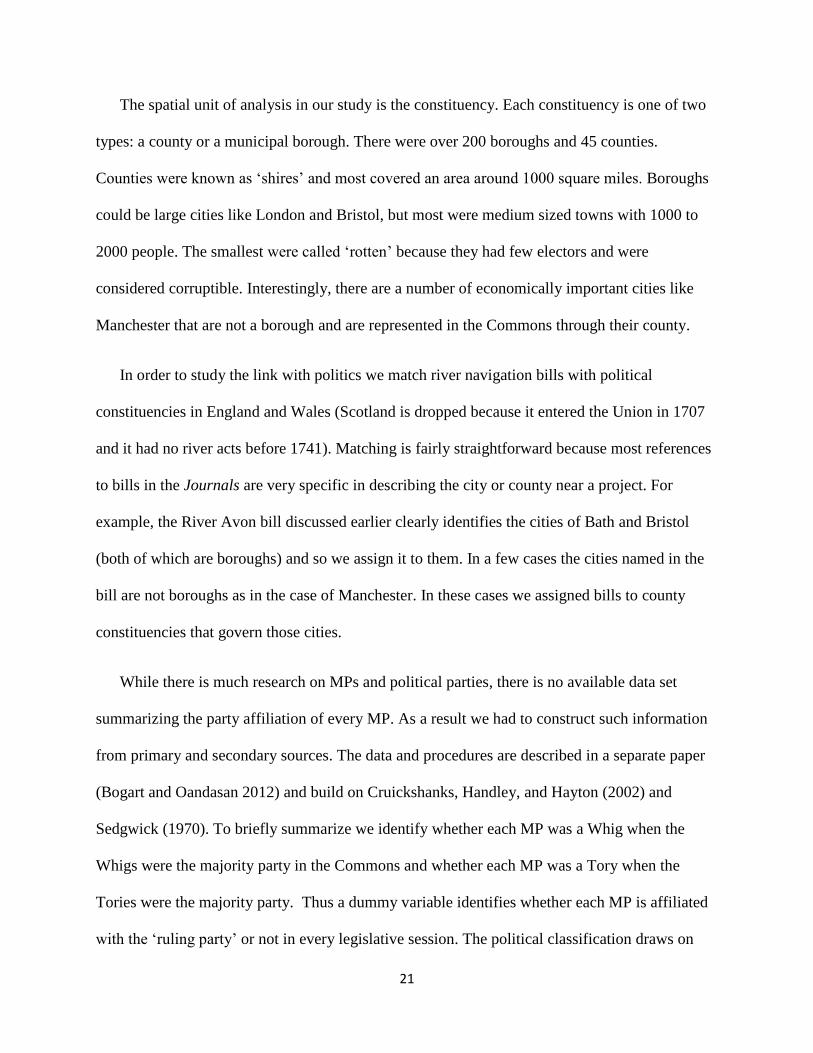
The spatial unit of analysis in our study is the constituency. Each constituency is one of two
types: a county or a municipal borough. There were over 200 boroughs and 45 counties.
Counties were known as ‘shires’ and most covered an area around 1000 square miles. Boroughs
could be large cities like London and Bristol, but most were medium sized towns with 1000 to
2000 people. The smallest were called ‘rotten’ because they had few electors and were
considered corruptible. Interestingly, there are a number of economically important cities like
Manchester that are not a borough and are represented in the Commons through their county.
In order to study the link with politics we match river navigation bills with political
constituencies in England and Wales (Scotland is dropped because it entered the Union in 1707
and it had no river acts before 1741). Matching is fairly straightforward because most references
to bills in the Journals are very specific in describing the city or county near a project. For
example, the River Avon bill discussed earlier clearly identifies the cities of Bath and Bristol
(both of which are boroughs) and so we assign it to them. In a few cases the cities named in the
bill are not boroughs as in the case of Manchester. In these cases we assigned bills to county
constituencies that govern those cities.
While there is much research on MPs and political parties, there is no available data set
summarizing the party affiliation of every MP. As a result we had to construct such information
from primary and secondary sources. The data and procedures are described in a separate paper
(Bogart and Oandasan 2012) and build on Cruickshanks, Handley, and Hayton (2002) and
Sedgwick (1970). To briefly summarize we identify whether each MP was a Whig when the
Whigs were the majority party in the Commons and whether each MP was a Tory when the
Tories were the majority party. Thus a dummy variable identifies whether each MP is affiliated
with the ‘ruling party’ or not in every legislative session. The political classification draws on

22
division lists which identify party affiliation directly or voting on major pieces of legislation
associated with the leaders of the two parties.
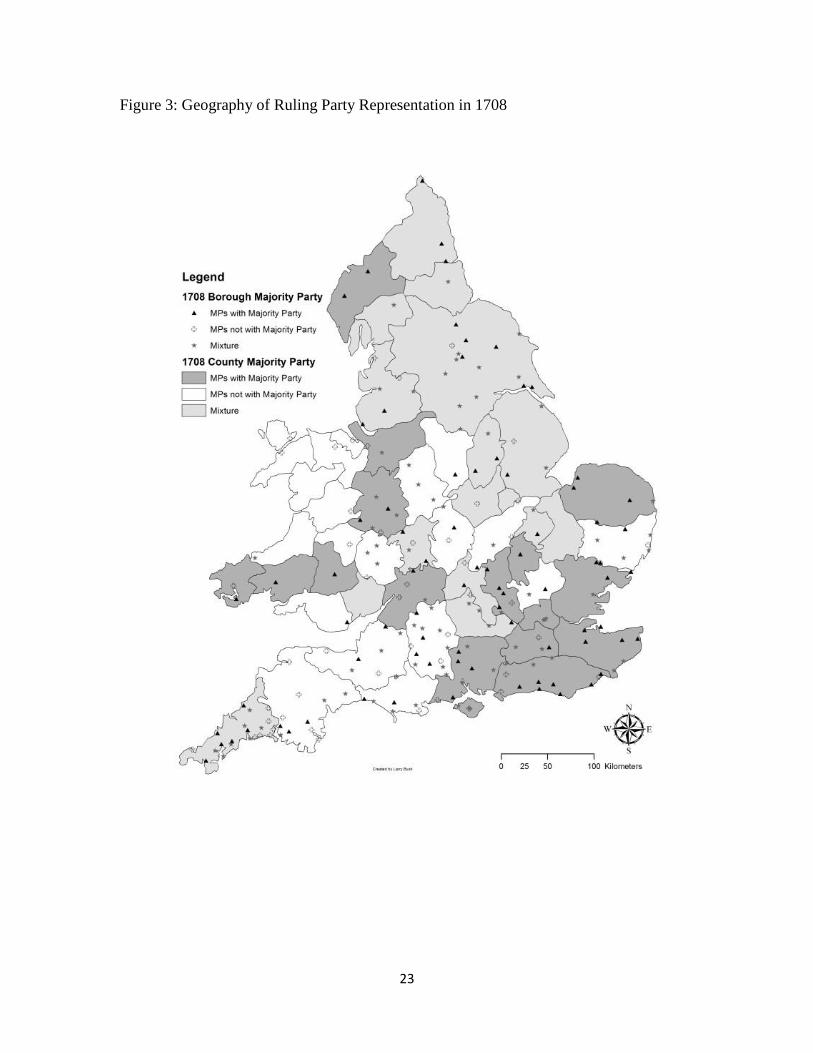
The party affiliation of each MP is used to measure the number of ruling party MPs in each
constituency for every parliament. To illustrate the data, figure 3 maps party classifications for
1708 when the Whigs were the ruling party and figure 4 does the same for 1710 when the Tories
were the ruling party. Boroughs are indicated with symbols. Counties are outlined with white,
light grey, or dark grey backgrounds. Darker symbols or counties are constituencies where the
ruling party was strongly represented.11
The main point is to show that ruling party
representation varied across space and changed over time with the identity of the ruling party.
We also measure the number of ruling party MPs in the area surrounding each constituency.
To do this we linked all borough constituencies to a point in space using available latitude and
longitude coordinates for every town in England and Wales. For counties we use the most
geographically central town for the latitude and longitude measurement. Next the number of
ruling party MPs and the number of total MPs are calculated at various distances ranging from
10 to 35 miles. As explained later, we want to identify the geographic scale at which political
variables matter.
11
Our classifications are based on the fraction of MPs with the ruling party. In most cases there are two MPs for a
constituency so the possible values for the fraction with the ruling party are 0, 0.5, and 1. If an MP left the House
within a session we have more than two MPs, in which case the fraction with the ruling party ranges between 0 and
1 and is based on the length of each MPs tenure. A constituency is considering to be well represented by the ruling
party if the fraction of MPs in the ruling party is above 0.8. A constituency is not well represented by the ruling
party if the fraction of MPs in the ruling party is below 0.2. The consistency has mixed representation if the fraction
of MPs in the ruling party is in-between 0.2 and 0.8.
23
Figure 3: Geography of Ruling Party Representation in 1708

24
Figure 3: Geography of Ruling Party Representation in 1708
We also use Cruickshanks, Handley, and Hayton (2002) and Sedgwick’s (1970) list of
constituencies that had a contested election in each parliament.12
As with ruling party MPs, we
calculate the number of contests at distances ranging from 10 to 35 miles. Cruickshanks,
Handley, and Hayton (2002) also report the number of voters in each county or borough. The
12
Information on vote tallies are not available for many contests so unfortunately we cannot use it (see
Cruickshanks, Handley, and Hayton 2002)

25
general rule was that all freeholders in a county with more than 40 shillings a year in income
could vote. The number of borough voters reflects city size (the borough of London for example
had the most voters) but it also reflects the degree of democracy and different voting rules.
In the future we plan to add data on the population of all counties and an indicator for the
population size of all boroughs. For the moment we calculate the market potential for each
constituency using the 67 largest cities in England with a population above 2500. Market
potential is calculated using the inverse distance weighted sum of city populations. A final
variable measures the distance to the existing network of navigable waterways c.1690 using GIS
tools and a digital map of navigable waterways.
Summary statistics for all the variables are shown in table 4. The likelihood of a constituency
ever having at least one river bill in its jurisdiction between 1690 and 1741 is relatively low at 18
percent. The proportion ever having a river act is even lower at 12 percent as not all bills passed.
Within the any individual parliamentary session the probabilities become even smaller. The
political variables are shown in various forms and calculated across all constituency-
parliamentary session cells. By construction, the number of ruling party MPs in a constituency is
smaller and has higher variation than the number of ruling party MPs say within 25 miles.
Lastly, the control variables exhibit substantial variation especially market potential.

26
Table 4: Summary Statistics
Variable obs. mean st. dev. Min max
Variables for river bills and acts
Constituencies with at least one
River bill introduced 268 0.179 0.384 0 1
Constituencies with at least one
River Act 268 0.119 0.324 0 1
Political variables by constituency and parliamentary session
Number of MPs in constituency
with Ruling Party 3752 0.943 0.773 0 4
Number of MPs within 10 miles
with Ruling Party 3752 2.36 1.93 1 11.59
Number of MPs within 15 miles
with Ruling Party 3752 4.05 3.083 0 19.147
Number of MPs within 20 miles
with Ruling Party 3752 6.58 4.56 0 25.38
Number of MPs within 25 miles
with Ruling Party 3752 9.57 5.93 1 28.388
Number of MPs within 25 miles 3752 19.18 9.86 2 42
Dummy for contested election in
constituency 3752 0.42 0.494 0 1
Number of constituencies with
contested elections within 25 miles 3752 4.27 2.94 0 15
Dummy for Sessions when Whigs
are in Power 3752 0.571 0.494 0 1
Control variables
Year when legislative session ended 3752 1712.2 13.57 1695 1741
Dummy for County constituency 3752 0.194 0.395 0 1
Number of voters for municipality 3024 373.78 765.9 10 7237
Number of voters per sq. mi. for
county 728 2.76 1.8 0.195 10.67
Market Potential 3752 8376 33503 1847 551842
Distance to original navigable
waterway network 3752 25.42 19.74 0 92.96
Sources: see text.
V. Empirical Strategy
27
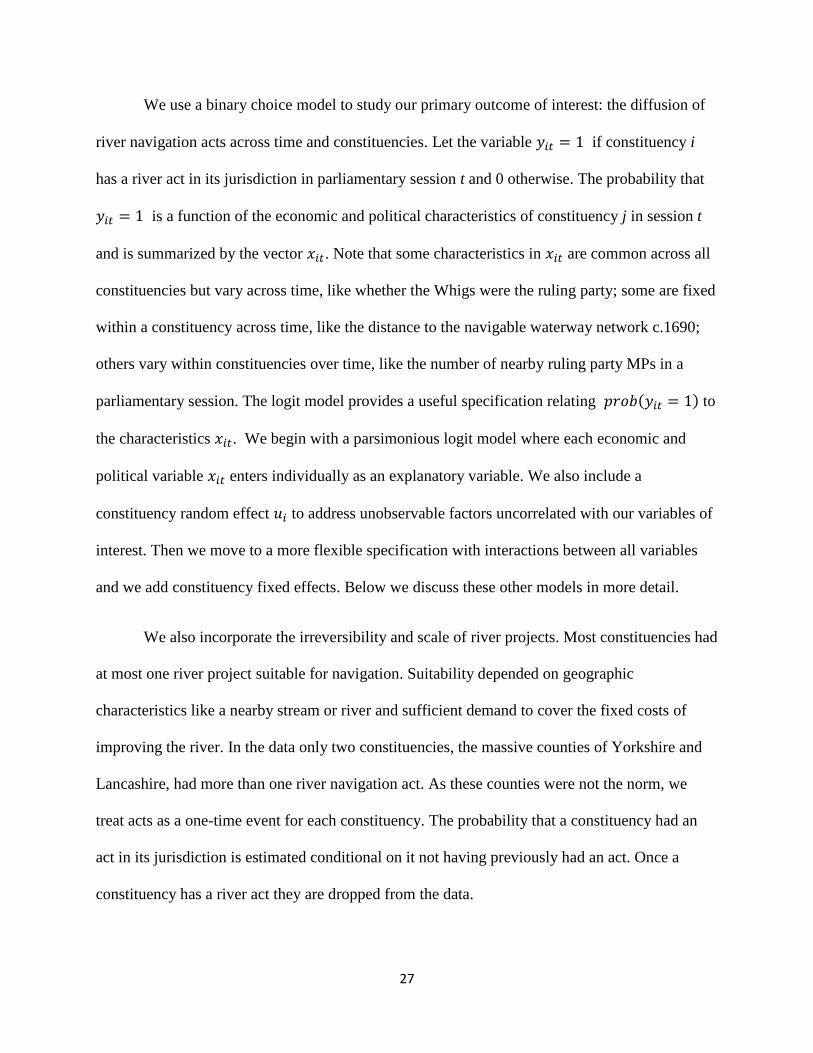
We use a binary choice model to study our primary outcome of interest: the diffusion of
river navigation acts across time and constituencies. Let the variable if constituency i
has a river act in its jurisdiction in parliamentary session t and 0 otherwise. The probability that
is a function of the economic and political characteristics of constituency j in session t
and is summarized by the vector . Note that some characteristics in are common across all
constituencies but vary across time, like whether the Whigs were the ruling party; some are fixed
within a constituency across time, like the distance to the navigable waterway network c.1690;
others vary within constituencies over time, like the number of nearby ruling party MPs in a
parliamentary session. The logit model provides a useful specification relating to
the characteristics . We begin with a parsimonious logit model where each economic and
political variable enters individually as an explanatory variable. We also include a
constituency random effect to address unobservable factors uncorrelated with our variables of
interest. Then we move to a more flexible specification with interactions between all variables
and we add constituency fixed effects. Below we discuss these other models in more detail.
We also incorporate the irreversibility and scale of river projects. Most constituencies had
at most one river project suitable for navigation. Suitability depended on geographic
characteristics like a nearby stream or river and sufficient demand to cover the fixed costs of
improving the river. In the data only two constituencies, the massive counties of Yorkshire and
Lancashire, had more than one river navigation act. As these counties were not the norm, we
treat acts as a one-time event for each constituency. The probability that a constituency had an
act in its jurisdiction is estimated conditional on it not having previously had an act. Once a
constituency has a river act they are dropped from the data.
28
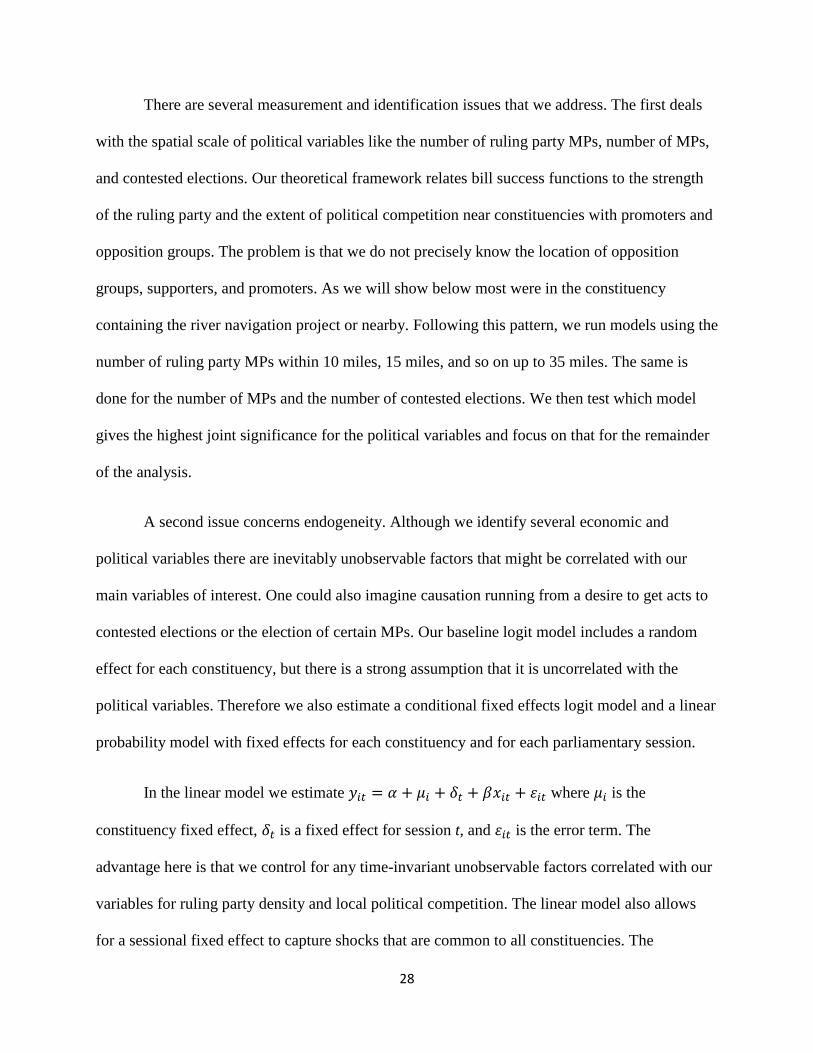
There are several measurement and identification issues that we address. The first deals
with the spatial scale of political variables like the number of ruling party MPs, number of MPs,
and contested elections. Our theoretical framework relates bill success functions to the strength
of the ruling party and the extent of political competition near constituencies with promoters and
opposition groups. The problem is that we do not precisely know the location of opposition
groups, supporters, and promoters. As we will show below most were in the constituency
containing the river navigation project or nearby. Following this pattern, we run models using the
number of ruling party MPs within 10 miles, 15 miles, and so on up to 35 miles. The same is
done for the number of MPs and the number of contested elections. We then test which model
gives the highest joint significance for the political variables and focus on that for the remainder
of the analysis.
A second issue concerns endogeneity. Although we identify several economic and
political variables there are inevitably unobservable factors that might be correlated with our
main variables of interest. One could also imagine causation running from a desire to get acts to
contested elections or the election of certain MPs. Our baseline logit model includes a random
effect for each constituency, but there is a strong assumption that it is uncorrelated with the
political variables. Therefore we also estimate a conditional fixed effects logit model and a linear
probability model with fixed effects for each constituency and for each parliamentary session.
In the linear model we estimate where is the
constituency fixed effect, is a fixed effect for session t, and is the error term. The
advantage here is that we control for any time-invariant unobservable factors correlated with our
variables for ruling party density and local political competition. The linear model also allows
for a sessional fixed effect to capture shocks that are common to all constituencies. The

29
downside is that we cannot include time-invariant characteristics like market potential and we
could get predicted probabilities less than 0 and more than 1.
Other outcome variables, like the incidence of river navigation bills and the success of
bills in Parliament, are studied using the same logit and fixed effects frameworks. The analysis
of bills identifies whether promoters took political characteristics into account when making their
decisions. Note that our model above assumes that promoters and opposition groups were
forward looking. The analysis of bills also provides a test for selection effects whereby projects
with differing quality are more or less likely to get promoted under certain political conditions.
In such cases the sign and significance on variables can differ in regressions for bills compared
to regressions for bill success conditional on a bill being introduced. Finally we study the
incidence of opposition to bills. Our model predicts that groups will be more likely to oppose
bills if they have stronger representation by the ruling party.
VI. Results
The first step is to establish the appropriate spatial scale for political variables. Our first
specification includes own constituency political variables, like the number of ruling party MPs
and MPs in a constituency and whether there was a contested election in the constituency along
with a dummy for Whig rule, the full set of controls discussed above, and a time trend. Note in
this specification ruling party MPs captures the effect of increasing their number while holding
the overall number of MPs constant. Increasing total MPs captures the effect of having more
MPs absent any party consideration. Subsequent specifications include ruling MPs, MPs, and
contests within 10, 15, 20, 25, 30, and 35 miles respectively.

30
Table 5 reports the odds ratios and standard errors for all specifications. Readers will
immediately notice the positive and significant effect of Whig party rule and by implication the
negative and significant effect of Tory rule. We will return to this result momentarily because the
Whig effect is quite subtle. The other key finding in table 5 concerns ruling party MPs. Across
all the models only the number of ruling party MPs within 25 miles has a statistically significant
influence on the probability of having a river act. In this case, increasing the number of ruling
party MPs by one is estimated to decreases the odds of getting a river act by approximately 13
percent. The estimated effect of ruling party strength is not trivial given that the standard
deviation for ruling party MPs within 25 miles is just under 6.
As table 5 illustrates, ruling party strength only matters if it is measured within 25 miles of a
constituency. Does 25 miles make sense? We provide some supporting evidence by studying the
locations of groups opposing bills. Recall that our theory is that ruling parties targeted rejections
to placate opposition groups in areas where their party had won more seats in the most recent
election. If correct, we would expect that many opposition groups should be located within 25
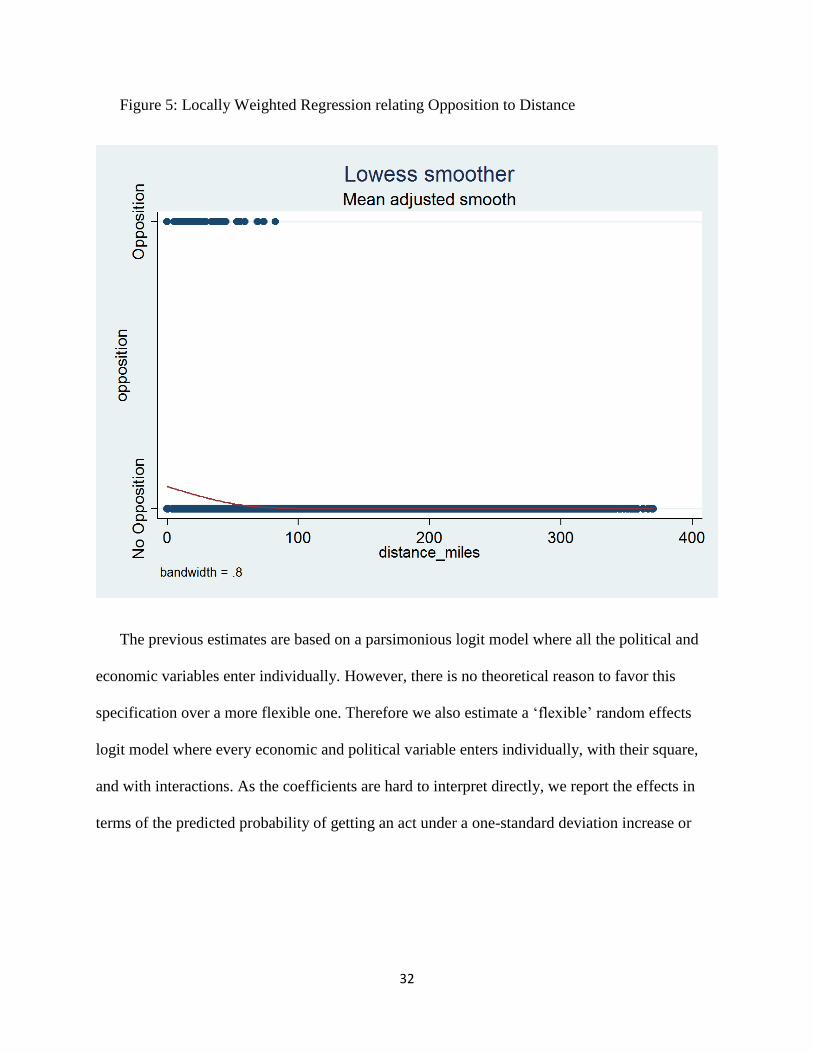
miles of constituencies with bills. To investigate this issue we used a locally weighted regression
to estimate the probability some group in a constituency opposed a bill as a function of its
distance to the constituency with the bill. Figure 5 plots the smoothed estimates along with the
raw data. Almost all opposition groups are within 100 miles and many are closer. The mean
distance is 22.7 miles. The probability of opposition also falls rapidly until distances reach
around 50 miles. We ran another regression of opposition on indicators for distances less than 20
miles, less than 25 miles, less than 30 miles, and less than 35 miles. Only the indicator variables
for less than 20 miles and less than 25 miles are significant, suggesting that groups within 25 to
30 miles are no more likely to oppose than groups at a greater distance.

31
Table 5: River Acts: Basline Random Effects Logit Regression
1 2 3 4 5 6 7
Own
Cons.
within 10
miles
within 15
miles
within 20
miles
within 25
miles
within 30
miles
within 35
miles
Odds
Ratio
Odds
Ratio
Odds
Ratio
Odds
Ratio
Odds
Ratio
Odds
Ratio
Odds
Ratio
political variables St. error St. error St. error St. error St. error St. error St. error
Ruling party MPs 1.261 1.002 0.845 0.892 0.871 0.955 0.951
0.31 0.166 0.113 0.088 0.067 0.054 0.044
Number of MPs 2.192 0.769 0.934 0.976 1.005 0.986 0.992
1.79 0.103 0.089 0.062 0.049 0.039 0.032
Contested elections 0.944 0.779 0.968 1.022 0.952 0.998 1.044
0.393 0.211 0.194 0.149 0.113 0.088 0.076
Whig Majority
Dummy 3 2.972 2.896 2.948 2.847 2.932 2.95
1.35 1.32 1.31 1.33 1.29 1.32 1.34
Controls Yes Yes Yes Yes Yes Yes Yes
Random effects Yes Yes Yes Yes Yes Yes Yes
N 3536 3536 3536 3536 3536 3536 3536
Wald chi2(10) 12.68 23.9 13.86 13.18 15.38 13.06 13.41
Prob > chi2 0.24 0.008 0.18 0.213 0.12 0.22 0.2
Chi2(3) for political
variables 2.13 10.13 4.28 3.54 5.93 2.83 3.12
p-value 0.54 0.017 0.23 0.32 0.115 0.41 0.37
Notes: Bold coefficients are statistically significant at the 10% level or below. Control variables
include a dummy for county constituencies, voters per square mile in counties, number of voters in cities,
market potential, and distance to the navigable waterway network in 1690.
32
Figure 5: Locally Weighted Regression relating Opposition to Distance
The previous estimates are based on a parsimonious logit model where all the political and
economic variables enter individually. However, there is no theoretical reason to favor this
specification over a more flexible one. Therefore we also estimate a ‘flexible’ random effects
logit model where every economic and political variable enters individually, with their square,
and with interactions. As the coefficients are hard to interpret directly, we report the effects in
terms of the predicted probability of getting an act under a one-standard deviation increase or
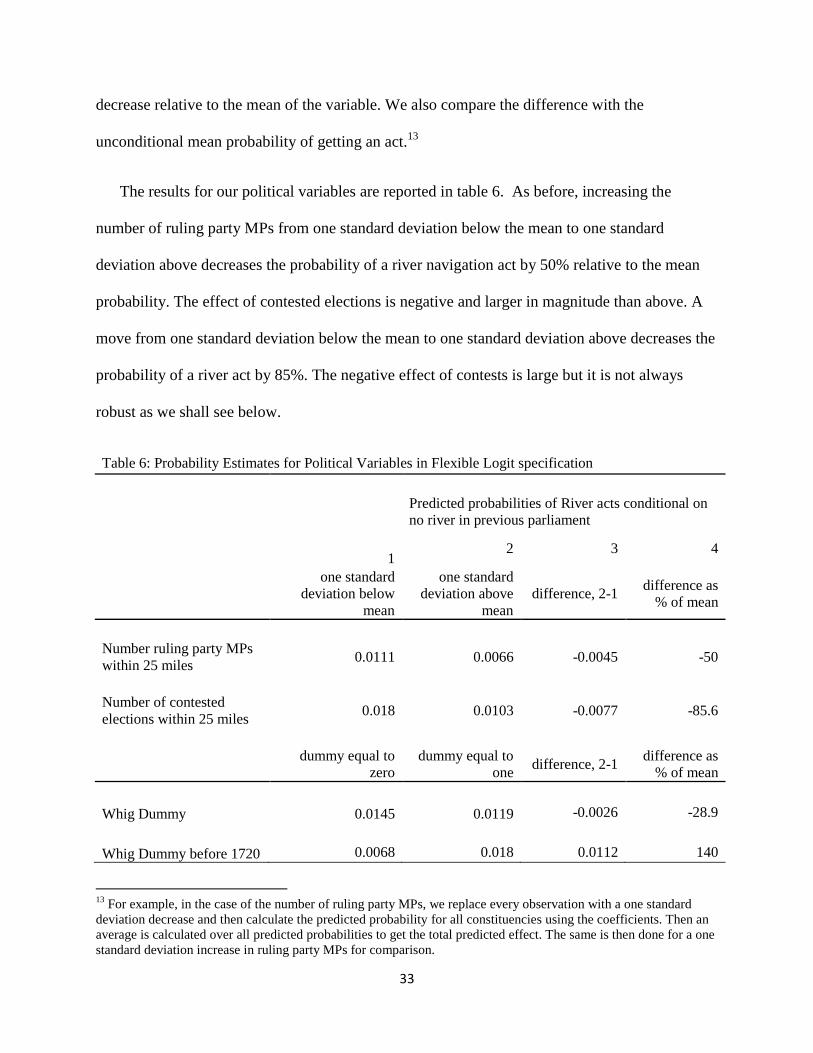
33
decrease relative to the mean of the variable. We also compare the difference with the
unconditional mean probability of getting an act.13
The results for our political variables are reported in table 6. As before, increasing the
number of ruling party MPs from one standard deviation below the mean to one standard
deviation above decreases the probability of a river navigation act by 50% relative to the mean
probability. The effect of contested elections is negative and larger in magnitude than above. A
move from one standard deviation below the mean to one standard deviation above decreases the
probability of a river act by 85%. The negative effect of contests is large but it is not always
robust as we shall see below.
Table 6: Probability Estimates for Political Variables in Flexible Logit specification
Predicted probabilities of River acts conditional on
no river in previous parliament
2 3 4 1
one standard
deviation below
mean
one standard
deviation above
mean
difference, 2-1 difference as
% of mean
Number ruling party MPs
within 25 miles 0.0111 0.0066 -0.0045 -50
Number of contested
elections within 25 miles 0.018 0.0103 -0.0077 -85.6
dummy equal to
zero
dummy equal to
one difference, 2-1
difference as
% of mean
Whig Dummy 0.0145 0.0119 -0.0026 -28.9
Whig Dummy before 1720 0.0068 0.018 0.0112 140
13
For example, in the case of the number of ruling party MPs, we replace every observation with a one standard
deviation decrease and then calculate the predicted probability for all constituencies using the coefficients. Then an
average is calculated over all predicted probabilities to get the total predicted effect. The same is then done for a one
standard deviation increase in ruling party MPs for comparison.
34
Most notably the flexible logit model suggests a different interpretation for the Whig
majority dummy. When the Whigs were in power the predicted probability of a river act is now
slightly lower than when the Tories were in power. In terms of the coefficients (not shown to
save space) the direct effect of Whig rule remains positive, but there are several interactions with
other variables. There is a negative sign on the interaction between Whig and the number of
ruling party MPs and similarly for Whig and market potential. The latter is significant because
market potential had a positive effect on the probability of getting river acts as shown below.
Thus the positive effect of Whig rule was partly diminished by reducing the effect of market
potential. Similarly there is a negative sign on the interaction between the time trend and the
Whig dummy. Timing appears to be important here. If we look before 1720 then the estimated
probability of river acts was higher under Whig majorities (see the bottom of table 6). Thus there
is some support for Pincus (2009) and Pincus and Robinson’s (2012) view that the Whigs
favored a program of economic modernization in the aftermath of the Glorious Revolution, but
the Whig party after 1720, when Robert Walpole was the leader, looks less developmental.
VI.1 Robustness
We now test the robustness of the results for political variables using the conditional fixed
effects logit model and the linear fixed effects models. All time-invariant characteristics like
market potential must necessarily be dropped. The Whig dummy is also dropped as we include
fixed effects for each parliamentary session. The results are reported in table 7. All specifications
use the 25 mile spatial scale as a similar specification search using 10 miles, 15 miles, etc.
yielded less significant results. To begin we return to the specification where each variable enters
individually. Interactions will be considered in a moment.

35
The findings are generally consistent with earlier results. Specification 1 shows that
increasing the number of ruling party MPs within a constituency lowers its likelihood of a river
navigation act. In this case, there is no direct effect of increasing the number of contested
elections. Also note that the odds ratio for ruling party MPs in column 1 is larger than the odds
ratio in the analogous random effects model. In the conditional FE model increasing the number
of ruling party MPs by one lowers the probability of river act by 17%. In the linear model shown
in column 2 the coefficient can be compared with unconditional probability of a constituency
getting a river act in any session provided that the constituency has not had one before (0.0087).
The coefficient -0.0008 implies that increasing the number of ruling party MPs by one lowers the
probability by 9%. More generally, the fixed effects results are important because they show
time-invariant unobserved constituency characteristics are not biasing our results for ruling party
strength and competition.
Table 7: River Acts: Fixed Effects Regressions
1 2
fixed effects Logit linear probability
Odds Ratio coeff.
political variables St. error St. error
Ruling party MPs 0.826 -0.0008
0.088 0.0004
Contested elections 0.938 -0.0014
0.115 0.0011
Constituency FE yes yes
Parliamentary session FE no yes
Notes: Bold coefficients are statistically significant at the 10% level or below. In column 2 the standard
errors are clustered on the constituency. Number of ruling party MPs and contested elections are
measured within a 25 mile radius of the constituency.

36
Table 8 shows results from the fixed effects linear probability model with various interaction
terms. As before the number of ruling party MPs and contested elections are measured within a
25 mile radius of the constituency. Column 1 shows that more contested elections offset some of
the effects of ruling party strength, although coefficient on the interaction between contested
elections and ruling party MPs is not statistically significant. Also increasing contested elections
has little overall effect overall because the coefficient on contested elections is negative. We
return to this issue below.
Column 2 reports results for a model that includes an interaction between the number of
ruling party MPs and a dummy for years when the Whig party was in the majority. It also
includes a dummy for Whig party power to show the direct effect. A time trend also replaces the
parliamentary session dummies. The results yield an interesting result that is consistent with the
flexible random effects model analyzed above. River acts were more likely when the Whigs are
in the majority, but the negative effect of ruling party strength is significantly stronger when the
Whigs were in the majority. It is possible that the Whigs had a more tentative hold over power
and therefore they had greater need to placate opposition groups in constituencies they
represented. Whatever the explanation the negative interaction between Whig rule and ruling
party MPs near a constituency diminishes the positive effect of Whig party rule on river
navigation acts.

37
Table 8: Linear Fixed Effects Model for River Acts with interaction effects
1 2 3
coeff. coeff. coeff.
political variables St. error St. error St. error
number ruling party MPs -0.0019 -0.0002 -0.0003
0.0009 0.0004 0.0004
number of contested elections -0.0042 -0.0016 -0.0015
0.0027 0.0011 0.001
Ruling MPs * Contested Elections 0.0002
0.0001
Ruling MPs * Dummy for Whig Rule -0.001 -0.001
0.0004 0.0004
Dummy for Whig Rule 0.0148 0.0137
0.006 0.006
Dummy for Whig rule * Dummy for Whig leaning Constituency 0.01
0.008
Dummy for Whig rule * Dummy for Tory leaning Constituency -0.005
0.007
constituency FE yes yes Yes
Parliamentary session FE yes no Yes
time trend no yes No
N 3536 3536 3536
Notes: Bold indicates statistical significance at the 10% level or below. Standard
errors are clustered on constituencies.
Differences between the Whigs and Tories are explored further by examining constituencies
where the Whigs or Tories generally had stronger support. We define a constituency as ‘Whig-
leaning’ if it had at least one Whig MP when the Whigs had the majority and no more than one
Tory MP when the Tories had the majority in at least 14 out of the 15 parliamentary sessions.

38
Tory leaning constituencies are defined analogously. With the one parliamentary session
exception, we allow for some randomness in party representation while identifying those
constituencies with greater support for the Whigs.14
Column 3 includes interactions between
Whig rule and Whig leaning or Tory leaning constituencies. Like before it also includes the
dummy for years when the Whigs were in the majority and an interaction between Whig
majorities and the number of ruling party MPs. The results show that when the Whigs were in
power constituencies that were Whig leaning were more likely to get river acts but the effect is
not statistically significant. Also there is no significant difference for Tory leaning constituencies
when the Whigs were in power. Thus there is no evidence that the Whigs or Tories targeted
rejections to constituencies where they generally had stronger support (a.k.a. strongholds). At
the same time column 3 shows there is still a negative and significant coefficient on the
interaction between Whig rule and ruling party MPs. Thus it appears that the Whigs targeted
rejections in the constituencies where their MPs held seats since the last election but not
necessarily in constituencies where their MPs were generally strong.
Thus far we have focused mainly on political variables and given little attention to economic
variables. However, in our theoretical model, economic characteristics should also be important
as they determine the expected gains from promoting projects and Parliament’s predisposition to
approve bills. Did they? We investigate the effects of economic characteristics using our flexible
random effects model discussed earlier. Table 9 reports changes in the probability of an act under
different economic situations. There are several notable results. The first relates to market
potential which measures proximity to large cities. Constituencies with market potential equal to
12,000 well above the mean of 8000 had a significantly higher probability of getting a river act
14
As an illustration 16 percent of constituencies were ‘Whig-leaning’ under this definition while only 4 percent
always had Whig MPs in all 15 parliamentary sessions.

39
(over 600%!) compared to constituencies with a market potential equal to 4000. The estimates
also show that the population size of constituencies themselves, measured by the number of
voters in a borough or the number of voters in a county, also significantly raised the probability
of act. Distance to the navigable waterway network has a smaller effect, but it is in the expected
direction where greater distance lowers the likelihood of acts.
Table 9: Estimated effects of Economic Variables in Flexible Logit specification
Predicted probabilities of River acts conditional on no
river in previous parliament
1 2 3 4
Market Potential=4000 Market Potential =12,000
difference
, 2-1
difference as
% of mean
Market Potential 0.015 0.07 0.055 611.1
Distance = 5 miles Distance = 45 miles
difference
, 2-1
difference as
% of mean
Distance to
Navigable
Waterway Network
c.1690 0.0162 0.0139
-0.0023 -25.6
city voters = 100 city voters = 700
difference
, 2-1
difference as
% of mean
Number of Voters in
Municipal Borough 0.0081 0.0216 0.0135 168.8
county voter density =
1 city voter density = 4.5
difference
, 2-1
difference as
% of mean
Number of county
Voters per square
mile 0.0432 0.1858
0.1426 612
It is clear that economic factors relating to potential profitability and social benefits had a
large influence on which areas got river acts. At this point, it is interesting to consider whether
40
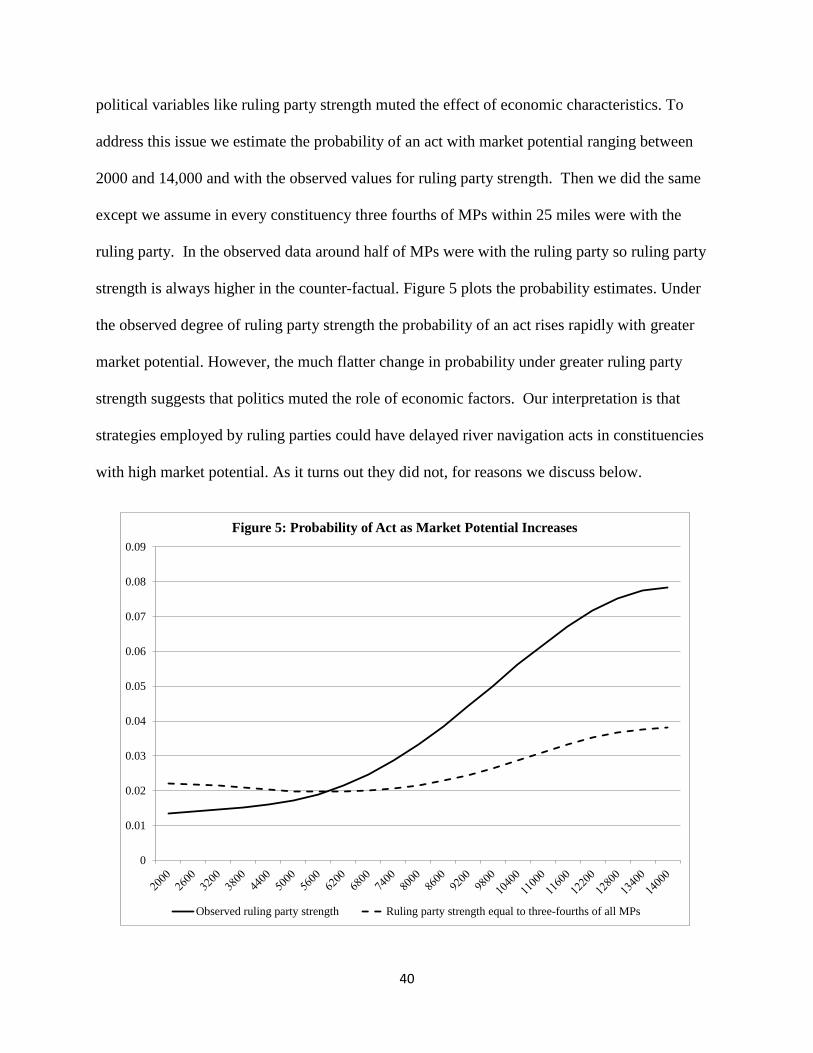
political variables like ruling party strength muted the effect of economic characteristics. To
address this issue we estimate the probability of an act with market potential ranging between
2000 and 14,000 and with the observed values for ruling party strength. Then we did the same
except we assume in every constituency three fourths of MPs within 25 miles were with the
ruling party. In the observed data around half of MPs were with the ruling party so ruling party
strength is always higher in the counter-factual. Figure 5 plots the probability estimates. Under
the observed degree of ruling party strength the probability of an act rises rapidly with greater
market potential. However, the much flatter change in probability under greater ruling party
strength suggests that politics muted the role of economic factors. Our interpretation is that
strategies employed by ruling parties could have delayed river navigation acts in constituencies
with high market potential. As it turns out they did not, for reasons we discuss below.
0
0.01
0.02
0.03
0.04
0.05
0.06
0.07
0.08
0.09
Figure 5: Probability of Act as Market Potential Increases
Observed ruling party strength Ruling party strength equal to three-fourths of all MPs

41
VI.2 Analysis of Bills and Success Rates
More insights can be gained by studying the relationship between political variables and the
likelihood of a river bill being introduced and its success conditional on introduction. Table 10
shows the estimates for bills using the conditional fixed effects logit model and linear fixed
effects model. The results show that river bills are less likely when there are more ruling party
MPs within 25 miles. The odds ratio on ruling party MPs is smaller in magnitude for river bills
than acts but is nevertheless similar. The finding suggests that river promoters knew that ruling
party strength would influence the probability of their bill’s success and they reacted accordingly
when deciding whether to promote bills.
The other notable finding in table 10 is that increasing the number of contested elections
lowers the probability of a river bill. The quantitative magnitude is also large. One more
contested election lowered the odds by 30%. As we argued earlier local political competition
could increase the bias in favor of opposition groups and against promoters. If so then promoters
will be reluctant to introduce bills near constituencies where there were more contested elections.
Table 10: Logit and Linear Fixed Effects Model for River Bills
Logit FE Linear FE
1 2 3 4
Odds Ratio Odds Ratio Coeff. Coeff.
political variables St. error St. error St. error St. error
number ruling party MPs 0.878 0.844 -0.0008 -0.0032
0.059 0.083 0.0005 0.001
number of contested elections 0.703 0.644 -0.0043 -0.01
0.078 0.126 0.0014 0.003
Ruling MPs * Contested Elections 1.009
0.0004
42
0.017
0.0002
constituency fe Yes yes yes yes
year fe No no yes yes
time trend No no yes yes
N 3536 3536 3536 3536
Notes: Bold indicates statistical significance at the 10% level or below. Standard errors are
clustered on constituencies.
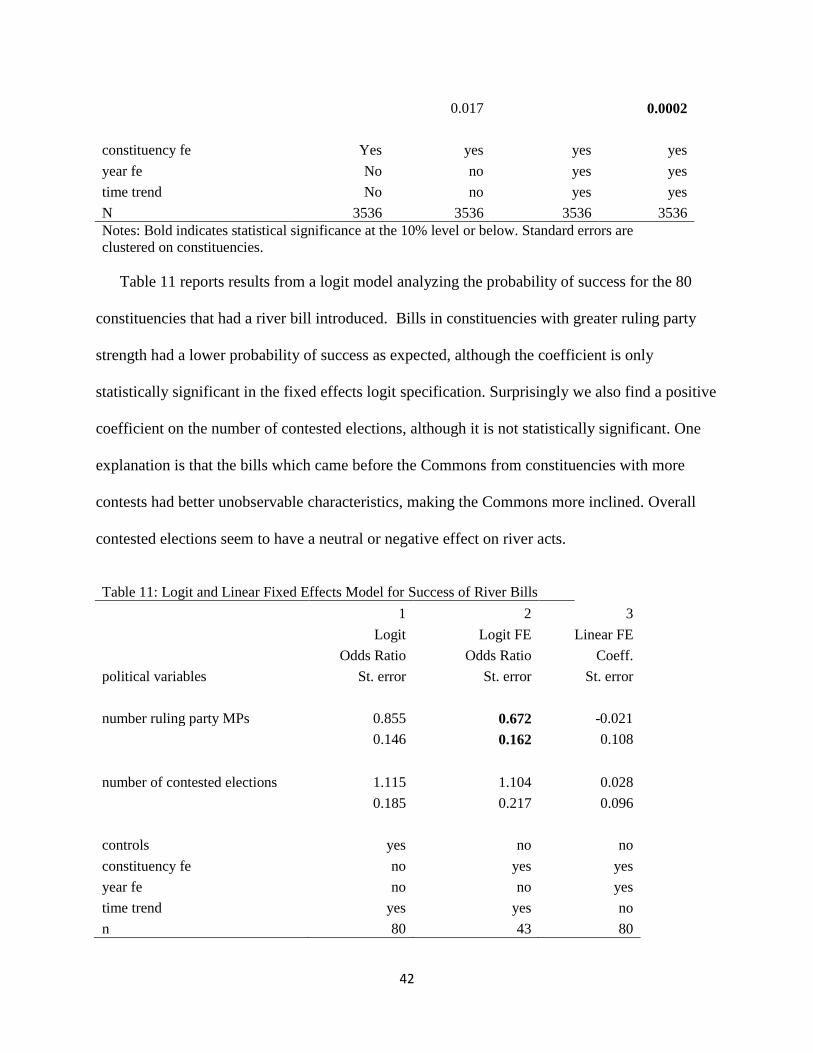
Table 11 reports results from a logit model analyzing the probability of success for the 80
constituencies that had a river bill introduced. Bills in constituencies with greater ruling party
strength had a lower probability of success as expected, although the coefficient is only
statistically significant in the fixed effects logit specification. Surprisingly we also find a positive
coefficient on the number of contested elections, although it is not statistically significant. One
explanation is that the bills which came before the Commons from constituencies with more
contests had better unobservable characteristics, making the Commons more inclined. Overall
contested elections seem to have a neutral or negative effect on river acts.
Table 11: Logit and Linear Fixed Effects Model for Success of River Bills
1 2 3
Logit Logit FE Linear FE
Odds Ratio Odds Ratio Coeff.
political variables St. error St. error St. error
number ruling party MPs 0.855 0.672 -0.021
0.146 0.162 0.108
number of contested elections 1.115 1.104 0.028
0.185 0.217 0.096
controls yes no no
constituency fe no yes yes
year fe no no yes
time trend yes yes no
n 80 43 80

43
Notes: Bold indicates statistical significance at the 10% level or below.
VI.2 Results for Opposition and Support
Our main explanation for the negative effect of ruling party strength is that party leaders
targeted rejections to placate opposition groups in areas where their MPs held seats. If this is
correct, then our model predicts that groups were more willing to oppose a river bill if the ruling
party was strong in their vicinity. Similarly groups desiring to support a river bill should be
indifferent to whether the ruling party was strong in their area. To test this hypothesis we analyze
the probability of a constituency opposing a bill after restricting the sample to constituencies and
sessions where a bill was introduced in a constituency less than 50 miles away. In other words
for the River Avon bill of 1711 which is assigned to Bath we identify all constituencies within 50
miles and assign them an indicator variable for the 1710 to 1713 parliament only. We chose a
range of 50 miles because as we showed above most opposition groups were within 50 miles and
we did not want to include many constituencies for which the river bill was irrelevant. The
resulting sample contains 1347 constituency-parliamentary sessions. Like before we did a
specification search to identify the spatial scale for ruling party MPs and contests. Below we
report results for the number of ruling party MPs and contests within 10 miles. Note that the
spatial scale of political variables is smaller than for acts. This makes sense because we are now
focusing on the actions of groups where we have more precise information on their location.
The results are reported in table 12. There are several important conclusions. First, a
constituency was more likely to record opposition if there were more ruling party MPs within 10
miles. Second, there is no relationship between support for bills and ruling party MPs. These
findings are consistent with our earlier results showing that having more ruling party MPs near a

44
constituency reduced the likelihood of river navigation acts. Our theory again is that greater
ruling party strength in an area encouraged opposition efforts. The effect was to reduce the
probability of a river bill’s success.
Table 12: Political Determinants of Opposition and Support
1 2
Opposition Support
Odds Ratio Odds Ratio
political variables st. error st. error
number ruling party MPs 1.201 1.005
0.096 0.071
number of MPs 0.977 1.003
0.076 0.053
number of contested elections 0.887 0.962
0.122 0.098
Whig 0.904 0.897
0.211 0.167
controls yes yes
n 1347 1347
Wald chi2(10) 15.83 23.9
Prob > chi2 0.1475 0.008
Notes: Bold indicates statistical significance at the 10% level or below. Standard errors are
clustered on constituencies.
VII. Additional Results on Political Connections
According to our argument about political connections, groups that were more closely
affiliated with the Whigs should have been more likely to introduce bills when the Whigs were in
power and groups more affiliated with the Tories should have been more likely to do so when the
Tories were in power. The standard histories of both parties would suggest that merchants were

45
more affiliated with the Whigs and landowners were more affiliated with Tories. If this is
correct, there should be some differences between the two parties in terms of which group
promoted bills.
We classify the identity of promoters into four groups: (1) mayors and city leaders, (2)
landowners, (3) merchants or corporations, and (4) MPs through orders for bills. Unfortunately
in the fourth case, we cannot be sure which MP introduced the bill. Nevertheless this category is
revealing as it reflects tendencies for MPs themselves to push bills. The left hand side of Table
13 shows the number of bills promoted by each group in all legislative sessions and when the
Whigs and Tories were in the majority. Overall landowners and city leaders promoted more than
two-thirds of the bills. Looking at the differences between parties, one interesting result is that
landowners were more likely to promote bills under the Tories than Whigs. Another interesting
result is that merchants were more likely to promote bills under the Whigs than the Tories. We
would expect these patterns if under Whig majorities merchant promoters believed their bill
would be treated more favorably and if under Tory majorities landowner promoters believed
their bill would be treated more favorably.
The right hand side of table 13 shows groups named to control river navigation authorities by
the provisions of the act. Overall landowners were the most common group to control river
navigation authorities with city leaders being less common. Interestingly there is little difference
between the two parties in terms of who was named to run a river navigation authority. The
differences in who promoted bills did not translate into different groups running the navigation
authority. One explanation concerns selection on project quality. Landowners who had projects
with marginal quality were more likely to take a chance and promote their bills under the Tories,
however, because of marginal quality their project already had a lower chance of succeeding.

46
Table 13: Promotion of Bills by Group and by Party
Bills
Acts
all
all
Groups named in first to
petition for a river act number
percent
of total
Groups named to control
river navigation authority number
percent
of total
Mayor or city leaders 27 37
Mayor or city leaders 12 35.2
Landowners 23 31.5
Landowners 19 55.8
Merchants 11 15
Merchants 3 8.8
Unknown Bill ordered 12 16.4
when Whigs are in
majority
when Whigs are in
majority
Groups named in first to
petition for a river act number
percent of
total
Groups named to control
river navigation authority number
percent
of total
Mayor or city leaders 18 34.6
Mayor or city leaders 8 32
Landowners 14 26.9
Landowners 15 60
Merchants 10 19.2
Merchants 2 8
Unknown Bill ordered 10 19.2
when Tories are in
majority
when Tories are in
majority
Groups named in first to
petition for a river act number
percent of
total
Groups named to control
river navigation authority number
percent
of total
Mayor or city leaders 9 42.8
Mayor or city leaders 4 44.4
Landowners 9 42.8
Landowners 4 44.4
Merchants 1 4.7
Merchants 1 11.1
Unknown Bill ordered 2 9.5
VIII. Implications of Politics on Development
The effects of politics are further illustrated by studying several counter-factual scenarios.
Ruling party strength was rarely constant within constituencies. Many went in and out of the
ruling party with regularity. The implication is that few constituencies were permanently at a
disadvantage in getting river acts because they were always with the ruling party. The first
counter-factual helps to make this point by considering an alternative scenario where 50 percent
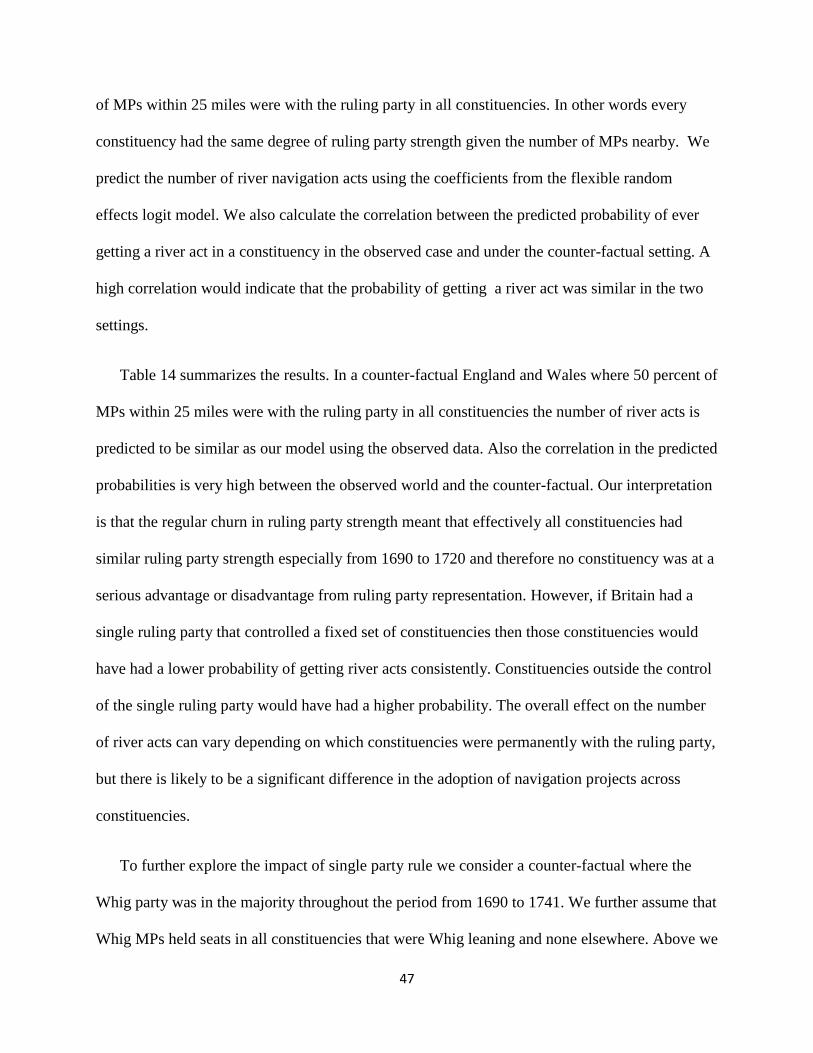
47
of MPs within 25 miles were with the ruling party in all constituencies. In other words every
constituency had the same degree of ruling party strength given the number of MPs nearby. We
predict the number of river navigation acts using the coefficients from the flexible random
effects logit model. We also calculate the correlation between the predicted probability of ever
getting a river act in a constituency in the observed case and under the counter-factual setting. A
high correlation would indicate that the probability of getting a river act was similar in the two
settings.
Table 14 summarizes the results. In a counter-factual England and Wales where 50 percent of
MPs within 25 miles were with the ruling party in all constituencies the number of river acts is
predicted to be similar as our model using the observed data. Also the correlation in the predicted
probabilities is very high between the observed world and the counter-factual. Our interpretation
is that the regular churn in ruling party strength meant that effectively all constituencies had
similar ruling party strength especially from 1690 to 1720 and therefore no constituency was at a
serious advantage or disadvantage from ruling party representation. However, if Britain had a
single ruling party that controlled a fixed set of constituencies then those constituencies would
have had a lower probability of getting river acts consistently. Constituencies outside the control
of the single ruling party would have had a higher probability. The overall effect on the number
of river acts can vary depending on which constituencies were permanently with the ruling party,
but there is likely to be a significant difference in the adoption of navigation projects across
constituencies.
To further explore the impact of single party rule we consider a counter-factual where the
Whig party was in the majority throughout the period from 1690 to 1741. We further assume that
Whig MPs held seats in all constituencies that were Whig leaning and none elsewhere. Above we
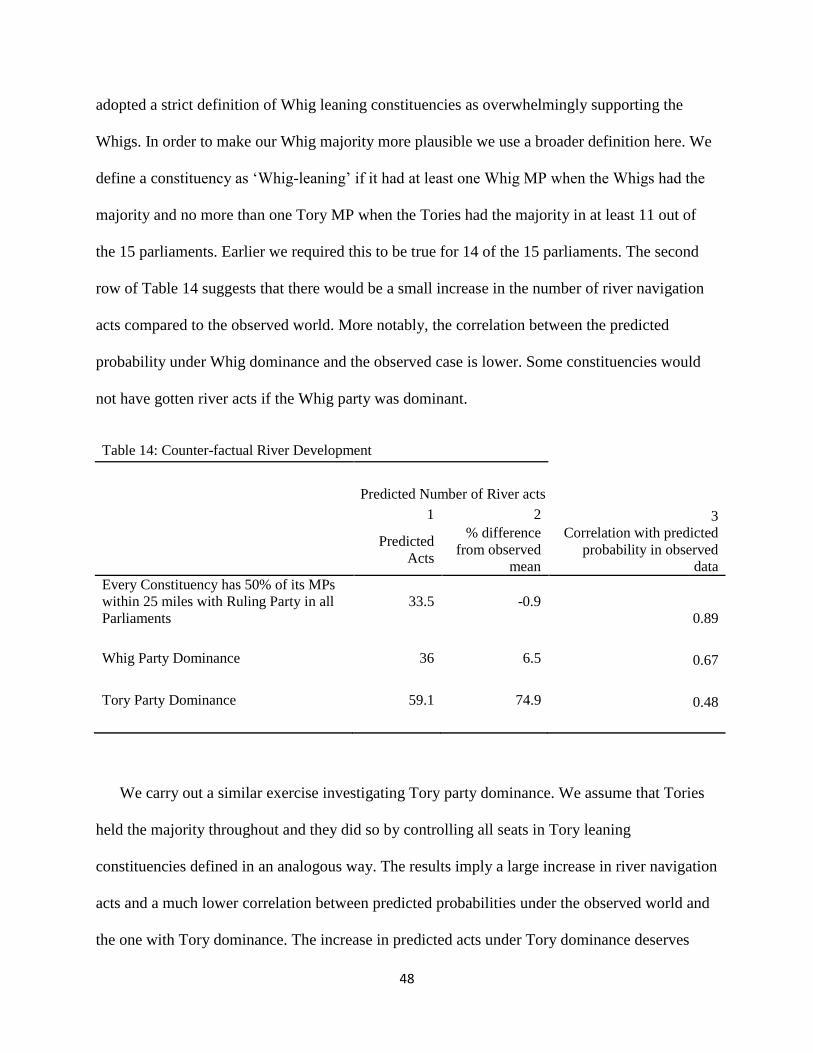
48
adopted a strict definition of Whig leaning constituencies as overwhelmingly supporting the
Whigs. In order to make our Whig majority more plausible we use a broader definition here. We
define a constituency as ‘Whig-leaning’ if it had at least one Whig MP when the Whigs had the
majority and no more than one Tory MP when the Tories had the majority in at least 11 out of
the 15 parliaments. Earlier we required this to be true for 14 of the 15 parliaments. The second
row of Table 14 suggests that there would be a small increase in the number of river navigation
acts compared to the observed world. More notably, the correlation between the predicted
probability under Whig dominance and the observed case is lower. Some constituencies would
not have gotten river acts if the Whig party was dominant.
Table 14: Counter-factual River Development
Predicted Number of River acts
1 2 3
Predicted
Acts
% difference
from observed
mean
Correlation with predicted
probability in observed
data
Every Constituency has 50% of its MPs
within 25 miles with Ruling Party in all
Parliaments
33.5 -0.9
0.89
Whig Party Dominance 36 6.5 0.67
Tory Party Dominance 59.1 74.9 0.48
We carry out a similar exercise investigating Tory party dominance. We assume that Tories
held the majority throughout and they did so by controlling all seats in Tory leaning
constituencies defined in an analogous way. The results imply a large increase in river navigation
acts and a much lower correlation between predicted probabilities under the observed world and
the one with Tory dominance. The increase in predicted acts under Tory dominance deserves

49
some explanation. Recall that the Whig rule dummy had several interaction effects including
lowering the effect of market potential. Under Tory rule, by contrast, market potential had a
greater effect and since market potential was quite important in determining river navigation
Tory dominance had a positive effect on river navigation acts. It is also worth pointing out that
the relative advantage of Tory dominance is much higher after 1715 than before. In fact during
the rage of party from 1689 to 1715 Whig party dominance is associated with a higher predicted
number of acts. The Whig effect changed over time perhaps because the characteristics of the
party changed.
IX. Conclusion
There were remarkable changes in Britain’s political system after the Glorious Revolution. One
of the most important is the emergence of a competitive two party system. The Whigs and Tories
traded places as the largest parties in the House of Commons seven times between 1690 and
1741. At the same time Britain embarked on many new policies, including the establishment of
numerous statutory authorities which extended market access through the financing of transport
infrastructure. In this paper, we study whether party politics influenced the creation of river
navigation companies in Parliament. We find evidence that party politics mattered.
Constituencies were more likely to get a river navigation act if there were fewer ruling party MPs
in their area. Our theory is that the ruling party, especially the Whigs, targeted rejections to
satisfy vested interests who supported them in the previous election.
The implication of our findings for the politics of development after the Glorious
Revolution are subtle. On the one hand, it is clear that Britain did not make the full transition to
open access in the decades after the Glorious Revolution. As the evidence shows political

50
characteristics influenced whether a constituency got river navigation acts. On the other hand,
party competition at the national level meant that the ruling party rarely controlled a constituency
for long. The advantages to vested interests were not permanent. The other striking feature of
Britain in this period is that its politicians behaved as though they placed a non-trivial weight on
efficiency and development considerations when making decisions. Numerous arguments were
made on behalf or against river navigation projects. Many were based on sound economic
arguments. It is significant that Britain’s politicians took these views into account.
References
Acemoglu, Daron and James Robinson. Why Nations Fail: The Origins of Power, Prosperity, and
Poverty. (Crown, 2012).
Albert, W. The Turnpike Road System in England, 1663-1840. (Cambridge, 1972).
Besley, Tim, Torsten Persson and Daniel Sturm. “Political Competition and Economic Performance:
Evidence from the United States”, Review of Economic Studies, 77 (2010), pp. 1329-1352.
Bogart, D. ‘Did Turnpike Trusts Increase Transport Investment?’, Journal of Economic History 65
(2005), pp. 439-468.
Bogart, D. and Richardson, G. ‘Property Rights and Parliament in Industrializing Britain. ’ Journal of
Law & Economics 54 (May 2011), pp. 241-274.
Bogart, D. ‘Did the Glorious Revolution Contribute to the Transport Revolution? Evidence from
Investment in Roads and Rivers,’ Economic History Review 64 (November 2011), pp. 1073-1112.
Bogart, D. ‘The Transport Revolution in Industrializing Britain: A Survey,’ Working Paper Department
of Economics UC Irvine.
Bogart, D. and Oandasan, R. ‘The Geography of Representation During the Rage of Party,’ mimeo.
Bosker, Maarten, Buringh, Eltjo, and Jan Luiten Van Zanden. “The rise and decline of European
parliaments, 1188–1789," Economic History Review 65 (2012), pp. 835-86.
Clark, G. ,‘The Political Foundations of Modern Economic Growth: England, 1540-1800.’ Journal of
Interdisciplinary History 26 (1996), pp. 563-588.
Cox, Gary and Mathew McCubbins. “Electoral Politics as a Redistributive Game.” The Journal ofPolitics
48 (1986), pp. 370–389.
51
Gary Cox. “War, Moral Hazard and Ministerial Responsibility: England after the Glorious
Revolution.” Journal of Economic History 71 (2011), pp. 133-161.
Cruickshanks, Eveline, Stuart Handley, and D.W. Hayton. 2002. The House of Commons 1690-1715.
(Cambridge, 2002).
Dixit, Avinash and John Londregan. “The Determinants of Success of Special Interests in Redistributive
Politics.” The Journal of Politics 58 (1996), pp. 1132–1155.
Ferguson, Thomas, and Joachim Voth. “Betting on Hitler: The Value of Political Connections in Nazi
Germany”, Quarterly Journal of Economics, 123 (2008), pp. 101-137.
Great Britain. Parliament. House of Commons. Journals of the House of Commons (London, 1803).
Great Britain. Parliament. House of Lords. Journals of the House of Lords. (London, 1891).
Handley, S. ‘Local Legislative Initiatives for Economic and Social Development in Lancashire,1689
1731,’ Parliamentary History 9 (1990), pp. 14-37.
Hanham, Andrew A. “Bath” http://www.historyofparliamentonline.org/volume/1690
1715/constituencies/bath. Accessed Dec. 12, 2012.
Harris, T. Politics Under the Later Stuarts: Party Conflict in a Divided Society 1660-1715 (Longman,
1993).
Harris, Ron, Industrializing English Law: Entrepreneurship and Business Organization, 1720–1844
(Cambridge, 2000).
Holmes, G., The Making of a Great Power: Late Stuart and Early Georgian Britain. 1660-1722 (London,
1993).
Holmes, G. British Politics in the Age of Anne, rev. ed. (London: Hambledon, 1987).
Hoppit, J., ‘Patterns of Parliamentary Legislation.’ Historical Journal. 39 (1996), pp. 109-131.
Hoppit, J., Failed Legislation, 1660-1800. (London, 1997).
Horrowitz, H. Parliament, Policy, and the Politics in the Reign of William III. (Manchester, 1977).
Keefer, Phillip and Stephen Knack, Boondoggles, Rent-Seeking, and Political Checks and Balances:
Public Investment under Unaccountable Governments. The Review of Economics and Statistics
89 (2007), pp. 566–572
Klerman, D. and P.G. Mahoney, ‘The Value of Judicial Independence: Evidence from Eighteenth Century
England’, American Law and Economics Review 7 (2005), pp. 1-27.
Konrad, K.A. Strategy and dynamics in contests. (Oxford, 2009).
52
North, D. C. and Weingast, B., ‘Constitutions and Commitment: The Evolution of Institutions Governing
Public Choice in Seventeenth-Century England.’ The Journal of Economic History 49 (1989), pp.
803-832.
North, D. C., Weingast, B. and Wallis, J. Violence and Social Orders: A Conceptual Framework for
Interpreting Recorded Human History. (Cambridge 2009).
Pawson, E., Transport and Economy: The Turnpike Roads of Eighteenth Century Britain (New York,
1977).
Pincus, Steven. 1688: The First Modern Revolution. (Yale 2009).
Pincus, Steve, and James Robinson. What Really Happened During the Glorious Revolution? NBER
Working Paper No. 17206
Quinn, S., ‘The Glorious Revolution’s Effect on English Private Finance: A Microhistory, 1680-1705,’
Journal of Economic History 61 (2001), pp. 593-615.
Sedgwick R. The House of Commons 1715-1754. (Oxford, 1970).
Stergios Skaperdas & Samarth Vaidya. "Persuasion as a contest," Economic Theory 51 (2012), pp. 465
486.
Speck, W. A. Tory and Whig: The Struggle in the Constituencies, 1701-1715 (London, 1970).
Stasavage, D., Public Debt and the Birth of the Democratic State: France and Great Britain, 1688-1789
(Cambridge, 2003).
Stasavage, D. “Partisan Politics and Public Debt: The Importance of the Whig Supremacy for Britain's
Financial Revolution," European Review of Economic History, 11 (2007), pp.123-153.
Sussman, N. and Yafeh, Y., ‘Institutional Reforms, Financial Development and Sovereign Debt: Britain
1690-1790’, The Journal of Economic History, 66 (2006), pp. 906-935.
Sukhtankar, Sandip. "Sweetening the Deal? Political Connections and Sugar Mills in India." American
Economic Journal: Applied Economics, 4 (2012), pp. 43–63.
Wells, J. and Wills D., ‘Revolution, Restoration, and debt repudiation: The Jacobite Threat to England’s
Institutions and Economic Growth’, Journal of Economic History 60 (2000), pp. 418-441.
Willan, T. S., River Navigation in England, 1600-1750 (London, 1964).
Zahedieh, Nuala., ‘Regulation, Rent-Seeking, and the Glorious Revolution in the English Atlantic
Economy, Economic History Review 63 (2010), pp. 865-890.