the police and firemen’s retirement system of new...
TRANSCRIPT

The Police and Firemen’s Retirement System of New Jersey
Information Required Under Governmental Accounting Standards Board Statement No. 67 as of June 30, 2017
Conduent Human Resource Services Retirement Consulting

© 2017 Conduent Business Services, LLC. All rights reserved. Conduent™ and Conduent Design™ are trademarks of Conduent Business Services, LLC in the United States and/or other countries. Other company trademarks are also acknowledged. Document Version: R:\Baus\NJ\PFRS\VAL\2016\GASB 67 Actual @ 7.5% Funding 7% GASB\2017 PFRS GASB 67 7.5% to 7.0% Funding 7.0% GASB.docx

March 23, 2018 Director of the Division of Pension and Benefits Division of Pension and Benefits 50 West State Street One State Street Square CN 295 Trenton, New Jersey 08625-0295 Director: This valuation provides information concerning the Police and Firemen’s Retirement System of New Jersey in accordance with the Governmental Accounting Standards Board (GASB) Statement No. 67, effective for the fiscal year ending June 30, 2017. This valuation reflects Chapter 26, P.L. 2016. This law increases the accidental death benefit payable to children if there is no surviving spouse to 70% of final compensation. This valuation also reflects Chapter 83, P.L. 2016 which requires the State to make pension contributions on a quarterly basis: at least 25 percent by September 30, at least 50 percent by December 31, at least 75 percent by March 31, and at least 100 percent by June 30. Finally, the valuation reflects Chapter 98, P.L. 2017 - Lottery Enterprise Contribution Act. Under the legislation, the Police and Firemen’s Retirement System receives 1.2% of the proceeds of the Lottery Enterprise, based upon their members’ past or present employment in schools and institutions in the State for a term of 30 years. We certify that the information contained in this Actuarial Report has been prepared in accordance with generally accepted actuarial principles and practices. To the best of our knowledge, the information fairly presents the actuarial position of the Police and Firemen’s Retirement System of New Jersey in accordance with the requirements of GASB Statement No. 67 as of June 30, 2017. The Board of Trustees may use this report for the review of the operation of the Plan and as a source of information for the State financial statements. The report may also be used in the preparation of the Plan’s audited financial statements. Use of this report for any other purpose or by anyone other than the Board of Trustees or the staff of the Division of Pensions and Benefits may not be appropriate and may result in mistaken conclusions because of failure to understand applicable assumptions, methods, or inapplicability of the report for that purpose. You should ask Conduent HR Consulting to review any statement you wish to make on the results contained in this report. Conduent HR Consulting will accept no liability for any such statement made without prior review by Conduent HR Consulting. Future actuarial measurements may differ significantly from current measurements due to Plan experience differing from that anticipated by the economic and demographic assumptions, increases or decreases expected as part of the natural operation of the methodology used for these measurements, and changes in Plan provisions or applicable law. An analysis of the potential range of such future differences is beyond the scope of this valuation.
500 Plaza Drive Secaucus, New Jersey 07096-1533

In preparing the actuarial results, we have relied upon information provided by the Division of Pensions and Benefits regarding Plan provisions, Plan participants, Plan assets, contribution rates and other matters used in the actuarial valuation. Although we did not audit the data, we reviewed the data for reasonableness and consistency with the prior year’s information. The accuracy of the results presented herein is dependent on the accuracy of the data. As required under Chapter 255, P.L. 1944, experience studies are performed once in every three year period. The valuation was prepared using the demographic assumptions recommended on the basis of the July 1, 2010 – June 30, 2013 Experience Study and approved by the Board of Trustees at the February 9, 2015 Board meeting. The Treasurer has recommended a change in the economic assumptions to be used to determine the actuarially determined contribution from 7.65% per annum to:
Effective with the July 1, 2017 valuation: 7.50% per annum, Effective with the July 1, 2019 valuation: 7.30% per annum, Effective with the July 1, 2021 valuation: 7.00% per annum.
In accordance with paragraph 40 of GASB Statement No. 67, this valuation is based on a long-term expected rate of return of 7.00% per annum. However, the projected actuarially determined contributions are based on the above stated Treasurer recommended rate of investment return assumptions. In my opinion, the actuarial assumptions used are appropriate for purposes of the valuation and are reasonably related to the experience of the System and to reasonable long-term expectations. The mortality improvement assumption was selected in accordance with Actuarial Standard of Practice No. 35. This report was prepared under my supervision. I am a Fellow of the Society of Actuaries and a Member of the American Academy of Actuaries. I meet the Academy’s qualification Standards to issue this Statement of Actuarial Opinion. This report has been prepared in accordance with all applicable Actuarial Standards of Practice. I am available to answer questions and supply any additional information. Respectfully submitted,
Aaron Shapiro, FSA, EA, MAAA Principal, Consulting Actuary Conduent HR Consulting, LLC

Table of Contents
Section I
GASB 67 Information ................................................................................................ 1
Section II
Actuarial Assumptions and Methods ....................................................................... 12
Section III
Summary of Plan Provisions ................................................................................... 15
Appendix A
Information on Projected Returns by Asset Class Provided by the Division of Pensions and Benefits ................................................. 20

Page 1
Section I – GASB 67 Information
Notes to the Financial Statements for the Year Ended June 30, 2017
Summary of Significant Accounting Policies
Method used to value investments: Investments are reported at fair value.
Actuarial cost method: Entry Age Normal – Level Percentage of Pay
Plan Description
Plan administration. The State of New Jersey Division of Pensions and Benefits administers the Police and Firemen’s Retirement System of New Jersey (Plan), a governmental cost sharing multiple-employers defined benefit pension plan that provides pensions for all individuals who become full-time policemen and firemen and who at the time of enrollment are no older than age 35.
The general responsibility for the proper operation of the Plan is vested in the Board of Trustees (Board), and the pension committees established pursuant to Chapter 78 P.L. 2011.
The Board of Trustees consists of 11 members, two policeman and two firemen who are active members of the System, one retiree of the System, five members appointed by the Governor and the State Treasurer. The Director of the Division of Pensions and Benefits of the State Department of the Treasury shall appoint a qualified employee of the division who shall be the secretary of the Board.
In accordance with Chapter 78, P.L. 2011, a pension committee is to be established for the State portion of the System and the Local portion of the System when the "target funded ratio" is achieved. The “target funded ratio” is defined as the ratio of the actuarial value of assets over the actuarially determined accrued liabilities expressed as a percentage that will be 75% in State fiscal year 2012, and increased annually by equal increments in each of the subsequent seven fiscal years, until the ratio reaches 80% at which time it is to remain for all subsequent fiscal years. The Local portion of the System has attained the required "target funded ratio" in Fiscal Year 2012, thus a pension committee has been established for the Local Employer portion of the System. The State portion of the System has not attained the required “target funded ratio” and thus the pension committee has not been established for the State portion of the System.
The pension committees consist of ten members; five members appointed by the Governor as representatives of the public employer whose employees are enrolled in the retirement system, two members who shall be appointed by the head of the union representing the greatest number of police office members , one member who shall be appointed by the head of the union representing the second greatest number of police officer members, one member appointed by the head of the union representing the greatest number of firefighter members and one member who shall be appointed by the head of the union representing the second greatest number of firefighter members.

Page 2
Chapter 78, P.L. 2011 grants the authority to amend the benefit terms of the Plan to the pension committees. The pension committees will have the discretionary authority to modify the member contribution rate, formula for calculation of final compensation, age at which a member may be eligible and the benefits for service and special retirement and benefits provided for disability benefit. The pension committees will have the authority to reactivate the cost of living adjustment and set the duration and extent of the activation. The pension committees must give priority consideration to the reactivation of the cost of living adjustment. No decision of the pension committees shall be implemented if the direct or indirect result of the decision will be that the Plan’s funded ratio falls below the target funded ratio in any valuation period during the 30 years following the implementation of the decision.
Plan membership. Pension plan membership consisted of the following:
June 30, 2015 June 30, 2016
Inactive plan members or beneficiaries currently receiving 41,824 43,011
Inactive plan members entitled to but not yet receiving 51 47
Active plan members 40,359 40,789
82,234 83,847
Benefits provided. Please see Section III of the report for a summary of Plan provisions.
Contributions. The Board establishes contributions based on an actuarially determined contribution recommended by an independent actuary and a contribution for the Non-Contributory Group Insurance Premium Fund (NCGIPF). The actuarially determined contribution is the estimated amount necessary to finance the costs of benefits earned by Plan members during the year, with an additional amount to finance a portion of any unfunded accrued liability. For the year ended June 30, 2017, the State and Local Employers contributed $1,088,510,734 to the Plan, per the financial statement. This amount excludes delayed enrollments, delayed appropriations, additional employer contributions, retroactive employer contributions, and transfer from other Systems. In addition, the administrative loan fee revenue is not included and has been used as an offset to administrative expenses.
Investments
Rate of return. The money-weighted rate of return expresses investment performance, net of investment expense, adjusted for the changing amounts actually invested. A system specific money-weighted rate of return has not been calculated. The annual money-weighted rate of return on pension plan investments, net of pension plan investment expense, for the co-mingled trust is as follows.
June 30, 2016 June 30, 2017 (1.15)% 13.01%
Receivables
Short term contributions due as of the end of the reporting period. The statutorily required Local employers’ receivable pension contributions due by the end of the reporting period. The Local employers’ statutorily required contribution is calculated as of the July 1 preceding the fiscal year in which contributions are made. The fiscal year ended June 30, 2016 Plan Fiduciary Net Position includes the statutorily required contribution of $779,745,389 which was determined by the July 1, 2015 actuarial valuation and is payable by June 30, 2017 and a contribution of $35,500,000 for the NCGIPF. The fiscal year ended June 30, 2017 Plan Fiduciary Net Position includes the statutorily required contribution of $849,312,733 which was determined by the July 1, 2016 actuarial valuation and is payable by June 30, 2018 and $35,809,000 for the NCGIPF.

Page 3
Contributions that are payable to the pension plan more than one year after the end of the reporting period. The present value as of the end of the Plan’s reporting period of statutorily required contributions to the Plan by certain Local employers who participated in Chapter 19, P.L. 2009 and/or incurred additional liabilities due to its adoption of prior early retirement incentive programs. Please see Section III of the report for a summary of Plan provisions.
The Plan Fiduciary Net Position includes the following Local employers’ receivables which are contributions that are payable to the pension plan more than one year after the end of the reporting period:
Present Value as of Fiscal Year Ended
June 30, 2016 June 30, 2017 Chapter 19, P.L. 2009 $ 129,299,915 $ 116,220,660 Early Retirement Incentive Programs 12,887,608 11,404,276
Total $ 142,187,523 $ 137,624,936
Net Pension Liability
The components of the net pension liability were as follows:
June 30, 2016 June 30, 2017 Total pension liability $ 49,402,169,913 $ 47,410,721,738 Plan fiduciary net position (23,984,726,664) (25,847,718,399)Plan’s net pension liability $ 25,417,443,249 $ 21,563,003,339 Plan fiduciary net position as a percentage
of the total pension liability 48.55% 54.52%
Actuarial assumptions
The actuarial cost method used to develop the total pension liability is the Entry Age Normal Cost-Level Percent of Pay method, as required by GASB Statements No. 67. The total pension liability as of June 30, 2017 was determined by rolling forward the Plan’s total pension liability as of July 1, 2016 to June 30, 2017 using the following actuarial assumptions, applied to all periods included in the measurement. In addition, an amount of $289,960 has been added to the liability as of June 30, 2017 equal to the amount in the June 30, 2017 Plan Fiduciary Net Position for transfers from other systems.
The Treasurer has recommended a change in the economic assumptions to be used to determine the actuarially determined contribution from 7.65% per annum to:
Effective with the July 1, 2017 valuation: 7.50% per annum, Effective with the July 1, 2019 valuation: 7.30% per annum, Effective with the July 1, 2021 valuation: 7.00% per annum.
All other methods and assumptions used to determine the total pension liability are set forth in Section II and are consistent with the assumptions used for the July 1, 2016 actuarial valuation.

Page 4
Long-Term Expected Rate of Return
The long-term expected rate of return used for this valuation is 7.00% per annum. The long-term expected rate of return on pension System investments was determined using a building-block method in which best-estimate ranges of expected future real rates of return (expected returns, net of pension System investment expense and inflation) are developed for each major asset class. These ranges are combined to produce the long-term expected rate of return by weighting the expected future real rates of return by the target asset allocation percentage and by adding expected inflation. Best estimates of arithmetic rates of return for each major asset class included in the System’s target asset allocation as of June 30, 2017 are summarized in Appendix A, as provided by the Division of Pension and Benefits.
Discount Rate
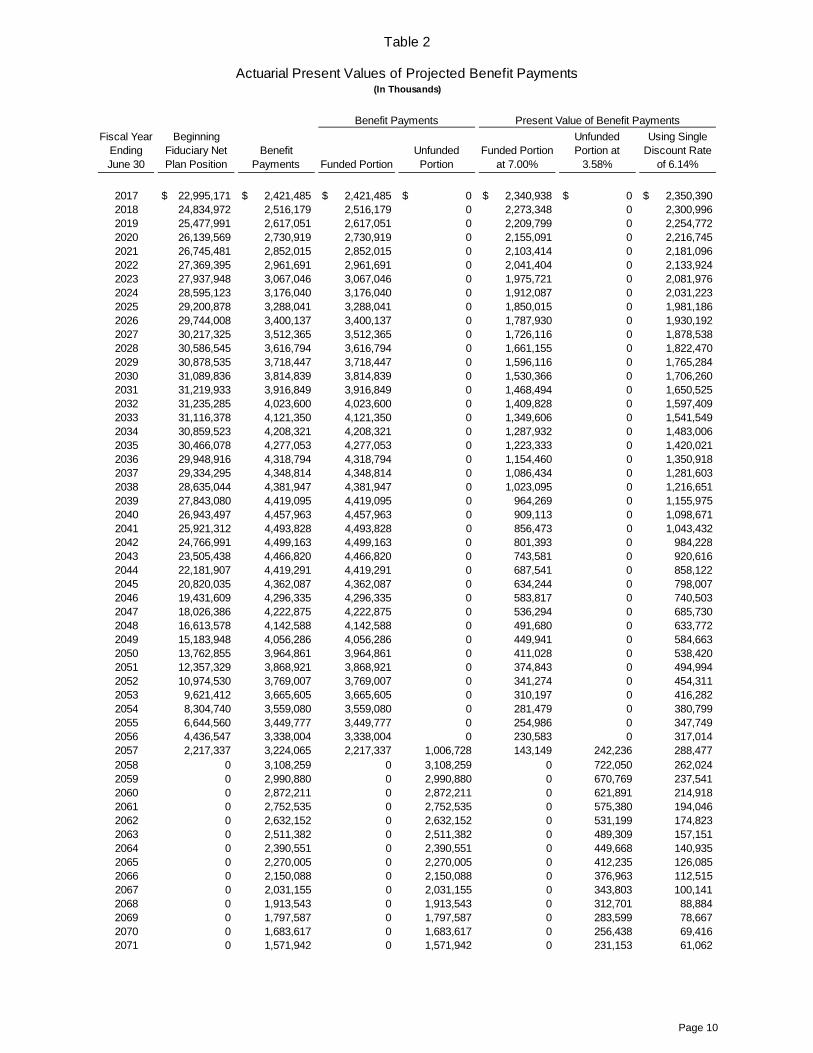
The Tables presented in pages 8 through 11 illustrate the projections and calculations used to determine the discount rate as required by paragraphs 40−45 of this Statement as of June 30, 2017. A similar analysis was performed in determining the discount rate as of June 30, 2016. In determining the discount rate on Tables 1 and 2, the Fiduciary Net Plan Position at the beginning of each year does not reflect receivable contributions as those amounts are not available at the beginning of the year to pay plan benefits. The discount rate is the single rate that reflects (1) the long-term expected rate of return on Plan investments that are expected to be used to finance the payment of benefits, to the extent that the Plan’s fiduciary net position is projected to be sufficient to make projected benefit payments and Plan assets are expected to be invested using a strategy to achieve that return, and (2) a yield or index rate for 20-year, tax-exempt general obligation municipal bonds with an average rating of AA/Aa or higher (or equivalent quality on another scale), to the extent that the conditions for use of the long-term expected rate of return are not met.
The discount rates used to measure the total pension liability were 5.55% as of June 30, 2016 and 6.14% as of June 30, 2017. As discussed with the Division of Pensions and Benefits, the projection of cash flows used to determine the discount rate as of June 30, 2017 assumed:
In accordance with Paragraph 40 of GASB Statement No. 67, the projection of the Plan’s fiduciary net position is based on a long-term expected rate of return of 7.00% per annum.
In accordance with Paragraph 37 of GASB Statement No. 67, the projection of the Plan’s contributions and projected benefit payments were based on the recommended demographic assumptions of the July 1, 2010 – June 30, 2013 Experience Study, which was approved by the Board of Trustees on February 9, 2015. The Treasurer has recommended a change in the economic assumptions to be used to determine the actuarially determined contribution from 7.65% per annum to:
Effective with the July 1, 2017 valuation: 7.50% per annum, Effective with the July 1, 2019 valuation: 7.30% per annum, Effective with the July 1, 2021 valuation: 7.00% per annum.
Please see Section II of the report for a summary of the demographic and economic assumptions used to determine the actuarially determined contribution.
It is assumed that the Locals employers will contribute 100.00% of their actuarially determined contribution and the NCGIPF contribution while the State will contribute 40.00% of the actuarially determined contribution and 100% of its NCGIPF contribution. The 40.00% contribution rate is the actual total State contribution rate paid in fiscal year ending June 30,

Page 5
2017 with respect to the actuarially determined contribution for the fiscal year ending June 30, 2017 for all State administered retirement systems.
Prior to the July 1, 2017 valuation, it is assumed the State will make pension contributions the June 30th following the valuation date. Effective with the July 1, 2017 valuation, Chapter 83, P.L. 2016 requires the State to make pension contributions on a quarterly basis: at least 25 percent by September 30, at least 50 percent by December 31, at least 75 percent by March 31, and at least 100 percent by June 30.
Under Chapter 98, P.L. 2017 - Lottery Enterprise Contribution Act, the Police and Firemen’s Retirement System receives 1.2% of the proceeds of the Lottery Enterprise, based upon their members’ past or present employment in schools and institutions in the State for a term of 30 years. Revenues from Chapter 98, P.L. 2017 – Lottery Enterprise Contribution Act are assumed to be contributed to the trust on a monthly basis.
Based on these assumptions, the pension Plan's fiduciary net position was projected to be available to make all projected future benefit payments of current Plan members until fiscal year 2057. Municipal bond rates of 2.85% as of June 30, 2016 and 3.58% as of June 30, 2017 were used in the development of the blended GASB discount rate after that point. As selected by the State Treasurer, the rates are based on the Bond Buyer Go 20-Bond Municipal Bond Index. Based on the long-term rate of return of 7.65% and the municipal bond rate of 2.85% as of June 30, 2016 and the long-term rate of return of 7.00% and the municipal bond rate of 3.58% as of June 30, 2017, the blended GASB discount rates are 5.55% as of June 30, 2016 and 6.14% as of June 30, 2017. The assumed discount rate has been determined in accordance with the method prescribed by GASB Statement No. 67. We believe this assumption is reasonable for the purposes of the measurements required by the Statement.
The projections of the Fiduciary Net Plan Position are based on contributions to the plan in accordance with the State and the Local Employers’ current funding policy and a 7.00% per annum long-term expected rate of return. Should contributions to the Plan be different from those based on the State and the Local Employers’ current funding policy, the results shown in Tables 1 and 2 would reflect the new contribution policy and may result in the Fiduciary Net Plan Position not being sufficient to cover the Plan’s benefit payments at some other future date and thus changing the discount rate used to determine the Plan’s Total Pension Liability.

Page 6
Schedules of Required Supplementary Information
Sensitivity of the net pension liability to changes in the discount rate. The following presents the net pension liability, calculated using the discount rate of 6.14%, as well as what the Plan's net pension liability would be if it were calculated using a discount rate that is 1-percentage-point lower (5.14%) or 1-percentage-point higher (7.14%) than the current rate:
1% Decrease (5.14%)
Current Discount Rate
(6.14%)
1% Increase (7.14%)
Net Pension Liability $ 27,821,627,837 $ 21,563,003,339 $ 16,422,367,495
Schedule of Changes in the Net Pension Liability and Related Ratios
Increase (Decrease)
Changes in Net Pension Liability
Total Pension Liability
(a)
Plan Fiduciary Net Position
(b)
Net Pension Liability (a) - (b)
Balances as of June 30, 2016 $ 49,402,169,913 $ 23,984,726,664 $ 25,417,443,249 Changes for the year: Service cost 1,136,338,028 1,136,338,028 Interest on total pension liability 2,738,598,309 2,738,598,309 Effect of plan changes 0 0 Effect of economic/demographic (gains) or losses 89,364,940 89,364,940 Effect of assumptions changes or inputs (3,534,553,975) (3,534,553,975) Benefit payments (2,421,485,437) (2,421,485,437) 0 Administrative expenses (4,124,457) 4,124,457 Member contributions 395,878,384 (395,878,384) Net investment income 2,791,104,860 (2,791,104,860) Employer contributions 1,088,510,734 (1,088,510,734) Transfers from other system 289,960 289,960 0 Employer contribution - Delayed Enrollment
179,386
(179,386)
Employer contribution - Delayed Appropriations
892,514
(892,514)
Employer contribution - Retroactive 11,476,881 (11,476,881) Employer contribution - Additional 268,910 (268,910) Balances as of June 30, 2017 $ 47,410,721,738 $ 25,847,718,399 $ 21,563,003,339 Plan fiduciary net position as a percentage of the total pension liability 54.52%
Covered-employee payroll as of the July 1, 2016 actuarial valuation $ 3,726,807,562 Net pension liability as a percentage of covered-employee payroll 578.59%
Notes to Schedule:
Benefit changes. Chapter 26, P.L. 2016 - This law increases the accidental death benefit payable to children if there is no surviving spouse to 70% of final compensation. Based on the demographic

Page 7
assumptions presented in Section II, Chapter 26, P.L. 2016 has no impact on the June 30, 2017 total pension liability.
Changes of assumptions. The discount rate changed from 5.55% as of June 30, 2016 to 6.14% as of June 30, 2017 in accordance with Paragraph 44 of the GASB Statement No. 67. In addition, the June 30, 2017 discount rate was determined based on a long-term expected rate of return assumption of 7.00% per annum. Please see Section II of the report for a summary of the assumptions.
Employer Contributions. Includes the State’s actual contributions of $108,754,000, State-paid Local employers’ actual contributions of $86,467,000 and Local employers’ receivable contributions of $849,312,733 and contributions to the NCGIPF of $43,977,002.
Schedule of Contributions
2016 2017 Actuarially determined contribution $1,311,849,713 $1,335,659,737 Contributions related to the actuarially determined contribution1 986,654,840 1,046,327,392 Contribution deficiency (excess) $ 325,194,873 $ 289,332,345 1. The amount represents the actual employer contributions made during fiscal year.
Notes to Schedule
Valuation date: Actuarially determined contributions are calculated as of the July 1 preceding the fiscal year in which contributions are made. That is, the contribution calculated as of the July 1, 2016 actuarial valuation will be made during the fiscal year ended June 30, 2018.
The methods and assumptions used to determine the actuarially determined contributions to the plan are set forth in Section II.
Schedule of Investment Returns
2016 2017 Annual money-weighted rate of return, net of investment expenses (1.15)% 13.01%

Page 8
Fiscal Year June 30
Beginning Fiduciary Net Plan Position
Member Contributions
Employer Contributions
Lottery Contributions
Benefit Payments
Administrative Expenses
Projected Investment Earnings
Ending Fiduciary Net Plan Position
2017 22,995,171$ 395,878$ 1,046,327$ 0$ 2,421,485$ 4,124$ 2,823,205$ 24,834,972$ 2018 24,834,972 350,810 1,115,614 12,012 2,516,179 4,248 1,685,010 25,477,991 2019 25,477,991 342,980 1,199,736 12,451 2,617,051 4,376 1,727,838 26,139,569 2020 26,139,569 332,501 1,225,569 12,859 2,730,919 4,507 1,770,409 26,745,481 2021 26,745,481 320,099 1,337,162 13,037 2,852,015 4,642 1,810,273 27,369,395 2022 27,369,395 309,148 1,362,347 13,190 2,961,691 4,781 1,850,340 27,937,948 2023 27,937,948 297,928 1,528,627 13,343 3,067,046 4,925 1,889,248 28,595,123 2024 28,595,123 284,967 1,556,743 13,505 3,176,040 5,073 1,931,653 29,200,878 2025 29,200,878 271,387 1,581,066 13,670 3,288,041 5,225 1,970,273 29,744,008 2026 29,744,008 256,657 1,603,892 13,836 3,400,137 5,381 2,004,450 30,217,325 2027 30,217,325 242,357 1,597,507 14,005 3,512,365 5,543 2,033,259 30,586,545 2028 30,586,545 229,218 1,615,598 14,165 3,616,794 5,708 2,055,511 30,878,535 2029 30,878,535 215,661 1,633,242 14,275 3,718,447 5,868 2,072,438 31,089,836 2030 31,089,836 202,042 1,650,589 14,419 3,814,839 6,020 2,083,906 31,219,933 2031 31,219,933 186,544 1,648,241 14,565 3,916,849 6,181 2,089,032 31,235,285 2032 31,235,285 169,372 1,641,135 14,712 4,023,600 6,350 2,085,824 31,116,378 2033 31,116,378 152,705 1,629,957 14,860 4,121,350 6,504 2,073,477 30,859,523 2034 30,859,523 136,347 1,618,311 15,011 4,208,321 6,641 2,051,848 30,466,078 2035 30,466,078 121,689 1,608,415 15,162 4,277,053 6,750 2,021,375 29,948,916 2036 29,948,916 110,219 1,602,106 15,315 4,318,794 6,816 1,983,349 29,334,295 2037 29,334,295 99,618 1,602,282 15,470 4,348,814 6,863 1,939,056 28,635,044 2038 28,635,044 87,242 1,605,309 15,626 4,381,947 6,915 1,888,721 27,843,080 2039 27,843,080 72,967 1,606,084 15,784 4,419,095 6,974 1,831,651 26,943,497 2040 26,943,497 57,206 1,602,793 15,943 4,457,963 7,035 1,766,871 25,921,312 2041 25,921,312 40,812 1,596,150 16,104 4,493,828 7,092 1,693,533 24,766,991 2042 24,766,991 28,326 1,588,013 16,267 4,499,163 7,100 1,612,104 23,505,438 2043 23,505,438 21,561 1,587,543 16,431 4,466,820 7,049 1,524,803 22,181,907 2044 22,181,907 16,670 1,597,186 16,597 4,419,291 6,974 1,433,940 20,820,035 2045 20,820,035 12,731 1,610,224 16,764 4,362,087 6,884 1,340,826 19,431,609 2046 19,431,609 9,591 1,625,155 16,933 4,296,335 6,780 1,246,213 18,026,386 2047 18,026,386 7,111 1,641,768 17,104 4,222,875 6,664 1,150,748 16,613,578 2048 16,613,578 5,189 1,659,863 0 4,142,588 6,537 1,054,443 15,183,948 2049 15,183,948 3,722 1,680,051 0 4,056,286 6,401 957,821 13,762,855 2050 13,762,855 2,618 1,700,973 0 3,964,861 6,257 862,001 12,357,329 2051 12,357,329 1,789 1,722,977 0 3,868,921 6,106 767,462 10,974,530 2052 10,974,530 1,190 1,745,964 0 3,769,007 5,948 674,683 9,621,412 2053 9,621,412 758 1,769,830 0 3,665,605 5,785 584,130 8,304,740 2054 8,304,740 460 1,414,281 0 3,559,080 5,617 489,776 6,644,560 2055 6,644,560 263 878,533 0 3,449,777 5,444 368,412 4,436,547 2056 4,436,547 136 905,528 0 3,338,004 5,268 218,398 2,217,337 2057 2,217,337 64 933,389 0 3,224,065 5,088 67,701 0 2058 0 0 0 0 3,108,259 4,905 0 0 2059 0 0 0 0 2,990,880 4,720 0 0 2060 0 0 0 0 2,872,211 4,533 0 0 2061 0 0 0 0 2,752,535 4,344 0 0 2062 0 0 0 0 2,632,152 4,154 0 0 2063 0 0 0 0 2,511,382 3,963 0 0 2064 0 0 0 0 2,390,551 3,773 0 0 2065 0 0 0 0 2,270,005 3,582 0 0 2066 0 0 0 0 2,150,088 3,393 0 0 2067 0 0 0 0 2,031,155 3,205 0 0 2068 0 0 0 0 1,913,543 3,020 0 0 2069 0 0 0 0 1,797,587 2,837 0 0 2070 0 0 0 0 1,683,617 2,657 0 0 2071 0 0 0 0 1,571,942 2,481 0 0
Projection of Fiduciary Net Position(In Thousands)
Table 1

Page 9
Fiscal Year June 30
Beginning Fiduciary Net Plan Position
Member Contributions
Employer Contributions
Lottery Contributions
Benefit Payments
Administrative Expenses
Projected Investment Earnings
Ending Fiduciary Net Plan Position
2072 0$ 0$ 0$ 0$ 1,462,846$ 2,309$ 0$ 0$ 2073 0 0 0 0 1,356,594 2,141 0 0 2074 0 0 0 0 1,253,439 1,978 0 0 2075 0 0 0 0 1,153,611 1,821 0 0 2076 0 0 0 0 1,057,332 1,669 0 0 2077 0 0 0 0 964,813 1,523 0 0 2078 0 0 0 0 876,266 1,383 0 0 2079 0 0 0 0 791,888 1,250 0 0 2080 0 0 0 0 711,867 1,123 0 0 2081 0 0 0 0 636,375 1,004 0 0 2082 0 0 0 0 565,552 893 0 0 2083 0 0 0 0 499,511 788 0 0 2084 0 0 0 0 438,325 692 0 0 2085 0 0 0 0 382,027 603 0 0 2086 0 0 0 0 330,601 522 0 0 2087 0 0 0 0 283,984 448 0 0 2088 0 0 0 0 242,061 382 0 0 2089 0 0 0 0 204,674 323 0 0 2090 0 0 0 0 171,619 271 0 0 2091 0 0 0 0 142,658 225 0 0 2092 0 0 0 0 117,521 185 0 0 2093 0 0 0 0 95,912 151 0 0 2094 0 0 0 0 77,518 122 0 0 2095 0 0 0 0 62,017 98 0 0 2096 0 0 0 0 49,086 77 0 0 2097 0 0 0 0 38,412 61 0 0 2098 0 0 0 0 29,697 47 0 0 2099 0 0 0 0 22,666 36 0 0 2100 0 0 0 0 17,065 27 0 0 2101 0 0 0 0 12,665 20 0 0 2102 0 0 0 0 9,261 15 0 0 2103 0 0 0 0 6,672 11 0 0 2104 0 0 0 0 4,736 7 0 0 2105 0 0 0 0 3,315 5 0 0 2106 0 0 0 0 2,292 4 0 0 2107 0 0 0 0 1,569 2 0 0 2108 0 0 0 0 1,068 2 0 0 2109 0 0 0 0 726 1 0 0 2110 0 0 0 0 496 1 0 0 2111 0 0 0 0 343 1 0 0 2112 0 0 0 0 242 0 0 0 2113 0 0 0 0 174 0 0 0 2114 0 0 0 0 128 0 0 0 2115 0 0 0 0 96 0 0 0 2116 0 0 0 0 74 0 0 0 2117 0 0 0 0 58 0 0 0 2118 0 0 0 0 45 0 0 0 2119 0 0 0 0 35 0 0 0 2120 0 0 0 0 27 0 0 0 2121 0 0 0 0 21 0 0 0 2122 0 0 0 0 15 0 0 0 2123 0 0 0 0 11 0 0 0 2124 0 0 0 0 8 0 0 0 2125 0 0 0 0 5 0 0 0 2126 0 0 0 0 4 0 0 0 2127 0 0 0 0 2 0 0 0 2128 0 0 0 0 1 0 0 0 2129 0 0 0 0 1 0 0 0
Projection of Fiduciary Net Position(In Thousands)
Table 1(continued)
Page 10
Fiscal Year Ending June 30
Beginning Fiduciary Net Plan Position
Benefit Payments Funded Portion
Unfunded Portion
Funded Portion at 7.00%
Unfunded Portion at
3.58%
Using Single Discount Rate
of 6.14%
2017 22,995,171$ 2,421,485$ 2,421,485$ 0$ 2,340,938$ 0$ 2,350,390$ 2018 24,834,972 2,516,179 2,516,179 0 2,273,348 0 2,300,996 2019 25,477,991 2,617,051 2,617,051 0 2,209,799 0 2,254,772 2020 26,139,569 2,730,919 2,730,919 0 2,155,091 0 2,216,745 2021 26,745,481 2,852,015 2,852,015 0 2,103,414 0 2,181,096 2022 27,369,395 2,961,691 2,961,691 0 2,041,404 0 2,133,924 2023 27,937,948 3,067,046 3,067,046 0 1,975,721 0 2,081,976 2024 28,595,123 3,176,040 3,176,040 0 1,912,087 0 2,031,223 2025 29,200,878 3,288,041 3,288,041 0 1,850,015 0 1,981,186 2026 29,744,008 3,400,137 3,400,137 0 1,787,930 0 1,930,192 2027 30,217,325 3,512,365 3,512,365 0 1,726,116 0 1,878,538 2028 30,586,545 3,616,794 3,616,794 0 1,661,155 0 1,822,470 2029 30,878,535 3,718,447 3,718,447 0 1,596,116 0 1,765,284 2030 31,089,836 3,814,839 3,814,839 0 1,530,366 0 1,706,260 2031 31,219,933 3,916,849 3,916,849 0 1,468,494 0 1,650,525 2032 31,235,285 4,023,600 4,023,600 0 1,409,828 0 1,597,409 2033 31,116,378 4,121,350 4,121,350 0 1,349,606 0 1,541,549 2034 30,859,523 4,208,321 4,208,321 0 1,287,932 0 1,483,006 2035 30,466,078 4,277,053 4,277,053 0 1,223,333 0 1,420,021 2036 29,948,916 4,318,794 4,318,794 0 1,154,460 0 1,350,918 2037 29,334,295 4,348,814 4,348,814 0 1,086,434 0 1,281,603 2038 28,635,044 4,381,947 4,381,947 0 1,023,095 0 1,216,651 2039 27,843,080 4,419,095 4,419,095 0 964,269 0 1,155,975 2040 26,943,497 4,457,963 4,457,963 0 909,113 0 1,098,671 2041 25,921,312 4,493,828 4,493,828 0 856,473 0 1,043,432 2042 24,766,991 4,499,163 4,499,163 0 801,393 0 984,228 2043 23,505,438 4,466,820 4,466,820 0 743,581 0 920,616 2044 22,181,907 4,419,291 4,419,291 0 687,541 0 858,122 2045 20,820,035 4,362,087 4,362,087 0 634,244 0 798,007 2046 19,431,609 4,296,335 4,296,335 0 583,817 0 740,503 2047 18,026,386 4,222,875 4,222,875 0 536,294 0 685,730 2048 16,613,578 4,142,588 4,142,588 0 491,680 0 633,772 2049 15,183,948 4,056,286 4,056,286 0 449,941 0 584,663 2050 13,762,855 3,964,861 3,964,861 0 411,028 0 538,420 2051 12,357,329 3,868,921 3,868,921 0 374,843 0 494,994 2052 10,974,530 3,769,007 3,769,007 0 341,274 0 454,311 2053 9,621,412 3,665,605 3,665,605 0 310,197 0 416,282 2054 8,304,740 3,559,080 3,559,080 0 281,479 0 380,799 2055 6,644,560 3,449,777 3,449,777 0 254,986 0 347,749 2056 4,436,547 3,338,004 3,338,004 0 230,583 0 317,014 2057 2,217,337 3,224,065 2,217,337 1,006,728 143,149 242,236 288,477 2058 0 3,108,259 0 3,108,259 0 722,050 262,024 2059 0 2,990,880 0 2,990,880 0 670,769 237,541 2060 0 2,872,211 0 2,872,211 0 621,891 214,918 2061 0 2,752,535 0 2,752,535 0 575,380 194,046 2062 0 2,632,152 0 2,632,152 0 531,199 174,823 2063 0 2,511,382 0 2,511,382 0 489,309 157,151 2064 0 2,390,551 0 2,390,551 0 449,668 140,935 2065 0 2,270,005 0 2,270,005 0 412,235 126,085 2066 0 2,150,088 0 2,150,088 0 376,963 112,515 2067 0 2,031,155 0 2,031,155 0 343,803 100,141 2068 0 1,913,543 0 1,913,543 0 312,701 88,884 2069 0 1,797,587 0 1,797,587 0 283,599 78,667 2070 0 1,683,617 0 1,683,617 0 256,438 69,416 2071 0 1,571,942 0 1,571,942 0 231,153 61,062
Table 2
Actuarial Present Values of Projected Benefit Payments(In Thousands)
Benefit Payments Present Value of Benefit Payments

Page 11
Fiscal Year Ending June 30
Beginning Fiduciary Net Plan Position
Benefit Payments Funded Portion
Unfunded Portion
Funded Portion at 7.00%
Unfunded Portion at
3.58%
Using Single Discount Rate
of 6.14%
2072 0$ 1,462,846$ 0$ 1,462,846$ 0$ 207,676$ 53,536$ 2073 0 1,356,594 0 1,356,594 0 185,935 46,775 2074 0 1,253,439 0 1,253,439 0 165,859 40,718 2075 0 1,153,611 0 1,153,611 0 147,373 35,307 2076 0 1,057,332 0 1,057,332 0 130,405 30,488 2077 0 964,813 0 964,813 0 114,882 26,210 2078 0 876,266 0 876,266 0 100,732 22,428 2079 0 791,888 0 791,888 0 87,886 19,095 2080 0 711,867 0 711,867 0 76,274 16,173 2081 0 636,375 0 636,375 0 65,829 13,621 2082 0 565,552 0 565,552 0 56,481 11,405 2083 0 499,511 0 499,511 0 48,161 9,490 2084 0 438,325 0 438,325 0 40,801 7,846 2085 0 382,027 0 382,027 0 34,332 6,443 2086 0 330,601 0 330,601 0 28,683 5,253 2087 0 283,984 0 283,984 0 23,787 4,251 2088 0 242,061 0 242,061 0 19,575 3,414 2089 0 204,674 0 204,674 0 15,979 2,719 2090 0 171,619 0 171,619 0 12,936 2,148 2091 0 142,658 0 142,658 0 10,381 1,682 2092 0 117,521 0 117,521 0 8,256 1,306 2093 0 95,912 0 95,912 0 6,505 1,004 2094 0 77,518 0 77,518 0 5,076 765 2095 0 62,017 0 62,017 0 3,921 576 2096 0 49,086 0 49,086 0 2,996 430 2097 0 38,412 0 38,412 0 2,263 317 2098 0 29,697 0 29,697 0 1,689 231 2099 0 22,666 0 22,666 0 1,245 166 2100 0 17,065 0 17,065 0 905 118 2101 0 12,665 0 12,665 0 648 82 2102 0 9,261 0 9,261 0 458 57 2103 0 6,672 0 6,672 0 318 38 2104 0 4,736 0 4,736 0 218 26 2105 0 3,315 0 3,315 0 147 17 2106 0 2,292 0 2,292 0 98 11 2107 0 1,569 0 1,569 0 65 7 2108 0 1,068 0 1,068 0 43 5 2109 0 726 0 726 0 28 3 2110 0 496 0 496 0 19 2 2111 0 343 0 343 0 12 1 2112 0 242 0 242 0 8 1 2113 0 174 0 174 0 6 1 2114 0 128 0 128 0 4 0 2115 0 96 0 96 0 3 0 2116 0 74 0 74 0 2 0 2117 0 58 0 58 0 2 0 2118 0 45 0 45 0 1 0 2119 0 35 0 35 0 1 0 2120 0 27 0 27 0 1 0 2121 0 21 0 21 0 1 0 2122 0 15 0 15 0 0 0 2123 0 11 0 11 0 0 0 2124 0 8 0 8 0 0 0 2125 0 5 0 5 0 0 0 2126 0 4 0 4 0 0 0 2127 0 2 0 2 0 0 0 2128 0 1 0 1 0 0 0 2129 0 1 0 1 0 0 0
Benefit Payments Present Value of Benefit Payments
Table 2(continued)
Actuarial Present Values of Projected Benefit Payments(In Thousands)

Page 12
Section II – Actuarial Assumptions and Methods
Investment Rate of Return to Determine the Actuarially Determined Contribution: July 1, 2016 valuation: 7.65% per annum, compounded annually. July 1, 2017 valuation: 7.50% per annum, compounded annually. July 1, 2018 valuation: 7.50% per annum, compounded annually. July 1, 2019 valuation: 7.30% per annum, compounded annually July 1, 2020 valuation: 7.30% per annum, compounded annually. July 1, 2021 and later valuations: 7.00% per annum, compounded annually. Long-Term Expected Rate of Return to Project the Plan Fiduciary Net Position and GASB 67 Effective Discount Rate: 7.00% per annum, compounded annually. GASB 67 Effective Discount Rate: June 30, 2016: 5.55% per annum, compounded annually. June 30, 2017: 6.14% per annum, compounded annually.
COLA: No future COLA is assumed. Separations from Service and Salary Increases: Representative values of the assumed annual rates of separation and annual rates of salary increases are as follows: 401(a)(17) Pay Limit: $265,000 for 2016 increasing 3.00% per annum, compounded annually. Social Security Wage Base: $118,500 for 2016 increasing 4.00% per annum, compounded annually.
Annual Rates of
Select Withdrawal Ultimate
Withdrawal
Age Up to the 1st Year
2nd Year
3rd Year
4th Year
5 to 9 Years
After 9 Years
25 30 35 40 45 50 55
6.90% 9.30 9.80
13.70 3.50 0.00 0.00
2.03% 2.75 3.17 2.25 2.25 2.25 0.00
1.18% 1.76 1.76 1.85 1.85 1.85 0.00
0.60% 1.31 1.57 1.74 2.32 2.00 0.00
0.35% 0.60 0.77 0.67 1.35 1.60 0.00
0.00% 0.24 0.24 0.27 0.28 0.30 0.00
Annual Rates of
Death Ordinary Disability Age Male* Female* Accidental Ordinary Accidental 25 30 35 40 45 50 55 60 64 65 and over
.035% .041 .072 .100 .138 .195 .282 .435 .593 0.000
.019% .025 .045 .065 .103 .156 .233 .335 .445 0.000
.006% .006 .008 .008 .009 .009 .014 .013 .008 0.000
.045% .147 .265 .362 .394 .449 .554 1.024 1.680 0.000
.029% .278 .393 .423 .396 .179 .161 .161 .161 0.000
* RP2000 Employee Pre-Retirement mortality tables projected thirteen-years using Projection Scale BB and then projected on a generational basis using the Conduent Modified 2014 Projection Scales. The above tables are representative for the 2016 valuation.

Page 13
Service Retirements Salary Increases Salary Increases Length of Service Effective July 1, 2016 Effective July 1, 2015
Age
Less Than 21 Years*
21 to 24 Years
25 Years
26 or More Years
FY2016 to
FY2026
FY2026 and
thereafter
FY2012 to
FY2022
FY2022 and
thereafter 25 30 35 40 45 50 55 60 64 65 and over
4.00% 4.00 4.30 6.00 3.20 37.50 100.00
0.60% 0.60 0.60 0.00 0.00 0.00 100.00
45.57% 54.83 57.62 64.94 77.49 85.24 100.00
15.40% 15.40 18.48 24.47 27.34 51.03 100.00
8.98% 5.97 4.17 3.33 2.90 2.75 2.60 2.35 2.10
9.98% 6.97 5.17 4.33 3.90 3.75 3.60 3.35 3.10
9.48% 6.47 4.67 3.83 3.40 3.25 3.10 2.85 2.60
10.48% 7.47 5.67 4.83 4.40 4.25 4.10 3.85 3.60
* Retirement assumption prior to age 55 is for any member as of January 18, 2000 upon completion of 20 years of service. Deaths after Retirement: RP-2000 Combined Healthy Mortality Tables projected one year using Projection Scale AA and three years using the Conduent Modified 2014 Projection Scales is the base table as of the 2016 measurement date for male service retirements and will be further projected on a generational basis using the Conduent Modified 2014 Projection Scales. RP-2000 Combined Healthy Mortality Tables projected thirteen-years using Projection Scale BB and then three years projected using the Conduent Modified 2014 Projection Scales is the base table as of the 2016 measurement date for female service retirements and beneficiaries and will be further projected on a generational basis using the Conduent Modified 2014 Projection Scales. Special mortality tables are used for the period after disability retirement. The following representative values of the assumed annual rates of mortality are effective 2016:
Service Retirements
Beneficiaries
Disability Age Men Women Men Women Age Retirements 55 60 65 70 75 80 85
0.344% 0.649 1.221 2.098 3.551 6.055
10.464
0.250% 0.431 0.794 1.362 2.290 3.741 6.306
0.337% 0.602 1.059 1.750 2.959 5.026 8.658
0.250% 0.431 0.794 1.362 2.290 3.741 6.306
35 40 45 50 55 60 65
0.598% 0.634 0.803 1.058 1.210 1.426 1.949
Marriage: Husbands are assumed to be 3 years older than wives. Among the active population, 90% of participants are assumed married. No children are assumed. Neither the percentage married nor the number of children assumption is individually explicit, but they are considered reasonable as a single combined assumption. Valuation Method:
GASB actuarial cost method: Entry Age Normal – Level Percentage of Pay
Funding calculations: Projected Unit Credit Method. This method essentially funds the System’s benefits accrued to the valuation date. Experience gains and losses are recognized in future accrued liability contributions. In accordance with Chapter 78, P.L. 2011, beginning with the July 1, 2010 actuarial valuation, the accrued liability contribution shall be computed so that if the contribution is paid annually in level dollars, it will amortize the unfunded accrued liability over an open 30 year period. Beginning with the July 1, 2018 actuarial valuation, the accrued liability contribution shall be computed so that if the contribution is paid

Page 14
annually in level dollars it will amortize the unfunded accrued liability over a closed 30 year period (i.e., for each subsequent valuation, the amortization period shall decrease by one year.) Beginning with the July 1, 2028 actuarial valuation, when the remaining amortization period reaches 20 years, any increase or decrease in the unfunded accrued liability as a result of actuarial losses or gains for subsequent valuation years shall serve to increase or decrease, respectively, the amortization period for the unfunded accrued liability, unless an increase in the amortization period will cause it to exceed 20 years. If an increase in the amortization period as a result of actuarial losses for a valuation year would exceed 20 years, the accrued liability contribution shall be computed for the valuation year using a 20 year amortization period. To the extent that the amortization period remains an open period in future years and depending upon the specific circumstances, it should be noted that in the absence of emerging actuarial gains or contributions made in excess of the actuarially determined contribution, any existing unfunded accrued liability may not be fully amortized in the future. State Contribution Payable Dates: Prior to the July 1, 2017 valuation, it is assumed the State will make pension contributions the June 30th following the valuation date. Effective with the July 1, 2017 valuation, Chapter 83, P.L. 2016 requires the State to make pension contributions on a quarterly basis: at least 25 percent by September 30, at least 50 percent by December 31, at least 75 percent by March 31, and at least 100 percent by June 30. In addition, revenues from Chapter 98, P.L. 2017 – Lottery Enterprise Contribution Act are assumed to be contributed to the trust on a monthly basis. Receivable Contributions: For the July 1, 2016 valuation, State contributions are expected to be paid the June 30th following the valuation date and are discounted by the valuation interest rate of 7.65% to the valuation date. Effective with the July 1, 2017 valuation, State contributions are expected to be paid in equal quarterly amounts as of September 30th, December 31st, March 31st, and June 30th following the valuation date and are discounted by the interest rate used at the valuation date. Local contributions expected to be paid the April 1st, following the valuation are discounted by the valuation interest rate of 7.65% to the valuation date for the July 1, 2016 valuation and by the interest rate used at future valuation dates. Asset Valuation Method: GASB method used to value investments: Investments are reported at fair value. Funding calculations: A five year average of market values with write-up was used. This method takes into account appreciation (depreciation) in investments in order to smooth asset values by averaging the excess of the actual over the expected income, on a market value basis, over a five-year period.

Page 15
Section III – Summary of Plan Provisions
New Jersey Statutes, Title 43, Chapter 16A.
Eligibility for Membership
Enrollment is restricted to eligible policemen and firemen who are permanent and full-time and who pass the physical and mental fitness requirements. The maximum enrollment age is 35. 1. Definitions Plan Year The 12-month period beginning on July 1 and ending on June 30. Credited Service A year of service is credited for each year an employee is a
Member of the Retirement System plus service, if any, covered by a prior service liability.
Average Final Compensation (AFC) The average annual compensation for the three consecutive years
of Service immediately preceding retirement or the highest three consecutive fiscal years of Membership Service.
Compensation Base salary upon which contributions by a Member to the Annuity
Savings Fund were based in the last year of Service. For Accidental Death, benefits are computed at the annual rate of salary. In accordance with Chapter 1, P.L. 2010, for members hired on or after May 22, 2010 Compensation cannot exceed the annual maximum wage contribution base for Social Security pursuant to the Federal Insurance Contribution Act.
Final Compensation (FC) Annual compensation received by the member in the last 12
months of Credited Service preceding his retirement. In accordance with Chapter 1, P.L. 2010, for members hired on or after May 22, 2010, FC means the average annual compensation for the three fiscal years of membership providing the largest benefit.
Accumulated Deductions The sum of all amounts deducted from the compensation of a
Member or contributed by him or on his behalf without interest. 2. Benefits Service Retirement Eligibility means age 55 or 20 years of credited service for an
employee who was a member of the Retirement System as of January 18, 2000 and age 55 for an employee who became a member of the Retirement System after January 18, 2000; mandatory at age 65 (except that a member hired prior to January 1, 1987 may remain a member of the Retirement System until the member attains the earlier of age 68 or 25 years of creditable service). Benefit is an annual retirement allowance equal to a member annuity plus an employer pension which together equals the greater of:

Page 16
(i) 1/60th of FC for each year of Credited Service; or
(ii) 2% of FC multiplied by years of Credited Service up to 30 plus 1% of FC multiplied by years of Service over 30. (Prior to January 18, 2000, this benefit was based on AFC rather than FC. However, Policy Memorandum 4-2000, which interpreted the provisions of Chapter 428, P.L. 1999, authorized the change in the salary basis).
(iii) 50% of FC if the member has 20 or more years of
Credited Service.
Chapter 428 also requires that, in addition to the 50% of FC benefit, any member as of January 18, 2000 who will have 20 or more years of Credited Service and is required to retire upon attaining age 65 (except that a member hired prior to January 1, 1987 may remain a member of the System until the member attains the earlier of age 68 or 25 years of creditable service), shall receive an additional benefit equal to 3% of FC for each year of Credited Service over 20 years but not over 25 years.
Special Retirement After completion of 25 years of Credited Service. The annual
retirement benefit is equal to a member annuity plus an employer pension which together equal 65% of FC plus 1% of FC for each year of Credited Service over 25. Effective for members hired after June 28, 2011, the annual retirement benefit is equal to a member annuity plus an employer pension which together equal 60% of FC plus 1% of FC for each year of Credited Service over 25. There is a maximum benefit of 70% of FC (65% of FC for members hired after June 28, 2011) except for those members with 30 or more years of Credited Service on June 30, 1979.
Vested Termination (A) Eligible upon termination of service prior to age 55 and
prior to 10 years of Credited Service. The benefit equals a refund of Accumulated Deductions less any outstanding loans.
(B) Eligible upon termination of service prior to age 55 and
after 10 years of Credited Service (but less than 20 years if a member on or prior to January 18, 2000 or less than 25 years of service if a member after January 18, 2000). The benefit is a deferred retirement benefit, commencing at age 55, equal to a member annuity plus an employer pension which together provide a retirement allowance equal to 2% of FC multiplied by years of Credited Service up to 30 plus 1% of FC multiplied by years of Credited Service over 30.
Death Benefits Ordinary Death Benefit - Lump Sum (NCGIPF)
(1) If a member dies prior to retirement, the benefit payable is as follows:
A lump sum amount equal to 3-1/2 times FC payable
to the member’s beneficiary.

Page 17
(2) After retirement but prior to age 55, the benefit is as follows:
(i) For death while a Disabled Retiree the benefit is
equal to 3-1/2 times Compensation. (ii) For death while a Deferred Retiree the benefit is
equal to his Accumulated Deductions. (iii) For death while a Retiree who has completed 20
years of Credited Service, the benefit is equal to 1/2 times FC.
(3) After retirement and after age 55, the benefit payable is
equal to 1/2 times Compensation. (Note: If a Member is not disabled, 10 years of Credited Service is required for Members enrolling after July 1, 1971.)
Ordinary Death Benefit - Survivor Annuity (1) If a member dies prior to retirement, the benefit payable to
a widow (widower) is equal to 50% of FC (20% of FC payable to one child, 35% of FC payable to two children or 50% of FC payable to three or more children if there is no surviving widow or widower or if the widow or widower dies or remarries or 25% of FC payable to one parent or 40% of FC payable to two parents if no surviving widow, widower or child. If no widow, widower, child or parent, the benefit payable to a beneficiary is the aggregate Accumulated Contributions at the time of death).
(2) For any member who retired after December 18, 1967,
the benefit payable to a widow (widower) is equal to 50% of FC plus 15% of FC for one child and 25% of FC for two or more children.
If no spouse, or spouse remarries, the benefit is equal to
20% of FC for one child, 35% for two children, and 50% for three or more children.
There is also a minimum benefit payable to widows
(widowers) of $4,500 a year. (3) For any member who retired with an Accidental Disability
Benefit, the benefit payable is equal to $4,500 a year to the widow (widower). If there is no widow (widower) the benefit payable is $600 a year for 1 child, $960 a year for 2 children, and $1,500 a year for 3 or more children. The benefit for children is payable until age 18.

Page 18
Accidental Death Benefit A death while active resulting from injuries received from an
accident during performance of duty is eligible for a lump sum equal to the Accumulated Deductions plus 3-1/2 times Compensation plus an annuity benefit payable is as follows:
(i) The benefit to a widow or widower is equal to 70% of
Compensation. (ii) The benefit, when there is no spouse, or spouse is
remarried, is equal to 70% of Compensation to surviving children in equal shares. The benefit is payable while the children are under age 18, or until age 24 if they are full-time students, or it is payable for life if they are disabled.
(iii) The benefit, when there is no spouse or children, is equal
to 25% of Compensation for one parent and 40% for two parents.
(iv) The benefit, when there is no relation as stated above, is
equal to the Accumulated Deductions and is payable to a beneficiary or to the Member’s estate. This is also the minimum benefit payable under (i), (ii) and (iii).
Disability Benefits Ordinary Disability Retirement A Member is eligible for Ordinary Disability Retirement if he (she)
has 4 years of Service and is totally and permanently incapacitated from the performance of usual or available duties. The benefit is equal to the greater of:
(i) 1-1/2% of FC times the number of years of Credited
Service; or
(ii) 40% of FC. In addition, a member who has at least 20 years but less than 25
years of Credited Service and who is required to retire upon application by the employer on and after January 18, 2000 shall receive a benefit equal to a member annuity plus an employer pension which together provide a total retirement allowance equal to 50% of FC plus 3% of FC multiplied by the number of years of Credited Service over 20 but not over 25.
Accidental Disability Retirement A Member is eligible upon total and permanent incapacitation from
the performance of usual or available duties as a result of injury during the performance of regular duties. The benefit payable is equal to a Member annuity plus an employer pension which together equals 2/3 of the Compensation at date of injury.

Page 19
Special Disability Retirement A member is eligible for Special Disability Retirement if he (she)
has 5 years of Credited Service, is under age 55, and has received a heart transplant. The benefit payable is equal to a Member annuity plus an employer pension which together equals 50% of FC.
3. Member Contributions Each member contributes 8.5% of Compensation. Chapter 78,
P.L. 2011 increased the Member Contributions from 8.5% to 10.0% of Compensation effective October 2011.
4. Chapter 19, P.L. 2009 Chapter 19, P.L. 2009 provides that the State Treasurer will
reduce for Local employers the normal and accrued liability contributions to 50 percent of the amount certified for fiscal years 2009. The additional unfunded liability will be paid by Local employers in level annual payments over a period of 15 years, with the first payment due in the fiscal year ending June 30, 2012. The unfunded liability will be adjusted annually by the rate of return on the actuarial value of assets. The legislation also provides that a Local employer may opt to pay 100 percent of the recommended contribution for fiscal year 2009. Employers making this election will be credited with the full payment. In addition, certain employers who were eligible to defer 50% of their fiscal year 2009 recommended contributions but instead paid 100% of the 2009 recommended contributions are permitted to elect to defer 50% of their recommended 2010 fiscal year contributions. The additional unfunded liability will be paid by Local employers in level annual payments over a period of 15 years, with the first payment due in the fiscal year ending June 30, 2012. The unfunded liability will be adjusted by the rate of return on the actuarial value of assets.
5. Early Retirement Incentive Contribution The following legislation provides additional retirement benefits to
certain employees of Local employers: Ch. 99, P.L. 1993, Ch. 59, P.L. 1999, Ch. 126, P.L. 2000 and Ch. 130, P.L. 2003. The cost of the enhanced pension benefits will be funded by employer contributions to the retirement system and paid by the employer that elected to participate. The additional pension liability shall be paid by each electing employer entity over a period of years.

Page 20
Appendix A – Information on Projected Returns by Asset Class Provided by the Division of Pensions and Benefits

Page 21
FY18 Long-Term Expected Rate of Return
The best estimate long-term expected rate of return for the Pension Fund is based on the targeted asset allocation, long-term capital market assumptions (including compound expected returns, volatility of returns, and correlation of returns), and the application of modern portfolio theory. Long-term capital market assumptions are determined by a survey of a wide universe of third party investment professionals and reflect nominal return expectations, as well as the analysis of the Division of Investment and its team of outside investment consultants.
Asset Class
Targeted Asset Allocation
Expected Returns (Arithmetic)
Risk Mitigation Strategies 5.00% 5.51%
Cash Equivalents 5.50% 1.00%
US Treasuries 3.00% 1.87%
Investment Grade Credit 10.00% 3.78%
High Yield 2.50% 6.82%
Global Diversified Credit 5.00% 7.10%
Credit-Oriented HFs 1.00% 6.60%
Debt-Related PE 2.00% 10.63%
Debt Related Real Estate 1.00% 6.61%
Private Real Assets 2.50% 11.83%
Equity Related Real Estate 6.25% 9.23%
US Equity 30.00% 8.19%
Non-US Dev Market Eq 11.50% 9.00%
Emerging Market Eq 6.50% 11.64%
Buyouts/Venture Cap 8.25% 13.08%
Portfolio One-Year Arithmetic Return
Portfolio Standard Deviation
7.83%
12.27%
Portfolio Long-Term Expected Return 7.14%
Long-Term Expected Rate of Return 7.00%