the pmod/wrc precision spectroradiometer psr · the pmod/wrc precision spectroradiometer psr julian...
TRANSCRIPT
The PMOD/WRC Precision Spectroradiometer
PSR
Julian Gröbner, Natalia Kouremeti, Ricco Soder, Diego Wasser, Manfred Gyo, Fabian Dührig,
Etienne De Coulon
Physikalisch-Meteorologisches Observatorium Davos, World Radiation Center, Davos
Switzerland
Some of the work was performed within the EMRP project ENV03.
The European Metrology Research Programme (EMRP) is jointly funded by
the EMRP participating countries within EURAMET and the European Union.
Thanks to Saulius Nevas and Peter Sperfeld, PTB
for characterising the PSR stray light and linearity
Potential Applications
• Spectral aerosol optical depth for the eventual replacement of filter sunphotometers
• Retrieval of atmospheric parameters (ozone, water vapour, aerosols)
• absolute spectral solar irradiance measurements for photovoltaic applications
• Climatological measurements of solar irradiance (direct & global)

Some history...
August 2008 Project submitted to the regional Stiftung for Innovation, Entwicklung and
Forschung GR
September 2009 Design Study
October 2010 Benchtop model
Jan 2011-March 2012 Prototype Development
March 2012 PSR V0 First light
Mar 2014 PSR V2 First light
Mar-June PSR_003 in Izaña
June 2014 First 2 PSRs delivered to
customer
July 2014 AOD Campaign Finokalia

PSR Specifications
• Holographic flat-field grating 200 lines/mm from Zeiss
• Hamamatsu NMOS 1024 linear image sensor
• 18 bit ADC ( 262 kcounts)
• 10 ms to 40 sec integration time
• Temperature stabilised sensor ±0.1K (invar)
• Temperature insensitive optical bench (carbon)
• Wavelength range 300 – 1020 nm
• Resolution 1.5 nm to 6 nm
• Wavelength step 0.7 nm
• 2 entrance optics , direct irradiance and generic SMA
• stray-light optimised optical design with zero-order light-trap

PSR Characterisation
• Slit function and bandpass
• Linearity
• Temperature coefficients
• Stray-Light
• Telescope Flat-field
• Direct irradiance calibration
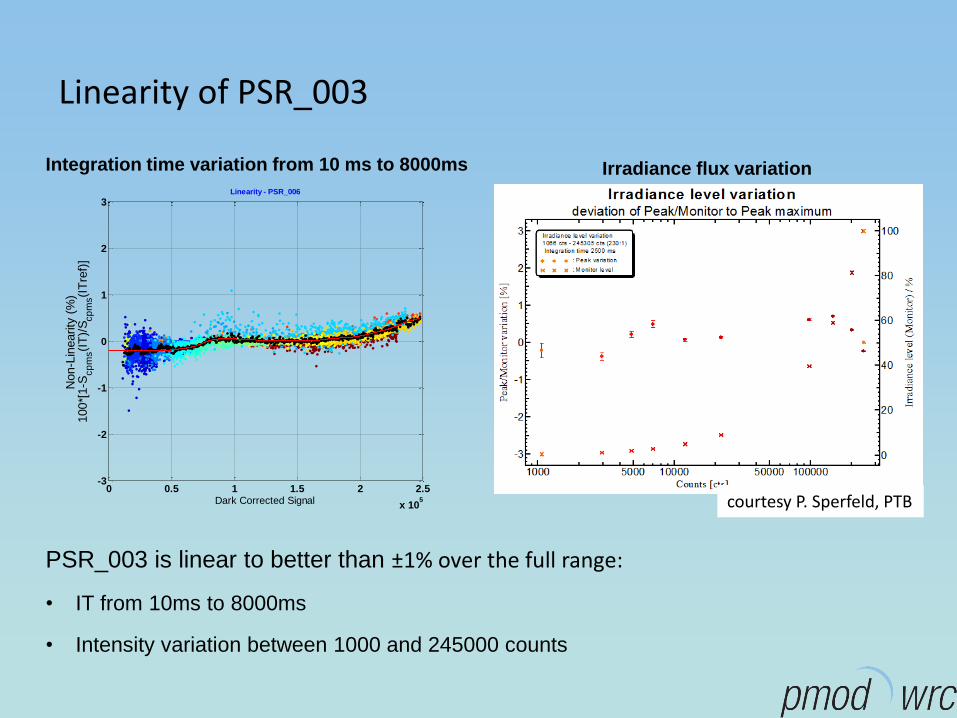
Linearity of PSR_003
Integration time variation from 10 ms to 8000ms Irradiance flux variation
PSR_003 is linear to better than ±1% over the full range:
• IT from 10ms to 8000ms
• Intensity variation between 1000 and 245000 counts
courtesy P. Sperfeld, PTB 0 0.5 1 1.5 2 2.5
x 105
-3
-2
-1
0
1
2
3
Dark Corrected Signal
Non-L
inearity
(%
)100*[
1-S
cp
ms(I
T)/
Scp
ms(I
Tre
f)]
Linearity - PSR_006

300 400 500 600 700 800 900 1000 1100-0.016
-0.014
-0.012
-0.01
-0.008 PSR_003 Temperature Depedency of Wavelength 19-Mar-2014
Wavele
ng
th S
hif
t (n
m/o
C)
wavelength (nm)
300 350 400 450 500 550 600 650-0.01
-0.005
0
0.005
0.01
F
WH
M (
nm
/oC
)
wavelength (nm)
Temperature behavior of PSR
Wavelength shift versus temperature
Optical Stability is obtained by using a carbon bench with vanishing temperature expansion coefficient.
1) from solar measurements and matSHIC
Wavelength /nm
Temp. coeff nm/K
350 0.01 ±0.004
500 0.02 ±0.01
605 0.00 ±0.03
795 -0.005 ±0.02
Using data from 60 days
dWL/T~0.01 nm K-1
sensor holder
2) Laboratory measurements
dFWHM K-1 < 0.005 nm K-1
0.01 nm = 1/70 pixel

Temperature behavior of PSR The temperature dependence of the sensitivity was determined for 4 PSR in the laboratory.
PSR Temp. coeff
%/K
003 -0.08 %
004 < 0.04 %
005 -0.06 ± 0.02 %
006 < 0.05 %
Example for PSR 006
0 50 100 150 200 250 3000
5
10
15
Erlapsed time (min)
Ben
ch
Tem
pera
ture
(oC
)
0 50 100 150 200 250 300-0.2
0
0.2
0.4
0.6
0.8
Erlapsed time (min)
Tem
pera
ture
Gra
die
nt
over
2
.7 m
in (
oC
/min
)100 200 300 400 500 600 700 800 900 1000 1100
-0.1
-0.05
0
0.05
0.1
pixel
Irra
dia
nce T
em
pera
ture
Dep
en
den
ce F
acto
r (%
)
±0.05%
The change in sensitivity is less than 0.1% / K for all PSR

Line Spread functions of various PSRs using lasers and spectral emission lamps
By default, a single gaussian fit is used
to determine FWHM and wavelength
dispersion
The stray-light rejection is > 10-5 The LSF seems very similar between
different PSRs. Here, one can clearly
see the second order line emerging from
the background
For some lines, an improved fit to the
experimental data is obtained using a
double gaussian fitting
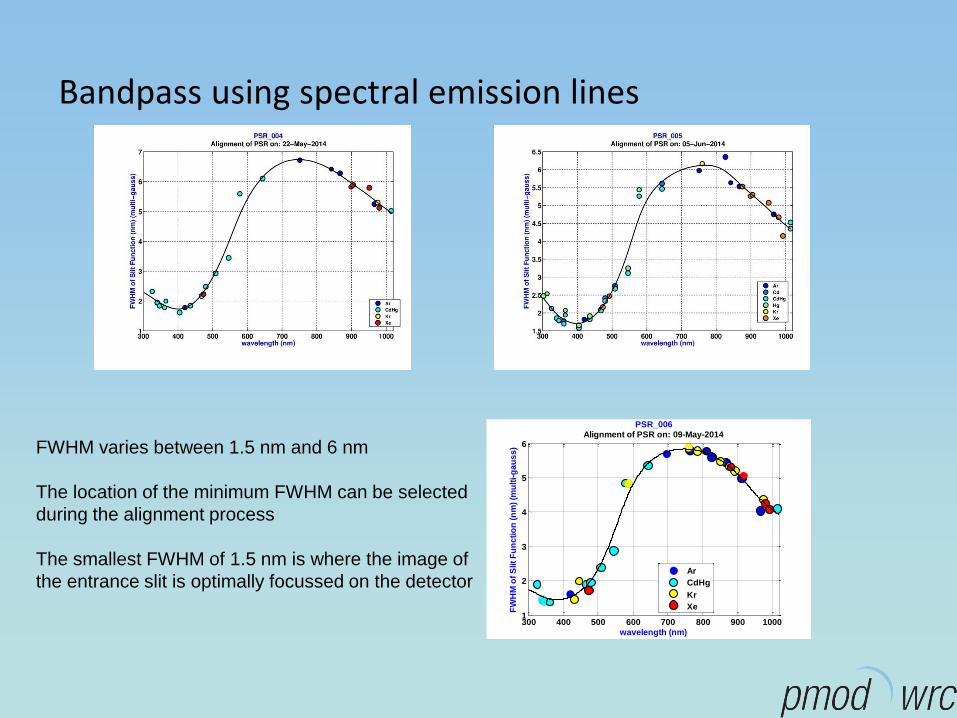
Bandpass using spectral emission lines
FWHM varies between 1.5 nm and 6 nm
The location of the minimum FWHM can be selected
during the alignment process
The smallest FWHM of 1.5 nm is where the image of
the entrance slit is optimally focussed on the detector
300 400 500 600 700 800 900 10001
2
3
4
5
6
wavelength (nm)
FW
HM
of
Slit
Fu
nc
tio
n (
nm
) (m
ult
i-g
au
ss
)
PSR_006
Alignment of PSR on: 09-May-2014
Ar
CdHg
Kr
Xe

Stray-light The slit functions were determined at the tuneable laser setup PLACOS at PTB in the range 300 to 1000 nm.
YIB=C Ymeas
The stray-light corrected signal YIB can
be retrieved from the measurement by
applying a stray-light correction matrix C
to the measured signal, followingf the
method of Zong, 2006.
Is that effort really necessary?
Why not use a single slit function to determine the stray-light matrix?

The Line-Spread functions of PSR 003 were measured at the tuneable laser facility PLACOS at PTB
The enhanced stray-light above 700 nm is specific to PSR 003 and is not consistent with
PSR 004, 005 and 006 even though the instruments were all built in house as the same batch ???
For PSR 004, 005 006 we need to use a IR corrected version (gray-line in the video).

Stray-light validation
1) Tungsten-halogen lamp and Band-pass filters
2) Solar measurements and band-pass filters
3) Solar measurements at Izaña

Stray-light validation 1) Lamp & band-pass filters
Raw Spectra from a FEL Lamp Spectrum with several band-pass and cut-on filters

Stray-light validation 1) Lamp & band-pass filters
Stray-light from the LSF of
the IR spectrum.
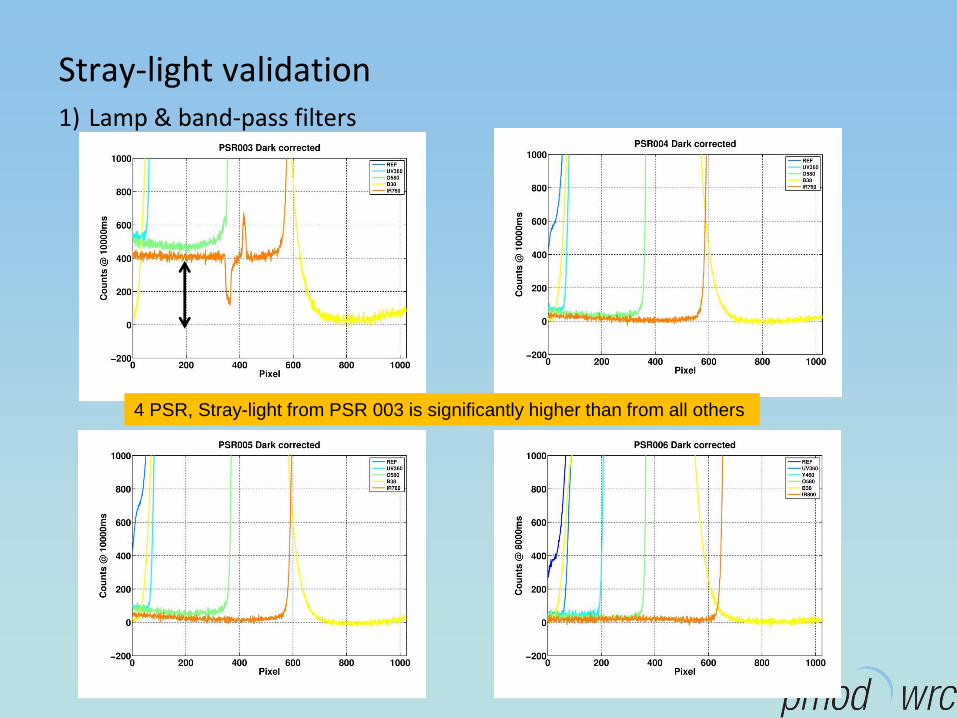
Stray-light validation 1) Lamp & band-pass filters
4 PSR, Stray-light from PSR 003 is significantly higher than from all others

Stray-light validation 1) Lamp & band-pass filters
PSR 003
PSR 003
The Stray-light correction using the
appropriate SR-Matrix is effective in
removing more than 95% of the SR-Signal
in PSR 003

Direct optic flat field
Following WMO specifications for sunphotometers measuring direct solar
irradiance:
• less than 2° field of view
• Slope angle of 1 °

Direct optic flat field – spectral "waves"
±1%
±2%
Standard Diffuser,
sandblasted on one
side
Standard Diffuser,
sandblasted on two
sides,
3 times more
transmission loss

Direct optic flat field – spectral "waves"
±1%
±2%
Standard Diffuser,
sandblasted on one
side
Standard Diffuser,
sandblasted on two
sides,
3 times more
transmission loss
Where do these spectral waves come from ?
AND
How to get rid of them?

Langley-Calibration campaign Izaña March-June 2014 2 May 2014
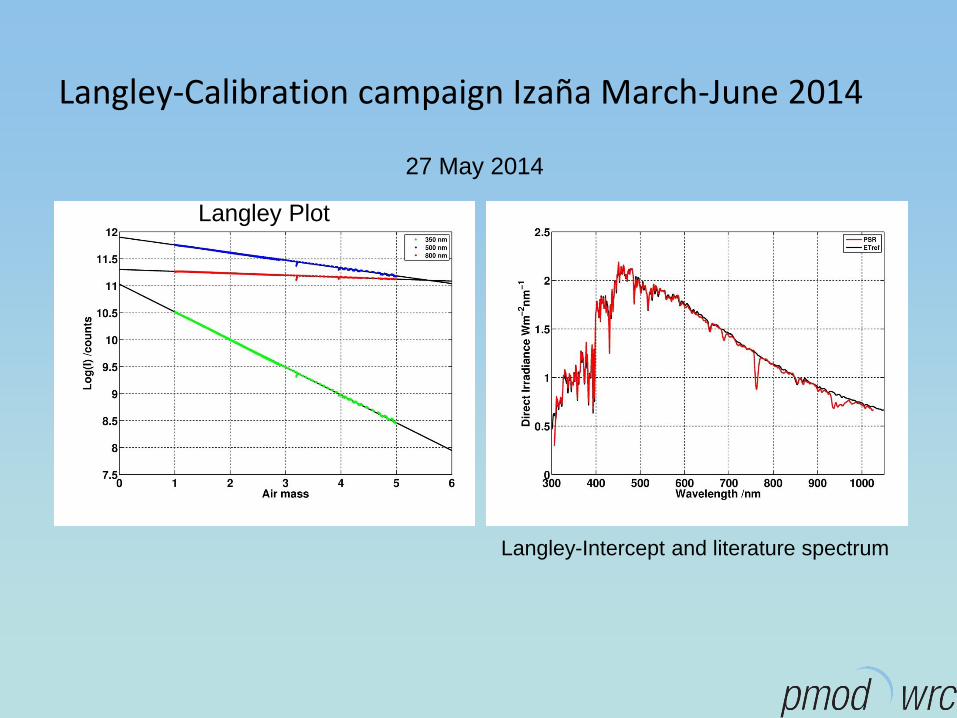
Langley-Calibration campaign Izaña March-June 2014
Langley Plot
Langley-Intercept and literature spectrum
27 May 2014

Stray-light effect on solar measurements
Ratio between Langley extrapolated
ET Spectrum and literature ET

Stability and comparison to literature ET
Variability ±0.8%
±5%

Spectral AOD compared to CIMEL and PFR
CIMEL PFR
O2-O2
Water vapour

Spectral AOD compared to CIMEL – 10 May 2014
08 10 12 15 17180.010.020.030.04
340
08 10 12 15 17180.010.020.030.04
380
08 10 12 15 17180
0.010.020.03
440
08 10 12 15 17180
0.010.020.03
500
08 10 12 15 17180
0.010.020.03
675
08 10 12 15 17180
0.010.020.03
870
08 10 12 15 17180
0.010.020.03
10-May-2014
PSR-CIMEL < ±0.01
PSR
CIMEL

Further steps...
• Investigate the strange line spread functions of PSR 003 above 750 nm, which seem to be due to enhanced light scattering (from black anodized metal?)
• Connect a telescope to the second SMA port for lunar irradiance and nighttime AOD retrieval
• Construct additional PSRs ...
Black anodized
Courtesy Andreas Höpe, PTB
First lunar light at Izaña, May 2014

The PSR Team
Dani
Diego
Natalia
Ricco
Manfred
Fabian
Claudio
Silvio
Peter
Julian
Etienne
2009: 2014
>6 (wo)man-years development time