the phillips curves module 34. figure 34.1 unemployment and inflation, 1955–1968 ray and anderson:...
TRANSCRIPT

The Phillips Curves
Module 34

Figure 34.1 Unemployment and Inflation, 1955–1968Ray and Anderson: Krugman’s Macroeconomics for AP, First EditionCopyright © 2011 by Worth Publishers
Inflation v. Unemployment

Relationship Between Inflation and Unemployment
Economists noted that in the short run the inflation rate and unemployment rate have an inverse relationship
The lower the unemployment rate, the higher the inflation rate
This is represented by the Phillips Curve

Figure 34.2 The Short-Run Phillips CurveRay and Anderson: Krugman’s Macroeconomics for AP, First EditionCopyright © 2011 by Worth Publishers
The Short Run Phillips Curve

Shifts in the SRPC
The events of the 1970s and 1980s illustrated that the SRPC is not fixed – it can shift over time.
Shifts in the SRAS curve can lead to shifts in the SRPC.
– A negative supply shock shifts the SRPC up (to the right)

Figure 34.3 The Short-Run Phillips Curve and Supply ShocksRay and Anderson: Krugman’s Macroeconomics for AP, First EditionCopyright © 2011 by Worth Publishers

So inflate to reduce unemployment?
Not too fast!
Expected inflation can shift the SRPC up and lead to greater inflation
– At every unemployment rate, there will be a greater inflation rate

Figure 34.4 Expected Inflation and the Short-Run Phillips CurveRay and Anderson: Krugman’s Macroeconomics for AP, First EditionCopyright © 2011 by Worth Publishers

The Long Run Phillips Curve
Attempting to use inflation to keep unemployment low will result in accelerating inflation due to expectations
The only way to reduce these expectations (and thus the actual inflation rate) is through increases in unemployment

The Long Run Phillips Curve
As a result, in the long run, we will return to a particular value of unemployment
– Non-accelerating inflation rate of unemployment– NAIRU
Thus, in the long run, the Phillips Curve is a vertical line at the NAIRU

Figure 34.5 The NAIRU and the Long-Run Phillips CurveRay and Anderson: Krugman’s Macroeconomics for AP, First EditionCopyright © 2011 by Worth Publishers

What does NAIRU represent?
The level of unemployment that will not create inflationary (or deflationary) expectations
Thus – no recessionary or inflationary gap exists
Therefore NAIRU = Natural Unemployment Rate
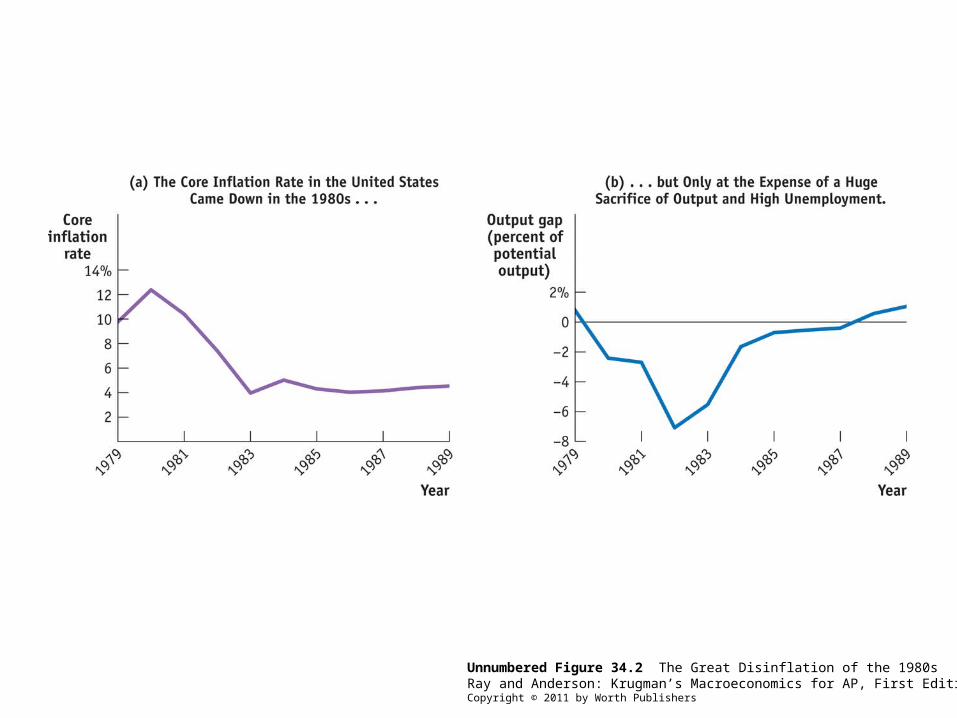
Unnumbered Figure 34.2 The Great Disinflation of the 1980sRay and Anderson: Krugman’s Macroeconomics for AP, First EditionCopyright © 2011 by Worth Publishers