the phase one i-710 freeway rehabilitation project
TRANSCRIPT

The Phase One I-710 Freeway Rehabilitation Project: Initial
Design to Performance After Six Years of Traffic
Meeting with AAPA Study Tour GroupUCPRC, CA 8/10/2010
Richmond Field Station, UC Berkeley

I-710 Project - Partnered Effort(most recent participants)
• Caltrans§ T. Bressette, W. Farnbach, C. Suszko
• Industry § J. St. Martin,
• University of California PRC§ C. Monismith

I-710 Project - Partnered Effort(some earlier participants)
• Caltrans§ K. Herritt, R. Doty, J. Dobrowolski, S. Shatnawi
• Industry § L. Nawrocki, J. Copley, R. Smith, D. Chapman
• University§ J. Harvey, F. Long

Presentation• Mix designs• Structural section designs§ full-depth AC§ overlay on cracked and seated PCC
• Aspects of construction• Some lessons learned• Phase II structures

I-710March 2003

Rehabilitation ofInterstate - 710
• Full-Depth Asphalt Concrete§ replacement under overpasses
• Overlay of PCC (cracked-seated)

Design & AnalysisTrial cross
section
Performance TestsTrial mix design
Conditioning(Aging & Water)
Analysis Performance Prediction
Final mix design & structural section
UnacceptableAcceptable

Long-Life Asphalt Pavement
• QC/QA specifications • Polymer modified binders• Improved aggregate requirements
• Modified mix design method

Trial Mix Design
• San Gabriel aggregate• Binders§ Conventional: AR-8000§ Polymer modified: PBA-6a*
• Hveem Stabilometer-to establish range of binder contents

Trial Mix Design
• Range of binder contents§ 4.2 - 5.7% (by wt of aggregate)
• Conventional dense-graded mix, Caltrans specs.
• All crushed materials

Final Mix Design - Rutting
Nsupply = M x NdemandNo
Input
NdemandTraffic
NsupplyPerformance test
Yes
³³

Shear Test

Ndemand - (PBA-6A)• Design ESALs - first five years§30 x 106 ESALs
• Ndemand = 660,000M x Design ESALs x TCF x SF§M = 5§ TCF = 0.116§ SF = 0.04

Design Binder Content
1,000
10,000
100,000
1,000,000
10,000,000
3 3.5 4 4.5 5 5.5 6
Asphalt content (percent by weight of aggregate)
N @
g p=
5 %
PBA 6AAR 8000
Temperature = 50 C
660,000 repetitions146,000 repetitions

HVS Rutting Study

Rutting Study Layout25 m section
33 tonnes AC
Placed on jointed PCC3 m
4 m
150 mm
K-barrier on one side of
section

Mix Performance Evaluation
0
5
10
15
20
25
30
- 50,000 100,000 150,000 200,000HVS Load Applications
Rut
Dep
th, m
m
38-mm ARHM-GG
62-mm ARHM-GG
75-mm DGAC AR-4000
76-mm PBA-6A
½ inch rut depth
< 20,000 reps ~ 170,000 reps

Thickness Design - Fatigue Analysis
Nsupply M x NdemandNo
Input
NdemandTraffic
NsupplyPerformance test
Yes
³

Design Considerations
• Fatigue in asphalt concrete• Deformation in unbound layers• Subsequently, design checked by CalME

Design Considerations
Asphalt Concrete
Base
Subgrade
et
ev

Input
• Structural section (full-depth)• Traffic (200 million ESALs)• Environment (T = 20°C)• Trial mixes & pavement section

Input
• Reliability (M=5) • f(traffic estimate & testing variability)
• Performance criterion§wheel path cracking £ 10%

Trial Pavement Sections
AR-8000
PBA-6A*
AR-8000(rich bottom)
subgrade
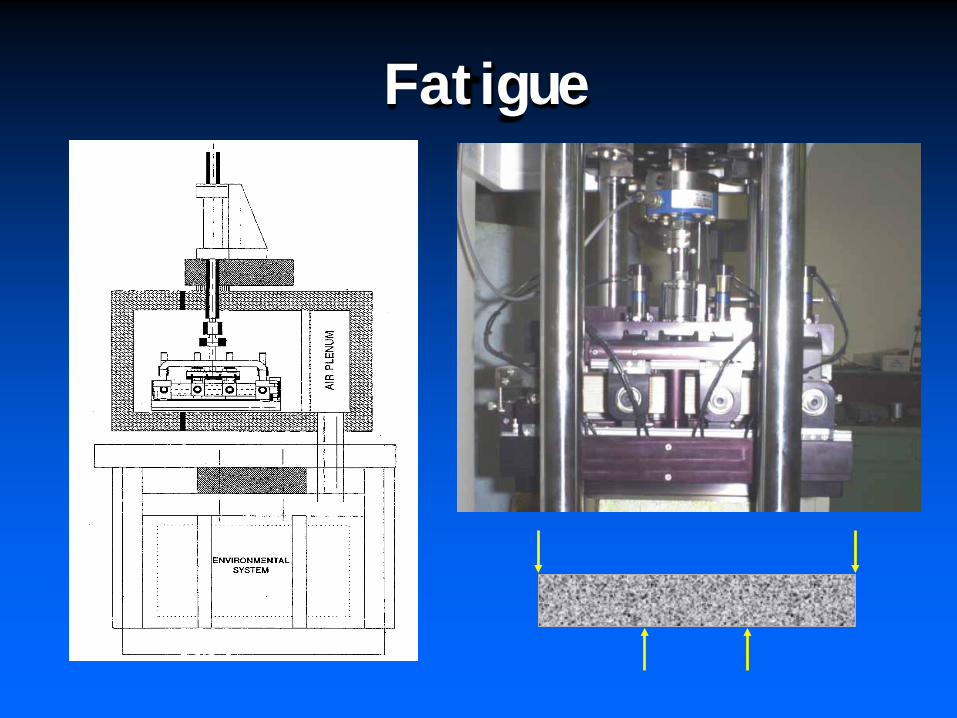
Fatigue

Fatigue Test Results
1.E+03
1.E+04
1.E+05
1.E+06
1.E+07
1.E+08
1.00E-04 1.00E-03Mean Strain
Nf
AR-8000, 4.7% AC, 6% AVAR-8000, 5.2% AC, 3% AVPBA-6A, 4.7% AC, 6% AVPBA-6A, 5.2% AC, 3% AV

Nsupply ³ M ´ Ndemand?
Fatigue
Check vertical subgrade strain ! ! ! (controlled total thickness)

Final Design
AR-8000 (4.7%)PBA-6A (4.7%)
AR-8000 (5.2%)(rich bottom)
subgrade
AR-OGFC 25 mm75
150
75
6% air voids6%
3%

Overlays
Jointed PCC
Cement treated Base
Subgrade
Asphalt ConcreteFabric
Leveling Course
150 – 250 mm
200 mm
150 mm
30 mm

Calculated Configuration
Traffic loads applied staticallysymmetrical boundaries
p =725 kPa250 mm
Cracks @ 1 m
AC

Finite Element Mesh~ 12,000 elements, NIKE2D

Bending Strains in Mix just above Fabric
-120
-80
-40
0
40
80
120
160
-4 -2 0 2 4 6DISTANCE FROM CENTER (ft)
BEN
DIN
G S
TRA
IN (u
s)
5"@900, 4"@150 ksi3"@900, 5"@150 ksi3"@900, 3"@150 ksi

Composite OverlayFinal overlay thickness
25 mm OGFC
Fabric
225 mm75 mm PBA-6A
125 mm AR-8000
Broken and seated PCC

Full-Depth AC Comparisons
• The Asphalt Institute• United Kingdom• Australia• Asphalt Pavement Alliance-U.S.
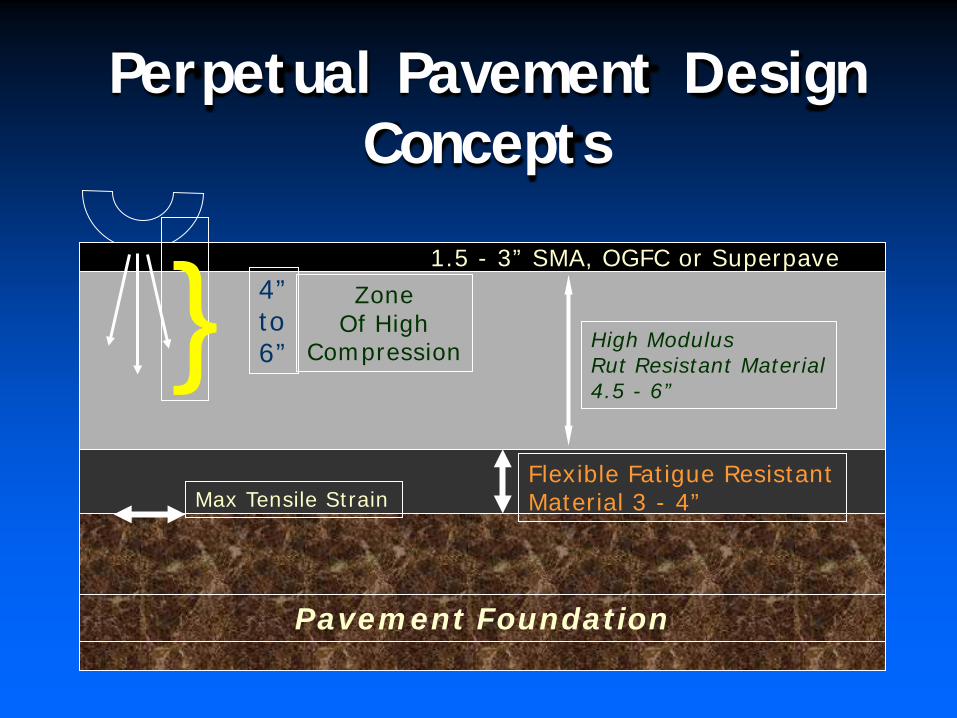
Perpetual Pavement Design Concepts
Max Tensile Strain
Pavement Foundation
High ModulusRut Resistant Material4.5 - 6”
Flexible Fatigue ResistantMaterial 3 - 4”
1.5 - 3” SMA, OGFC or Superpave
}4”to6”
ZoneOf High
Compression

Construction Specifications• Performance requirements based on shear and fatigue testing
• More stringent compaction requirements
• Tack coat between layers§Asphalt cement (AR- 4000)

Construction• Six stages• Stages 1 and 2 preliminary to rehab. of trafficked sections
• Stages 3-6 - rehab. of trafficked sections in 8 - 55 hr. weekend closures (vs. 10 originally planned)
• Use of CA4PRS (construction management program)

Construction
• Stages 3 -6§Traffic closure§Crack, seat, and overlay (CSOL)§Full depth AC construction (FDAC)§Traffic opening

Contractor Staging Plan
Crack, Seat, and Overlay (CSOL) = 2.8 centerline - km Full - Depth AC Replacement (FDAC) = 1.6 centerline - km
Stage 4A (2 nd ) N N
Stage 3A (1 st ) Stage 4B and 4C (3 rd and 4 th )
Stage 6A (8 th ) Stage 5A and 5B (5 th and 6 th )
FDAC: 362m CSOL: 1,259m
FDAC: 406m CSOL: 1,035m FDAC: 840m
CSOL: 480m
FDAC: 342m CSOL: 760m FDAC: 321m
CSOL: 959m FDAC: 840m CSOL: 1,160m
Stage 5C (7 th )
Crack, Seat, and Overlay (CSOL) = 2.8 centerline - km Full - Depth AC Replacement (FDAC) = 1.6 centerline - km
Stage 4A (2 nd ) N N N
Stage 3A (1 st ) Stage 4B and 4C (3 rd and 4 th )
Stage 6A (8 th ) Stage 5A and 5B (5 th and 6 th )
FDAC: 362m CSOL: 1,259m
FDAC: 406m CSOL: 1,035m FDAC: 840m
CSOL: 480m
FDAC: 342m CSOL: 760m FDAC: 321m
CSOL: 959m FDAC: 840m CSOL: 1,160m
Stage 5C (7 th )
N

Placement of Leveling Course

Installation of Pavement Fabric

Placement of PBA-6A* Mix


Digout and Placement of Aggregate Base – Working Platform


Rich Bottom Layer Construction

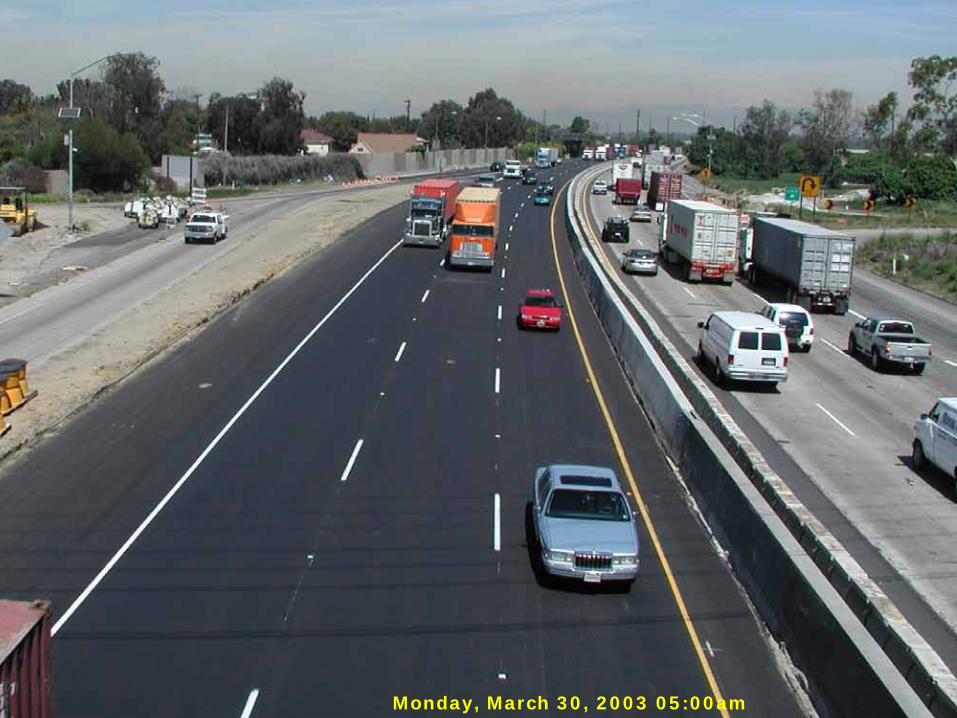
Monday, March 30, 2003 05:00am

Some Lessons Learned
• Pre-bid conference mandatory for all potential bidders
• For projects of this importance a “partnering” meeting at the outset is mandatory§ Partnering on the technical
aspects extremely important!

Some Lessons Learned (cont.)
• For new test procedures included in Special Provisions insure that all involved groups perform tests and analyze resulting data the same way:§ equipment calibration essential§ preliminary testing of comparable
specimens

Some Lessons Learned (cont.)
• Improved specification requirements based on statistical considerations desirable
• For QC/QA activities adequate staffing imperative (large quantities of materials, up to 15,000 tonnes per weekend)

Some Lessons Learned (cont.)
• Timely QA results required• Human resources – 3 to 5 weekend closures in a row maximum; if more required, allow 1 to 2 weekend interval

Some Lessons Learned (cont.)
• In digout areas (FDAC) :§Exploratory testing imperative§Exact location of underground utilities
Some Lessons Learned (cont.)
• Contingency plan important§ Digout areas - working platform; materials easily accessible§ Standby HMA plant(s)
• Meteorologist for contractor(construction in digout areas)

Performance Evaluation• FWD Deflection testing (2003 through 2008)
• Back calculation of layer moduli and strains in HMA layers using MLEA
• Condition surveys• Longitudinal and transverse profile measurements
• Noise measurements• Laboratory testing of cores (RSST-CH)and slabs (Fatigue)

Performance Evaluation
• Non-destructive HWD tests§11/03, NB and SB§9/04, NB; 2/5, SB§12/05, NB; 2/06, SB

CENTER DEFLECTIONS LANE 3 I-710 SOUTHBOUND (ADJUSTED TO 19C)
0
100
200
300
400
500
600
700
800
0 50 100 150 200 250 300 350
LOCATION
DEF
LEC
TIO
N (M
ICR
ON
S)
2003
2004
2005
2008
Section 1(FD) Section 2(CSOL) Section 3(FD) Section 4(CSOL) Section 5(FD) PCH 405
Deflections – SB Lane 3
X
03030508

CENTER DEFLECTIONS LANE 3 I-710 NORTHBOUND (ADJUSTED TO 19C)
0
100
200
300
400
500
600
700
800
900
1000
0 50 100 150 200 250
LOCATION
DE
FLE
CTI
ON
(MIC
RO
NS
)
2003
2004
2006
2008
Section 1(FD) Section 2(CSOL) Section 3(FD) Section 4(CSOL) Section 5(FD)
PCH 405
Deflections – NB Lane 3
X
03030508
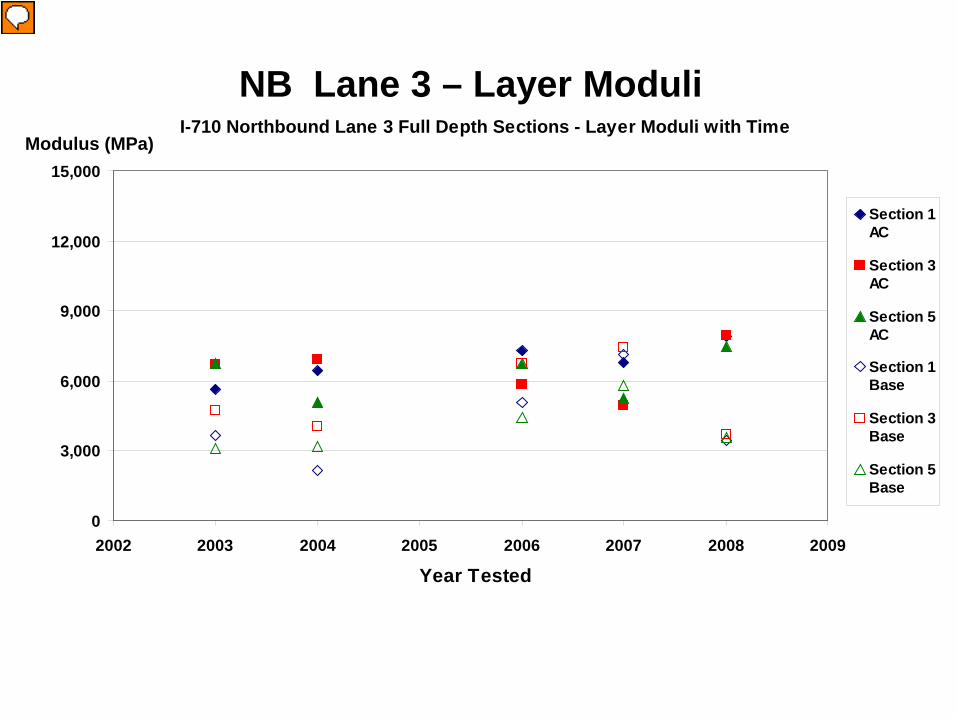
I-710 Northbound Lane 3 Full Depth Sections - Layer Moduli with Time
0
3,000
6,000
9,000
12,000
15,000
2002 2003 2004 2005 2006 2007 2008 2009
Year Tested
Modulus (MPa)
Section 1AC
Section 3AC
Section 5AC
Section 1Base
Section 3Base
Section 5Base
NB Lane 3 – Layer Moduli

Tensile Strain, Underside HMA Layer, in/in x 10-6
Section NB SB
1 18 49
3 17 18
5 16 8.5

Rut Depth MeasurementsSB Lane 3
0
3
6
9
12
15
0+00 5+00 10+00 15+00 20+00 25+00 30+00 35+00 40+00 45+00
Station (m)
Rutting (mm) Left WP Right WP
12.5 mm

Rut Depth MeasurementsNB Lane 3
0
3
6
9
12
15
0+00 10+00 20+00 30+00 40+00
Station (m)
Rutting (mm) Left WP Right WP
12.5 mm

I-710 Traffic

I-710 Traffic

I-710, Phase II
• Modifications§Design traffic: - 330x106 ESALs§Thickness of HMA base layer [PG 70-10 (AR-8000)] increased§Surface course: RAC-G instead of RAC-O

Concluding Thoughts• Implementation of New Technology for Mix &
Structural Design• Strict Attention To Pavement Construction• Constructability Considerations - Use of
CA4PRS• Successful partnering – agency, contractor and
academia.• Paving performing as expected.

Summary
• Implementation of SHRP developed technology
• Strict attention to pavement construction
• Constructability considerations; (CA4PRS)