the pesticide users’ health · pdf filethe pesticide users health study is a ......
TRANSCRIPT

Health and Safety Executive
The Pesticide Users’ Health Study Survey of pesticide usage
Prepared by the Health and Safety Laboratory for the Health and Safety Executive 2013
RR957 Research Report
Health and Safety Executive
The Pesticide Users’ Health Study Survey of pesticide usage
Eileen M Holmes Harpur Hill Buxton Derbyshire SK17 9JN
The Pesticide Users Health Study is a cohort of nearly 66,000 commercial pesticide users, certified under the 1986 Control of Pesticide Regulations, who had agreed to participate in HSE’s programme of research into their health. A survey to assess the history of pesticide usage among members of this cohort, and to assess the level of self-reported ill health associated with pesticide exposure, was undertaken in two waves during 2004 and 2006.
The response rate (14%) to the questionnaire was very low; this may be partly attributable to a general decrease in survey response rates and to the fact that the main wave of the survey was undertaken at a particularly busy time of year. Respondents listed nearly 2,500 unique trade names and 677 active ingredients. The most common areas of pesticide usage were amenity weed control and the treatment of cereals. Individuals who were often exposed to pesticide concentrate were four times more likely to report ‘ill health’ associated with pesticide use than those exposed to diluted products; additionally individuals who had used pesticides in jobs lasting more than 15 years were more likely to report ‘ill health’ than those working in jobs lasting less than 5 years.
This report and the work it describes were funded by the Health and Safety Executive (HSE). Its contents, including any opinions and/or conclusions expressed, are those of the author alone and do not necessarily reflect HSE policy.
HSE Books

© Crown copyright 2013
First published 2013
You may reuse this information (not including logos) free of charge in any format or medium, under the terms of the Open Government Licence. To view the licence visit www.nationalarchives.gov.uk/doc/open-government-licence/, write to the Information Policy Team, The National Archives, Kew, London TW9 4DU, or email [email protected].
Some images and illustrations may not be owned by the Crown so cannot be reproduced without permission of the copyright owner. Enquiries should be sent to [email protected].
ACKNOWLEDGEMENTS
The author wishes to thank Adrian Cassidy, the HSE customer, for his help, support and enthusiasm for this work and the Pesticide Users’ Health Study.
The author also wishes to thank colleagues in the Mathematical Sciences Unit at HSL for their contributions - Claire Collins, Rosemary Gagen-Hill, Carl Gartside, Anna Buttrill, Lorraine Gavin and Claudia Tarr in the Data Entry Team, Simon Rice for his work on the database, and Anne-Helen Harding and Gillian Frost for their support and advice.
Lastly, thanks to Chris Boorman, the Project Manager, for all his hard work and support.
ii

CONTENTS
1 INTRODUCTION......................................................................................... 1
2 METHODS .................................................................................................. 3 2.1 The Cohort............................................................................................... 3 2.2 The Pesticide Users Health Study Database........................................... 3 2.3 Survey of Pesticide Usage....................................................................... 3 2.4 Statistical Methods................................................................................... 5
3 RESULTS ................................................................................................... 6 3.1 Summary of Pesticide Usage .................................................................. 6 3.2 Summary of Pesticide Exposure by job ................................................... 7 3.3 Summary of Types of Pesticides ............................................................. 9 3.4 Work-related ill health ............................................................................ 10 3.5 Smoking................................................................................................. 10 3.6 Ill health and Pesticide Exposure........................................................... 11
4 CONCLUSIONS........................................................................................ 13 4.1 Observations from Survey ..................................................................... 13 4.2 Recommendations................................................................................. 14
5 REFERENCES.......................................................................................... 15
APPENDIX 1 COVER LETTER FOR PUHS SURVEY OF PESTICIDE USAGE17
APPENDIX 2 SURVEY INFORMATION LEAFLET ......................................... 18
APPENDIX 3 SURVEY QUESTIONNAIRE...................................................... 20
iii

iv

EXECUTIVE SUMMARY
Background
The Pesticide Users’ Health Study (PUHS) was established in 1998 by the Health and Safety Executive to investigate concerns about chronic ill health, which may arise as a result of occupational exposure to pesticides. Individuals who gain certificates of competency in pesticide usage with the City & Guilds Land Based Services (formerly City & Guilds NPTC) are invited to be part of the study. The PUHS database contains information on around 66,000 individuals.
In 1996, before the PUHS database was constructed, a sample of 4,000 individuals identified by City & Guilds Land Based Services were asked about their job history, pesticide usage, health and other relevant factors. The questions on job history and pesticide usage formed the basis of the Survey of Pesticide Usage which was sent to all those on the PUHS database in two phases in 2004 and 2006.
Objectives
The main objectives were to use the responses to the Survey of Pesticide Usage to
• obtain a full job history for those on the PUHS database,
• summarise the extent and nature of current and historical pesticide usage, and
• assess the level of self-reported ill health associated with pesticide exposure among respondents.
Main Findings
Only 14% of individuals responded. This low response rate may be due to a general decrease in response rates to surveys. However some responders also commented that the survey had been sent in the summer, at a time when they were particularly busy.
About 90% of responders had used pesticides, confirming that a large proportion of individuals on the City & Guilds Land Based Services database were actively employed, or had been employed, in pesticide usage.
The most common areas of pesticide usage were amenity weed control and the treatment of cereals.
Responders listed 2,496 unique trade names and 677 unique active ingredients. Some responders commented that the level of detail requested on pesticides and their usage was too high.
For each job, participants were asked if they had ever knowingly been made ill by exposure to pesticides. Individuals who were often exposed to pesticide concentrate were four times more likely to report “ill health” compared to individuals who were exposed to dilute concentrate (Odds ratio 3.97, 95% confidence interval 2.22 to 7.10). Moreover, we observed a significantly increased risk of “ill health” with increasing duration of pesticide exposure. For example, individuals who had used pesticides in a job lasting for more than 15 years were twice as likely to report “ill health” as those who had used pesticides in a job lasting for less than 5 years (Odds ratio 1.89, 95% confidence interval 1.53 to 2.28).
v
Recommendations
Given the observed association between pesticide exposure and elevated risk of “ill health”, it will be important to explore this relationship further in pesticide users. Therefore, a survey of general health is required to assess possible links between pesticide exposure and chronic ill health.
Any future surveys should consider using a more structured approach to assessing detailed pesticide exposure than was employed by the current survey, particularly for historical exposoures. The survey respondents commented negatively on the detail requested, and this was likely to be a factor in the poor response.
A broad range of health conditions and symptoms could be examined in a survey, while more detailed information could be obtained from Hospital Episode Statistics.
Further surveys on the PUHS should be carried out in the winter.
vi

1 INTRODUCTION
A pesticide is a substance, or mixture of substances, used to kill an undesirable plant, fungal or animal pest. This encompasses a broad range of products and includes herbicides, fungicides, insecticides, rodenticides, wood preservatives and many other substances.
Pesticides have been used for many centuries. Inorganic substances such as sulphur, mercury and arsenic were used first: in 1000BC Homer referred to the use of sulphur to fumigate homes, and in 900AD the Chinese were using arsenic to control pests. By the late nineteenth century, plant-derived compounds such as pyrethrum and rotenone, were being used as pesticides. In the early 1900s, inorganic and biological substances were developed and used. During World War II, several insecticides and herbicides, including the organochlorine DDT, were developed and their use became widespread after the war.
Following concerns over the use of organochlorine insecticides, the UK Government began official surveys of pesticide usage on a variety of agricultural and horticultural crops in 1965. The Food and Environment Protection Act was introduced in the UK in 1985 and the registration and monitoring of pesticides became a legal requirement. The Pesticide Usage Survey is carried out by The Food and Environment Research Agency (FERA) and collects data on pesticides used in agriculture, horticulture and food storage. Reports on the surveys can be found at FERA’s websitea.
Since 1989, anyone applying pesticides on a commercial basis must first gain a certificate of competence in their safe use. The City & Guilds Land Based Services (formerly City & Guilds NPTC) in Stoneleigh is a national awarding body within the land-based sector and is part of the City & Guilds Group. One of the many roles of City & Guilds Land Based Services is to maintain a database of individuals who hold a certificate of competence in the use of agricultural pesticides.
Since pesticides are designed to be toxic to specific living organisms, there are concerns that some may have levels of human toxicity also. In the 1990s, the Health and Safety Executive (HSE) acknowledged that more information was required about the extent and nature of pesticide-related ill health, particularly chronic conditions which may develop after many years of pesticide exposure.
In 1996, the Epidemiology and Medical Statistics Unit (EMSU) at HSE conducted a feasibility study into using the individuals on the City & Guilds Land Based Services database as a cohort who could be contacted regarding health and pesticide usage. As part of the feasibility study in 1996, a survey of pesticide usage was carried out on a sample of 4,000 individuals. Miles Thomas from the Central Science Laboratory (CSL, now FERA) and the project team at HSE designed the survey. The survey found that 92% of responders had used pesticides at some time during their working life, 74% of these had used them within the previous year. It also found that 18% had used pesticides on 40 days or more in the past year. From the survey it was clear that duration of exposure was highly variable and there were a large number of different pesticides being used. In 1998, the PUHS (Pesticide Users’ Health Study) database was constructed to hold data on individuals who had agreed to be contacted by HSE and was designed to incorporate questionnaires and data from further surveys and studies. Following the set up of the PUHS database, a similar questionnaire was sent, in two phases, to the whole cohort of nearly 66,000 individuals. The main aim of the PUHS Survey of Pesticide Usage was to evaluate the extent and nature of current and historical pesticide usage for workers on the
a Hhttp://www.fera.defra.gov.uk/plants/pesticideUsage/index.cfm 1
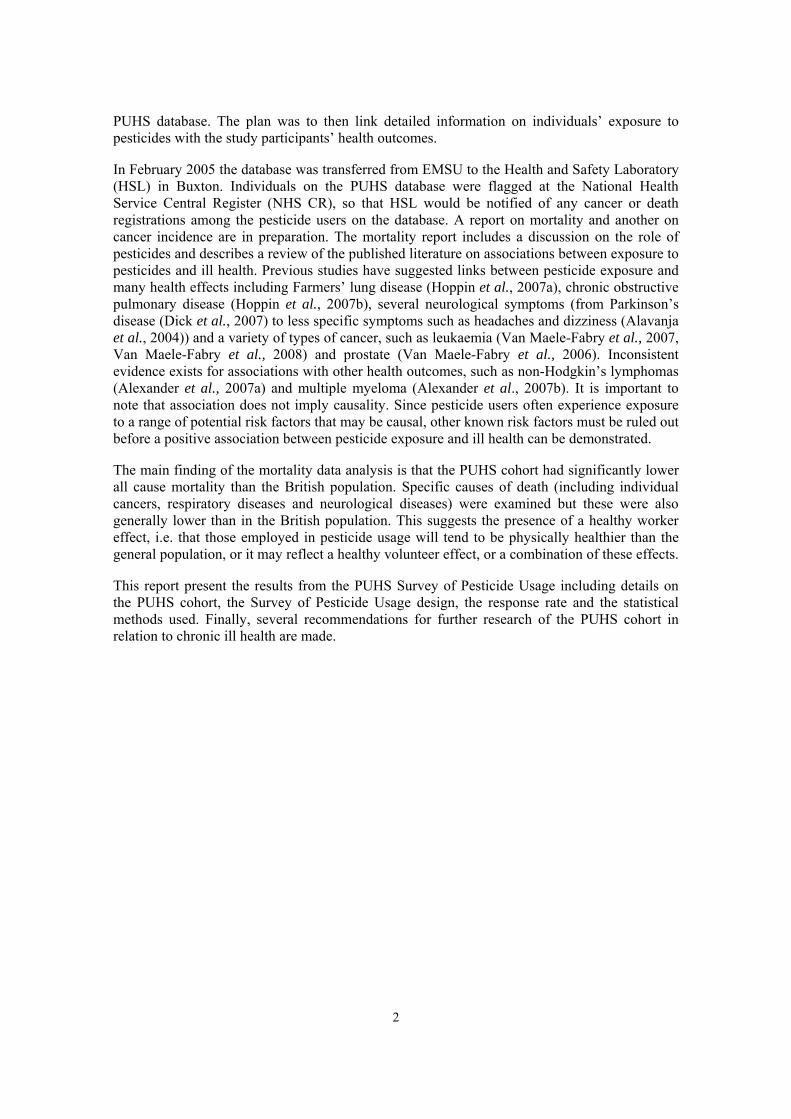
PUHS database. The plan was to then link detailed information on individuals’ exposure to pesticides with the study participants’ health outcomes.
In February 2005 the database was transferred from EMSU to the Health and Safety Laboratory (HSL) in Buxton. Individuals on the PUHS database were flagged at the National Health Service Central Register (NHS CR), so that HSL would be notified of any cancer or death registrations among the pesticide users on the database. A report on mortality and another on cancer incidence are in preparation. The mortality report includes a discussion on the role of pesticides and describes a review of the published literature on associations between exposure to pesticides and ill health. Previous studies have suggested links between pesticide exposure and many health effects including Farmers’ lung disease (Hoppin et al., 2007a), chronic obstructive pulmonary disease (Hoppin et al., 2007b), several neurological symptoms (from Parkinson’s disease (Dick et al., 2007) to less specific symptoms such as headaches and dizziness (Alavanja et al., 2004)) and a variety of types of cancer, such as leukaemia (Van Maele-Fabry et al., 2007, Van Maele-Fabry et al., 2008) and prostate (Van Maele-Fabry et al., 2006). Inconsistent evidence exists for associations with other health outcomes, such as non-Hodgkin’s lymphomas (Alexander et al., 2007a) and multiple myeloma (Alexander et al., 2007b). It is important to note that association does not imply causality. Since pesticide users often experience exposure to a range of potential risk factors that may be causal, other known risk factors must be ruled out before a positive association between pesticide exposure and ill health can be demonstrated.
The main finding of the mortality data analysis is that the PUHS cohort had significantly lower all cause mortality than the British population. Specific causes of death (including individual cancers, respiratory diseases and neurological diseases) were examined but these were also generally lower than in the British population. This suggests the presence of a healthy worker effect, i.e. that those employed in pesticide usage will tend to be physically healthier than the general population, or it may reflect a healthy volunteer effect, or a combination of these effects.
This report present the results from the PUHS Survey of Pesticide Usage including details on the PUHS cohort, the Survey of Pesticide Usage design, the response rate and the statistical methods used. Finally, several recommendations for further research of the PUHS cohort in relation to chronic ill health are made.
2

2 METHODS
2.1 THE COHORT
The City & Guilds Land Based Services maintains a database of individuals who hold one or more certificates of competence in the use of agricultural pesticides. On the City & Guilds Land Based Services registration form, there is an “opt-in” question, whereby individuals can consent to City & Guilds Land Based Services giving their details to HSE so that they are included in HSE research into occupational health.
In 1996 EMSU initiated a feasibility study on a sample of 4,000 individuals from the City & Guilds Land Based Services database to establish whether a database of licensed agricultural pesticide users could be used to investigate the extent and nature of pesticide-related ill health. Individuals were asked about their pesticide usage, health and other relevant factors. In 1998, the study concluded that the City & Guilds Land Based Services database would be an excellent tool for locating current pesticide users and provided a suitable population on which to base epidemiological studies into the effects of pesticide use (EMSU, 1998).
2.2 THE PESTICIDE USERS HEALTH STUDY DATABASE
In 1999, those who agreed to contact from HSE were entered on the Pesticide Users’ Health Study (PUHS) database. The database was updated in 2003 and transferred to HSL in 2005. The PUHS database contains the personal details of 65,993 individuals including: • Full name • Maiden/previous name • Sex • Date of birth • Address • Employer name, background and address • Test details: certificate received, date, centre name, county • National insurance number • National health service number
Note that information on occupation was not available. Most individuals were matched and flagged (n=63,505, 96%) at the National Health Service Central Register (NHS CR) or the General Register Office for Scotland (GROS). Quarterly reports are received from NHS CR and GROS notifying HSL of any cancer or death registrations for the flagged individuals. A separate report on the standardised mortality rates for this cohort has been written (Brown, 2009).
2.3 SURVEY OF PESTICIDE USAGE
While the information provided by City & Guilds Land Based Services is useful, there are no details about job history, pesticides used or levels of occupational exposure. As part of the feasibility study in 1996, EMSU developed a questionnaire on pesticide usage, which requested information on:
3

• Job history (i.e. current and all previous jobs) • Years pesticides were used in each job held • Main areas of pesticide work in each job • Working practices (handling of concentrated/dilute products; use of personal protective
equipment) • Pesticide products used in each job • Smoking habits
About 50% of the 4,000 individuals surveyed responded. It was found that respondents had a wide range of pesticide usage experience, in terms of type and number of pesticides used.
After the PUHS database on 65,993 individuals had been established, the cohort was surveyed on pesticide usage in two batches. In 2004 EMSU posted questionnaires to a random sample of approximately 15,000 cohort members on the database, and in 2006 HSL completed the posting to the remaining individuals traced by NHSCR.
All completed questionnaires were entered on a database by one of six members of the Data Entry Team within the Mathematical Sciences Unit at HSL in 2009. To check data entry quality, a random sample of 251 questionnaires was selected and entered onto a separate database, and the responses for the first three questions were compared. Matching rates of 96%, 93% and 95% were achieved.
Table 1 gives details of the numbers that responded, did not wish or were unable to take part, and the number of questionnaires, which were returned but not completed (i.e. post office returns, individual unknown at address or individual had moved and no forwarding address was available).
Table 1 Responses to survey First wave Second wave
Response Frequency Percentage Frequency Percentage Returned questionnaire, 2,635 17.6% 6,659 13.5% completed Returned, did not reach 22 0.1% 441 0.9% individual Not able/want to take part 25 0.2% 206 0.4% No response 12,225 81.8% 40,710 82.5% Deceased 43 0.3% 1,348 2.7% Total 14,950 100.0% 49,364 100.0%
The overall response rate of 14.8% was disappointingly low, particularly compared to the 50% response rate achieved in the feasibility study. Participation rates in epidemiologic studies have been decreasing over the past 30 years, particularly in recent years (Galea and Tracy, 2007). The large difference in response rates between the feasibility study and the main study would only be partly attributable to this trend given the relatively small time difference between the two surveys. A comparison of responders/non-responders (Table 2) shows responders slightly older than non-responders, and the proportion of males was slightly higher among those who responded. Table 3 shows that those with three or more certificates of competency were more likely to respond than those with only one or two certificates.
4

2.4
Table 2 Comparing responders and non-responders by age and sex Responders Non-responders
Age Number 9,293 56,696 Average 51.8 years 48.1 years Standard deviation 12.4 years 11.7 years Median 50.9 years 45.9 years Sex Number of males 8,786 53,167 Number of females 508 3,532 % males 94.5% 93.8%
Table 3 Comparing responders and non-responders by numbers of certificates No. of certificates No. with No. completed % response
certificate questionnaires 1 8,141 844 11.7% 2 48,721 6,792 10.4% 3 6,526 940 14.4% 4 1,645 303 18.4% 5 or more 849 224 26.4%
STATISTICAL METHODS
Responses to the survey questions were summarised using frequency tables and percentages. Histograms were also used to illustrate the distribution of responses for some questions.
For each job, participants were asked whether they had knowingly been made ill by exposure to pesticides. Individuals who were made ill by exposure to pesticides (“cases”) were compared to a “healthy” control group using logistic regression. The logistic regression analysed each job reported by an individual separately. Non-independence of multiple responses by individuals was taken into account in the analysis by clustering the jobs by individual using robust standard errors. Ill health is often confounded by age, sex and smoking and their relationship with ill health was examined first. To quantify risk of ill health by pesticide exposure, four variables were considered: number of years used pesticides, number of hours per year, number of days per year and the handling of pesticide concentrate. Logistic regression models fitted to these variables were adjusted for age, sex and smoking. All analyses were undertaken in Stata v10.1.
5
3.1
3 RESULTS
SUMMARY OF PESTICIDE USAGE
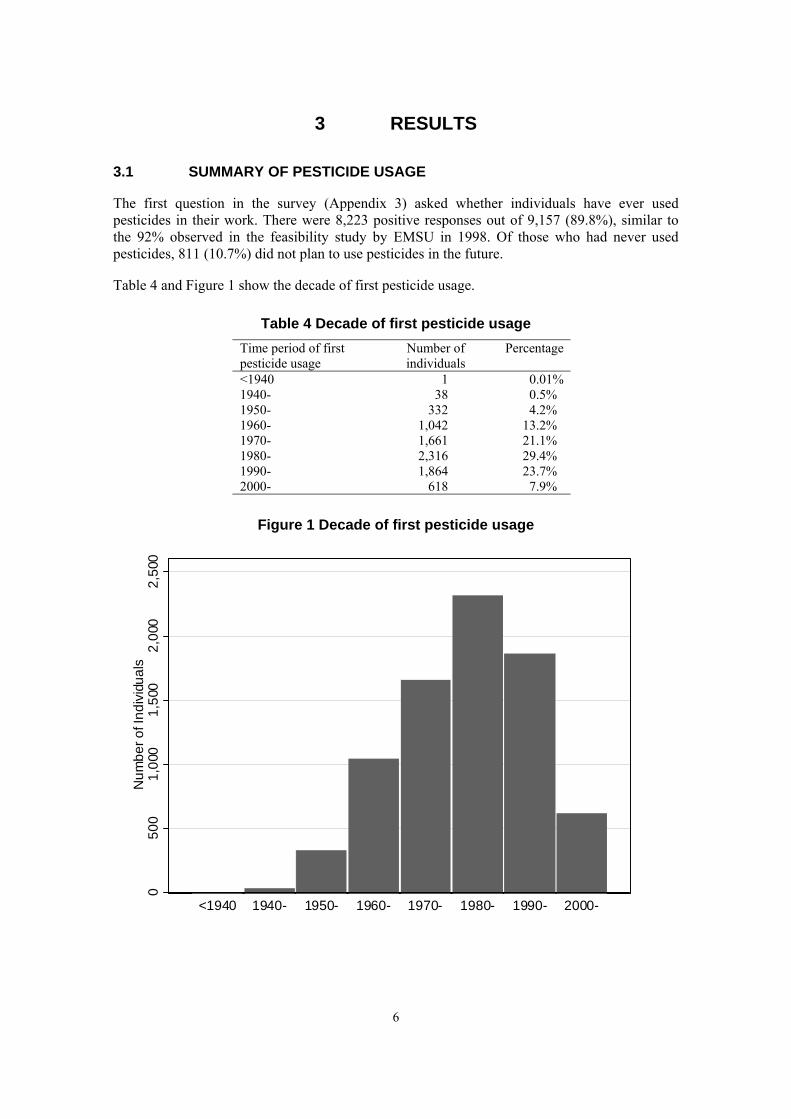
The first question in the survey (Appendix 3) asked whether individuals have ever used pesticides in their work. There were 8,223 positive responses out of 9,157 (89.8%), similar to the 92% observed in the feasibility study by EMSU in 1998. Of those who had never used pesticides, 811 (10.7%) did not plan to use pesticides in the future.
Table 4 and Figure 1 show the decade of first pesticide usage.
Table 4 Decade of first pesticide usage Time period of first Number of Percentage pesticide usage individuals <1940 1 0.01% 1940- 38 0.5% 1950- 332 4.2% 1960- 1,042 13.2% 1970- 1,661 21.1% 1980- 2,316 29.4% 1990- 1,864 23.7% 2000- 618 7.9%
Figure 1 Decade of first pesticide usage
0 50
0 1,
000
1,50
0 2,
000
2,50
0 N
umbe
r of I
ndiv
idua
ls
<1940 1940- 1950- 1960- 1970- 1980- 1990- 2000-
6

3.2 SUMMARY OF PESTICIDE EXPOSURE BY JOB
Survey participants were asked about their pesticide exposure in each job, current and previous. Data on 17,227 jobs were received for 8,244 individuals.
3.2.1 Duration of exposure
Figure 2 shows the number of years pesticides were used for 11,731 jobs. (The response rate to this question was 68%, which is quite low). The mean was 12.2 years (SD = 11.0 years), with a median of 9 years. This information is also summarised by individual in Figure 3. For 8,244 individuals, the total number of years of exposure had a mean of 17.3 years (SD = 12.6 years) and median of 16 years.
Figure 2 Histogram of number of years used pesticides by job
0 10
00
2000
30
00
4000
N
umbe
r of j
obs
0 10 20 30 40 50 60 No. years used pesticide in job
Figure 3 Histogram of total years used pesticide for individuals
0 50
0 10
00
1500
N
umbe
r of i
ndiv
idua
ls
0 10 20 30 40 50 60 70 80 90 100 No. years individual used pesticides
7

The survey asked how many hours per year pesticides were used in the job and on how many days. The responses to both these questions were very skewed, particularly hours per year. For 9,211 jobs, a mean of 146.2 hours per year was found, with SD of 311.4 and median of 40 hours per year. For 10,484 jobs, an average of 38.4 days per year was calculated, with SD of 55.8 and median of 20 days per year.
3.2.2 Main areas of pesticide work
Responders were asked to select which of the descriptions below summarised their main areas of pesticide work. Note that responders could tick more than one box. Table 5 shows that the most common choices were “Amenity weed control” and “Cereals”. Table 6 summarises the categories ticked and shows that 27% worked in more than one area.
Table 5 Main areas of pesticide work Number of jobs Percentage of jobs
Agriculture Cereals 3,941 22.9% Oilseeds 2,245 13.0% Potatoes 1,427 8.3% Sugar beet 1,135 6.6% Grassland 2,715 15.8% Other arable crops 1,462 8.5% Hops 123 0.7% Horticulture Orchard 582 3.4% Soft fruit 494 2.9% Mushrooms 76 0.4% Outdoor veg 738 4.3% Glasshouse 1,427 8.3% Hardy nursery stock 1,070 6.2% Ornamental 1,416 8.2% Other Golf courses 2,403 13.9% Amenity weed control 5,019 29.1% Forestry 1,496 8.7% Aquatic 289 1.7% Other 1,851 10.7%
Table 6 Categories of pesticide work Number of jobs Percentage of jobs
Agriculture only 3,206 26.3% Horticulture only 1,122 9.2% Other only 4,583 37.5% Agriculture + Horticulture 452 3.7% Agriculture + Other 921 7.6% Horticulture + Other 1,566 12.8% Agriculture + Horticulture + Other 358 2.9% Ticked at least one box 12,208 100.0%
Out of 11,995 responses, 2,572 (21.4%) said they normally worked as a contractor in this job.
8
3.3
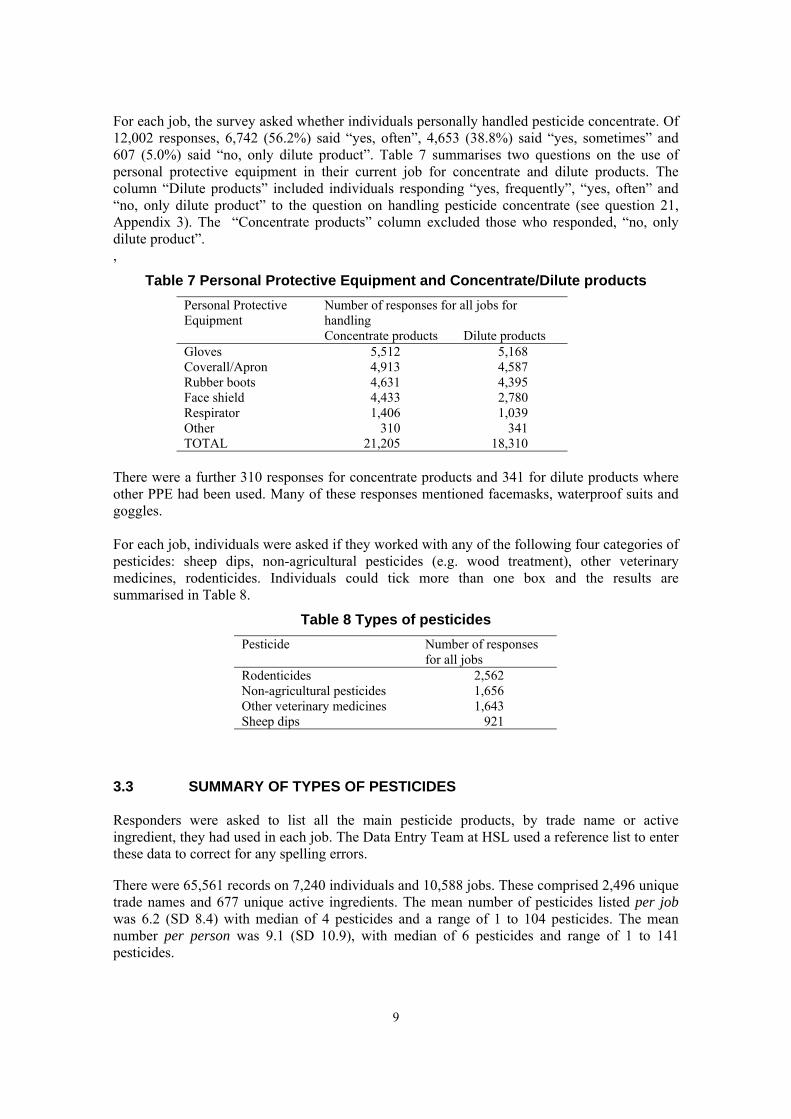
For each job, the survey asked whether individuals personally handled pesticide concentrate. Of 12,002 responses, 6,742 (56.2%) said “yes, often”, 4,653 (38.8%) said “yes, sometimes” and 607 (5.0%) said “no, only dilute product”. Table 7 summarises two questions on the use of personal protective equipment in their current job for concentrate and dilute products. The column “Dilute products” included individuals responding “yes, frequently”, “yes, often” and “no, only dilute product” to the question on handling pesticide concentrate (see question 21, Appendix 3). The “Concentrate products” column excluded those who responded, “no, only dilute product”. ,
Table 7 Personal Protective Equipment and Concentrate/Dilute products Personal Protective Number of responses for all jobs for Equipment handling
Concentrate products Dilute products Gloves 5,512 5,168 Coverall/Apron 4,913 4,587 Rubber boots 4,631 4,395 Face shield 4,433 2,780 Respirator 1,406 1,039 Other 310 341 TOTAL 21,205 18,310
There were a further 310 responses for concentrate products and 341 for dilute products where other PPE had been used. Many of these responses mentioned facemasks, waterproof suits and goggles.
For each job, individuals were asked if they worked with any of the following four categories of pesticides: sheep dips, non-agricultural pesticides (e.g. wood treatment), other veterinary medicines, rodenticides. Individuals could tick more than one box and the results are summarised in Table 8.
Table 8 Types of pesticides Pesticide Number of responses
for all jobs Rodenticides 2,562 Non-agricultural pesticides 1,656 Other veterinary medicines 1,643 Sheep dips 921
SUMMARY OF TYPES OF PESTICIDES
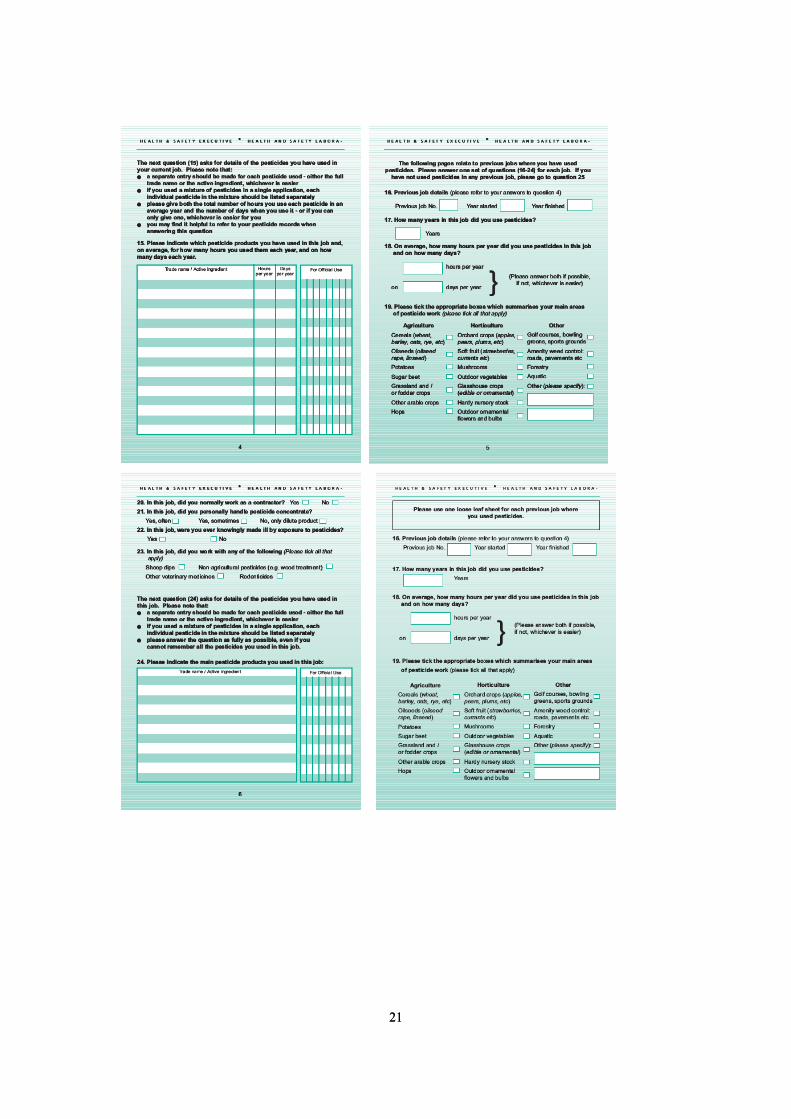
Responders were asked to list all the main pesticide products, by trade name or active ingredient, they had used in each job. The Data Entry Team at HSL used a reference list to enter these data to correct for any spelling errors.
There were 65,561 records on 7,240 individuals and 10,588 jobs. These comprised 2,496 unique trade names and 677 unique active ingredients. The mean number of pesticides listed per job was 6.2 (SD 8.4) with median of 4 pesticides and a range of 1 to 104 pesticides. The mean number per person was 9.1 (SD 10.9), with median of 6 pesticides and range of 1 to 141 pesticides.
9
3.4
The most commonly listed active ingredients were Glyphosate (12.4%) and Paraquat (4.2%). None of the other active ingredients accounted for more than 2% of the total. The most commonly listed trade names were “Roundup” (9.1%) and “Gramoxone 100” (3.4%) – other products accounted for less than 2% of total. The large number of different pesticides being used made it difficult to summarise the data any further.
WORK-RELATED ILL HEALTH
For each job, individuals were asked “In this job, were you ever knowingly made ill by exposure to pesticides?” with possible responses “Yes” or “No”. This was the only health-related question.
The number of jobs where individuals thought they had been made ill by pesticide exposure was 729 out of 11,800 jobs (6.2%).
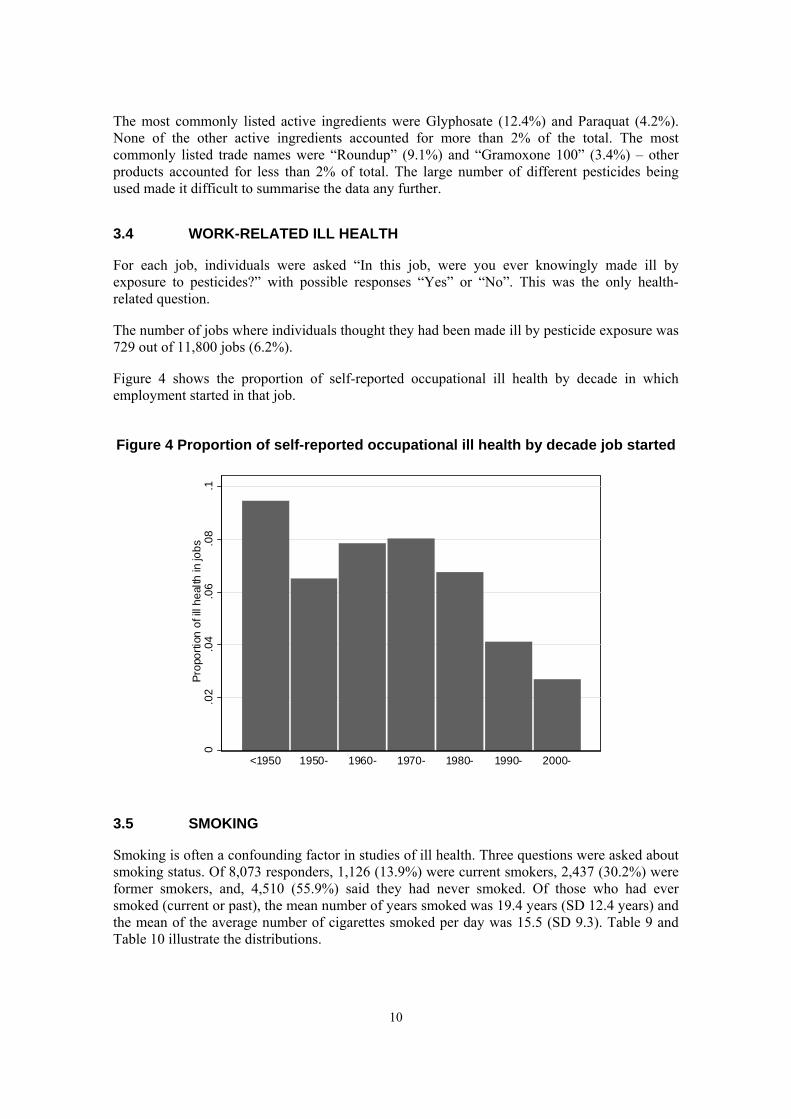
Figure 4 shows the proportion of self-reported occupational ill health by decade in which employment started in that job.
Figure 4 Proportion of self-reported occupational ill health by decade job started
0 .0
2 .0
4 .0
6 .0
8 .1
Pr
opor
tion
of il
l hea
lth in
jobs
<1950 1950- 1960- 1970- 1980- 1990- 2000-
3.5 SMOKING
Smoking is often a confounding factor in studies of ill health. Three questions were asked about smoking status. Of 8,073 responders, 1,126 (13.9%) were current smokers, 2,437 (30.2%) were former smokers, and, 4,510 (55.9%) said they had never smoked. Of those who had ever smoked (current or past), the mean number of years smoked was 19.4 years (SD 12.4 years) and the mean of the average number of cigarettes smoked per day was 15.5 (SD 9.3). Table 9 and Table 10 illustrate the distributions.
10

3.6
Table 9 Categories of number of years smoked Number of years smoked Number of responses Percentage ñ 10 years 1,152 33.3% 11 – 20 years 1,068 30.8% 21 – 30 years 684 19.7% 31 – 40 years 371 10.7% >40 years 190 5.5% TOTAL 3,465 100%
Table 10 Categories of number of cigarettes smoked per day Number of cigarettes Number of responses Percentage smoked per day ñ 5 542 16.2% 6 – 10 815 24.3% 11 – 15 552 16.5% 16 – 20 1,023 30.5% 21 – 25 109 3.2% >25 310 9.3% TOTAL 3,351 100%
ILL HEALTH AND PESTICIDE EXPOSURE
Before looking at ill health and pesticide exposure, possible confounders (age, sex and smoking) were examined. Survey participants described their job exposure history. Overall, 41% of respondents had only one job, but the remaining respondents had up to 11 different jobs. Consequently, age was summarised here as age at the start of each job. Smoking status is unknown during individual jobs and so was summarised as either “ever smoked” (so includes former and current smokers, see Section 3.5) or “never smoked”. The percentages and odds ratios are given in Table 11. The percentages of those reporting illness are very similar for both smoking categories.
Table 11 Self-reported occupational ill health by age, sex and smoking status Variable No. jobs No. jobs not % jobs Odds ratio 95% CI
made ill made ill made ill Age (years) <20 280 3,320 7.8% 1.00 21 – 30 286 3,933 6.8% 0.86 0.72 – 1.03 31 – 40 95 2,003 4.5% 0.56 0.44 – 0.71 41 – 50 41 1,098 3.6% 0.44 0.32 – 0.62 > 50 17 540 3.1% 0.37 0.23 – 0.61 Sex Females 28 490 5.4% 1.00 Males 701 10,581 6.2% 1.16 0.76 – 1.78 Smoking status Never smoked 392 6,023 6.1% 1.00 Ever smoked 320 4,817 6.2% 1.02 0.86 – 1.21
11

To quantify risk of ill health from occupational exposure to pesticides, four variables were considered: number of years used pesticides, number of hours per year, number of days per year and the handling of pesticide concentrate. The number of years pesticides were used was divided into tertiles at 5 and 15 years. The number of hours per year and days per year spent using pesticides were similarly split into tertiles at 20 and 100 hours per years, and at 10 and 30 days per year. The lowest tertiles were used as the reference category in logistic regression models. For the handling of pesticide concentrate, the usage of a dilute product was utilised as a reference group. The models were adjusted for age, sex and smoking and the results are shown in Table 12.
Table 12 Self-reported occupational ill health by pesticide exposure Variable No. jobs No. jobs not % jobs Adjusted 95% CI
made ill made ill made ill Odds ratio†
Duration of job involving pesticide usage (years) ≤5 177 4,030 24.2% 1.00 5 – 15 207 3,288 28.4% 1.40 1.14 – 1.74 >15 345 3,753 47.3% 1.89 1.53 – 2.28 Hours per year ≤20 117 2,949 22.2% 1.00 20 – 100 173 3,055 32.8% 1.41 1.09 – 1.82 >100 238 2,321 45.1% 2.44 1.91 – 3.12 Days per year ≤10 130 3,625 20.8% 1.00 10 – 30 215 3,166 34.5% 1.85 1.47 – 2.32 >30 279 2,656 44.7% 2.86 2.29 – 3.58 Handle pesticide concentrate No, only dilute 12 559 2.1% 1.00 Yes, sometimes 160 4,356 3.5% 1.62 0.89 – 2.95 Yes, often 551 5,592 8.4% 3.97 2.22 – 7.10
† Odds ratios adjusted for age, sex and smoking status
Each of the models reported in Table 12 shows an increase in reporting of ill health with increasing duration of jobs involving pesticide exposure. For example, those who have used pesticides in their jobs for more than 15 years are almost twice as likely to report “ill health” compared to those who have used pesticides for less than 5 years.
12

4.1
4 CONCLUSIONS
OBSERVATIONS FROM SURVEY
In 1996, the Epidemiology and Medical Statistics Unit at HSE conducted a pilot study on pesticide usage in licensed agricultural pesticide users from a sample of 4,000 individuals on the City & Guilds Land Based Services’s database. The response rate was 50%, though comments were made on the survey being too long and being sent out when workers were very busy. When the survey was sent to the 65,993 individuals on the PUHS database, the response rate was much lower at 14%. This may partly be attributable to the global trend of decreasing response rates to surveys (Galea and Tracy, 2007). As in the initial study some responders commented on the timing of the survey but also that the information requested was very detailed; the poor response rate was probably also attributable to these factors. The low response rate may limit the generalisability of the results, although the differences in age and sex distribution between responders and non-responders were negligible.
About 90% of responders had used pesticides, confirming that a large proportion of individuals on the City & Guilds Land Based Services database were actively employed, or had been employed, in pesticide usage. The median number of years exposed in all jobs was 16 years, with a range of 0 to 85 years. The median duration of exposure was 40 hours per year and 20 days per year.
The commonest main areas of pesticide usage reported were amenity weed control and cereals. Responders listed 2,496 unique trade names and 677 unique active ingredients. The wide variety of products available for pesticide usage made it very difficult to summarise or to link with any ill-health variables.
The proportion of respondents who were current smokers was very small (14%), and the majority of respondents were never smokers (56%). As a comparison, the proportion of current smokers among adults aged over 16 years in Britain, was no lower than 26% during the 1990s and was 24% in 2005 (NHS IC, 2009). These statistics suggest that as a group, these workers were at lower risk of the smoking-related diseases, including lung cancer and cardiovascular disease.
Currently, the only health-related information that is available on this cohort of pesticide users is obtained from the NHS Central Register in the form of cancer and death registrations among the PUHS cohort participants. The mortality analysis indicated that the PUHS cohort has significantly lower all cause mortality than the general British population. However, occupational exposure to pesticides has long been associated with chronic ill health, particularly neurological disorders such as Parkinson’s Disease. From the limited health data that was collected in this survey of pesticide usage, a significantly elevated risk of “ill health” was associated with occupational exposure to pesticides, and a positive trend with increasing exposure was observed. Unfortunately, the current data do not allow for more detailed analysis, and further clarification of symptoms or disease/condition would be required.
About 3,000 responders added a final comment in the survey form. Many of them commented on the difficulty in completing the form accurately due to vast amount of information required. The PUHS Survey of Pesticide Usage has shown the wide variation in the types of chemical used, and in the number of pesticides used by an individual.
13
4.2 RECOMMENDATIONS
A survey of general health among licensed pesticide users should be undertaken in order to investigate potential ill-health issues related to occupational exposure to pesticides. This would help in identifying any important associations with chronic symptoms and conditions, which cannot be detected through the cancer incidence and mortality data.
In the new survey, the questionnaire should provide a simpler, more structured approach to collecting detailed exposure data than in the current survey; this will help respondents and ensure that the data provided are in a consistent format. The survey respondents commented negatively on the detail requested, and this was likely to be a factor in the poor response. If the new survey brings to light any health effects associated with particular pesticide types or activities, then a more detailed follow-up study should investigate these in greater depth. By sending the survey to workers in winter when they are not spraying pesticides, the response rate may also increase.
14
5 REFERENCES
Alavanja, M.C.R., Hoppin, J.A. & Kamel, F. (2004). Health effects of chronic pesticide exposure: cancer and neurotoxicity. Annual Review of Public Health, 25, 155-197.
Alexander D.D., Mink, P.J., Adami, H.-O., Chang, E.T., Cole, P., Mandel, J.S., and Trichopoulos, D. (2007a). The non-Hodgkin lymphomas: a review of the epidemiologic literature. In J Cancer, 120, 1-39.
Alexander D.D., Mink, P.J., Adami, H.-O., Cole, P., Mandel, J.S., Oken, M.M., and Trichopoulos, D. (2007b). Multiple myeloma: a review of the epidemiologic literature. Int J Cancer, 120, 40-61.
Brown, T. (2009) The Pesticide Users Health Study: An analysis of mortality. Health and Safety Laboratory, Report number MSU/2009/07.
Coggon, D., Inskip, H., Winter, P. and Pannett, B. (1995) Occupational Mortality of Men. In Occuptional Health, Decennial Supplement. The Registrar General’s Decennial Supplement for England and Wales, Drever, F. (ed) pp.23-42. HMSO: London.
Dick, F.D., Seaton, A., Haites, N., Semple, S.E., Dick, S., Prescott, G.J., Scott, N.W., Bennett, J.E., Counsell, C.E., Mutti, A., De Palma, G., Mozzoni, P., Soderkvist, P., Ahmadi, A., Otelea, M., Felice, A.and Wettinger, S.B. (2007). Environmental risk factors for Parkinson's disease and parkinsonism: the Geoparkinson study. Occupational & Environment Medicine, 64, 666-672.
Drever, F. (1995). Occupational Health Decennial Supplement. Series DS no. 10: The Registrar General's Decennial Supplement for England and Wales. HMSO: London.
Epidemiology and Medical Statistics Unit (1998) Feasibility study into the use of the National Proficiency Tests Council (NPTC) database of licensed agricultural pesticide users for epidemiological research. Health and Safety Executive report. http://www.hse.gov.uk/pubns/pestuser.htm#6
Galea, S. and Tracy, M.(2007) Participation rates in epidemiologic studies. Annals of Epidemiology, 17 (9), 643-653.
Hoppin, J.A., Umbach, D.M., Kullman, G.J., Henneberge, P.K., London, S.J., Alavanja, M.C.R. and Sandler, D.P. (2007a) Pesticides and other agricultural factors associated with self-reported farmer’s lung among farm residents in the Agricultural Health Study. Occupational and Environmental Medicine, 64, 334-342.
Hoppin, J.A., Valcin, M., Henneberger, P.K., Kullman, G.J., Umbach, D.M., London, S.J., Alavanja, M.C.R., Sandler, D.P. (2007b) pesticide use and chronic bronchitis among farmers in the Agricultural Health Study. American Journal of Industrial Medicine, 50, 969-979.
National Health Service Information Centre (2009). Statistics on Smoking, England 2009. http://www.ic.nhs.uk/pubs/smoking09
Van Maele-Fabry, G., Duhayon, S. and Lison, D. (2007). A systematic review of myeloid leukemias and occupational pesticide exposure. Cancer Causes & Control, 18, 457-478.
15

Van Maele-Fabry, G., Duhayon, S., Mertens, C. and Lison, D. (2008). Risk of leukaemia among pesticide manufacturing workers: a review and meta-analysis of cohort studies. Environ Res 106, 121-137.
Van Maele-Fabry, G., Libotte, V., Willems, J. and Lison, D. (2006). Review and meta-analysis of risk estimates for prostate cancer in pesticide manufacturing workers. Cancer Causes Control, 17, 353-373.
16
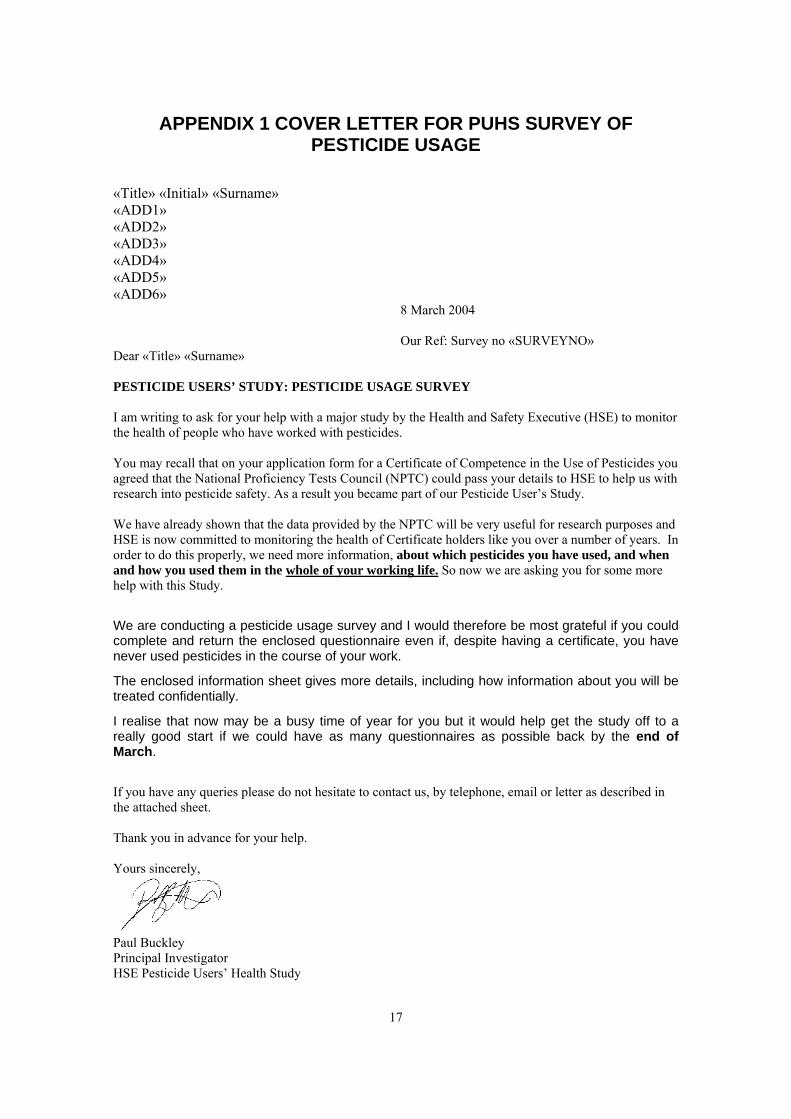
APPENDIX 1 COVER LETTER FOR PUHS SURVEY OF PESTICIDE USAGE
«Title» «Initial» «Surname» «ADD1» «ADD2» «ADD3» «ADD4» «ADD5» «ADD6» 8 March 2004
Our Ref: Survey no «SURVEYNO» Dear «Title» «Surname»
PESTICIDE USERS’ STUDY: PESTICIDE USAGE SURVEY
I am writing to ask for your help with a major study by the Health and Safety Executive (HSE) to monitor the health of people who have worked with pesticides.
You may recall that on your application form for a Certificate of Competence in the Use of Pesticides you agreed that the National Proficiency Tests Council (NPTC) could pass your details to HSE to help us with research into pesticide safety. As a result you became part of our Pesticide User’s Study.
We have already shown that the data provided by the NPTC will be very useful for research purposes and HSE is now committed to monitoring the health of Certificate holders like you over a number of years. In order to do this properly, we need more information, about which pesticides you have used, and when and how you used them in the whole of your working life. So now we are asking you for some more help with this Study.
We are conducting a pesticide usage survey and I would therefore be most grateful if you could complete and return the enclosed questionnaire even if, despite having a certificate, you have never used pesticides in the course of your work.
The enclosed information sheet gives more details, including how information about you will be treated confidentially.
I realise that now may be a busy time of year for you but it would help get the study off to a really good start if we could have as many questionnaires as possible back by the end of March.
If you have any queries please do not hesitate to contact us, by telephone, email or letter as described in the attached sheet.
Thank you in advance for your help.
Yours sincerely,
Paul Buckley Principal Investigator HSE Pesticide Users’ Health Study
17

APPENDIX 2 SURVEY INFORMATION LEAFLET
Pesticide Users' Study: Pesticide Usage Survey Further information for participants
Why is HSE carrying out this survey?
The Health and Safety Executive (HSE) is committed to reducing the risks people face through work activities. Many people work with pesticides or live in areas where they are used and there has sometimes been public concern about whether they might be a risk to people’s health.
The medical evidence available to HSE suggests that when used properly pesticides pose no significant risks to health. However we are aware that there are some gaps in our knowledge.
This survey, which is part of HSE’s Pesticide User’s Study, will look at users’ work with pesticides now, and in the past. We also want to find out about the types of pesticide used and the time spent using them.
We will use this information, with information about users’ health, to provide a further check on pesticide safety.
How is HSE able to contact pesticide users and learn about their health?
The National Proficiency Tests Council, (NPTC), keeps records of users of agricultural pesticides who have Certificates of Competence under the Control of Pesticides Regulations 1986. You and many other pesticide users gave permission for HSE to access the information relating to you for the purpose of medical research into pesticide use. This is how you became part of the Pesticide User’s Study and this is how we have identified you as someone who can help us with this new part of our research.
This is how we are also able to track the health of pesticide users through the national health registers in the UK. This informs us of important health events in the lives of the individuals in the Study.
How many will be included in the new survey?
Over the next five years we will be approaching all pesticide users’ who are on our records and asking them about various aspects of their work with pesticides. In the first phase of the survey we are asking 15,000 pesticide users’ to complete the enclosed questionnaire.
Future research
If you agree to help HSE with this new survey then we will want to contact you on further occasions in the future to ask you for updated information about the pesticides you have used and about safety precautions you have taken at the time. We might also contact you at some time in the future to ask you for more help with other research into pesticide health and safety.
We would always explain at these times what research we wanted to do, and exactly what you would have to do to help. You would always be able to choose at the time whether or not you wanted to help in this way.
We would like to remind you now that you can ask, if you wish, to withdraw from all or part of the Pesticide User’s Study at any time by contacting us using the contact information given below.
18
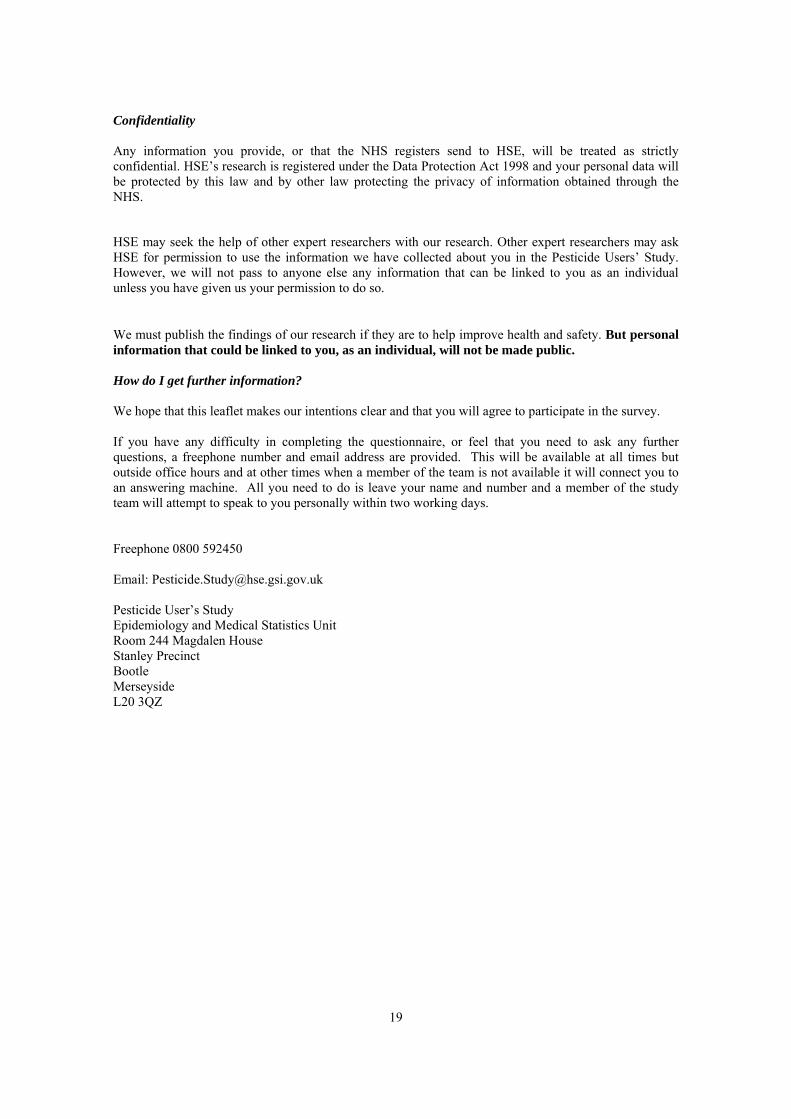
Confidentiality
Any information you provide, or that the NHS registers send to HSE, will be treated as strictly confidential. HSE’s research is registered under the Data Protection Act 1998 and your personal data will be protected by this law and by other law protecting the privacy of information obtained through the NHS.
HSE may seek the help of other expert researchers with our research. Other expert researchers may ask HSE for permission to use the information we have collected about you in the Pesticide Users’ Study. However, we will not pass to anyone else any information that can be linked to you as an individual unless you have given us your permission to do so.
We must publish the findings of our research if they are to help improve health and safety. But personal information that could be linked to you, as an individual, will not be made public.
How do I get further information?
We hope that this leaflet makes our intentions clear and that you will agree to participate in the survey.
If you have any difficulty in completing the questionnaire, or feel that you need to ask any further questions, a freephone number and email address are provided. This will be available at all times but outside office hours and at other times when a member of the team is not available it will connect you to an answering machine. All you need to do is leave your name and number and a member of the study team will attempt to speak to you personally within two working days.
Freephone 0800 592450
Email: [email protected]
Pesticide User’s Study Epidemiology and Medical Statistics Unit Room 244 Magdalen House Stanley Precinct Bootle Merseyside L20 3QZ
19
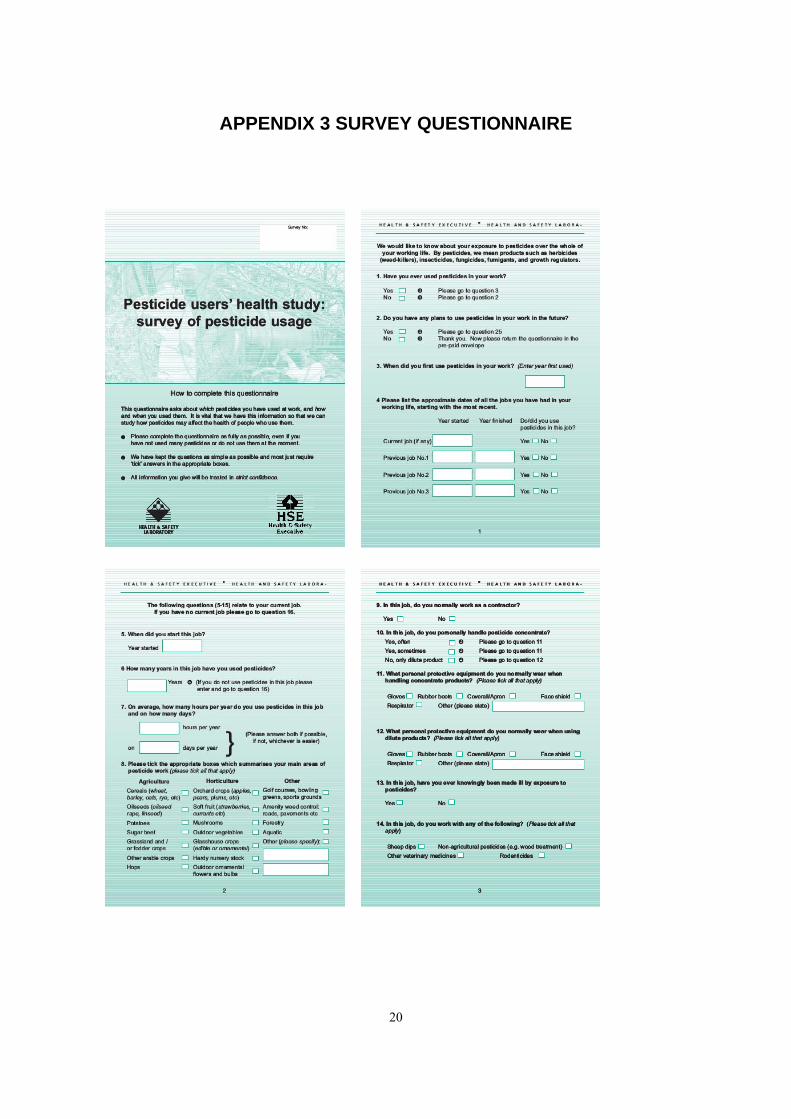
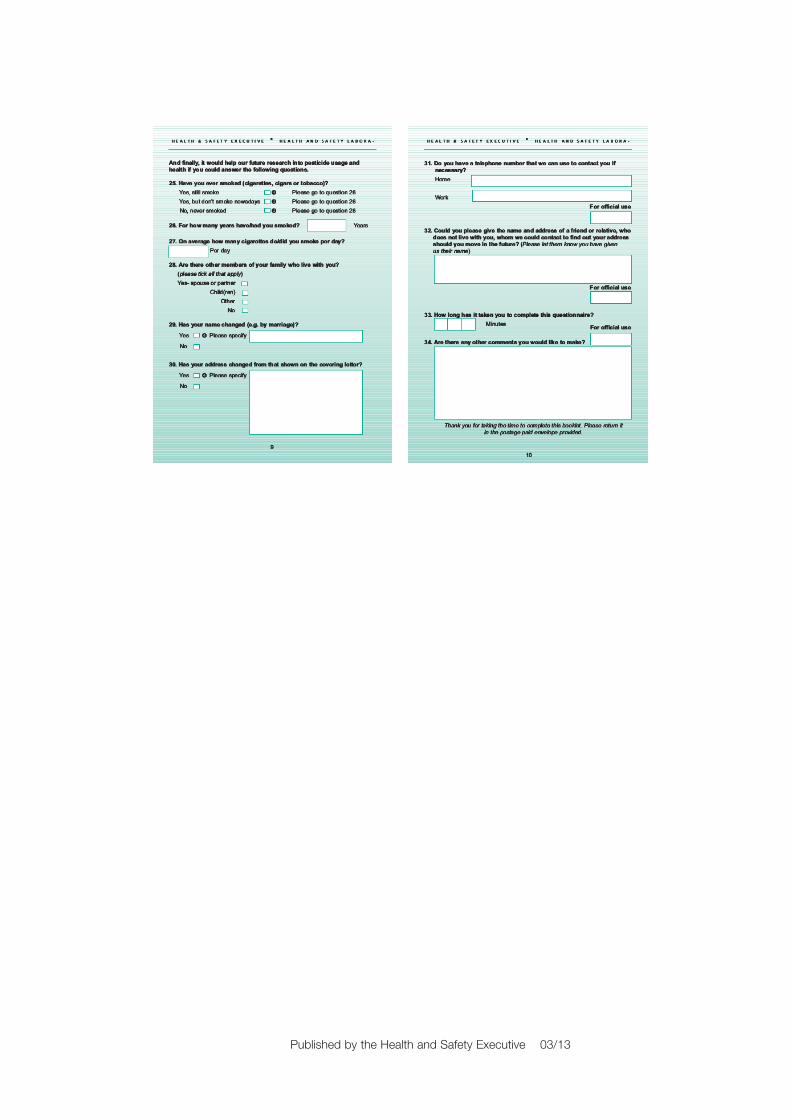
APPENDIX 3 SURVEY QUESTIONNAIRE
20
2121
Published by the Health and Safety Executive 03/13
Health and Safety Executive
The Pesticide Users’ Health Study Survey of pesticide usage
The Pesticide Users Health Study is a cohort of nearly 66,000 commercial pesticide users, certified under the 1986 Control of Pesticide Regulations, who had agreed to participate in HSE’s programme of research into their health. A survey to assess the history of pesticide usage among members of this cohort, and to assess the level of self-reported ill health associated with pesticide exposure, was undertaken in two waves during 2004 and 2006.
The response rate (14%) to the questionnaire was very low; this may be partly attributable to a general decrease in survey response rates and to the fact that the main wave of the survey was undertaken at a particularly busy time of year. Respondents listed nearly 2,500 unique trade names and 677 active ingredients. The most common areas of pesticide usage were amenity weed control and the treatment of cereals. Individuals who were often exposed to pesticide concentrate were four times more likely to report ‘ill health’ associated with pesticide use than those exposed to diluted products; additionally individuals who had used pesticides in jobs lasting more than 15 years were more likely to report ‘ill health’ than those working in jobs lasting less than 5 years.
This report and the work it describes were funded by the Health and Safety Executive (HSE). Its contents, including any opinions and/or conclusions expressed, are those of the author alone and do not necessarily reflect HSE policy.
RR957
www.hse.gov.uk