the personality characteristics of a prison population · personality inventory indicated neither...
TRANSCRIPT

THE PERSONALITY CHARACTERISTICS
OF A PRISON POPULATION
by
Bruce I. Paul, B.A.
submitted in fulfilment of the
requirements for the Degree of
Master of Arts in Psychology.
UNIVERSITY OF TASMANIA
HOBART
1968

ACKNOWLEDGRURNTS
I am grateful for the assistance given tome by
Professor J. A. Cardno and Dr. K. Kruup of the
Psychology Department at the University of Tasmania,
and for the encouragement I received from Dr. T. H. G.
Dick, Chairman of the Mental Health Services
Commission.
I am grateful to M. D. Hornibrook, the Controller
of Prisons, Dr. IV. V. Younger, the Medical Officer and
Mr. C. E. Gibson, the Medical Orderly at Risdon Prison,
and Mr. R. A. Fryett and Mr. E. Foxcroft, the Education
Officers at the prison, for their assistance. I also
acknowledge the co-operation I received from Mr. G. B.
Howie and Inspector R. G. W. Bennett in making available
prison and police records.

certify that this thesis contains no
material which has been accepted for the
award of any other degree or diploma in any
university, and that, to the best of my
knowledge and belief, the thesis contains no
copy or paraphrase of material - previously
published or written by another person, except
where due reference is made in the text of the
thesis.

TABLE OF CONTENTS Page
Abstract 1
I Introduction 2
II Previous Research 4
III The Present Research 14
rif Results from Psychological Tests and Questionnaires 24
V Discussion 57
VI Summary 73
APPENDIX A
Classification of Offences 75
APPENDIX B
Frequency Tables for Prisoners' Scores on the Word Knowledge Test, the Literacy Test, and the Otis Intelligence Test
APPENDIX C
Eysenck Personality Inventory and Sixteen Personality Factor Questionnaire - Means and Standard Deviations
APPENDIX D
The General Questionnaire
APPENDIX E
The Health Questionnaire
Bibliography
77
83
89
90
93
LIST OF TABLES AND FIGURES
Page
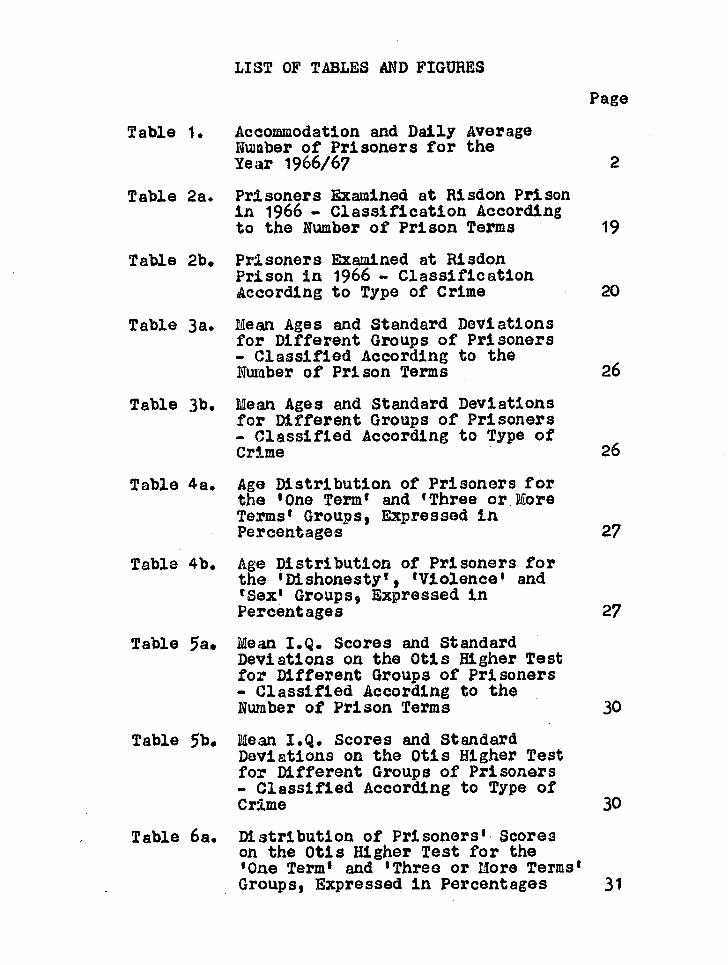
Table 1. Accommodation and Daily Average Number of Prisoners for the Year 1966/67
Table 2a. Prisoners Examined at Risdon Prison in 1966 - Classification According to the Number of Prison Terms
Table 2b, Prisoners Examined at Risdon Prison in 1966 - Classification According to Type of Crime
Table 3a. Mean Ages and Standard Deviations for Different Groups of Prisoners - Classified According to the Number of Prison Terms
Table 3b. Mean Ages and Standard Deviations for Different Groups of Prisoners - Classified According to Type of Crime
Table 4a. Age Distribution of Prisoners for the 'One Term" and 'Three or More Terms' Groups, Expressed in Percentages
Table 4b. Age Distribution of Prisoners for the 'Dishonesty', 'Violence' and 'Sex' Groups, Expressed in Percentages
Table 5a, Mean I.Q. Scores and Standard Deviations on the Otis Higher Test for Different Groups of Prisoners - Classified According to the Number of Prison Terms
Table 5b, Mean I.Q. Scores and Standard Deviations on the Otis Higher Test for Different Groups of Prisoners - Classified According to Type of Crime
Table 6a. Distribution of Prisoners' Scores on the Otis Higher Test for the 'One Term' and 'Three or /lore Terms' Groups, Expressed in Percentages 31
2
1 9
20
26
26
27
27
30
30

LIST OF TABLES AND FIGURES (contd.)
Page
Table 6b. Distribution of Prisoners' Scores on the Otis Higher Test for the 'Dishonesty', "Violence' and "See Groups, Expressed in Percentages 32
Table 7a. Eysenck Personality Inventory (Form A) - Means and Standard Deviations for Different Groups of Prisoners - Classified According to the Number of Prison Terms 34
Eysenck Personality Inventory (Form A) - Means and Standard Deviations for Different Groups of Prisoners - Classified According to Type of Crime
Sixteen Personality Factor Questionnaire (Form C) - Second Order Extraversion and Anxiety - Means and Standard Deviations in Stens for Various Groups of Prisoners
16 P.F. Test Profile for Prisoner Groups in Tasmania, New Zealand and New South Wales
16 P.F. Test Profile for the Tasmanian 'One Term' and 'Three or More Terms' Groups
16 P.F. Test Profile for the Tasmanian 'Dishonesty', 'Violence' and 'Sex' Groups
General Questionnaire Results for the 'One Term' and 'Three or More Terms' Groups of Prisoners, Expressed in Percentages
General Questionnaire Results for the 'Dishonesty', "Violence' and 'Sex' Groups of Prisoners, Expressed in Percentages
Table 7b.
Table 8.
Figure 1
Figure 2
Figure 3
Table 9a.
Table 9b,
35
39
42
43
44
48
49

LIST OF TABLES AND FIGURES (contd.)
Page
Table 10a. Health Questionnaire Results for the 'One Term' and 'Three or More Terms' Groups of Prisoners, Expressed in Percentages
Table 10b. Health Questionnaire Results for the 'Dishonesty', 'Violence' and 'Sex' Groups of Prisoners, Expressed in Percentages
53
54

ABSTRACT
In order to investigate the personality
characteristics of Tasmanian prisoners a sample of
197 prisoners at Risdon !dale Prison was studied by
means of psychological tests and tuo questionnaires.
The study is a beginning to the task of defining the
states prison population.
The Otis Higher Intelligence Test was administered,
and the mean I.Q. was 89.1. Results on the Bysenck
Personality Inventory indicated neither an introversive
or extraversive trend for the group and a slightly above
average level of neuroticism. Results on the Sixteen
Personality Factor Questionnaire indicated introversion
and a slightly above average level of anxiety.
The prisoners in the sample were classified in two
ways - a classification according to the number of
prison terms, and a classification according to type•
of crime - and test results presented for the various
sub.. groups.
The study suggests that recidivism may be correlated
with:-
1. An increasing isolation from society.
2. An increasing degree of neuroticism.
3. An increasing consumption of alcohol.
4. An increasing incidence of brain damage.

Introduction

Tasmania has a population of 383,000. The state's
main prison is situated at Risdon, a few miles from
Hobart, the state capital. As well there is a prison
for females at Risdon. The Kilderry Farm Gaol for
selected male prisoners is situated in a country area
27 miles from Hobart. The daily average number of
prisoners held at each of these centres for the year
1966/67 is given in Table I.
Table 1. Accommodation and Daily Average
Number of Prisoners for the Year 1966/67
Prison Accommodation Daily Average
Risdon Male 320 216.57
Risdon Female 23 7.36
Kilderry Farm 60 57.69
_
The Launceston Gaol is a holding centre for prisoners
from the northern part of the state, although sentences
of not more than 14 days can be served there. This
means that prisoners who commit minor offences in the
northern part of the state may serve their sentences at
Launceston. All other prisoners are sent to Risdon
following sentencing,
For a number of years psychiatrists and psychologists

of the Division of Psychiatric Services of the Department
of Health Services (now the Mental Health Services
Commission) have provided a clinical service to Risdon
Prison. The need for this service to be supported by
research has been apparent for some time. With this
need in mind the present study is a beginning to the
task of defining the state's prison population. The
study is a survey of a sample of prisoners, with
particular reference to personality characteristics.
The number of convicted persons entering Risdon Male
Prison during the year 1966/67 was 658. New admissions
to the prison during the last quarter of 1966, numbering
197, comprised the sample for the present study. In the
main the prisoners were examined within a few days of
their arrival at Risdon, prior to their allocation to
one of the workshops, or work gangs, or the farm.
The Eysenck Personality Inventory and Cattell's
Sixteen Personality Factor Questionnaire were the main
tests used in the study. Previous studies that have
used these tests in the examination of prisoners will be
summarised, and the methods employed in the present study
will be outlined. Then the test results will be presented,
together with the results from a general questionnaire
filled in by the prisoners and a health questionnaire
filled in by the Medical Officer and the Medical Orderly.
Then follows a discussion of some of the questions that
are raised by the study, and a summary of the findings.

II. Previous Research

This section summarises previous studies that
have reported prisoners' scores on the Maudsley
Personality Inventory a, the Eysenck Personality
Inventory, and the Sixteen Personality Factor
Questionnaire, and concludes with a note on the
relevance of the study of personality to corrective
methods employed in penal institutions.
The Maudsley Personality Inventory is the
forerunner of the Eysenck Personality Inventory.

ghe Maude:ley Pgramigityanventsly
„ata_thick Persc_Lgri
Eysenck, in the Manual of the Maudsley Personality
Inventory (1959), gives test scores for 146 recidivist
prisoners. Their mean score on the extraversion scale
is just on the introversive aide of the mean score of
the sample of "normals", while their mean score on the
neuroticism scale is well above the mean for the "normals".
Bartholemew (1963) gives M.P.I. data for various
English and Australian groups. A group of 72 English
male recidivists obtained a similar score to Eysenck's
recidivist group on the extraversion scale. Two
further groups of 50 and 54 English male recidivists
obtained slightly higher scores on the extraversion mmle,
scoring just on the extraversive side of the mean for
"normals". The three recidivist groups obtained high
scores on the neuroticism scale. Bartholemew also gives
data for a group of 50 English male first offenders. Their scores on both the extraversion and the neurotleisan
scales are lower than those reported by Eysenck and Bartholemew for recidivist groups.
Bartholemewts Australian data reveal that prisoners
are more extraverted and neurotic than any "normal"
group. Particularly on the neuroticism scale a group or 150 Australian male prisoners scored well above the means

for the "normal" groups. It is noted that the members
of the Australian groups scored slightly higher on the
extraversion scale than their English counterparts,
while there was little difference in the neuroticism
scores.
Blackler (1968) presents M.P.I. data for two groups
of English prisoners - 438 first sentence men, and 242
second sentence men described as primary recidivists.
On the extraversion scale the mean score for both groups
deviates only slightly from mean scores that have been
reported for groups of "normals". On the neuroticism
scale the mean score for both groups is considerably
higher than mean scores for "normals", and the primary
recidivists obtained a higher mean score than the first
sentence group.
Summarising these published M.P.I. scores for groups
of prisoners - extraversion scores deviate only slightly
from the mid-point of the scale, while neuroticism scores
are invariably high. One study suggests that recidivists
are more extraverted and more neurotic than first
offenders; another study reports no difference in the
extraversion scores of recidivists and first offenders,
and a higher neuroticism score for the recidivists.
The Manual of the Eysenck Personality Inventory
(1964) gives normative data for a number of groups, but
a group of male prisoners is not included.
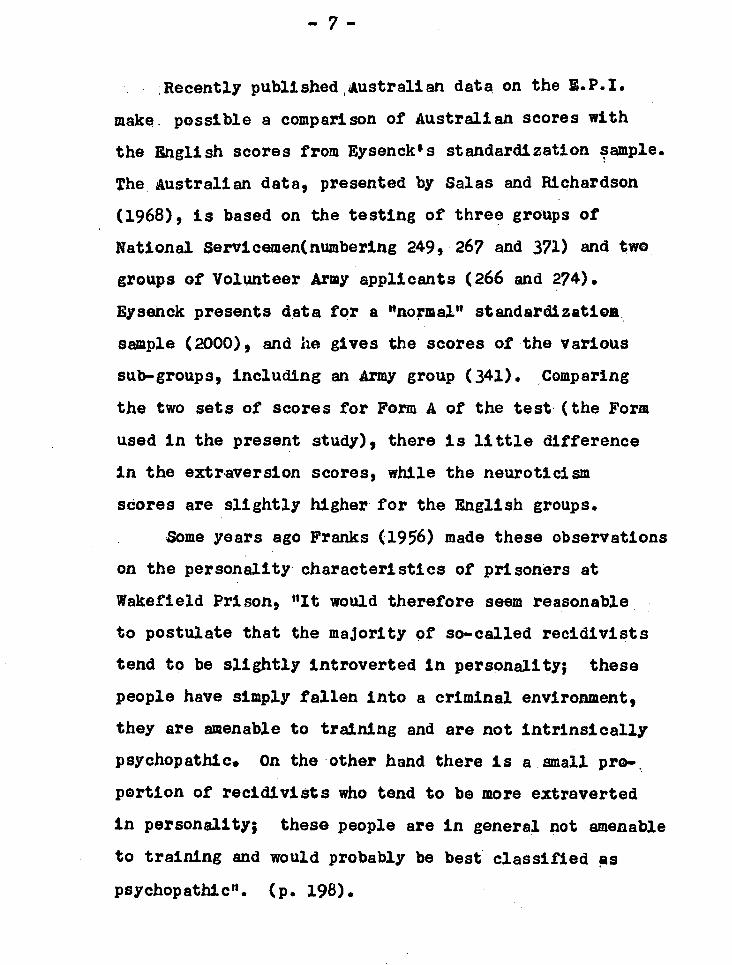
Recently published Australian data on the E.P.I.
make L possible a comparison of Australian scores with
the English scores from Eysenckts standardization sample.
The Australian data, presented by Salas and Richardson
(1968), is based on the testing of three groups of
National Servicemen(numbering 249, 267 and 371) and two
groups of Volunteer Army applicants (266 and 274).
Eysenck presents data for a "normal" standardization
sample (2000), and he gives the scores of the various
sub-groups, including an Army group (341). Comparing
the two sets of scores for Form A of the test (the Form
used in the present study), there is little difference
in the extraversion scores, while the neuroticism
scores are slightly higher for the English groups.
• Some years ago Franks (1956) made these observations
on the personality characteristics of prisoners at
Wakefield Prison, "It would therefore seem reasonable
to postulate that the majority of so-called recidivists
tend to be slightly , introverted in personality; these
people have simply fallen into a criminal environment,
they are amenable to training and are not intrinsically
psychopathic. On the other hand there is a small pro-.
portion of recidivists who tend to be more extraverted
in personality; these people are in general not amenable
to training and would probably be best classified as
psychopathic". (p. 198).

Subsequent work by Bysenck supports this observation
that there are two types of criminal - the extraverts
who are unconditionable and unable to learn non-delinquent
standards, and the introverts who have learnt delinquent
standards from a delinquent sub-culture. Eysenck (1964)
cites a study in a Chicago prison that found that the
most recalictrant prisoners obtained high scores on the
extraversion and neuroticism factors of Cattellis tests. Further research is needed to determine the pro-
portions of introverted and extraverted personalities in prison populations and to study the personality '
characteristics of recidivists.

glex_g_teenalLt F
Cattell, in his Handbook for the Sixteen
Personality Factor Questionnaire (1957), gives a profile
for 45 convicts. A profile for a much larger sample of
convicts (891) is presented in the I.P.A.T. Information
Bulletin No. 8 (1963). This profile reveals that
scores on several factors deviate substantially from the
general population average, a substantial deviation
being one that is expressed in a sten score of 7.0 or
greater, or a sten score of 4.0 or less. The deviant
scores indicate that the convicts are less intelligent
(factor B), have low ego strength (C) and low super-ego
strength (G), are serious (F), imaginative (M), apprehen-
sive (0) and tense (Q 4). Scores on the second ()icier
factors indicate introversion and a high level of anxiety.
'Cattell and Morony (1962) report the 16 P.F. scores
of 67 convicts examined in a New South Wales prison.
The 16 P.F. scores of a larger sample of New South Wales
prisoners (264), who were examined in 1962, havie been
made available to the author. St The profile for this
group of prisoners is very similar to the profile
presented in the I.P.A.T. Bulletin. Two differences are
a Supplied by Mr. L. Evers, Psychologist, Department
of Prisons, New South Wales.

- 10 -
noted. The I.P.A.T. sample scored towards the serious
end of the serious - happy-go-lucky factor (F) while the
Australian sample scored in the opposite direction, just
beyond the mid-point of the scale. The other difference
in the profiles is the scores on the trusting -
suspicious factor (L), the Australian sample manifesting
greater suspiciousness. The Australian scores on the
second order factors indicate an introversive trend and
a high level of anxiety.
In their report on the test scores of Australian
prisoners Cattell and Morony present the scores for a
sample of Australian "normals", and they point out that
the means deviate only slightly from the 5.5 figure for
the American population. There is some indication that
the American population is more happy-go-lucky (F) and
more venturesome (H) than the members of the Australian
sample.
Williamson (1966) presents 16 P.F. (Form C) profiles
for New Zealand prisoners. The profile for 96 prisoners
is similar to the American and Australian profiles that
have been described. The main differences are an almost
average score on the scale measuring super-ego strength
(G) and a greater degree of tender-mindedness (I) for
the New Zealand sample.

The New Zealand sample divides into two groups -
48 first offenders and 48 habitual offenders. The
test profile for the habitual offenders is the more devi-
ant and in particular reveals lower ego strength (C) and
a greater degree of apprehension (0). Again the scores
on the second order factors indicate introversion and
a high level of anxiety, with the habitual offenders
group showing a greater degree of introversion and a
higher level of anxiety.
The I.P.A.T. Information Bulletin No. 8 gives
profiles for a number of clinical groups. It is noted
that convicted criminals, delinquents and psychopaths
have profiles that are similar to the basic neurotic
profile. Introversion and anxiety are less pronounced
In the profiles for the anti-social groups, though they
still clearly exist. Yet elsewhere Cattell (1965)
says, "Neurotics are more frequently made out of
introverts, and delinquents more frequently out of
extraverts." (p. 217).

- 12-
exi_sszu,i 1 y_it Stud es and Cox...:1•(..j.c13.1_e_rbjath_a_ls
Studies that reveal basic differences in personality
among prisoners often go on to suggest that the form of
training and treatment that is given to a prisoner should
be based on personality factors, rather than on other
considerations, Hysenck (1964) makes his position clear
when he says, "Those who are extraverted, who condition
poorly, Qbviously require a good deal of firmness in their
treatment; however, those who are introverted, who con-
dition well, and who turn to crime largely as a result
of conditioning in an unfavourable environment, might be
permanently damaged by excessive severity". (p. 160)
Cattell (1965) too stresses the importance of the
individual personality. "However, in treatment, in the
last resort, each case must be guided by the individuality
of the primary personality profile, and these profiles
in maladjusted individuals, will range from about the
neurotic to around the delinquent pattern". (P. 218).
A study of 100 prisoners by Levy and Kennard (1953) suggests that it may be possible to separate two types
of transgressors on the basis of E.E.G. records and
M.M.P.I. profiles. One group with a fixed psychopathic
personality pattern would require permanent maximal
custodial care. The second group, characterized by a
degree of instability and neuroticism deserves careful
therapy.

- 13 -
Andry's study (1963) of 121 abort-term prisoners
recommends a prison sentence for the "extra-punitive"
offender, and the establishment of special centres
for the immature, neurotic and "intra-punitive"
offenders, where treatment would be based on personality
factors.

III. The Present Research

- 14 -
Psychological tests were administered to 197
sentenced male prisoners who were admitted to Risdon
Prison during the last quarter of 1966.
Several considerations led to the decision to
examine the prisoners within a week of their admission
to prison. There was the practical consideration of
prison routine. The routine would not be disturbed to
any degree if prisoners were examined prior to their
classification. There could be problems if prisoners
were examined at a later date, after they had been
allocated certain duties. In order to secure the co-
operation of the prisoners it was considered desirable
to introduce the testing programme as part of the total
assessment that is made of prisoners following their
admission. A further consideration was the desirability
of testing the prisoners in small groups.
The testing was carried out every Monday morning in
the three months period extending from Monday 19th
September to Monday 19th December. On two occasions,
because of the number of admissions, additional groups
were tested on other days of the week. On most occasions
the group consisted of about 12 men. The largest group
tested was 17.
The aim was to test all men who were sentenced to
a term in prison during the three months period. A
small number of prisoners WWV excluded from the sample

- 15 -
for various reasons. Two prisoners who were in solitary
confinement, and who were oppositional and aggressive in
attitude, were not tested. Five prisoners who were in
the remand yard waiting for the court to hear appeals
against their sentences, were excluded. Four prisoners
who were given sentences of only a. few days missed the
examination.
In addition.to the psychological tests three
questionnaires were prepared, covering the areas of
general background informationv education and employment,
and health., The first of these was filled in by the
prisoners at the time of the psychological examination.
The Education Officer, at. the prison agreed to obtain the
information on education and employment from each
prisoner. The Medical Officer and the Medical Orderly
agreed to interview the prisoners and obtain the
information for the health sheet. .Interviewing prisoners
to obtain detailed information on schooling and employ-
ment history proved to be such a time consuming task
that it was discontinued early in the study. At this
stage the prisoners were asked. to write down certain
general information in. these areas at the time of the
psychological examination. The health sheets were filled in for most of the prisoners, although a few were, unavoidably missed.
Further information on the men in this sample was
obtained from police and prison records.

-16-
In selecting a battery of tests, two considerations
had to be kept in mind:-
1. The intention to obtain measures of literacy
level, intelligence level, and personality.
2. The need to secure the co-operation of the prisoners
by keeping the testing time within reasonable
limits.
The following tests were used, listed here in order
of administration:-
A.C.E.R. Word Knowledge Test - Adult Form B.
Army Psychology Service Literacy Test - Form LB.
Otis Higher Test - Form C.
Eysenck Personality Inventory - Form A.
Questionnaire (referred to above).
Cattellls Sixteen Personality Factor Questionnaire - Form C.
The duration of testing was about 2i hours.
The Word Knowledge Test is a multiple-choice test
of general vocabulary. It is a suitable introductory
test because the instructions are easy to follow, and it
is based on familiar material. The norms are given in
centile ranks, and are based on a standardization of the
test on a sample of Victorian National Servicemen,
The Army Psychology Service Literacy Test consists
of two parts, a reading comprehension test and a dictation
test. It is designed to give a preliminary assessment
of the ability of the subject to read and write, Scores

- 17 -
on the two parts of the test are combined to give a
rating of Illiterate, Near Illiterate, Educationally
Backward or Satisfactory. The norms are based on the
testing of Army recruits.
The Otis Higher Test is a widely used test of
general intelligence, with norms covering the age range
from 12/6 to 18/9. The norms for the 18 year old group
are based on the administration of the test to a
representative sample of Victorian National Servicemen.
The Eysenck Personality Inventory measures two
dimensions of personality - extraversion and neuroticism,
and in addition contains a lie scale. The manual gives
means and standard deviations for various populations.
Cattellls Test measures sixteen dimensions of
personality and in addition Form C incorporates a
motivational distortion scale. Form C was chosen for
the present study because it is shorter, and uses a more
elementary vocabulary than the other forms of the test.
Norm tables are presented for various populations in
stanines and stens.
The psychological testing was introduced along the
following lines:-
"I am a psychologist from the Health Department,
and this morning I am going to give you several tests.
In some of the mainland prisons this has become an
accepted part of the admission procedure. Ail new admissions are given tests of this kind, just as they

-18-
are given a medical.
In Tasmania we are doing this for the first time,
and it is in the nature of an experiment. We hope it
will be of benefit to our prisoners, perhaps indicating
that certain kinds of training are needed.
It can be regarded as a piece of research. I AM
interested in the overall results rather than ,
individual results.
I think you will find these tests interesting. I
will explain to you exactly what you have to do. If
you are not sure about anything don't hesitate to ask
me. You are free to smoke if you want to."
This approach secured the co-operation of the
prisoners. If a question was asked regarding the con-
fidentiality of the test results the prisoner was
informed that any personal information that was disclosed
was confidential and would be used only for general
research purposes. Only a few prisoners raised this
question of confidentiality. Occasionally there was
the problem of the talkative prisoner who tried to
disturb the group, but this was not a serious problem,
and the whole testing programme went through smoothly.
The prisoners in the sample are classified in two
ways. One classification is based on the number of
prison *Ins; the other classification is based on
type of Crime. The test scores of prisoners serving ;

- 19 -
their first sentence are compared with those of
prisoners who have been imprisoned three or more times;
and the test scores of prisoners in the 'dishonesty',
'violence", and 'sex' groups are compared. .Tables 2a
and 2b give the numbers in the various groups.
Table 2a. Prisoners Examined at Risdon Prison
in 1966 - Classification According to the
Number of Prison Terms.
One prison term 111
Two prison terms 23
Three or more prison terms 63
Total group 197

20
Table 2b. Prisoners Examined at Risdon
Prison in 1966 - ClIssification According
to Type of Crime.
Crimes of Dishonesty 108
Crimes of Violence 23
Sex Crimes 20
Other Crimes (Vagrancy, 46
Traffic Offences, etc.)
Total Group 197
The classification according to type of
crime is based on the prisoners' criminal
records, as follows:-

-21 -
Crimes of Dishonesty a
This category includes the following:-
a) Prisoners whose criminal records consist entirely
or crimes of dishonesty.
b) Prisoners whose records consist mainly of crimes
of dishonesty, their other crimes belonging to
the miscellaneous category.
c) Prisoners whose records reveal a preponderance
of crimes of dishonesty, and who have committed
only one crime of violence - of a minor nature.
(For the purposes of the present study a crime
of a minor nature is defined as a crime for which
a prison sentence of not more than one month is
imposed).
The following are excluded:-
a) Prisoners who have committed more than one crime
of violence, and prisoners who have committed a
crime of violence for which a prison sentence of
more than one month was imposed.
b) Prisoners who have committed a sex crime. (An
exception would be a prisoner who committed an
offence of a sexual nature in his early teens.)
a Appendix A lists the offences in each of the three
categories - dishonesty, violence and sex.

- 22-
Crimes of Violence
This category includes the following:-
a) Prisoners whose criminal records consist
entirely of crimes of violence.
b) Prisoners whose records consist mainly of crimes
of violence, their other crimes belonging to the
miscellaneous category.
c) Prisoners whose records reveal that they have
committed a crime of violence of a serious
nature. (For the purposes of the present study
a crime of a serious nature is defined as a
crime for which a prison sentence of at least six
months is imposed).
d) Prisoners whose records reveal a preponderance
of crimes of violence and who have committed
only one crime of dishonesty - of a minor nature.
The following are excluded:-
a) Prisoners who have committed more than one crime
of dishonesty, and prisoners who have committed
a crime of dishonesty for which a prison sentence
of more than one month was imposed.
b) Prisoners who have committed a sex crime. (Again
an exception would be a prisoner who committed
an offence of a sexual nature in his early teens).
lex Crimes
Prisoners whose criminal records contain a crime of
a sexual nature are placed in this category.

23
As already stated a prisoner who committed an
offence of a sexual nature in his early teens and who
committed no further offences of this kind, is excluded.
Miscellaneous
a) Prisoners whose criminal records contain both
crimes of .dishonesty and crimes of violence. b) Prisoners whose records consist entirely or
almost entirely of various other offences, for example, vagrancy, drunk and disorderly, dangerous driving, etc.

IV. Results from Psychological
Tests and Questionnaires

- 24-
This section includes information on the age
composition of the sample, a note on vocabulary and
literacy levels, test scores for the intelligence
test and the personality questionnaires, and findings
from the general questionnaire and the health questionnaire.
The prisoners in the sample are classified in two
ways:-
1. A classification according to the number of
prison terms;
2. A classification according to type of crime.
-25
Age Composition
The age composition of the sample is presented
in Tables 3a, 3b, 4a and 4b. The mean age of the
sample is 26.7, with almost two-thirds of the prisoners
in the 16 - 25 age range. Offenders who have committed
crimes of violence are in the younger age groups, while
a number of the sexual offenders are in the older age
groups.

Table 3a. Mean Ages and Standard Deviations for
Different Groups of Prisoners - Classified Accord-
ing to the Number of Prison Terms.
N RANGE M S.D.
One prison term 110 16-54 23.3 8.5
Two prison terms 24 17-57 27.1 11.1
Three or more
prison terms
63 18-60 32.5 11.0
...---
Total Group 197 16-60 26.7 10.6
Table 3b. Mean Ages and Standard Deviations for
Different Groups of Prisoners - Classified According
to Type of Crime.
RANGE M S.D.
Crimes of dishonesty 106 16-58 24.9 9.1
Crimes of violence 23 17-41 24.4 6+3
'Sex crimes 20 17-57 31.6 12.7
Miscellaneous 48 17-60 29.8 12. 7
Total group 197 16-60 26,7 10.6

Table 4a. Age Distribution of Prisoners for
the 'One Term' and 'Three or More Terms'
Groups, Expressed in Percentages.
Ages One Term (N = 110)
Three or More Terms (N = 63)
Total Group (N = 197)
16-25 76% 35% 61%
26-35 11 29 17
36-45 8 22 13
46+ 5 14 9 -
Table 4b. Age Distribution of Prisoners for
the 'Dishonesty', 'Violence' and 'Sex' Groups,
Expressed in Percentages.
-------„-- Ages Dishonesty Violence Sex Total
Group (N = 106) (N = 23) (N = 20) (N = 197
16-25 67% 61% 45% 61%
26-35 17 35 10 1.7 36-45 13 4 25 ,13
46+ 3 - 20 9

28 -
1or Knowledge and Literacy. Tests
Results on the A.C.E.R. Word Knowledge Test and
the Army Literacy Test give an indication of the
educational level of the prisoners in this sample. It
is obvious from the results on the Word Knowledge Test
that the vocabulary level of the prisoners is well
below that of the standardization sample; for example, 43% of the prisoners who attempted the test scored at
the 20th centile rank or below. Nearly all the prisoners
attempted the Literacy Test, and 38% obtained scores
that place them in the educationally backward, near-
illiterate or illiterate categories. (See frequency
tables for the two tests in Appendix B).
These percentages hold for the sub-group of
prisoners serving their first sentence and for the sub-
group made up of those who have served three or more
prison terms. The percentages vary to some extent for
the sub-groups based on type of crime. It is noted
that a smaller proportion of prisoners in the 'violence'
sub-group scored at the lower levels on both the Word
Knowledge and the Literacy Tests, but the small number
of prisoners in this sub-group does not allow other than tentative interpretations of these findings.

- 29
The mean I.Q. score of 89.1 is based on the scores
of 180 of the prisoners on the Otis Higher Test. (see
Tables 5a and 5b) If 90-109 is regarded as the average
range of scores, 4% of the scores are above average, 465
of the scores fall within the average range; and 50%
are below. average. 24% of the group obtained I.Q.
scores of 79 or less. (see Tables 6a and 6b)
The mean I.Q. scores for the sub-groups vary only
slightly from the mean for the 180 prisoners. The mean
for 100 prisoners in the tone term" group is 89.4, and
the mean for 60 prisoners in the 'three or more terms'
group is 88.8 (t a 0.290, p .05). The mean for 96
prisoners in the 'dishonesty group is 87.7, the mean
for 20 prisoners in the *violence' group is 91.8, and
the mean for 18 prisoners in the 'sex' group is 89.4.
(F 16. 1.150, p > .05).
The percentage of prisoners obtaining an I.Q. score
of 79. or less is lower in the 'violence' and 'sex'
groups than in the 'dishonesty' group, but the snail
numbers in the "violence' and 'sex' groups preclude any
interpretation of these differences.

- 30 -
Table 5a, Mean I.Q. Scores and Standard Deviations
on the Otis Higher Test for Different Groups of
Prisoners - Classified According to the Number of
Prison Terms.
M S. D.
One prison term 100 89.4 12.5
Two prison terms 20 88.8 . 12.2
Three or more
prison terms 60 88.8 11 0 6
Total Group 180 89.1 12.2
Table 5b, Mean I.Q. Scores and Standard DeviatiOns
on the Otis Higher Test for Different Groups of
Prisoners - Classified According to Type of Crime.
—....—/ N N S. D.
Crimes of dishonesty 96 87.7 12.3
Crimes of violence 20 91.8 10.9 Sex crimes 18 89.4 9.3
Miscellaneous 46 90.8 13.1
Total Group 180 89.1 12.2

- 31 -
Table 6a. Distribution of Prisoners' Scores on
the Otis Higher Testfor the 'One Term' and 'Three
or More Terms' Groups, Expressed in Percentages.
I.Q's. One Term (N = 100)
Three or More Terms (N = 60)
Total Group (N s,180)
120-129 1% . - 1%
110-119 4 2% 3
100-109 19 15 17
90-99 ' 25 38 29
80-89 26 22 26
70- 79 20 18 19
60-69 5 5 5

- 32
Table 6B. Distribution of Prisoners' Scores
on the Otis Higher Test for the 'Dishonesty',
'Violence' and 'Sex' Groups, Expressed in
'Percentages.
I.Ces. Dishonesty
(N = 96)
Violence
Of a 20)
Sex
(N = 18)
Total Group. (N = 180)
120-129 - . 1%
110-119 a% 5% . 3 100-109 18 25 16% 17 90- 99 22 30 17 29
80- 89 29 20 50 26
70- 79 22 20 17 19
60-69 6 - . 5

- 33 -
Bagnak_Evsonality Inventory
The results on the*Eysenck Personality Inventory are
presented in Tables 7a and 7b. The questionnaires of
subjects who failed to reach a score of 7 on the reading
'comprehension section of the Literacy Test or a score of
70 I.. on the Otis Test have been excluded.
No results have been rejected on the basis of the
Lie score. Knowles and Kreitman (1965) have argued
against the practice of rejecting the results of subjects
with high Lie scores, pointing out that lying is a
complex process and that both honest and dishonest
subjects contributed to the standardization norms. The
Lie scale may be measuring attitudes other than dis-
honesty leading to an attempt to falsify test results.

- 34 -
Table 7a. Eysenck Personality Inventory (Form A)
- Means and Standard Deviations for Different
Groups of Prisoners - Classified According to the
Number of Prison Terms.
EXTRAVERSION NEUROTICISM
S.D. M S.D.
One prison term 94 13.17 4.26 9.81 5.19
Two prison terms 19 11.42 3.82 12.26 4.29 Three or more
prison terms
52 12.50 3.96 11.22 5.65
Total Group 165 12.76 4.16 10.53 5.32
Note:- The means and standard deviations for the
normal standardization sample are 12.07 and
4.37 for the E scale, and 9.07 and 4,78 for
the N scale.

-35-
Table 7b. Eysenck Personality Inventory (Form A)
- Means and Standard Deviations for Different
Groups of Prisoners - Classified According to
Type of Crime.
N EXTRAVERSION NEUROTICISM
Li S.D. M S.D.
Crimes of dishonesty
89 12.93 3.89 10.73 5.40
Crimes of violence
19 13.84 3,87 10.37 4,09
Sex crimes 16 12.69 4.47 10.44 4.36
Miscellaneous 41 11.90 4.55 10.22 5.37
Total group 165 12.76 4.16 10.53 5.32
Note:- The means and standard deviations for the
normal standardization sample are 12,07
and 4.37 for the E scale and 9.07 and 4.78
for the N scale.

- 36
The Extraversion (E) score for the total group
varies only slightly from E scores reported by Eysenck
(1964) for a "normal" population and by Sales and
Richardson (1968) for Australian Army groups, suggesting
that there is no decided trend in either the introversive
or the extraversive direction in this group of prisoners.
There is little variation in the B scores of the
sub-groups, none of the differences reaching the .05
level of significance. The mean of 94 lone term'
prisoners, is 13.17, and the mean of 52 'three or more
terms' prisoners is 12.50. (t m 0.295, p> .05). The
mean of 89 prisoners in the'dishonestyl group is 12.93,
the mean of 19 prisoners in the 'violence' group is
13.84, and the mean of 16 prisoners in the 'sex' group
is 12.69. (F m 0.473, p >.05). However it is noted
that the 'three or more terms' group is slightly less
extraverted than the lone term' group, and the 'violence'
group obtained the highest score on the E scale.
Neuroticism (N) scores for the total group and for
all sub-groups are higher than the N scores reported by
Eysenck and Sales and Richardson for their "normal"
groups, the deviation being more pronounced when the
prisoners scores are compared with the scores of the
Australian Army groups.
It is noted that the 'three or more terms' group
has a higher level of neuroticism than the lone term'

- 37 -
group. However the difference fails to reach the .05
level of significance. The mean of 94 lone term'
prisoners is 9.81, and the mean of 52 'three or more
terms' prisoners is 11.22. (t 1.508, p> .05).
There are only slight differences in N scores for the
other three sub-groups. The mean of 89 prisoners in
the 'dishonesty' group is 10.73, the mean of 19 prisoners
in the 'violence' group is 10.37, and the mean of 16
prisoners in the 'sex' group is 10.44.
(F = 0.052, p ;) .05).

- 38 -
Cattell's Sixteen PersontiAtv
Eaplar_a_lest oz_kd_n re,
As in the case of the E.P.I., the 16 P.F. results
of subjects who failed to reach a score of 7 on the
reading comprehension section of the Literacy Test, or
a score of 70 I.Q. on the Otis Test have been rejected.
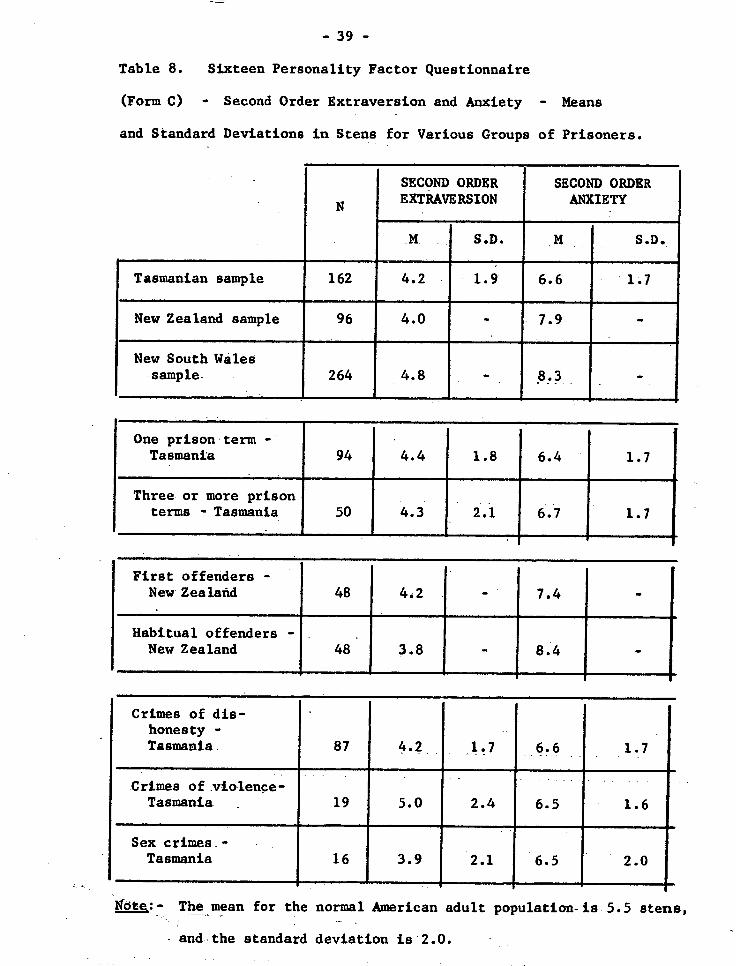
Table 8 presents scores on the 16 P.F. second order
factors for groups of prisoners in Tasmania, New
Zealand, and New South Wales. The scores for all
groups indicate introversion and a high level of
anxiety..
- 39 -
Table 8. Sixteen Personality Factor Questionnaire
(Form C) - Second Order Extraversion and Anxiety - Means
and Standard Deviations in Stens for Various Groups of Prisoners.
•
• N
SECOND ORDER EXTRAVERSION
SECOND ORDER ANXIETY
S.D. • S.D.
Tasmanian sample 162 4.2 1.9 6.6 1.7
New Zealand sample 96 4.0 - 7.9 -
New South Wales sample 264 4.8 - 8 . 3 -
One prison term - Tasmania 94 4.4 1.8 6.4 1.7
Three or more prison terms -Tasmania 50 4.3 2.1 6.7 1.7
First offenders - New Zealand 48 4.2 7.4 -
Habitual offenders - New Zealand 48 3.8 - 8.4 -
Crimes of dis- honesty - Tasmania 87 4.2 • 1.7 ... 6.6 1.7
Crimes of violence-Tasmania . 19 5.0 2.4 6.5 • 1.6
Sex crimes - Tasmania 16 3.9 2.1 6.5 • 2.0
Note,:- The mean for the normal American adult population-is 5.5 stens, _
and the standard deviation is 2.0.

The extraversion score's of the lone term' and 'three
or more terms' Tasmanian groups are almost identical.
The mean of 94 'one term' prisoners is 4.4'stenS and
the mean of 50 'three.or more. terms' .prisonersis.4.3
stens (t = 0.090, p ).05). However the tendency for
the 'three or more terms' group to be less extraverted
is more pronounced in the New Zealand sample , where the
habitual offenders obtain a lower score on the extra-
version factor than the first offenders. •
The anxiety scores reveal a slightly higher level
of anxiety in the 'three or more terms' group. The mean
of 94 'one term' prisoners is 6.4 9 and the mean of 50
'three or more terms' prisoners is 6.7 (t = 1.101 9
P ) .05). Again the difference is more pronounced in
the New Zealand sample, the habitual. offenders register-
ing a higher level of anxiety than the first offenders.
The scores of the other Tasmanian sub-groups
indicate a-greater degree of extraversion in the 'violence'
group, but again the differences are not statistiCally
'significant. . The mean of 87 prisoners in the 'dishonesty'
group is 4.2, the mean of 19 prisoners in the 'violence'
group is 5.0 9 and the mean of 16 prisoners in the 'sex' group is 3.9 (F 0.482 9 p .05). Anxiety scores are
almost identical for these three groups. The mean for
the 87 'prisoners in the 'dishonesty' group is 6.6 9 the mean

-41-
for the 19 prisoners In the 'violence , group is 6 .5,
and the mean for the 16 prisoners in the 'sex' group is
6.5 (F = 0.022 9 p ›.05).
The correlation between E.P.I. and 16 P.P. extroversion
is • .55 9 but it is noted that while E.P.I. scores are at
about the raid-point of the introversion - extraversion
scale, the 16 P.P. scores indicate introversion. The
correlation between E.P.I. neuroticism and 16 P.P.
anxiety is + .59.
16 P.P. profiles are presented for various groups
of prisoners.

-42 -
101
3V
I
- ■
Sten Score
, Low Score
Description 1
Sten
2 3 Average 4 5 6
1
7
Score
8 9 10
High Score
Description
Tas. ,
N.Z 1 N.S.W.
A 4.7 4.4 5.1 Reserved • . • • • • • • Outgoing
B 4.1 3.9 4.1 Less Intelligent • • •
• • • • • •
More Intelligent
C 5.8 3.8 3.8 Low Ego Strength • • 4 High Ego Strength
E 5.2 4.9 5.6 Submissive • • • • • • • • Dominant
F 4.7 4.8 5.9 Serious
r
• • .. • Happy Go Lucky
G 5.1 5.2 3.8 Low Super Ego \ . . . High Super Ego
H 3.8 4.0 4.1 Shy 4 Venturesome
I 5.2 7.2 6.3 Tough Minded . . . . 440114 • • • Tender Minded
L 6.7 6.1 7.3 Trusting 4 Suspicious
M 5.2 5.6 6.7 Practical • • • • 1111 • • • Imaginative
O N 6.0 5.4 5.3 Naive • • • Shrewd
0 5.1 7.3 8.0 Placid • • • • 10)00. . . Apprehensive
Q1 4.8 6.1 ...7 Conservative Experimenting
Q2 4.9 6.2 6.6 Group Dependent • • • Self Sufficient
Q3 3.6 4.2 4.4 Casual Controlled
Q4 6.4 7.9 7.9 Relaxed • • Tense
4.2 4.0 4.8 Introversion • . • RIM -...,....444,04 • • Extraversion
6.6 7.9 8.3 Low Anxiety • • High Anxiety
Figure 1. 16 P.F. Test Profile for Prisoner Groups
in Tasmania, New Zealand and New South Wales.

-43 -
FACT
OR
1 Sten Score Low Score
Description
1 2 3
Sten
4
Average
5 6
Score
7 8 9 10
High Score
Description One Term Three or More
Terms
'
4.8 4.5 Reserved . • • . . . • • . Outgoing
B 4.2 4.0 Less Intelligent . • • 4 • . . • • . More Intelligent
5.9 5.5 Low Ego Strength . • • . . . . . High Ego Strength
5.0 5.7 Submissive . • • .
0°1 . • • . Dominant
419 4.6 Serious . • • . • • . Happy Go Lucky
G 5.2 5.0 Low Super Ego . • •
..) •
. • • . High Super Ego
3.9 3.8 Shy . • • . . . • • . Venturesome
I 5.2 5.1 Tough Minded . • • . . . • • . Tender Minded
6.4 7.3 Trusting . • • . . . . . Suspicious
4.6 6.1 Practical . • • . . • • . Imaginative
5.9 6.3 Naive . • • . . . • • . Shrewd
6.0 5.0 Placid . • • .
0 . . . . Apprehensive
Q1 4.7 5.0 Conservative . • • . . . . . . Experimenting
Q2 4.9 5.1 Group Dependent . • • . 11 . . . . . Self Sufficient
Q3 3.9 3.4 Casual . • • 4. • . . . . . Controlled
Q4 6.2 6.6 Relaxed . • • •ppe • . . . Tense
4.4 4.3 Introversion . • • . . . . . Extraversion
6.4 6.7 Low Anxiety . • • . . . . . High Anxiety
Figure 2. 16 P.F. Test Profile for the Tasmanian
'One Term' and 'Three or More Terms' Groups.

-44- I110 .1 .3V1
Sten Score Low Score
Description 1
Sten
2 3 4
Average
5 6 7 8
Score
9 10
High Score
Description Dishonesty Violence Sex
A 4.6 5.5 4.8 Reserved Outgoing
B 4.1 3.9 3.8 Less Intelligent %
• • • • • More Intelligent
C 5.8 5.1 5.5 Low Ego Strength • • • • • • • High Ego Strength
E 5.3 6.2 4.4 Submissive • • • 111111 • • • • Dominant
F 4.6 4.9 • 4.4 Serious • • • Happy Go Luc ky
G 5.4 4.3 5.4 Low Super Ego • • • ■A • • • • • High Super Ego
H 3.8 4.4 3.6 Shy . . . i • • • • • • Venturesome
I 5.4 4.8 4.8 Tough Minded • • • •
1111111141111\ • • • • Tender Minded
L 6.6 7.6 6.4 Trusting • • • . • • • • Suspicious
M 5.2 5.7 5.5 Practical Imaginative
N 5.8 6.5 5.1 Naive • • • • • • • • Shrewd
0 5.2 4.5 4.9 Placid • • • • • • • • Apprehensive 1
Ql 5.0 4.7 4.2 Conservative . . . liir . . . . . Experimenting
Q2 4.8 5.2 4.8 Group Dependent . . . ) Self Sufficient
Q3 3.9 3.1 3.2 Casual .4 . . . . . . Controlled
Q4 6.4 6.3 6.3 Relaxed . • . . "" -- , . . . . Tense
4.2 5.0 3.9 Introversion Extraversion
6.6 6.5 6.5 Low Anxiety High Anxiety
Figure 3. 16 P.F. Test Profile for the Tasmanian
'Dishonesty', 'Violence' and 'Sex' Groups.

The 16 P.F. profile for 162 prisoners in the
Tasmanian sample reveals several deviant scores. The
greatest deviations from the general population scores
indicate shyness (factor H) and casualness (Q 3): Other
deviant scores indicate that these prisoners have less
than average intelligence (B), and are suspicious (L).
These deviations are also present in Williamsonts profile
for 96 New Zealand prisoners. ,Comparing,the Tasmanian
and New Zealand profiles the pattern similariPy coefficient
(rp) is 4 .72. (Both samples were given Form C of the
16 P.F.).
The profile for the New Zealand prisoners contains
other deviant scores, indicating low ego strength (C),
tender-mindedness (I), apprehension (0) and tension(Q 4).
These deviant scores are reflected in the higher score
on the second-order anxiety factor - 7.9 stens compared
to a score of 6.6 stens for the Tasmanian prisoners.
The profile for the New South Wales sample follows fairly
closely the New Zealand profile, and yields a still
higher score of 8.3 stens on the second-order anxiety
factor.
There is a high degree of similarity between the 16
P.F. profiles of the various sub-groups in the Tasmanian
sample. Comparing the tone term' group with the 'three
or more terms' group the pattern similarity coefficient
is .92. Comparing the other groups, the coefficient

- 46 -
for the 'dishonesty and 'violence' groups is 4. .88,
for the 'dishonesty' and 'sex' groups 4. .94, and for
the 'violence' and "sex' groups+.85.
While the profiles for the lone term' and 'three
or more terms' groups are very similar, the differences -
in factor scores are generally in the direction of a
greater degree of maladjustment in the prisoners who
have served three or more terms. The same trend is
observed when comparing the profiles of the first offenders
and the habitual offenders in the New Zealand sample.
There are some interesting differences in the
profiles of the three groups based on type of crime.
For example, the 'violence' group tends to be aggressive
(109 while the "sex' group tends to be submissive (E);
the 'violence' group scores lower on super-ego strength
(G) and higher on suspiciousness (L) and shrewdness (N).
-47-
General Questionnaire
Tables 9a and 9b present the results of the
questionnaire filled in by the prisoners at the time of
the psychological examination. All the figures in the
tables are in the form of percentages. It should be
kept in mind that the figures are derived from prisoners'
unsupported statements.

One prison : term (N=110)
Three or more prison terms (N = 63)
Total group (N,197)
-48 -
Table 9a. General Questionnaire. Results for the 'One Term' and 'Three or More Terms' Groups of Prisoners, Expressed in Percentages.
Age - -
16-25 767w 35% 61% 26-35 ' 11 29 17 36-45 8 22 13 46+ 5 14 9
Education - . Primary 14 34 22
Secondary 86 66 78 _
Occupation - Unskilled and semi-
skilled 75 72 76 Tradesman 20 23 20 Clerical, Sales, Stores 3 5 3 Semi-professional and
professional 2 - 1
Unemployed at time of committing offence 25 37 30
Religion - Roman Catholic 29 16 24 Church of England 40 63 48 Other Protestant 25 13 22 Nil 6 8 6
Prisoner lives in urban area 68 75 73
Prisoner lives in rural area 32 25 27
Parents separated during prisoner's childhood 19
1••••
19 21
Marital status - Single 71 57 66 Married 24 30 25 Separated or divorced 5 13 9
, Has been an inmate of
Ashley Home I 11 26 15

-49 -
Table 9b. General Questionnaire. Results for the 'Dishonesty', 'Violence' and 'Sex' Groups of Prisoners, Expressed in Percentages.
Crimes of dishonesty
(N=106)
Crimes of violence (N-23)
Sex crimes (N=20)
. Total group (N=197)
Age - 16-25 67% 61% 45% 61% 26-35 17 35 10 17 36-45 13 4 25 13 46+ 3 - 20 9
Education - Primary 23 17 32 22 Secondary 77 83 68 78
Occupation - Unskilled and
semi-skilled 79 70 74 76 Tradesman 18 22 26 20 Clerical, Sales
Stores 2 4 - 3 Semi-profession-
al and professional 1 . 4 - 1
, Unemployed at time
of committing offence 33 17 5 30
Religion - Roman Catholic 23 9 16 24 Church of England 50 65 52 48 Other Protestant 21 22 16 22 Nil 6 4 16 6
Prisoner lives in urban area 73 63 67 73
Prisoner lives in • rural area 27 37 33 27
Parents separated during prisonees childhood 24 17 11 21
Marital Status - Single 73 56 74 ' 66 Married 23 35 5 25 Separated or divorced 4 9 21 9
Has been an inmate of Ashley Home
i 22 17 11 15

-50
The 'three or more terms! group is of course an
older group than the 'one term' group and has a higher
percentage of married prisoners and a higher percentage
of separated or divorced prisoners. Nearly all the
prisoners in the 'violence' group are in the younger age
groups, and the percentage of married men in this group
is comparatively high. On the other hand there is a
greater percentage of older men in the 'sex' group, and
the number separated or divorced is comparatively high.
Reference has already been made to the lower in-
telligence and lower educational level of the prisoners,
and the preponderance of unskilled and semi-skilled workers
is not surprising. About one third of the prisoners were
unemployed at the time of committing their most recent
offence.
The section of the table dealing with religious
denomination reveals some interesting differences between
sub-groups. Roman Catholics comprise 29% of the tone term' group, but only 16% of the 'three or more terms' group.
Likewise the 'Other Protestants' drop from 25% of the tone term' group to 13% of the 'three or more terms' group. On
the other hand the percentage of Church of England prisoners
rises from 40% of the tone term' group to 63% of the 'three or more terms' group.
The figures for the other sub-groups show that the percentage of Roman Catholics is lower in the 'violence'

- 51 -
and 'sex' groups than in the 'dishonesty' group, and the
percentage of 'Other Protestants' drops in the 'sex'
group.
For all sub-groups the percentage of prisoners living
in urban areas remains about the same, the figure for the
total group being 73%.
It is interesting to note that the prisoners guilty
of sex crimes show lower percentages on the items referring
to a broken home, and unemployment at the time of committing
the offence.
15% of the present sample stated that they had been
in the Ashley Home for Boys, a corrective institution for
teenage boys, under the control of the Social Welfare
Department. The figure is 26% for the 'three or more
terms' group.

- 52
Oealth Questionnaire
Tables 10a and 10b present the results of the health
questionnaire. The Medical Officer and the Medical
Orderly at the prison obtained this information by inter-
viewing each prisoner. Again the percentages given in
these tables are based on the prisoners'own statements
in answering the questions asked,

- 53 -
Table 10a. Health Questionnaire. Results for the 'One Term' and 'Three or More Terms' Groups of Prisoners, Expressed in Percentages.
One prison term
(N=101)
Three or more pris- on terms (N=60)
Total group
(N=183)
Suffers from Stomach ulcers 37. - 27. Skin condition 8 27. 6 Asthma 5 7 6
Suffers from blackouts 9 23 .13 fits 2 5 3 memory loss 3 •12 . 7
Has done boxing 28 38 30 • Involved in one or more .
car- accidents 54 55 55 Involved in one or more •
motor cycle accidents 14 - 20 11 Has been knocked un-
conscious 39 57 • 45 Has sustained a head
injury 16 38 24
Has had psychiatric treatment 12 23 18
Has been a heavy drinker 23 50 32 States he is an alcoholic 6 28 13 Has had treatment for
alcoholism 5 17 8 Drinking just prior to
committing offence 56 65 58 "Under the influence"
when committing offence 41 53 46
Positive family history- Prison sentence 20 22 21 Psychiatric treatment 20 18 20 Treatment for alcoholism 3 7 4

- 54 -
Table 10b. Health Questionnaire. Results for the 'Dishonesty', 'Violence' and 'Sex' Groups of Prisoners, Expressed in Percentages.
. Crimes of dishonesty
(N=98)
Crimes of violence (N=22)
Sex crimes (N=18)
. Total group (N=183)
... Suffers from
stomach ulcers 27 5% - 2% skin condition 4 9 - 6 asthma 4 9 - 6
Suffers from blackouts 12 9 22% 13 fits* memory loss
5 5
5 -
, 17
3 7
Has done boxing 29 36 28 30 Involved in one or
more car accidents 48 68 72 55
Involved in one or more motor cycle accidents 22 18 17 - 11
Has been knocked unconscious 46 55 44 45
Has sustained a head injury 20 36 28 24
Has had psychiatric treatment 14 14 22 18
Has been a heavy drinker 29 32 44 32
States he is an alcoholic 11 9 17 13
Has had treatment for alcoholism 6 9 11 8
Drinking just prior to oommitting offence 49 86 67 58
"Under the influence" when committing offence 38 74 44 46
Positive family history Prison sentence 26 14 17 21 Psychiatric treat- .
ment 20 23 11 20 Treatment for
alcoholism 3 5 - 4

- 55 -
Very few of the prisoners reported that they suffered
from stomach ulcers, skin conditions or asthma, possibly
indicating a low incidence of psychosomatic conditions.
The percentage of prisoners stating that they suffer
from blackouts is higher, particularly in the 'three or
more terms' group and the group guilty of sex crimes. The
incidence of heavy drinking and alcoholism is high for
both these groups, and this may partly account for the
numbers that report blackouts.
The numbers who reported that they had been knocked
unconscious, sustained a head injury, had boxing experience,
and been involved in road accidents are high - items that
were included because of their possible bearing on the
incidence of brain damage.
The 'three or more terms' group has higher percentages
than the lone term group on all items relating to
'organicity.' 57% of the "three or more terms' group
stated that they had been knocked unconscious and 38%
reported head injury.
The 'violence' group has high percentages on several
of the 'organicity' items, with 55% stating that they had
been knocked unconscious and 36% . reporting head injury.
The percentages for involvement in one or more car
accidents are consistently high, with a figure of 68% for
the 'violence' group, and 72% for the 'sex' group.
The incidence of reported psychiatric treatment is

highest for the 'three or more terms' group and the 'sax'
group.
The 'three or more terms' group has higher percentages
than the lone term' group on all items relating to drinking
behaviour.
The 'sex' group has higher percentages on the items
recording heavy drinking and alcoholism than the 'dishonesty*
and 'violence' groups.
58% of the total group reported that they were drink-
ing just prior to committing the offence, and 46% reported
that they were under the influence when committing the
offence. It is noted that the 'violence' group has very
high figures for these two items - 86% and 74%.
21% of the total group reported that one or more
members of their family has served a prison sentence, and
20% reported that one or more members of their family has
received psychiatric treatment.

V. Discussion

- 57 -
This study of the characteristics of a prison
population, with particular reference to certain personality
variables, is based on a sample of 197 consecutive
admissions to Risdon Male Prison, Tasmania, during the
last quarter of 1966. It is not claimed that the sample
is representative of all prisoners who serve sentences at
Risdon. Nor can it be claimed that the findings are
applicable to all criminals in Tasmania. Farber (1941)
points out that we cannot assume that a criminal in prism
behaves in the same way as a criminal at large in the
variables in question. The prison environment may account
for some of the differences found.
The study is a beginning to the task of defining the
prison population in the State of Tasmania, and raises a
number of questions that could form the basis of further
research.
The prisoners were examined in small groups within a
week of their admission to the prison. They appeared to
accept the testing as part of the routine of admission
procedure. They were co-operative, and in a number of cases
questions put to the examiner indicated interest in what
they were doing. Nevertheless attitudes towards the
examiner and the testing programme cannot be assessed on
appearances only. The lie scale of the Eysenck Personality
Inventory and the motivational distortion scale of the
Sixteen Personality Factor Questionnaire are more objective

- 58 -
measures of test attitude - although there is some doubt
as to just what these scales are measuring.
The prisoners' mean score on the E.P.I. (Form A) lie
scale was 3.36, less than one standard deviation above the
mean of the normal standardization sample, and lower than
the means of the Australian Army groups tested by Sales
and Richardson (1968).
The prisoners' mean score on the 16 P.F. (Form C)
motivational distortion scale was 4,6 stens compared to the
general population mean of 5.5, and a mean of 5.7 for the
New Zealand group of prisoners who were given the same
test by Williamson (1966).
The test papers of a small number of prisoners (6 in
the case of the E.P.I. and the 16 P.F.) were rejected on
the grounds of doubtful motivation.
Thus there are these pointers to a co-operative
attitude on the part of most of the prisoners in the sample.
The test scores of prisoners serving their first
sentence are compared with the test scores of prisoners who
have been sentenced three or more times. These groups
might be described as "first offenders" and "recidivists",
but these descriptions are unsatisfactory for a number of
reasons. The point in time at which an offender receives
his first prison sentence depends on how successful he has
been in avoiding detection, on the sentencing .policy of
magistrates and judges, as well as on a number of other
factors. Thus the "first offender" group is far from

- 59 -
homogeneous in regard to criminal history. Then there is
the obvious point that "first offender" groups necessariLy
include the future "recidivists".
The 'three or more terms' group of the present study
is more homogeneous in regard to criminal history and
perhaps the members of this group can reasonably be
described as "recidivists". A weakness of some studies
is the failure to define the classification "recidivist".
While there are these difficulties in relation to the
composition of a "first offender" group, it could be
argued that differences that are found between "first
offenders" and "recidivists" are likely to be real differences
that would be accentuated if the potential "recidivists"
could be excluded from the "first offender" group.
A further difficulty in comparing the two groups in
relation to personality variables is the unknown effects of
the prison environment on the members of each group.
The criminal records of the prisoners are the basis of
the classification according to type of crime. The methods
employed in assigning prisoners to the 'dishonesty',
'violence' and 'sex' groups are, in some respects, arbitrary.
Limitations of the study are the small numbers in the
'violence' and 'sex' groups, and the grouping together of
the various sex crimes. With larger numbers the 'sex' group
could have been broken down into sub-groups.

Agg_Comp,(24_AAps,
The ages of the prisoners range from 16 to 60, with
• a mean age of 26.7. 61% of the sample are in the 16-25
age range, and 29 of the 197 prisoners, or 15%, are in the
16-17 age group. It is a matter of concern that boys of
16 and 17 are being sent to prison and associating with
older offenders.
The 'three or more terms' group is in the main
comprised of older men than the 'one term' group. There
is a trend for the prisoners guilty of crimes of violence
to belong to the younger age groups, while the prisoners
guilty of crimes of a sexual nature tend to belong to
older age groups.

- 61 -
dtg_ jc_agol_k_la and Li.te1:_as_Levels.
Prisoners' reports of the classes they reached at
school are sometimes inaccurate. In addition, the highest
class reached is not necessarily an indication of
educational standard, as dull children are often promoted
on age rather than on achievement. For these reasons
scores on standardized tests are a better guide to
educational level. Scores on the Word Knowledge Test and
the Army Literacy Test suggest that about 40% of the
present sample are educationally backward to a greater or
lesser degree.
Some prisoners were unable to do the tests because of
reading difficulty. Just under 10% of the prisoners are
classified as illiterate or near-illiterate from their
scores on the Army Literacy Test.

- 62 -
intellt. awn,
The Otis Test, with a preponderance of verbal items,
is not an entirely satisfactory instrument for assessing
prisoners' . intelligence. Nevertheless as a group test
it is widely used.
The mean I.Q. score for 180 of the prisoners is 89.1 2
with only slight variations from this figure for the sub-
groups. About half the prisoners scored in the 90-109 or
average range of scores. 50% scored below' 90, compared to 25% in a normal distribution. 24% of the group obtained a
score of 79 or less, and 5% obtained a score of 69 or less. The percentage of prisoners at the lower end of the scale
would rise if it is accepted that most of the prisoners
who did not do the test because of reading difficulty
would be of low intelligence.
Brown and Courtless (1968) report the results of a
recent survey in the U.S.A. Questionnaires were mailed to
207 penal institutions and IA. information WAS returned
on 90,477 inmates. The mean I.Q. was 93.2 and 9.5% were
classified as mentally retarded, obtaining an I.Q. score
of 69 or less.

PersonaZitv
The personality findings are based on the Eysenck
Personality Inventory (Form A) scores of 165 prisoners,
and the Sixteen Personality Factor Questionnaire (Form C)
scores of 162 prisoners. This means that over 30 prisoners
in the sample are excluded. A number of prisoners
excluded themselves because they were unable to read or
were very slow readers. Others have been excluded on the
basis of low scores on other tests. Data on the Army
Literacy Test suggests that a score of 7 on the reading
comprehension section represents a critical level, below
which reading ability is insufficient for even the simplest
of everyday demands. The personality questionnaires of
prisoners who failed to reach a score of 7 on this section
of the Literacy Test have been rejected. In addition the
questionnaires of prisoners who failed to reach a score of
70 I.Q. on the Otis Test have been rejected. These
rejection levels are to some extent arbitrary, and might
be considered too low.
Hundleby and Connor (1968) administered personality
inventories to 267 airmen. They report a correlation of
4. 73 between the M.P.I. extraversion scale and the 16 P.F.
(Form A) second order extraversion factor, and a correlation
of .60 between the M.P.I. neuroticism scale and the 16 Pa.
second order anxiety factor. They comment that the two
extraversion scales could be regarded as identical for most

purposes, and that M.P.I. neuroticism and 16 P.F. anxiety
have much in common, but dhow differences worth considering.
In the present study the correlations of the E.P.I.
scales with the 16 P.F. second order factors are reasonably
high - .55 for E.P.I. extraversion and 16 P.F. extraversion
and + .59 for E.P.I. neuroticism and 16 P.F. anxiety.
While the E.P.I. extraversion scores are at about the mid-
point of the scale, indicating neither an introversive or
extraversive trend for the group, the 16 P.F. scores
indicate introversion - as is the case with New Zealand
and New South Wales samples.
The component factors of the 16 P.F. second order
extraversion are factors gt (reserved - outgoing), E
(submissive - assertive), F (serious - happy-go-lucky),
H (shy - venturesome), and Q2 (group-dependent - self-
sufficient).
In the present sample, and also the New Zealand and
New South Wales samples, the score on factor H is particularly
low, indicating shyness and aloofness. It is not surprising
that criminals should be withdrawn. Many of them have known
disturbed family relationships during their childhood, and
as adults they may be withdrawn because they lack the
capacity to form or to sustain satisfactory relations with
the people around them; or they may not wish to be seen and
recognised by former acquaintances; or they may keep to
themselves to avoid detection.

- 65 -
Cattell (1957) comments that criminals obtain high
scores on factor Q2, indicating that they are self-sufficient,
independent and resourceful. The Q2 scores for the three
prisoner groups under consideration do not deviate sub-
stantially from the mean. However there are differences
between the groups, the Tasmanian prisoners scoring below
the mean, the New Zealand and New South Wales prisoners
scoring above the mean, indicating a degree of self-
sufficiency.
Statistical tests of significance have failed to
reveal any significant differences in the E.P.I. and 16 P.F.
extraversion scores of the various sub-groups, Nevertheless
there are certain trends in the scoring. The 'three or
more terms' group obtained a lower score than the lone terra'
group on the E.P.I. extraversion scale. The 16 P.F.
extraversion scores are almost identical for the two groups.
However in the New Zealand .study the habitual offenders
obtained a lower score than the first offenders on the 16
P.F. second order extraversion. These findings suggest -that
in the main recidivists may be more introverted than first offenders. Franks (1956) has suggested that the majority
of recidivists are slightly introverted in personality.
Blackler (1968) puts forward the hypothesis that
recidivism is correlated with an increasing isolation from
society.
The 'violence' group has higher scores than the
'dishonesty' and 'sex' groups on the extraversion scales of

-66-
both personality questionnaires. Looking at this group's
scores on the 16 P.F. component factors, the score on
factor E is above the mean, that is, in the direction of
assertiveness and aggressiveness. These indications that
those who commit crimes of violence against the person
are more extraverted and aggressive suggest that the tests
are sensitive to these personality differences among the
prisoners.
The prisoners obtained above average scores on both
the E.P.I. neuroticism scale and the 16 P.F. second order
anxiety factor. The 16 P.F. anxiety score is also high
for the New Zealand and New South Wales prisoners.
The component factors of the 16 P.F. second order
anxiety are factors L (trusting - suspicious), 0 (placid -
apprehensive), Q4 (relaxed . tense), C (low ego strength -
high ego strength), H (shy venturesome), and Q3 (casual - controlled).
The Tasmanian prisoners obtained a low score on
factor Q3 . indicating a casual attitude with uncertainty
and indecision, a low score on factor H . indicating shyness
and aloofness and a slightly elevated score on factor L -
indicating a suspicious attitude and a tendency towards
.paranoid thinking. These scoring trends are also present
in the New Zealand and New South Iales groups, and in
addition these groups deviate substantially from the mean
on the other three component factors of second order anxiety.

.67-
The low C score indicates low ego strength and neurotic
emotionality; the high 0 score indicates insecurity and
feelings of apprehension; the high Q4 score indicates
tension and excitability.
Because of these deviations the second order anxiety
scores are much higher for the New• Zealand and New South
Wales prisoners, suggesting that the members of these
samples are more neurotic and disturbed than the members
of the Tasmanian sample. There is a noteworthy difference
in the scores on factor C. The Tasmanian score is just
above the mean - indicating that ego strength and stability
are at about the average level, while the New Zealand and
New South Wales scores are considerably below the mean -
indicating low ego strength with neurotic instability and
emotionality. Cattell (1957) states that the C score tends
to be high in criminals as opposed to neurotics. The
difference in the scores on factor 0 is also pronounced.
The Tasmanian score is slightly below the mean . indicating
that feelings of security and confidence are at about the
average level, while the New Zealand and New South Wales scores are well above the mean - indicating feelings of insecurity and inadequacy,
Again statistical tests of significance do not reveal
any significant differences in either the E.P.I.
neuroticism scores or the 16 P.P. anxiety scores of the
sub-groups. However there is a consistent trend in the

direction of a higher level of neuroticism in the
persistent offenders. The 'three or more terms' group
obtained higher scores than the lone term' group on both
B.P.I. neuroticism and 16 P.P. anxiety. In the New Zealand
study the habitual offenders obtained a higher score than
the first offenders on the 16 P.F. second order anxiety.
Higher L scores are noted in the 'three or more terms'
group and the 'violence' group, suggesting a more pro-
nounced paranoid tendency in the persistent offender and
the offender who commits crimes of violence against the
person.
The Tasmanian, New Zealand and New South Wales prisoners
scored low on factor B of the 16 P.F., the factor measuring
mental capacity.
The 16 P.F. profile of the Tasmanian group of prisoners
is not as deviant as the profiles of the prisoner groups in
New Zealand and New South Wales, and not as deviant as the
profile presented in the I.P.A.T. Information Bulletin No. 8
(1963) for American prisoners. The Tasmanian profile
differs from the others in the scores on factors C and 0,
the Tasmanian scores indicating that ego strength and
confidence are at the average level.

.69.
Ib.p_puestiounatres
The results from the general questionnaire reveal
that 711 of the prisoners came from urban areas, 76Z work in unskilled or somi-skilled occupations and 3W were un-employed at the time of committing their last offence.
These findings, together with the test scores, suggest i
sub.' culture which might be described as a working class
area, where the educational standard is on the low side and
the unemployment level Is high. The figures on religious (denomination reveal that the
proportion of Roman Catholics drops by 111 and the proportion
of "Other Protestants" drops by 120 in moving from tho lone
term' to the 'three or more terms' group. On the other
hand there is a rise of 23'0; In the proportion of Church of
Englend prisoners in the 'three or more terms' group. It
might be postulated that greeter numbers of Roman Catholics
and members of the smaller Protestant Churches practice
their religion and that early religious training is a
deterrent to continuance in a life of crime. This is an
area that requires further investigation.
A quarter of the 'three or more terms' group had been
inmates of Ashley Home for Boys. This may mean that a
number of the boys admitted to the Home were potential
recidivists, and the Home hae been unable to effect
permanent changes in their attitudes and behaviour. This

-70-
is another area in which research is needed.
The health questionnaire reveals that 32% of the 189
prisoners interviewed stated that they had been heavy
drinkers. It is interesting to note that this figure
agrees with figures from a previous study of Tasmanian
offenders by Daunton - Fear (1967). In her study 32% of
269 convicted offenders, and 32% of 145 prisoners, were
classified as heavy drinkers on the basis of records at
the Police Department and the Probation Service. This
agreement in the findings on the two occasions may be an
indication of the truthfulness of the prisoners in answering
questions put to them by the Medical Officer and the
Medical Orderly.
In the present study the figure of 32% rises to 50%
for the 'three or more terms' group. The 'three or more
termst group has higher percentages than the tone terms
group on all items relating to drinking behaviour, suggest-
ing that recidivism may be correlated with an increasing
consumption of alcohols
54% of the prisoners stated that they were drinking just prior to committing the offence, and 46% stated that
they were "under the influence" when committing the offence.
The figures for the members of the sample belonging to the
violence sub-group are exceptionally high - 86% stating that
they were drinking, and 74% stating that they were "under
the influence".

-71-
Shupe (1954) reports on the urine alcohol concentration
found in 882 persons arrested during or immediately after
the commission of an offence in Columbus, Ohio. He regards
an alcohol concentration of.10% as a critical level, which
may be associated with the release of inhibitions. He
reports that 65% of the sample had an alcohol concentration
of at 1east.10%, and the figure for the members of the
sample who committed crimes of violence is 79%. He points
out that the figures are only for those who were caught at
their crime, and so may be misleading.
Grigsley (1963) studied the relationship between
alcohol and crime at the Raiford State Prison, Ohio. His
findings are based on a sample of 351 prisoners. He gives
the prisoner version and the official version of the
percentage of the prisoners who were drinking, drunk, or
under the influence of alcohol at the time they committed
their offences. The prisoners version is 38.7%; the
official version is 29.9%.
Hlackler (1968) reports on a sample of English prisoners, comprising 438 first sentence men and 242 second sentence men. 25% of the first group, and 32% of the second group claimed that the offence was• committed under the influence of drink or drugs.
There is probably a tendency for prisoners to overstate
the amount of alcohol consumed and the effects it had on
their behaviour at the time the offence was committed,

believing that this lessens their responsibility for
their actions. The Raiford figures suggest that thi
tendency may not be pronounced. The extent to which the ,
figures from the present study are an overstatement is not
known. The figures are very high, and a careful study of
this aspect of criminal behaviour is needed.
There are several items in the health questionnaire
that may have bearing on the important question of the
incidence of brain damage among prisoners. The items are
those that deal with blackouts, fits, memory loss, boxing
experience, involvement in road accidents, concussion,
"head injury, heavy drinking and alcoholism. The 'three or
more terms' has higher percentages than the lone term'
group on all these items, suggesting that recidivism may
be correlated with an increasing incidence of brain damage.

VI1 Summary

- 73 -
In order, to investigate the personality
characteristics of Tasmanian prisoners a sample of 197
prisoners at Risdon Male Prison was studied by means of
psychological tests and two questionnaires.
The ages of the prisoners ranged from 16 to 60,. with
close on two-thirds in the 16-25 age group. The Otis
Higher Intelligence Test was administered to 180 of the
prisoners. The mean I.Q. was 89.1, with 5% of the group scoring at the mentally defective level, that is, scoring
69 or less. It is suggested that this figure would be
nearer to 10% if the prisoners who were unable to read had
been assessed with an alternative test. Tests of
educational level revealed that about 40% of the prisoners
were educationally backward, and 10% were illiterate or
near-illiterate. 76% of the sample worked in unskilled or
semi-skilled occupations.
Two personality tests were used - the Eysenck
Personality Inventory (Form A) and the Sixteen Personality
Factor Questionnaire (Form C). There is substantial agree:
ment in the findings from the two tests. There is no
support for the contention that prisoners are extraverted
in personality, the E.P.I. indicating neither. an. introversive
or an extraversive trend for the group, and the 16 P.F.
indicating introversion. The E.P.I. indicates a slightly
above average level of neuroticism and the 16 P.F. indicates
a slightly above average level of anxiety in this group of

- 74 ,-
prisoners.
The 16 P.F. profile for the group reveals aloofness
and suspicion, and marked uncertainty and indecision.
Neurotic features are not as pronounced as in the 16 P.F.
p rofiles of some other prisoner groups.
There are no significant differences in the intelligence
and personality test scores of the lone prison term' and
'three or more prison terms' groups, or in the scores of
the groups based on type of crime; certain trends in the
scoring are noted.
The study suggests that recidivism may be correlated
with:-
1. An increasing isolation from society.
2. An increasing degree of neuroticism..
3. An increasing consumption of alcohol.
4. An increasing incidence of brain damage.

APPENDIX A
.G.a , .ica--t---1 0 Offences
- Using the List of Offences
in.—thft-126-6=6Z. I..RMt—L)fle Controller' of Prisons

- 75 -
Crimes of plishonests,
Stealing.
Break a building other than a dwelling house.
Unlawfully use motor vehicle.
False pretences.
Housebreaking.
Uttering.
Imposition.
Forgery.
Receiving.
Burglary.
Unlawful possession.
Robbery with violence
Attempt to steal.
Fraud.
Attempted break a building other than a dwelling house.
Robbery.
Crimes of Violence
Assault.
Assault a police officer.
Assault a female.
Robbery with violence.
Manslaughter.
Unlawful act intended to cause bodily harm.

- 76 -
• Sex Crimes
Indecent assault.
Indecent exposure.
Indecent practices between male persons.
Defilement.
Rape.
Unnatural carnal knowledge.
Assault a female child with indecent intent.
Carnal knowledge.

APPENDIX B
Frequen cy rone
Scores on the Word Xnowledire
.141§1.2.-Aht-W-taga.-1._.0_1estd tjie Otis Intel.J.j.gence Test

- 77 -
A.C.E.R. Word Knowledge Test (Adult Form B) -
Distribution of Scores for Different Groups of Prisoners -
Classified According to the Number of Prison Terms. ,
Range of Scores (centile rank)
.
One Term (N=102)
,
Two Terms (N=20)
.
1 Three or more Terms (N=60)
.
Total Group (N=182)
91 - 100 1 - -,
1
81- 90 7 1 6 14
71 - 80 1 1 2 4
61- 70 4 2 5 11
51- 60 13 2 5 20
41- 50 8 1 4 13
31- 40 12 1 10 23
21- 30 11 1 5 17
11- 20 23 4 6 33
1- 10 22 7 17 46
NOTE: There are no scores for 9 subjects who were unable to read,
2 who had language difficulty, and 4 who were poorly
motivated.

-78--
A.C.E.R. Word Knowledge Test (Adult Form B) -
Distribution of Scores for Different Groups of Prisoners
Classified According to Type of Crime.
Range of Scores (centile ranks)
Dis- honesty (N=98)
Vio- lence (N=21)
Sex (N=17)
Mis- cellaneous (N=46)
Total Group (N=182)
, . . . -
91 - 100 1 - - 1
81- 90 6 2 2 . 4 14
71 - 80 2 1 - 1 4
61 - 70 4 3 2 2 11
51 60 13 1 - 6 20.
41 - 50 . 7 1 2 3 13
31 - 40 9 3 1 10 23
21 - 30 7 2 3 5 17
11 - 20 21 - 5 3 4 33
1-10 28 3 4 11 46
i
NOTE: There are no scores for 9 subjects who were unable to
read, 2 who had language difficulty, and 4 who were
poorly motivated,

- 79 -
Army Literacy Test (Form LB) - Distribution of Scores for Different
Groups of Prisoners -
Classified According to the Number of Prison Terms.
•
One Term (g=107)
Two Terms (N=23)
Three or More Terms (N=62)
Total Group (g=192)
S 66 13 40 . 119
EB 32 5 17 54
NI 5 3 4 12
I 4 2 1 7
. .
S - satisfactory
EB - educationally backward
NI - near-illiterate
. I - illiterate
.NOTE: There are no scores for 2 subjects who had language
difficulty, and 3 who were poorly motivated.

- 80 -
Army Literacy Test (Form LB) - Distribution of Scores for Different
Groups of Prisoners -
Classified According to Type of Crime.
Die- honesty (N=104)
Violence (N=23)
Sex (N-19)
. .
Miscell- aneous (N=46)
Total Group (N=192)
S 60 16 10 33 119
EB 31 4 7 12 54
NI 8 1 2 1 12
I 5 2 - - 7
- satisfactory
EB
-
educationally backward
NI near-illiterate
- illiterate
NOTE: There are no scores for 2 subjects who had language
difficulty, and 3 who were poorly motivated.

- 81 -
Otis Higher Intelligence Test (Form C) - Distribution of Scores for
Different Groups of Prisoners -
Classified According to the Number of Prison Terms.
Range of Scores (I.Q.'s)
One Term (N=100) .
Two Terms (N=20) .
Three or More Terms (N=60) :
- Total Group (N=180)
. , .
120-129 1 - -
110-119 4 1 1 6
100-109 19 3 9 31
90-99 25 4 23 52
80-89 26 7 13 46
70-79 20 4 11 35
60-69 5 1 3 9
NOTE: 21 subjects at the low end of the scale are represented by
extrapolated scores.
There are no scores for 11 subjects who had reading difficulty,
2 who had language difficulty, and 4 who were poorly motivated.

- 82 -
Otis Higher Intelligence Test (Form C) - Distribution of Scores
for Different Groups of Prisoners - Classified According to Type
of Crime.
Range of Scores (I.Q'EO
Dishonesty
(N=96)
Violence
(N=20)
w Sex
(N=18)
Miscellan- eous (N=46)
%
Total Group (N=180)
120-129 - - - 1 1
110-119 3 1 - 2 6
100-109 17 5 3 6 31
90-99 21 6 3 22 52
80-89 28 4 9 5 46
70-79 21 4 3 7 35
60-69 6 - - 3 9
Note: 21 subjects at the low end of the scale are
represented by extrapolated scores.
There are no scores for 11 subjects who had
reading difficulty, 2 who had language difficulty,
and 4 who were poorly motivated.

APPENDIX C
WILISA-EUMMALILLIMIMIQU and Sixteen_personality)Factor
992fitionnaXre - Means and
StangAILD2212112M2

- 83 -
Eysenck Personality Inventory (Form A) - Means and Standard
Deviations for Different Groups of Prisoners - Classified
According to the Number of Prison Terms.
One Term
(N = 94)
Two Terms
(N = 19)
Three or more Terms al = 52)
Total Group (N = 165)
E M 13.17 11.42 12.50 12.76 S.D. 4.26 3.82 3.96 4.16
N M 9.81 ' 12.26 11.22 10.53 S.D. 5.19 4.29 5.65 5.32
L M 3.59 3.21 3.02 3.36 S.D. 1.86 1.44 1.91 1.85
extraversion
neutoticism
lie scale
Note: The questionnaire results of 9 subjects who failed
to reach a score of 7 on the reading comprehension
section of the Literacy Test or a score of 70 I.Q.
on the Otis Test, are excluded.
There are no scores for 15 subjects who had reading
difficulty, 2 who had language difficulty, and 6
who were poorly motivated.

-84-
Eysenck Personality Inventory (Form A) - Means and Standard
Deviations for Different Groups of Prisoners Classified
According to Type of Crime.
Dishonesty
(N=89)
Violence
(N=19)
Sex
(N=16)
Miscell- aneous (N=41)
Total Group (N=165)
E M 12.93 13.84 12.69 11.90 12.76 S.D. 3.89 3.87 4.47 4.55 4.16
N M 10.73 10.37 10.44 10.22 10.53 S.D. 5.40 4.09 4.36 5.37 5.32
L M 3.44 2.90 3.75 3.27 3.36 S.D. 1.93 1.59 1.30 1.91 1.85
extraversion
neuroticism
lie scale
Note: The questionnaire results of 9 subjects who failed to
reach a score of 7 on the reading comprehension section
of the Literacy Test, or a score of 70 I.Q. on the
Otis Test, are excluded.
There are no scores for 15 subjects who had reading
difficulty, 2 who had language difficulty, and 6
who were poorly motivated.

-85 -
Sixteen Personality Factor Questionnaire (Form C) - Means and Standard Deviations for Different Groups of Prisoners - Classified according to the Number of Prison Terns..
One Term
(N=94)
Two Terms
(N = 18)
Three or more Terms (N = 50)
Total Group (N = 162)
S.D. M S.D. -
M S.D. M S.D.
• •
•
i-Iiv in
t 421
P
tg W
HA
Z
z 0
0
00
0'z ca .4c
4.8 2.5 , 4.2 1.9 - 4.5 2.3 4.7 2.5
4.2 1.8 4.1 1.6 4.0 1.7 4.1 1.7
5.9 2.8 5.9 2.5 5.5 2.2 5.8 2.3
5.0 2.0 4.8 1.2 5.7 1.9 5.2 1.9
4.9 2.2 3.3 1.6 4.6 2.3 4.7 2.2
5.2 2.3 5.3 1.6 5.0 2.2 5.1 2.2
3.9 1.5 3.2 1.6 3.8 2.1 3.8 1.7
5.2 2.0 5.0 2.1 5.1 • 2.2 5.2 2.1
6.4 2.1 7.6 2.1 7.3 2.5 6.7 2.3
4.6 2.0 5.6 2.1 6.1 2.0 5.2 2.1
5.9 2.4 5.9 2.1 6.3 1.9 6.0 2.2
6.0 2.2 5.4 1.9 5.0 2.4 5.1 2.2
4.7 2.0 5.3 1.7 5.0 2.1 •4.8 2.0
4.9 2.4 4.6 2.4 5.1 2.2 4.9 2.3
3.9 1.8 2.6 1.9 3.4 1.8 3.6 1.9
6.2 1.9 7.1 1.4 6.6 2.0 6.4 1.9
4.8 2.1 4.7 1.7 •4.2 2.5 4.6 2.2
4.4 1.8 3.3 1.4 4.3 2.1 4.2 1.9
6.4 1.7 7.2 1.7 6.7 1.7 6.6 1.7
M.D. motivational distortion scale.
EXT. second order extraversion.
ANX. second order anxiety.

- 86 -
Note: The questionnaire results of 5 subjects who failed
to reach a score of 7 on the reading comprehension
section of the Literacy Test, or a score of 70 I.Q.
on the Otis Test, are excluded.
There are no scores for 22 subjects who had reading
difficulty, 2 who had language difficulty, and 6
Who were poorly motivated.
(The figure of 22 includes those who because of
slowness, could not complete the test in the time
available).

-87 -
Sixteen Personality Factor Questionnaire (Form C) - Means and Standard Deviations for Different Groups of Prisoners - Classified according to Type of Crime.
. ____
Die- honesty (N=87)
Violence
(N = 19)
Sex
(N=16)
Miscell- aneous (N = 40)
. Total Group (N=162)
[
44 GO
U
C s3
r. 0 x t-I .4 "z z o
B.' c'! .
_
M •
S.D. M S.D. M S.D. M S.D. M S.D.
'4.6 2.4 5.5. 2.6 4.8 2.3 • 4.4 2.2 4.7 2.5
4.1 1.8 3.9 1.5 3.8 1.6 4.4 1.6 4.1 1.7
5.8 2.4 5.1 2.0 5.5 2.2 6.1 2.3 5.8 2.3
5.3 1.9 6.2 1.8 4.4 1.7 4.8 2.0 5.2 1.9
4.6 1.9 4.9 2.4 4.4 2.3 4.6 2.6 4.7 2.2
5.4 3.2 4.3 2.3 5.4 2.0 4.9 2.2 5.1 2.2
3.8 1.7 4.4 2.1 3.6 1.9 3.6 1.4 3.8 1.7
5.4 2.0 4.8 •2.4 4.8 2.2 5.1 1.9 5.2 2.1
6.6 2.2 7.6 2.0 6.4 2.7 6.8 2.2 6.7 2.3
5.2 2.2 5.7 1.9 5.5 1.8 4.8 2.2 5.2 2.1
5.8 2.2 6.5 2.6 5.1 1.9 6.6 2.0 6.0 2.2
5.2 2.2 4.5 2.4 4.9 2.2 5.3 2.3 5.1 2.2
5.0 2.0 4.7 1.9 4.2 1.4 4.8 2.1 4.8 2.0
4.8 2.3 5.2 2.5 4.8 2.4 5.1 2.3 4.9 2.3
3.9 1.8 3.1 1.6 3.2 1.9 3.4 1.8 3.6 1.9
6.4 1.9 6.3 1.9 6.3 1.9 6.6 1.8 6.4 1.9
4.8 2.4 3.6 2.1 5.1 1.9 4.5 1.8 4.6 2.2
4.2 1.7 5.0 2.4 3.9 2.1 3.9 1.9 4.2 1.9
6.6 1.7 6.5 1.6 6.5 2.0 6.7 1.4 6.6 1.7
4
M.D. motivational distortion scale.
EXT. second order extraversion.
ANX. second order anxiety.

-88 -
Note:- The questionnaire results of 5 subjects who
failed to reach a score of 7 on the reading
comprehension section of the Literacy Test,
or a score of 70 I.Q. on the Otis Test, are
excluded.
There are no scores for 22 subjects who had
reading difficulty, 2 who had language
difficulty, and 6 who were poorly motivated.
(The figure of 22 includes those who, because
of slowness, could not complete the test in
the time available).

The General Questionnaire

- 89 -
SURNAME Christian Names
Date of birth Age years.
Date
Father's occupation .
Your occupation
How Many brothers and sisters did you have? .•••
Where did you came in the family?
Were your parents separated? ,
How old were you when they separated? .•
Who looked after you when you were young (mother, step-mother, foster. mother, State Home) ?
Were you ever sent to Wybra Hall?
Were you ever sent to Ashley Home?
Are you married?
When were you married (year) ?
No. of children?
Where is your home now (suburb or town) ?
Where were you living at the time you committed the offence that led to this imprisonment (suburb or town) ? 4.•
Did you have a job at the time? #0000
How long had you been out of work?
What is your religion?
Are you a church-goer? • •

APPENDIX A
The lieakth Questionnaire

- 90 -
SURNAME Christian Names
Date of birth Age years.
Date
HEALTH
Are you in good health? .•••..
What serious illnesses have you had? ••••.
Do you suffer from blackouts? OOOOOOOOOO OOO •.•••••••••.•".
fits of any kind?
loss of memory?
stomach ulcers?
skin conditions?
•• •
•I■
asthma? •...
bed-wetting? • •99
any other disability? •...
Have you done any boxing? •••.
Number of motor car accidents .•... Number of accidents when you were the driver •...
Number of motor bike accidents 400
Number of accidents when you were the driver •OOOOO
Number of times you have been knocked unconscious for any reason
How long were you unconscious?
1)
2)
3 )

-91.-
How long were you in hospital and did you havee heed' operation?
1)
2)
3) Are there any lasting results from
head injury? OOOOOOOOOOOOOOOOOOOOOOOOOOO
travo you had an examination for a nervous 11,4 J'1 , t,J condition ("bad nerves") ?
When? Where? t4
Have you had treatment for a nervous condition?
1j \I
When? Where? Have you been a heavy drinker Has your home life been affected
by your drinking? OO . Has your work been affected by
your drinking? ,
Have you had "blackouts" when drinking?
• •
Do you regard yourself as an alcoholic?
have you had treatment for alcoholism? When? • Where?
Single, married, widowed, separated v divorced or de-facto wife?
Membeks of gamily (father, mother, brother, sister, Wife, children) who have,had:- 1) A gaol O gentence,., 2) Treatment for a nervous condition
3) Treatment for alcoholism
7 I 1
t

-92
Were you alone when you committed the offence that led to this imprisonment?
Were you drinking just before you committed the offence?
, . . Or drinking within an hour of committing the offence? ,
Or drinking within two hours of committing the offence?
Were you ', under the influence" when you committed the offence?
How many cigarettes did you smoke per day?
# • 1; • • • • •
• • • or, •• • •• • i •

Bibliography

93 -
Andry, R. G. The Short-Term Priponer.
London : Stevens, 1963.
Bartholemew, A. A. Some comparative Australian
data for the Maadsley Personality Inventory.
Aust. J. Psyshol., 1963, 15, 46-51.
Blackler, C. Primary recidivism in adult men :
differences between men on first and second
prison sentence. prit. J. Crimingl.,
1968, 8, 130-167.
Brown, B.S. and Courtless, T. F. The mentally
retarded in penal and correctional institutions.
494 L_Egychiato, 1968, 124, 1164-1170.
Cattell, R. B. he Scientilig.AnalYsis of Personality.
Harmondsworth, Middlesex : Penguin Books, 1965.
Cattell, R. B. and Eber t H. W. Handbook for the
Alxteeng_ex uestionnaire,
Esamg_64.ja_aad_g. Champaign, Ill. : Institute for
Personality and Ability Testing, 1957 (with 1964 supplementation).
Cattell, R. B. and Morony, J. H. The use of the 16 P.F. in distinguishing homosexuals, normals and general
criminals. L....22=6",,ta_y_pac1iol., 1962, 26, 531-5410.

- 94-
Daunton-Fear, M. DASJNEIMIEUMALJDnial0JuLJIL-LNELEOLD. Hobart : Univers. of Tasmania, 1967.
Eysenck, H. J. Manual of the Maudsley Personality
Inventory. London : Univers. London Press, 1959.
Eysenck, H. J. Crime and Personality.
London : Routledge and Kogan Paul, 1964,
Eysenck, H. J. and Eysenek, S.B.G. Manual of the
EYfflenck Personality Inventory. London : Univers.
London Press, 1964.
Farber, M. L. Prison research : techniques and methods.
soc. _Psycho's, 1941, 14, 295-310.
Franks, C. M. Recidivism, psychopathy, and personality.
datti..2.j222102.2 1956, 6 192-201.
Grigsley, S. E. The Raiford study : alcohol and crime.
J. crim. Law Crimiriol. police acis, 1963, 54,-296-306.
Hundleby, J. D. and Connor, W. H. Interrelationships
between personality inventories : the 16
the M.M.P.I., and the M.P.I. J. consult. clin.
josych4., 1968, 32, 152-157.
Institute for Personality and Ability Testing. jiandboolc &implement for Form C of_thezzAten_zez_Lsa.sonai Factor GuestA,onnaire. Champaign, Ill., 1956.

-95
Institute for Personality and Ability Testing. Summary
6
D:t0 t e C in ca Are
I A.T. nfo t on
pvIletin Number 8. Champaign, Ill., 1963.
Knowles, J.B. and Kreitman, N. The Eysenck Personality
• Inventory : some considerations. palt. JA PsYchiat4,
1965, 111, 755-759.
Levy, S. and Kennard, M. A study of the electroencephalogram
as related to personality structure in a group of
inmates of a state penitentiary. Ami,l,Eughlgi.,
1953, 109, 832-839.
Marcus, B. Intelligence, criminality and the expectation
of recidivism. Atilz.j."22,11112.., 1955, 6, 147-151.
Panton, J. H. M.M.P.I. profile configurations among
crime classification groups. 3: cm. PsYcha.,
1958, 14, 305-308. .
Robinson, C.B. 1 Patten, J.W. and Kerr, W.S. A psychiatric
assessment of criminal offenders. MgAlgArt-kaa-km
1965, 5, 140-146.
Salas, A.G. and Richardson, J.F. Some Australian data on
Forms A and B of the E.P.I. Aupt t J. Psychol.,
1968, 20, 11-13.
Shupe, L. M. Alcohol and crime.
police Sc., 1954, 44, 661-664.
Williamson, J.R. Habitual Offenders. Unpublished M.A.
Thesis, Victoria Univers., Wellington 1966.