the permanent textbook hypothesis: school inputs and...
TRANSCRIPT
1
The Permanent Textbook Hypothesis: School Inputs and Student Outcomes in Sierra Leone
Shwetlena Sabarwal* David Evans
Anastasia Marshak
October 2013
Abstract
The randomized evaluation of a textbook provision program in Sierra Leone demonstrates how volatility in the flow of school inputs exacerbates smoothing in consumption (of those inputs) by school administrators, which can result in low current utilization for student learning. Public textbook provision to schools had modest impacts on teacher behavior but no impacts on student performance. In many treatment schools, student access to textbooks did not increase because a large majority of the books were stored rather than distributed to students. At the same time, the propensity to save books was positively correlated with uncertainty on the part of head-teachers regarding government transfers. We hypothesize that schools that have high uncertainty with respect to future transfers are more likely to store a proportion of current transfers with a view towards smoothing consumption. The results suggest that reducing uncertainty in school input flows could result in more effective current use of inputs, and that public policy programs must take forward-looking behavior among intermediate actors into account.
* World Bank; [email protected] World Bank; [email protected] Tufts University; [email protected]
JEL Codes: O15, I21, I28, J13 Acknowledgements: The team is extremely grateful for the support of the World Bank’s the Education Program Development Fund, which provided financing. Keiko Inoue co-designed the evaluation, and Eunice Yaa Brimfah Ackwerh supervised implementation of the intervention. The team benefitted from comments and guidance from Deon Filmer, James Habyarimana, Arianna Legovini, Muna Meky, Jee-Peng Tan, and participants in seminars at Brigham Young University and the World Bank.

2
1. Introduction
In the macroeconomic literature, volatility in aid flows has been linked to reductions in
economic growth (Kodama 2012) and significant decreases in overall welfare (Arellano,
et al. 2009). This paper explores a similar pattern within one sector, education, at a
micro level. We provide evidence that unpredictable variability in flows of school inputs
interacts with the desire for actors (in this case, school administrators) to smooth over
time, resulting in extremely low utilization of those inputs in student learning.
In education, in the developing world, a growing body of empirical evidence shows that
public provision of school inputs does not always lead to improved learning outcomes.
In fact, there is very wide variation in estimated coefficients of school inputs on test
scores (Glewwe, et al. 2011, McEwan 2013, Krishnaratne, White and Carpenter 2013).
Naturally, we want to know why this should be so, especially with regard to inputs like
textbooks which are both demonstrably scarce in developing country public schools and
at the same time believed to be vital inputs in the education production function. This
line of investigation is consistent with the growing emphasis on opening the black box in
randomized impact evaluations (Deaton 2010, Pawson and Tiley 1997).
Clearly, a failure to detect the impact of input provision on student learning could arise
due to several reasons. It could be because the inputs, due to their inherent nature or
their quality, are ineffective, as a result of which their impact on student performance is
zero. For instance, a randomized evaluation from Kenya shows that providing textbooks
did not raise average test scores, possibly because textbooks are written in English
which is a third language for most students – making it hard for them to use textbooks
effectively (Glewwe, Kremer and Moulin 2008).
Lack of impacts from input provision could also be because households (or other actors,
such as schools) re-optimize their allocation of resources when receiving an input. For
example, Das et al (2011) show in both Zambia and India that when school grants for
student learning inputs were anticipated by households, the households compensated
by reducing private education spending. Alternatively, a study from Kenya shows that
insecticide-treated bed-nets distributed to children under age 5 for use over their beds
were actually being used for fishing and for drying fish in Lake Victoria (Minakawa et al
2008). These and other studies provide strong evidence that behavioral responses of
agents to public programs can strongly mitigate program impacts on ultimate
beneficiaries.

3
In this paper we present evidence of another scenario where the behavioral response of
intermediate agents to a public program strongly influenced program outcomes on
beneficiaries. In this case the agents in question are school administrators, an often
neglected set of actors in empirical work. As in other studies, the behavioral response
observed was not anticipated in program design; leading to the observed divergence
between policy effects and hypothesized production function parameters.
Analyzing the results from a randomized evaluation of a textbook provision program to
schools, we show that the program failed to have any impacts on student outcomes
(attendance or performance) because few textbooks reached the students. Instead,
publically provided textbooks were stored by school administrators.
Why should publicly provided school inputs to schools be stored instead of being
distributed to students? We analyze the correlates of book storage and find that head-
teachers who exhibit high uncertainty with respect to government transfers of
textbooks are significantly more likely to store them. This behavior makes sense from
the perspective of consumption theory: Consumption of current government transfers
will be dictated in part by expectations regarding future transfers. If current transfers
are seen as a one-time shock (or transitory) then their impact on current consumption
will be limited. In other words, when there is uncertainty, school administrators have
incentives to store current transfers to smooth consumption overtime, particularly for
inputs like school books that depreciate quickly when used.
As mentioned earlier, this paper sheds light on the importance of behavioral responses
of intermediate agents like school administrators in determining the overall impacts of
public input provision programs to schools and how unpredictable volatility in aid flows
exacerbates those responses. In particular, it provides empirical basis to question the
assumption that publically provided inputs are deployed effectively within a short time
period. It also puts at center stage the question about how future uncertainty regarding
government transfers and policies impacts the current behavior of service providers.
On the whole, we hope that this analysis adds to our understanding of why such input
provision programs might have been less effective than expected. Broadly speaking, our
results are consistent with the premise that mere input provision to schools while
ignoring the incentive structure within schools is unlikely to yield much in terms of gains
to student learning outcomes.
4
The remainder of the paper is structured as follows: Section 2 provides a broad outline
of the education system in Sierra Leone, and Section 3 lays out the experimental design.
Statistics from baseline, actual implementation of the program, and empirical strategy
are summarized in Sections 4, 5, and 6. Section 7 presents the overall impacts of the
program. These results are discussed in sections 8, 9, and 10. Finally, conclusions and
policy implications from this empirical work are laid out in Section 11.
2. Context
Sierra Leone has recently emerged from a brutal civil war that lasted a decade (1991–
2002). The civil war severely impacted the country’s education system leading to large-
scale devastation of school infrastructure, severe shortages of teaching materials,
overcrowding in many classrooms in safer areas, displacement of teachers, frequent
disruptions of schooling, psychological trauma among children, poor learning outcomes,
weakened institutional capacity to manage the system, and a serious lack of information
and data to plan service provision (World Bank 2007).The education sector is now in the
process of being rehabilitated.
The Education Act of 2004 stipulates universal basic education - 6 years of primary
school and 3 years of junior secondary school. According to the 2008 EMIS there are
around 5000+ primary schools in Sierra Leone, of which private schools make up a very
small portion (less than 5 percent). Enrollments doubled in primary school between
2001/02 and 2004/05 (World Bank 2007). The gross completion ratio (GCR) in primary
education was 65 percent in 2004/05 (World Bank 2007).
Several challenges on provision of basic education, many of them supply-related,
persist. Currently, standard six pupils from 5,000+ primary schools compete for places in
fewer than 300 junior secondary schools. Children (particularly girls) from the poorest
households and those from rural areas and the Northern Region are lagging behind.
Although the government abolished school fees, primary education is still not
completely free because many schools impose a variety of charges on their students.
Our baseline data (see Section 3.2 for more details) shows that around 28 percent of the
schools charge some kind of fees from parents. As many as 70 percent of the schools
received subsidy payment for school fee from the government while 28 percent of the
schools also receive support from the community, but there is no systematic correlation
between the two sources of support – one is not a substitute for the other.

5
Most schools in Sierra Leone have very poor classroom conditions and still lack sufficient
learning materials and adequately qualified teachers (World Bank 2007). In terms of
learning materials, the official policy of the Sierra Leone government is to provide
without charge primary grade textbooks in the four core subjects (a set) and to reach a
student-textbook ratio of 1:1. The government and development partners have made
efforts to provide textbooks, but significant challenges remain. The Poverty Reduction
Strategy Paper (PRSP; Government of Sierra Leone 2005) estimated that, in 2004, a ratio
of 1 set of textbooks to 3 pupils in urban areas and 1 set to 6 pupils in rural areas had
been reached (World Bank 2007).
Also note that with the Local Government Act, 2004, the Government of Sierra Leone
commenced a national decentralization process and primary education stands among
the first functions scheduled to devolve to the Local Councils. Under the policy of
decentralization, local councils will have full control and supervision of all primary
schools including such functions as the recruitment and payment of teachers, the
provision of textbooks and teaching materials, and the rehabilitation and construction
of schools. The decentralization process for education began with the 2005/06 school
year and was expected to be complete by 2008.
Our baseline data (see Section 3.2 for more details) show that the process of
decentralization is still ongoing in the education sector of Sierra Leone. District
Education Officers (DEO; centralized system) and local council officers (LC; decentralized
system) are both active, leading to some confusion on the exact chain of command and
roles and responsibilities of different agents.
3. Experimental Design
3.1 The Intervention
This paper seeks to evaluate a basic textbook distribution program of the Government
of Sierra Leone in the year 2008. Under the program, textbooks are provided by the
Ministry of Education, Youth, and Sports (MEYS) to primary schools based on student
enrollment numbers as captured by the EMIS data. The actual transportation of books
from central warehouses to schools is undertaken by local service providers who are
competitively selected by the Government.

6
The main objective of the textbook distribution program was to provide a set of core
textbooks for every child1 in the treatment schools.
There are just over 5,000 primary schools in Sierra Leone, but the impact evaluation (IE)
only focuses on schools that were registered with MEYS as having up to grade 6 (when
the National Primary School Examination is taken). The program included government,
government assisted, and community schools, but not private schools. The IE focused on
standards 4 and 5, as these are the standards by which education is principally in English
(the language of the textbooks).
3.2 Sampling
The IE relies on a randomized experimental design using a two-step process. First, 4 out
of 19 local councils, stratified at the region level, were randomly selected. All 19 local
councils were interested in participating, thus one council from each of Sierra Leone’s
four regions was chosen: Kailahun (Eastern region), Kambia (Northern region), Pujehun
(Southern region), and Western Urban and Western Rural (both districts from the
Western region agreed to function as one).
Within the randomly selected councils, 360 program schools were randomly selected
using the Education Management Information System (EMIS) data. From the universe
of schools in these councils, schools that were already being targeted for textbook
interventions by NGOs were eliminated. Also, to avoid providing textbooks to schools
that already have many, this project included only schools which had a 3:1 student-
textbook ratio or higher. From the reduced sample, 90 schools were selected in each
district (except for Western Rural and Western Urban which together amounted to 90
schools).
Within the district, sample schools were assigned equal probability to one of three
categories (30 schools in each category in each district): receiving textbooks, receiving
textbooks and teacher training, and control. However, due to multiple implementation
challenges the teacher training component was not undertaken. Therefore, for the IE,
we are left with schools that received textbooks (treatment schools) and schools that
did not receive anything (control schools).
Baseline data was captured on 340 schools (out of a total of 360). The 20 schools that
were not included in the sample were mainly due to either the inability of enumerators
1 A set of core textbooks is made up of English, Mathematics, Integrated Science and Social Studies
textbooks.

7
to access the school due to poor road conditions or flooded rivers. For a small portion
of these schools, the enumerators were able to access the location, but there was no
school at the premises. This could be partly due to the large share of ‘ghost schools’ in
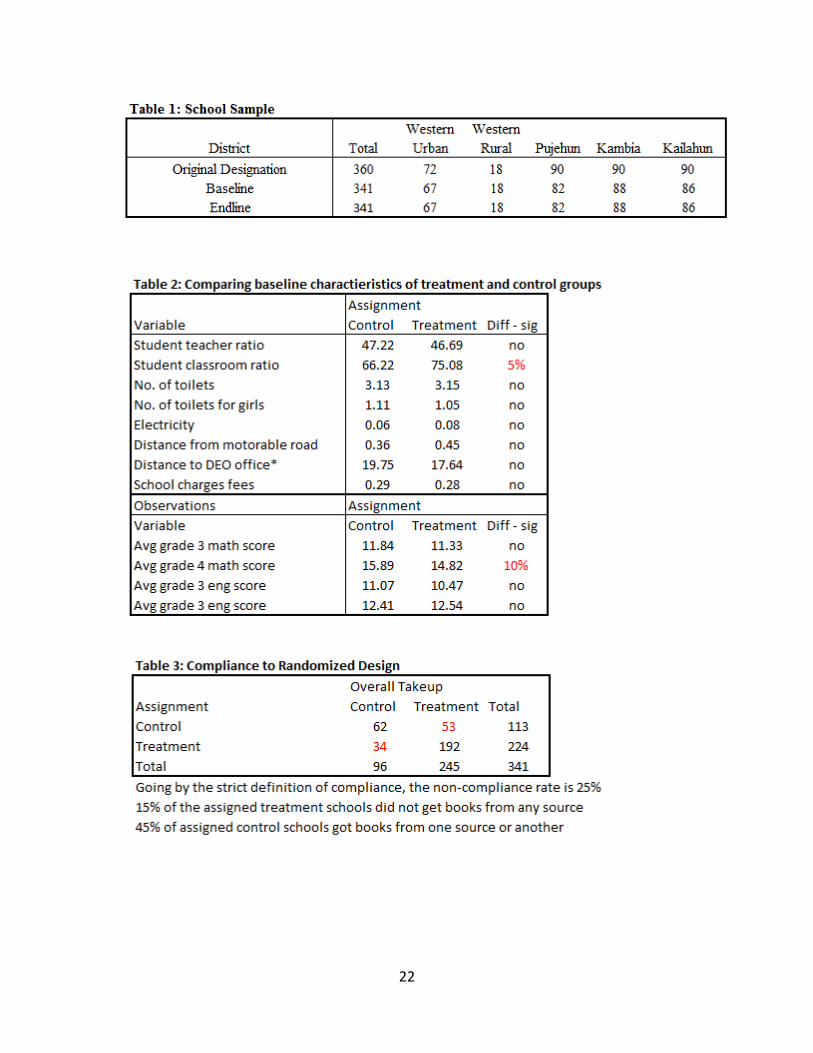
Sierra Leone.2 The total number of schools for which data is available at baseline and
endline, by district, is summarized in Table 1.
On contrasting baseline characteristics for treatment and control schools, we find the
sample balanced for the most part (Table 2).
3.3 Data
Baseline data collection took place in May 2008 and endline in December 2009. Data
collection included head-teacher survey, teacher survey, student survey, and student
exams.
The data on the school as a whole were obtained through a comprehensive interview
with the head teacher. This includes information observed (like the condition of the
buildings, the number of classrooms, and other facilities) and other information
obtained from the head teacher about the school finances, record keeping, community
participation, management practices, etc. Data was also collected from teachers for
grades 4 and 5, through teacher interviews.
One hundred students were selected randomly at each school and were given a written
numeracy and literacy test. At baseline (May 2008) the student tests were administered
to students in Grades 3 and 4 and at endline the same tests were administered again to
the same cohort, which was now in Grades 5 and 6 (Dec 2009). Although a large number
of students were tested - around 17,000 at baseline and 15,000 at endline, we were
able to definitively match only about 5,300 students from baseline to endline.
Therefore, to measure impacts on student performance, only endline scores are used.
We do report results for change in score of those students who were matched for
baseline and endline, but since there is a possibility of selective attrition, these results
are not very reliable.
2 In 2008 the Government of Sierra Leone did a verification exercise and discovered a large proportion of ‘ghost’ teachers and schools – teachers and schools that do not exist but are used to collect payroll on behalf of corrupt principals and officials. Over 1,000 ‘ghost’ teachers were discovered alone. http://hello.news352.lu/edito-38098-sierra-leone-axes-1000-ghost-teachers.html?p=movies.

8
At endline, we also interview students from Grades 4 and 5, to derive a picture of
textbook use (note that the books distributed by the program were for Grades 4 and 5).
4. Education Service Delivery in Sierra Leone (notes from baseline)
One issue that emerges from our baseline survey in the selected regions (Kailahun,
Kambia, Pujehun, Western Urban and Western Rural) is the stark supply-side
disadvantage that remote areas face with respect to education service delivery.
Pujehun, which is one of the more remote districts in Sierra Leone, is significantly worse
off compared to the other regions in terms of the supply of schooling inputs. In this
region, less than 50 percent of all schools were considered in good condition, with
almost 20 percent falling under the category ‘no roof, walls are heavily damaged, needs
complete rehabilitation.’ Further, almost one-third of the schools do not have a working
toilet.
During the baseline survey (May 2008), unannounced classroom visits were carried out
in Grade 4 and 5 classrooms. Out of 828 such classrooms, teachers were found to be
actively teaching in 54 percent of cases. If we define teaching activities more broadly
(including organizing of class, setting of agenda, or disciplining of students) then the
corresponding number was 77 percent. Once again, the remote district performed
worse than others in terms of service delivery. Only half of all teachers were teaching or
engaged in teaching related activity in Pujehun, while the corresponding numbers for
some other districts were 90 percent.
As a part of baseline data collection, students in Grades 3 (8740 students) and 4 (8815
students) were given multiple-choice Mathematics and English tests. For mathematics,
we find that 49 percent of Grade 3 students and 32 percent of Grade 4 students could
not answer a single digit subtraction question (such as “Calculate 9-4”). Results from the
test are summarized in Figure 1. On the whole, boys performed better than girls in both
subjects.
A student in grade 4 or 5 requires four textbooks: math, English, social studies, and
science. On average, at baseline, most students only have 2 textbooks implying that
textbook availability is not at the government stipulated level of 4 textbooks per
student. Further, only about 40 percent of the teachers claimed that they allowed
students to take textbooks home, which implies that student access to textbooks at
home is very low. In fact around 36 percent of the sampled schools reported parents
complaining about lack of textbooks in the last six months. Likelihood of parents about

9
lack of learning materials is not systematically related to the existence of a school
management committee or to schools charging fees.
5. Intervention Implementation
To determine implementation of the intervention two sources of data are used: (i)
information from the headmaster at endline and (ii) data on textbook distribution
collected by IE team from district education officers and service providers.3 Using these
data we determine how many schools actually received books from the project.
As a second step, headmaster data is used to determine if the school received textbooks
from other sources (such as from MEYS but outside the project, local government, or
NGOs). This then allows us to create a variable for overall treatment i.e. schools in the
program that received textbooks in 2008-09.
On contrasting actual treatment variable with the original randomized allocation, we
find some non-compliance. Non-compliance to randomized assignment is found in both
directions i.e. 15 percent of schools assigned as treatment did not receive any textbooks
and 45 percent of schools assigned as control received textbooks from one source or
another. This information is summarized in Table 3.
6. Empirical Strategy
Given the non-compliance to randomized assignment, the IE relies on Intent-to-Treat
(ITT) analysis for identification of program impacts. In ITT analysis, participants are
analyzed as if they received the treatment to which they were assigned (Begg 2000).
This analysis yields an unbiased estimate only of being assigned to a treatment and not
of actually receiving the treatment. Hence, using this methodology we will estimate the
impact of being assigned as a treatment schools for receiving textbooks and not of
actually having received textbooks. The ITT analysis identifies the mean differences
between the population in the treatment and control areas.
Outcomes are tested using OLS regression models that use assignment to treatment
group as the explanatory variable and thereby helps calculate how much an outcome of
3 Headmaster data is given precedence; administrative data is used when headmaster data is missing. In
case headmaster and administrative data contradict each other, headmaster data is used, except in 26 cases where in the headmaster claims school received books from the project but is unable to provide information on the number of books received or date books were received.

10
interest, e.g. change in test scores, differs between schools that are assigned as
treatment schools and those that are assigned as control schools.
(1)
where is the outcome in school i, Treatment = 1 if school was assigned as a treatment school in randomization and 0 otherwise. Outcomes are also tested at the classroom and student levels. At the classroom level and school level the specification is as follows:
(2) where is the outcome in classroom i and school s for the classroom level
regression and , it is the outcome for student i and school s for the student level
regression. The variable Treatment = 1 if school was assigned as a treatment school in
randomization and 0 otherwise. The errors term is clustered at the school level in
these specifications to account for intra-school correlation of outcomes.
The parameter of interest is ; which is the average effect of being assigned as a
treatment school in the textbook provision program.
To supplement this analysis, treatment on treated (ToT) estimates are also presented.
Because actual provision of textbooks to schools outside the randomized assignment
could be endogenous, that is, it could be a function of observed and unobserved school
characteristics which may also be correlated with the outcomes of interest, we cannot
simply compute the difference between outcomes of schools that received textbooks
with those that did not.
To correct the potential endogeneity we propose instrumental variables estimation,
using the treatment or control status of a school as an instrument for preschool
participation. The treatment or control status of a school is a valid instrument given its
high correlation with actual provision of textbooks to schools, and because treatment
status was assigned randomly, it is orthogonal to school characteristics and as such
uncorrelated with the unobserved heterogeneity (the error term in a standard
regression model).
For ToT estimation we rely on a two stage least squares model:
(3)

11
Where is an indicator of whether school i received textbooks during the intervention
period. In the second stage, the predicted values of acts as an independent
variable.
(4)
The key parameter of interest is again which represents the average impact of the
program for those schools who received the books.
For most outcomes, both ITT and ToT estimates have been calculated. However, in the
discussion and conclusion sections we rely more heavily on the ITT analysis, as being the
cleanest estimation of the impact of being assigned as a treatment school for receiving
textbooks. The TOT estimates are presented in Annex 1.
7. Overall Impacts
At the school level, we find that the program has no impacts on student enrollment. We
do find however that the likelihood of parents complaining to head-teachers about lack
of textbooks is substantially lower in treatment schools (Table 4).
Information on teaching practices was collected through interviews with teachers for
Grades 4 and 5 at endline. These impacts are summarized in Table 5 wherein each
teacher interview is a distinct observation and standard errors are clustered at the
school level. We find that the program had no impact on likelihood of teacher assigning
homework from textbooks. This is most likely because propensity to assign homework
from textbooks is fairly high in control schools (93 percent). Likewise, the program did
not influence the likelihood of physical punishment for students found mistreating
textbooks.
We also find that the program did not impact the likelihood of teacher producing and/or
distributing pamphlets (informal notes or study guides) to students. However, we do
find significant positive impacts of the program on the likelihood of teacher having a
lesson plan (Table 5).
Student attendance data was collected through unannounced visits to classrooms
(Grades 4 and 5) at endline. We find no discernible program impacts on student
attendance in either grade or by student gender (Table 6).

12
These unannounced classroom visits also yielded reliable data on teacher activity
(Grades 4 and 5) in class. The program did not impact likelihood of finding teacher in
class but did lead to increased likelihood of finding teacher in class teaching (Table 7).
Note that in the control group about 18 percent of the teachers were not in class at the
time of the visit; however of the teachers in class, only 57 percent were found to be
actually teaching.
We also don’t find any program impacts on learning outcomes as measured by a
comprehensive test in English and Mathematics (Table 8a). As noted above, impacts on
student performance are measured by comparing student test scores in English and
Math at endline between control and treatment schools. Standard errors are clustered
at the school level.
In Table 8b we also present program impacts on change in student scores between
baseline and endline, for the sub-sample of students that were matched with baseline
(diff in diff estimation). In these regressions also we do not detect any program impacts.
However, since we cannot rule out selective attrition in the matched sample, these
results are not very reliable.
Therefore, on the whole we find that the textbook provision program from government
to schools has some modest positive impacts on teacher behavior (increased presence
of lesson plan and increased likelihood of being in class and teaching) but no discernible
impacts at the student level (either on attendance or performance).
8. What explains the lack of program impacts on students?
In order to fully understand the reasons for absence of program impacts at the student
level, we exploit student survey data to examine how the program impacted textbook
use by students. These data come from interviews conducted with students from
Grades 4 and 5 at endline.
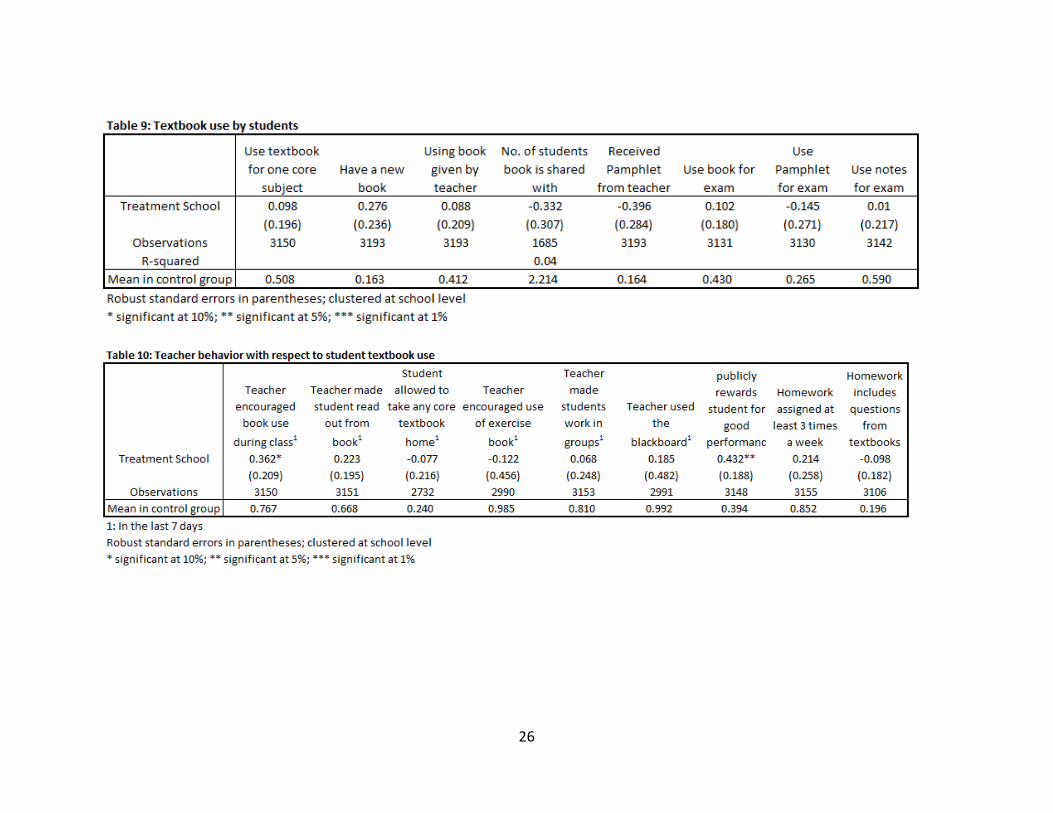
We find that the program of textbook provision from government to the schools did not
significantly impact student use of textbooks. In Table 9 program impacts on broad
indicators of student textbook use and related behaviors are summarized. We see that
the program did not increase the likelihood that students in treatment schools were
using a textbook in class, have a new textbook, or have a textbook given to them by
teacher. Likewise, the program did not impact the number of students textbooks are
13
shared with or the likelihood of receiving pamphlets (informal notes or exam guide)
from teachers.
Information was also collected on materials used by students for exam preparation,
including books, pamphlets, and notes. On these indicators as well, the program had no
discernible impacts.
Student use of textbooks is often heavily contingent on teacher behavior. We examine
program impacts on teacher behaviors with relation to textbook use in Table 10. This
information also comes from student interviews described above. We see that while the
program had modest impacts on the likelihood of teacher encouraging the use of
textbooks by students and publicly rewarding students for good performance, it did not
impact any of the more direct predictors of textbook use such as students reading from
textbook in class, students being allowed to take textbooks home, and homework
assignment.
Given the lack of program impacts on student textbook use, it is not surprising that we
observe no impacts of the textbook provision program on student performance. We are,
however, faced with a puzzle – when schools, by their own admission, received
textbooks from the government, why then did the students’ actual use of these
textbooks did not improve? What happened to the government provided textbooks?
To answer this question, we again rely on direct observation data collected during the
endline. During unannounced classroom visits, data was collected on number of
textbooks per student in class. From this information we find that, at endline, textbooks
per capita in classrooms were not significantly higher in treatment schools than control
schools (Table 11).
During data collection, enumerators were instructed to request access from the
headmaster to the place where textbooks were stored and count the textbooks (of 4
core subjects for grades 4 and 5) in storage. We find that in treatment schools the
number of core textbooks stored per capita students present in school, is significantly
higher (Table 11). Comparing books stored per capita at endline and baseline, we find
that the program led to a strong increase in the number of books stored in treatment
schools (Table 11). Box plots depicting book storage at baseline are presented in Figure
2.

14
Recall that lack of student access to books has already been highlighted given that the
program did not increase the likelihood that students have access to books at home
(Table 11). It is clear, therefore, that a big reason for lack of student access to textbooks
either in classroom or at home could be that a lot of these books are being stored by
schools and not distributed to students.
Presumably, the lack of access did not extend to teachers given that the program
positively impacted teacher behavior on a number of dimensions4.
9. Why are textbooks stored and not used?
If school administrators exhibit high propensity to store inputs instead of providing
them to students, input provision programs to schools are likely to have only limited
effectiveness. Therefore, it becomes imperative to understand what prompts school
administrators to save government provided inputs instead of using them – clearly an
inefficient utilization of resources.
To investigate underlying factors that predict propensity to store, we estimate a cross-
sectional model in which book storage (per capita students present) is regressed on a
set of school level controls.
(5)
Where is the number of books stored per capita student in school i, is a dummy for
whether school i expected to receive books in the academic year 2008-09 , and
includes other school level controls that could influence propensity to store. These
include the presence of head teacher at the time of interview, remoteness of school
(distance from nearest paved road and from DEO’s office), parental pressure (whether
school charges fees, whether parents complain to head teacher about lack of
textbooks), and whether the school received books from the Government in the last
academic year5.
As noted above, among independent variables we include a proxy for whether the
school administrators ‘expected’ to receive books or not ( . The proxy for
4 These results suggest that it would be of interest to derive impacts of textbooks on student performance
after controlling for storage. However, book storage is likely to be endogenous and the authors were unable to find a credible IV for storage. 5 In our sample of 341 schools, 71 schools reported receiving textbooks from the Government in 2008 (the
last academic year).

15
expectations of input receipts from Government is created using head-teacher question
at endline:
Expectations proxy 1: If the head-teacher answers yes to the question: ‘Do you
know how many books the government was to allocate to your school for Grades
4 and 5?’
Expectations proxy 2: If the head-teacher is able to answer the question: ‘How
many books was the government to allocate to your school for Grades 4 and 5?’
The underlying assumption in treating these variables as proxies for expectations is that
head-teachers who claim to know whether books were allocated to their schools or,
more stringently, who claim to know the exact number of books that were allocated –
must have had some expectations of receiving textbooks from the Government in the
current academic year.
This proxy is not perfect due to possibility of rationalization: Schools that actually
received books will be more likely to claim that they expected to receive books. The r
squared of proxy 1 and actually receiving books is 0.038 (with assignment is 0.0015) and
proxy 2 and actually receiving books is 0.029 (with assignment is 0.0004).
Results are shown in Table 12. Panels 1 and 3 show results with expectations proxy 1
and Panels 2 and 4, with proxy 2; also in Panels 1 and 2, we examine the predictors of
the number of books stored at the school level while in Panels 3 and 4 we examine the
change in the number of books stored by including books stored at baseline as one of
the independent variables.
We find that, controlling for a number of variables, book storage is significantly higher in
treatment schools that did not expect to receive books. In contrast, it is lower in
treatment schools that expected to receive books. This seems to suggest that school
administrators who do not have expectations about receiving input transfers from
Government are likely to hoard them instead of using them by distributing them to
students.
This behavior makes sense if we assume that current expectations are positively
correlated with future expectations. Head-teachers or teachers who have low current
expectations and hence low future expectations of government transfers, hoard or save
at least part of the transfers in order to smooth consumption in future periods. In this

16
context, consumption is loosely defined as “intensive use of textbooks by students – at
school and at home.”
This interpretation calls for the following assumptions: (a) head teacher (teacher)
performance is measured by average performance of students in their school (class); (b)
head teachers’ (teachers’) objective function is to maximize their performance over
their tenure period; (c) the tenure period extends over more than one year; and (d)
head teachers (teachers) believe increased student access to textbooks leads to better
student performance.
In this scenario, low expectations/high uncertainty mean that current transfers are seen
as a one-time positive shock by head teachers or teachers with a multi-year planning
horizon or objective function.6 To maximize their performance over a multi-year period
it would therefore be optimal for school administrators to hoard part of the current
transfers of textbooks to smooth future consumption.
Why should expectations of school administrators regarding current and future
transfers of textbooks from Government be low? This is discussed in Section 10.
There are other interpretations of this result. For instance, could simply be capturing
unobserved components of head-teacher quality that are correlated with propensity to
save books. It is possible that head teachers who hoard books are the lower quality
head teachers who are both (a) less likely to be able to access information on future
transfers from government; and (b) more likely to engage in rationing behavior with
regard to distribution of books. It is also possible that book storage by school
administrators indicates program capture and these stored books would be sold in the
future for private gain.
Information from Panels 1 and 2 also highlights the role of parents in influencing
propensity of input storage in schools. We find that schools where parents actively
complain about lack of learning materials or pay fee have significantly lower likelihood
of storing books. Not surprisingly, more remote schools are also more likely to store
books. Remoteness is significantly related to overall book storage and change in book
storage.
6 This further assumes that current transfers are not sufficient to lead to an updating of head-
teacher/teacher expectations from ‘no transfers’ to ‘guaranteed transfers every year’.
17
There are obvious caveats to the discussion above, most importantly, the possibility of
omitted variable bias. In fact, in the absence of reliable time-series data on past
transfers of textbooks from government to schools it is difficult to make strong claims
regarding expectations and hoarding behavior on the part of school administrators.
More fundamentally, data limitations and empirical challenges make it difficult to assign
clear labels to the hoarding behavior – it can be interpreted as ‘consumption smoothing’
as above, but it can also be seen as program capture or rationing on the part of school
administrators.
10. Expectations of schools with regard to government transfers
One of the challenges that societies face as they move from conflict and fragility
towards development is that trust in the State has to be re-built. Lant Pritchett (2009)
argues:
“In seeking to build legitimacy the state will be under pressure to create confidence in
the state, in part by delivering on identifiable “quick wins” but also at the same time to
build and transform institutions that are capable of delivering on development.”
While a government transfer program for textbooks can be seen as a ‘quick win’; the
system that is expected to deliver these transfers to schools is still far from perfect.
There are inefficiencies and uncertainties in the functioning of government systems in
Sierra Leone as evidenced by the fact that in 2009, 17 percent of the headmasters and
36 percent of teachers reported not receiving their full pay in the last year.
In addition, relating specifically to the textbook provision program, process data from
the impact evaluation reveals that none of the DEOs or LCs had a clear picture of who
was responsible for book pick up and distribution, official signatories, or monitoring for
textbook delivery. With regard to actual disbursement of books knowledge was also
spotty and written records were rarely found.
Further, only in 20 percent of the cases (out of 325) were textbooks ever delivered
directly to the school (in other cases, presumably, textbooks are delivered to a central
location in the district, like the DEO office) and in as many as 25 percent of the cases
headmaster claimed that they had to pay for textbook retrieval from their personal
resources with no expectation of reimbursement by the government.
These factors indicate that school administrators might view transfers from government
as a one-time positive shock, with little expectation of further replenishment in the
18
short-run. This would explain some of the hoarding behavior we find among school
administrators.
11. Conclusions and Policy Implications
There is considerable preoccupation in the development community with the
disappointing impacts of pure input provision programs on beneficiary outcomes. This
paper provides one possible explanation for this phenomenon. We show that public
provision of textbooks to schools failed to have any impacts on student outcomes
because a large share of the publically provided textbooks was stored by school
administrators instead of being distributed to students.
We find that school administrators who did not expect to receive books were more
likely to store them. Based on this result, we hypothesize that administrators are
forward looking and therefore in times of high uncertainty they store part of current
transfers to smooth future consumption. Here consumption is defined as intensive use
of textbooks by students, both at school and at home. Therefore, in line with the
‘Permanent Income Hypothesis’ when current transfers are seen as transitory they will
have only limited impact on current consumption of textbooks in schools.
Clearly, behavior of intermediate agents, like school administrators, is likely to exercise a
strong mediating influence on the impacts of public provision programs on ultimate
beneficiaries. However, the types of intermediate agent behavior that are usually linked
to program failure include issues like organizational constraints, problems of human
error, and program capture for private gain etc. In this paper we provide empirical
evidence of intermediate agent behavior that is rational, calculated, and not entirely
driven by private gain but that ends up subverting intending program objectives.
We show that in situations where scarcity of inputs coexists with uncertainty regarding
future government transfers, intermediate agents might have strong incentives to store
part of current transfers to smooth future consumption of these transfers by ultimate
beneficiaries. More fundamentally, in the absence of efficient systems and good
information flows, expectations of intermediate agents are likely to become important
in determining program impacts.
These results have clear policy implications. First, public (or NGO) provision of those
inputs that depreciate quickly when used, like textbooks, will be fully consumed only if
agents have expectations of replenishment. In case there is uncertainty regarding
recurrence of the transfer, intermediate agents or ultimate beneficiaries will have
19
incentives to store part of the current transfer to smooth future consumption.
Therefore, for public programs that are envisaged as recurring transfers, there is need
to reliably communicate the timing of the next transfer to intermediate agents with the
aim of optimizing use of current transfers.
Secondly, in line with current discourse, empowering ultimate beneficiaries with
information about government transfers can promote more effective use of these
transfers. On the whole, the way program information is communicated to agents at
different levels, is likely to have a strong impact on how effective the program ends up
being.
Finally, as in many other empirical studies, we see here that mere input provision does
not guarantee much unless adequate attention is paid to actual input use. For the latter
it is the incentives and expectations of intermediate agents and ultimate beneficiaries
that can make all the difference.

20
Works Cited
Arellano, Cristina, Ales Bulir, Timothy Lane, and Leslie Lipschitz. "The dynamic implications of foreign aid and its variability." Journal of Development Economics, 2009: 87-102.
Das, Jishnu, Stefan Dercon, James Habyarimana, Pramila Krishnan, Karthik
Muralidharan, and Venkatesh Sundararaman (2010) ‘School Inputs, Household
Substitution, and Test Scores’ NBER Working Paper no. 16830, 2010.
Deaton, Angus. (2010). ‘Instruments, Randomization, and Learning about Development’.
Journal of Economic Literature, Volume 48, Number 2, June 2010, pp. 424-455(32)
Glewwe, Paul. (2002): ‘Schools and Skills in Developing Countries: Education Policies and
Socioeconomic Outcomes’. Journal of Economic Literature, 40, 436-482.
Glewwe, Paul, Eric Hanushek, Sarah Humpage, and Renato Ravina. "School Resources and Educational Outcomes in Developing Countries: A Review of the Literature from 1990 to 2010." NBER Working Paper 17554, 2011.
Glewwe, Paul, Michael Kremer, and Sylvie Moulin. (2008). “Many Children Left Behind?
Textbooks and Test Scores in Kenya.” American Economic Journal: Applied Economics.
1(1), pp. 112-135.
Kodama, Masahiro. "Aid Unpredictability and Economic Growth." World Development, 2012: 266-272.
Kreuger, A. (2003): "Economic Considerations and Class Size," Economic Journal, 113,
34-63.
Krishnaratne, Shari, Howard White, and Ella Carpenter. Quality education for all children? What works in education for all children. Working Paper 20, New Delhi: International Initiative for Impact Evaluation (3ie), 2013.
McEwan, Patrick J. "mproving Learning in Primary Schools of Developing Countries: A
Meta-Analysis of Randomized Experiments." Wellesley College Working Paper, 2013.
Minakawa, Noboru , Gabriel O Dida, Gorge O Sonye, Kyoko Futami, and Satoshi Kaneko.
‘Unforeseen misuses of bed nets in fishing villages along Lake Victoria’. Malaria
Journal 2008; 7: 165.

21
Pawson, R. and Tilley, N. (1997), Realistic Evaluation, (London: Sage).
Pritchett Lant (2009) ‘Basic Systems for Service Delivery in South Sudan’ Unpublished
Manuscript.
World Bank (2007) ‘Education in Sierra Leone. Washington DC.
22

23

24

25
26

27

28

29
Figure 1: Student Performance in Mathematics by Grade & Gender

30
Figure 2: Estimate of Books Stored per Capita at Baseline
Note: The line in the middle is the median value. The bottom of the box is the first
quartile, and the top of box is the third quartile.
Using DVD Lectures to Improve Academic Performance
of Rural High Schoolers
Hisaki Kono
Kyoto University
Yasuyuki Sawada
University of Tokyo
Abu Shonchoy
Institute of Developing Economies
December 10, 2013
Abstract
While many developing countries are achieving an increasing completion rate of primary
school, the access to higher education is still limited especially in rural areas. Given the
recent empirical evidence showing the higher returns from higher-level education than
from primary-level education, improving the access to higher education is a crucial
issue for economic development and poverty reduction.
Though there are accumulating studies investigating the impact of the interventions
aiming at improving the academic performance of students, most of the interventions
implemented in developing countries are targeted to primary or secondary school stu-
dents, and these interventions are not always applicable to higher level education. For
example, Banerjee eat al (2007) found the positive impact of remedial education and
computer-based learning on student academic performance in India. However, finding
remedial education tutors appropriate for high school students will be quite difficult
given the lack of human resources in developing countries. It is often argued that in
many poor countries, especially in rural areas, the quantity and quality of teachers is
far from sufficient (World Bank, 2006). Programming softwares effective enough for
high school students is not an easy task for most of the developing countries, probably
excluding India. In addition, if one creates new programs from scratch, there are no
guarantee for the software to be of good quality. There would be some software or
contents outside of the country such as Khan Academy, but the curriculum is different
and at least translation is required.
1
One potential intervention which has been little implemented is DVD lecture series,
which could be feasibly implemented in most countries. Every country would have some
very talented teachers who are really good at teaching. Once we can identify them,
we can record his lecture series and distribute the lecture series DVD to schools or
centers across the country. With this DVD lecture intervention, no additional human
resources are required, and the quality of the lecture is guaranteed because they are
supposed to be among the best teachers. Because they have been teaching ni the
existing curriculum, there are no need for adjustment of curriculum and translation.
The students can watch the lectures as many as they want at their own pace, which may
help lower performing students. Some studies have pointed out the incentive problems
of teachers such as absentism (Banerjee et al. 2005) and low incentives, but in the
DVD lecture intervention, we can monitor the teachers to lecture which we record,
making us less concerned about teacher’s incentive problems.
In this paper, we report the results of the impact of the DVD lecture series on the
university admission of the rural high school students in Bangladesh using a random-
ized control trial. We found that the DVD lecture series increased the admission to
the top level universities by 5%, and the admission to any universities by 22%. We
also found some of the noncognitive abilities such as conscientiousness contributed to
increasing the impact of the DVD lectures, which is consistent with the idea that im-
proving academic achievement requires both of the good materials and student’s effort,
and these two are complements. Present-bias indicator, on the other hand, did not sig-
nificantly affect the effectiveness of the DVD lectures, probably because in our DVD
lecture programs, some commitment mechanisms were embedded such as the exclusion
of the students who were absent from the class in three consecutive days and daily and
monthly small exams.
In another experiment, we investigate the price sensitiveness of the uptake behavior.
We did not find any evidence that the uptake was influenced by the price at least in our
price range even among the poor students. Given the increasing returns to education,
this might suggest that households are willing to invest in higher education if the quality
is ensured. This also suggests that households are not so severely credit constrained
that they cannot find any financial resources to send their kids to this additional DVD
lectures. This results might imply the possibility of running the DVD lecture series
as a social business because people are willing to pay for higher education with good
quality, and there are little worry that talented but poor students would be excluded
from the service.
JEL Classification: I21; I23
2

The Fiscal Cost of Weak Governance: Evidence from Primary Education in India
Karthik Muralidharan Jishnu Das Alaka Holla Michael Kremer Aakash Mohpal†
15 July 2013
Abstract: India has the largest primary education system in the world, catering to over 200 million children. The public education system, though, is characterized by weak governance. A nationally-representative survey in 2003 found that 26.2 percent of teachers in rural public primary schools were absent on a typical day. We study the extent to which the substantial investments in primary education made by the Government of India over the past decade have translated into improved education system performance using a new nationally-representative panel data set of over 1200 villages that were initially surveyed in 2003. We find that there has been a substantial improvement in several measures of school quality, including infrastructure, pupil-teacher ratios, and monitoring. However, teacher absence rates continue to be high, with 23.7 percent of teachers in public schools across rural India being absent during unannounced visits to schools. We find two robust correlations in the nationally-representative panel data that corroborate findings from smaller-scale experiments. First, reductions in pupil-teacher ratios are strongly correlated with increased teacher absence. Second, increases in the frequency of inspections are strongly correlated with lower teacher absence. Improvements in infrastructure and working conditions on the other hand, are not correlated with lower teacher absence. We calculate that the fiscal cost of teacher absence in India is over $1.5 billion per year, accounting for 60 percent of the funds raised from India’s special education tax in the year of the survey (2010). Assuming that the correlations using panel data are causal, we estimate that investing in improved governance by increasing the frequency of monitoring could yield a ten-fold return on investment by reducing the fiscal cost of teacher absence.
JEL Classification: I21, M54, O15
Keywords: teacher absence, teacher absenteeism, India, governance, state capacity, monitoring
† Karthik Muralidharan – UC San Diego, NBER, and BREAD: [email protected] Jishnu Das – World Bank and Center for Policy Research, New Delhi: [email protected] Alaka Holla – World Bank: [email protected] Michael Kremer – Harvard, NBER, and BREAD: [email protected] Aakash Mohpal – University of Michigan: [email protected] We thank the Bill and Melinda Gates Foundation for financial support for the data collection and analysis. Additional funds for data collection were made available by the Governance Partnership Facility grant provided through the Human Development Network of the World Bank. We are grateful to Pratap Bhanu Mehta and the Center for Policy Research, New Delhi for hosting the project and providing logistical support and infrastructure. We thank Sreela Dasgupta, Anvesha Khandelwal, and L. Ravi for project management support, and Monisha Ashok, Jack Liebersohn, Prerna Mukharya, and Anand Shukla for outstanding research assistance. The project would not have been possible without the efforts of Charu Sheela, Trilok Sisodiya, AV Surya, K. Venugopal, and other staff of the Social and Rural Research Institute (SRI) in New Delhi who oversaw the field work and primary data collection. The findings, interpretations, and conclusions expressed in this paper are those of the authors and do not necessarily represent the views of any of the organizations that financially supported the project or any of the organizations that the authors are affiliated with.

1
1. Introduction
India has the largest primary education system in the world, catering to over 200 million
children. During the past decade, the Government of India has made substantial investments in
primary education under the Sarva Shiksha Abhiyan (SSA) or "Universal Education Campaign".
This national program sought to correct historical inattention to primary education and led to a
substantial increase in annual spending on primary education across several major categories of
inputs including school infrastructure, teacher quality, pupil-teacher ratio, and school feeding
programs.
However, the public education system in India also faces substantial governance challenges.
One striking indicator of weak governance is the high rate of teacher absence. A nationally-
representative study of over 3,000 government-run primary schools across 19 major Indian states
found that over 25 percent of teachers were absent from work on a typical working day in 2003
(Kremer et al. 2005). Thus, while administrative data from the government's official records1
suggests that SSA has led to an improvement in various observed measures of school quality,
there is very little evidence on whether these investments have translated into improvements in
education system performance, both with respect to intermediate metrics such as teacher absence
and final outcomes such as test scores.
In this paper, we study the impact of this nationwide campaign to improve school quality in
India using a new nationally-representative panel dataset of education inputs and outcomes. We
collect this data by revisiting (in 2010) a randomly-sampled subset of the villages that were
originally surveyed in 2003 and collecting detailed data on school facilities, teachers, community
participation, and monitoring visits by officials. We also collected data on teacher absence and
student learning outcomes. Thus, in addition to reporting updated estimates of teacher absence,
we are able to correlate changes in various input-based measures of school quality with changes
in outcomes such as teacher absence and test scores. The panel data help mitigate concerns
arising from unobserved heterogeneity at the village-level, and our results provide the best
available estimates of how this ambitious nationwide program has improved school quality.
1 These come from the “District Information System for Education” and are commonly referred to as the DISE data.

2
We find significant improvements in almost all input-based measures of school quality
between 2003 and 2010. The fraction of schools with toilets and electricity more than doubled,
and the fraction serving mid-day meals nearly quadrupled. There were significant increases in
the fraction of schools with drinking water, with libraries, and with a paved road nearby. The
fraction of teachers with college degrees increased by 40 percent, and pupil-teacher ratios fell by
16 percent. The fraction of teachers not paid on time fell from 51 percent to 22 percent, and the
prevalence of teacher recognition programs increased from 49 percent to 81 percent. Finally, the
frequency of school inspections and parent-teacher association (PTA) meetings increased
significantly.
Reductions in teacher absence rates were more modest. The all-India weighted average
teacher absence in rural areas fell from 26.3 to 23.7 percent.2 The variation across states remains
high. At one end, top performing states like Tamil Nadu, Punjab, Maharashtra, Chhatisgarh, and
Orissa all have teacher absence rates below 15 percent, while at the other, the poorest performing
state, Jharkhand (which also had the worst absence rates in 2003), has a teacher absence rate of
46 percent. We estimate legitimate absence rates to be in the range of 8-10 percent; thus, the
variation among states in unauthorized teacher absence rates is even higher.
While the cross-sectional correlations in the original teacher absence study (Kremer et al.
2005) suggested a negative relationship between school infrastructure and teacher absence, we
find no significant correlation between changes in infrastructure and changes in teacher absence
in the panel data. We do however find two robust correlations in the panel data.3 First,
reductions in school-level pupil-teacher ratio (PTR) are correlated with an increase in teacher
absence, suggesting that the potential benefits from investing in more teachers and smaller class
sizes may be partly offset by an increase in teacher absence. Second, we find evidence
consistent with the hypothesis that better monitoring can reduce absence. Villages where the
fraction of visits in which schools had been inspected in the prior three months increased from
zero to one, had teacher absence rates that were 6.5 percentage points lower (which is over 25
2 While the all-India weighted average teacher absence estimated in 2003 was 25.2 percent, the corresponding figure for the rural sample was 26.3 percent. The panel survey only covered the rural sample. 3 As we discuss further in the results section, we consider 'robust' correlations to be those where the point estimates are significant and similar in both binary and multiple regressions, and in specifications with no fixed effects, with state fixed effects, and with district fixed effects. These results are therefore least likely to be confounded with omitted variables at the state or district level.

3
percent of the measured absence rate, and over 40 percent of our estimated rate of illegitimate
absence). We verify that these changes in inspections are not correlated with reductions in either
authorized leave or official duty, but are mainly correlated with reductions in unauthorized
absence rates. We also show that the changes in inspections are not correlated with changes in
other teacher or school characteristics.
We combine our estimates of illegitimate teacher absence with data on number of teachers
employed and their salaries and calculate that the fiscal cost of teacher absence is over $1.5
billion per year. This represents 60 percent of the entire revenue collected from the special
education tax used to fund SSA (in 2010).4 How can this fiscal cost of teacher absence be
reduced? Using the most conservative panel-data estimate of the correlations between increased
inspections and reduced teacher absence, and assuming that these effects were causal, we
estimate that a marginal increase in the frequency of school monitoring and supervision would
yield a ten-fold return on investment of the cost of increased inspections in terms of the salary
cost saved through reduced teacher absence. Finally, we consider two policy options for
increasing effective teacher-student contact time – hiring more inspectors, and hiring more
teachers – and find that the former would be over twelve times more cost effective. Hiring more
teachers entails an additional cost because of the increase in absence rates of existing teachers
when additional teachers are hired. These results highlight the fiscal costs of weak governance
in Indian primary education and the potential returns to investing in better monitoring.
This paper makes several contributions to the literature on public economics in developing
countries. First, teacher absence is now widely used as a governance indicator in education in
middle- and low-income countries.5 We update the estimates of teacher absence in rural India
from 2003 and show that in spite of substantial increases in spending on education inputs over
the last decade, improvements on this key measure of governance have been more modest. Our
estimates of the large annual fiscal cost of teacher absence highlight the discrepancy between
high-levels of media coverage of corruption scandals where there are concentrated benefits to
4 http://indiabudget.nic.in/budget2012‐2013/ub2012‐13/rec/tr.pdf 5 The World Bank's World Development Report 2004 focused on service delivery for the poor and provided consistently measured estimates of provider absence in both health and education for a sample of developing countries (see Chaudhury et al. 2006 for the details of this study). These numbers have been widely cited in policy discussions, and reduction in provider absence rates is often included as an objective in aid agreements between donors and aid recipients.

4
officials and politicians and the relatively low coverage of governance dysfunction that leads to
large amounts of 'passive' waste and inefficiency – in our case, accounting for 60 percent of the
collections from the special tax for financing education (Bandiera, Prat, and Valletti 2009).
Second, our results showing that decreases in PTRs are correlated with increased teacher
absence underscores the importance of distinguishing between average and marginal rates of
corruption and waste in public spending. Niehaus and Sukhtankar (2013) propose this
terminology in the context of wages paid to beneficiaries in a public-works program in India and
find that marginal rates of leakage are much higher than average rates. We find the same result
in the context of teachers and show that the effective absence rate of the marginal teacher hired is
considerably higher than the average absence (because of the increased absence among existing
teachers). This result, from a large all-India sample mirrors experimental findings from multiple
settings in smaller studies. See Duflo, Dupas, and Kremer (2012) and Muralidharan and
Sundararaman (2013) for experimental evidence from Kenya and India that provision of an extra
teacher to schools led to an increase in the absence rate of the pre-existing teachers.
Finally, if the relationships estimated in the panel are causal, we can compare the relative
impacts of top-down (inspections) versus bottom-up monitoring (PTA meetings) for reducing
absence. We find that the former are significantly more correlated with reduced absence, which
is consistent with results reported in Olken (2007) that compare the relative effectiveness of
administrative and community audits on reducing corruption in road construction in Indonesia.
More broadly, a growing body of experimental evidence points to the effectiveness of audits and
monitoring (accompanied by rewards or sanctions) in improving the performance of public-
sector workers and service providers (including Olken 2007 in Indonesia; Duflo, Hanna, and
Ryan 2012 in India; and Zamboni and Litschig 2013 in Brazil). Our panel-data estimates
provide complementary evidence to these experiments from an "as is" nationwide increase in
monitoring of schools, and suggest that investing in better governance and monitoring of service
providers may be an important component of improving state capacity in low-income countries
(Besley and Persson 2009).
At a minimum, our results make a strong case for an increase in the frequency of school
inspections accompanied by a large-scale randomized trial evaluating its impact. We show in
section 5 that if our estimates of the correlation between increased inspections and reduced

5
teacher absence are causal, the net present value (in terms of salary costs saved through lower
teacher absence rates) of a policy to ensure that all schools are inspected at least once in three
months would be $3 billion. We also show that a substantial expansion of school inspections in
the context of an experimental evaluation would make sense even if there was only a 1 percent
chance of the true effects being the same as our panel-data estimates (and a 99 percent chance
that an experimental evaluation finds no significant impact of increased inspections on reducing
teacher absence).
From a policy perspective, it is worth highlighting that several of the innovative approaches
to improving teacher performance in developing countries that have been experimentally
evaluated in recent years (including performance-linked pay, monitoring teacher attendance with
cameras, and informing citizens about their rights over schools)6 often face political and
administrative hurdles to scaling up. In contrast, inspection systems are already in place in most
countries and are easy to scale up. Further, as we discuss in section 5, schools often do not get
inspected on schedule because of staffing shortages. It should therefore be administratively
straightforward to expand the frequency of school inspections simply by hiring staff to fill these
shortages (and to conduct an experimental evaluation of such an expansion).
The rest of this paper is organized as follows: Section 2 discusses our empirical methods and
analytical framework. Section 3 reports summary statistics on school inputs and teacher absence.
Section 4 presents the cross-sectional and panel regression results. Section 5 discusses the fiscal
costs of weak governance and the returns to investing in better monitoring. Section 6 concludes.
2. Data and Analytic Framework
2.1 Sampling and Data collection
The nationally-representative sample used for the 2003 surveys, which our current study uses
as the base, covered both urban and rural areas across the 19 most populous states of India,
except Delhi. This represented over 95 percent of the country’s population. The 2010 sample
covered only rural India. The sampling strategy in 2010 aimed to maintain representativeness of
the current landscape of schools in rural India and also to maximize the size of the panel. We
6 See Muralidharan and Sundararaman (2011); Duflo, Hanna, and Ryan (2012); and Banerjee et al (2010) for illustrations of each of these type of interventions.

6
met these twin objectives (representativeness and panel) by retaining the villages in the original
sample to the extent possible, while re-sampling schools from the full universe of schools in
these villages in 2010, and conducting the panel analysis at the village level.7
We conducted school censuses in each village and sampled up to 3 schools per village for the
absence surveys. During fieldwork, enumerators made three separate visits to each sampled
school over a period of 10 months from January – October 2010.8 Data on school infrastructure
and accessibility, finances (income and expenditure), and teacher demographics were collected
once for each school (typically during the first visit, but completed in later visits if necessary),
while data on time-varying metrics such as teacher and student attendance and dates of the most
recent inspections and PTA meetings were collected in each of the three visits. We also assessed
student learning with a test administered to a representative sample of fourth grade students in
sampled schools. See Appendix A and Appendix Tables 1-3 for further details on sampling and
construction of the village-level panel data set.
Teacher absence was measured by direct physical verification of teacher presence and
activity within the first ten minutes of a survey visit. Data collected during the census round
were used to pre-populate teacher rosters for the sampled schools, so that enumerators could
record teacher activity immediately after their arrival at the school.9 Teachers could be “present
and in class”, “present in school but not in class”, and “could not be found anywhere”. Once
teacher activity was recorded, enumerators asked the headmaster for reasons for absence. All
7 This also explains why the 2010 wave did not include urban areas. Since the fraction of schools covered in the sampled towns in 2003 (relative to the total number of schools in the sampled town) was very small, it was not possible to construct a credible panel-data estimate of school quality in towns. We did not have school-level identifiers from the 2003 survey (these were not preserved for confidentiality reasons), and so the panel needed to be constructed at the town/village level (and this would be too imprecise at the town level). In rural areas, this was not a concern because we typically covered all the public schools in a village (in 84.2 percent of the cases) and had a mean coverage rate of 82.7 percent of public schools in the sampled villages. 8 While the exact timing of the school year is not identical across states, the typical school year runs from mid-June to mid-April. The three visits therefore spanned two academic years, with the first visit being made during January-March 2010, the second visit being made during June – August, and the third visit during August – October 2010. 9 Doing this was especially important given the widespread possession of cell phones among teachers, which would allow them to call up absent colleagues as soon as they became aware of an external visit to the school that was measuring absence.

7
other data were collected using interviews and surveys of head teachers (for school details) and
teachers (for teacher details).10
We record teachers as absent on a given visit if they were not found anywhere in the school
in the first ten to fifteen minutes after enumerators reached a school. We consider all the
teachers in the school to be absent if the school was closed during regular working hours on a
school day, and respondents near the school did not know why the school was closed or
mentioned that the school was closed because no teacher had arrived or they had all left early.11
To be conservative in our measure of absence, we exclude all school closures due to bad
weather, school construction/repairs, school functions and alternative uses of school premises
(for instance, elections). We also exclude all part-time teachers, teachers who were transferred
or deputed elsewhere, or teachers reportedly on a different shift.
We construct a school infrastructure index by adding binary indicators for the presence of
four indicators of school facilities – drinking water, toilets, electricity and library. We construct
a remoteness index by taking the average of nine normalized indicators of distance to various
amenities including a paved road, bus station, train station, public health facility, private health
clinic, university, bank, post-office and ministry of education office. A lower score on the
remoteness index represents a better connected school.
During each survey visit, we record the date of the most recent school inspection. We
measure the extent of monitoring and supervision as the mean probability of being inspected in
the past three months across all three visits. We used a similar procedure for constructing the
mean probability of a parent-teacher association (PTA) meeting. Average parental education of
children in a school is computed from the basic demographic data collected for the sample of
fourth-grade students chosen for assessments of learning outcomes.
10 Of course, not all interviews could be successfully completed. Most non-responses were at the teacher as opposed to the school level (since absent teachers could not be interviewed, whereas school data could be obtained from either the head teacher or any other senior teacher). These non-responses do not affect the analysis in this paper because the panel-data analysis will focus on aggregated data at the village level as opposed to the individual data at the teacher level. 11 Field teams obtained lists of state and national school holidays in advance of creating the field plans and ensured that no visits were conducted on these days.

8
2.2 Analytical Framework
For most of the analysis in this paper, we use the village as our unit of analysis and examine
mean village-level indicators of both inputs and outcomes because a large number of new
schools had been constructed between 2003 and 2010, including in villages that already had
schools. This school construction resulted from a policy designed to improve school access by
ensuring that every habitation with over 30 school-age children had a school within a distance of
one kilometer. Thus, ensuring that our sample was both representative in 2010 as well as
amenable to panel data analysis relative to the 2003 data requires us to construct the panel at the
village level, with a new representative sample of schools drawn in the sampled villages.12 All
the results reported in this paper are population weighted and are thus representative of the
relevant geographic unit (state or all-India).
3. Summary Statistics
3.1 Changes in inputs
The data show considerable improvements in school inputs between 2003 and 2010 along
three broad categories – teacher qualifications and working conditions, school facilities, and
monitoring (Table 1). The fraction of teachers with a college degree increased by over 40
percent (from 41 percent to 58 percent), the fraction reporting getting paid regularly rose by
around 60 percent (from 49 percent to 78 percent), and the fraction reporting being eligible for a
recognition scheme rose by over 60 percent (50 percent to 81 percent). While the fraction of
teachers who report a formal teaching credential fell by 12 percent (77 percent to 68 percent), the
main contributor to this decline was the large increase in the hiring of contract teachers in several
large states leading to an increase in the fraction of contract teachers from 6 percent to 30
percent. The pupil-teacher ratio also fell by around 16 percent (from 47.2 to 39.8)
School facilities and infrastructure have improved on almost every measure. The fraction of
schools with toilets and electricity more than doubled (from 40 percent to 84 percent for toilets
and 20 percent to 45 percent for electricity); the fraction of schools with functioning midday
meal programs nearly quadrupled (from 21 percent to 79 percent); the fraction of schools with a
library increased by over 35 percent (from 51 percent to 69 percent), and almost all schools now
12 Even in the absence of school construction, the survey firm did not retain school and teacher level identifiers from the 2003 survey (complying with data protection norms), which would have made it difficult to construct a school-level panel (especially for villages with more than three schools).
9
have access to drinking water (96 percent). Initiatives outside the education ministry to increase
road construction have also led to increased proximity of schools to paved roads increasing the
accessibility of schools for teachers who choose to live farther away. Relative to the distribution
observed in 2003, a summary index of school infrastructure improved by 0.9 standard deviations.
Table 1 also documents improvements in both ‘top-down’ administrative and ‘bottom-up’
community monitoring of schools over this period. The fraction of schools inspected in the three
months prior to a survey visit increased by over 40 percent (from 39 percent to 56 percent). This
increase in inspection probability is even more pronounced over shorter time windows,
increasing by over 60 percent for the previous two months and over 70 percent for the previous
month. Finally, the extent of community oversight of schools, measured by the frequency of
PTA meetings also increased: The probability that a PTA meeting took place during the three
months prior to a survey visit increased by 50 percent (from 30 percent to 45 percent).
3.2 Changes in teacher absence
Table 1 confirms the substantial improvements in both school inputs and governance over
this period. The main objective of this paper is to study the extent to which these investments
have translated into improved outcomes, such as teacher absence. Table 2 (Column 2) shows
teacher absence rates by state as well as the weighted average national absence rate for rural
India. It also shows the corresponding figures for 2003 to facilitate comparison (Column 1). The
population-weighted national average teacher absence rate for rural India fell from 26.3 percent
to 23.6 percent, a reduction of 10 percent or 2.65 percentage points.
Considerable variation remains in teacher absence rates across states with estimates ranging
from 12.9 percent in Tamil Nadu to a high of 45.8 percent in Jharkhand. Encouragingly, teacher
absence rates declined in 14 out of 19 states with significant reductions in 12 states. Five states
(Tamilnadu, Punjab, Maharashtra, Orissa, and Chhatisgarh) now report teacher absence rates
below 15 percent.
Since Chaudhury et al. (2006) find a strong negative correlation between GDP/capita and
teacher absence rates (both across countries and within Indian states), one way to interpret the
magnitude of these changes is to compare them with the expected reduction in teacher absence
that may be attributed simply to the economic growth that has taken place in this period. Using a

10
growth accounting (as opposed to causal) framework, we can decompose the change in teacher
absence into a component explained by changes in GDP/capita and one explained by a change in
"governance" (equivalent to TFP). Cross-sectional estimates from the 2003 data suggest that a
10 percent increase in GDP/capita is associated with a 0.6 percentage point reduction in teacher
absence.13 In the period between 2002 and 2010, real GDP/capita in India has grown 38 percent.
Thus, growth in GDP/capita over this period should have by itself contributed to a reduction in
teacher absence of 2.4 percent. Our estimate of the change in teacher absence rate is exactly in
this range, and suggests that there may have been limited improvements in teacher governance in
this period over and above those induced by income growth. We discuss the policy implication
of this decomposition in the conclusion.
Finally, to interpret the cost of teacher absence to students, we note that the effective
attention a student receives from a teacher can be increased both by reducing teacher absence as
well as by hiring more teachers. To account for the reduced attention that students receive when
teachers are absent, we define the “effective pupil teacher ratio (EPTR)” as:
.
We use official DISE data on total enrollment and total number of teachers, combined with the
absence rates from our survey to calculate both the PTR and EPTR by state (Table 2 – columns
4-9). Even though all-India PTR norms were below 40, the effective PTR after accounting for
teacher absence was over 52. These figures illustrate that teacher absence can sharply increase
the effective PTR experienced by students relative to the PTR calculated using state-level figures
on enrollment and number of teachers.
3.3 Official records, teaching activity, and stated reasons for absence
Enumerators recorded whether a teacher had been marked as present in the log-books on the
day of the visit and also on the previous day, and we see in Table 3 - Panel A that going by these
records would suggest a much lower teacher absence rate of 16 percent (based on the same day's
13 The cross-sectional relationship is estimated by regressing village-level teacher absence on the log of district-level per-capita consumption (from the National Sample Survey) in the 2003 survey. Estimates without state fixed effects are larger (and equal -1.17) whereas estimates with state fixed effects are smaller but still significant (and equal to -0.63). Our default estimate is based on using state-fixed effects since cross-state variation in per-capita income is much more likely to be correlated with unmeasured governance quality. Tables are available on request.

11
records) or as low as 10.2 percent (based on the previous day's records). These data suggest that
official records can be easily manipulated, and highlight the importance of measuring teacher
absence by direct physical verification as opposed to official records on log books (and the
figures suggest that the discrepancy between the two has increased over time).
Enumerators also record the activity that teachers were engaged in at the point of
observation, and we see that 53 percent teachers on the payroll were found to be actively
teaching at the point of observation, and another 4 percent were coded as passively teaching
(defined as minding the class while students do their own work). 19 percent of teachers were in
school but were either not in the classroom or not engaged in teaching activity while in the
classroom. Thus a total of 42 percent of teachers on the payroll were either absent or not
teaching at the time of direct observations (Table 3 - Panel B).14
In cases where a teacher was not found in the school, enumerators asked the head teacher (or
senior-most teacher who was present) for the reason for absence. These stated reasons are
summarized in Table 3 (Panel C). Two categories of clearly unauthorized absence (school
closure during working hours and no valid reason for absence) account for just under half the
cases of teacher absence (48 percent), which provides a lower bound on the extent of
unauthorized absences of 11.3 percentage points. The two other categories of stated absence
(authorized leave and other official duties) that account for 52 percent of the observed absence
are plausibly legitimate but cannot be verified.
There is some reason, however, to believe that responses by head teachers may overstate the
extent of official duties to shield absent colleagues, which is an important caveat to the
interpretation of these stated reasons.15 We can, however, reasonably treat the stated reasons for
absence as an upper bound for duty-induced absence. This yields the important finding that one
commonly cited reason for teacher absence - namely, that teachers are often asked to perform
non-teaching related duties such as conducting censuses and monitoring elections - is a very
small contributor to the high rates of observed teacher absence. Table 3 - Panel C shows that
14 This is almost surely an underestimate (and hence a lower bound) because in many cases it is easy for a teacher who may not have been teaching to pick up a book and look like he or she is actively teaching when it is known that someone is visiting the school (see Muralidharan and Sundararaman 2010 for evidence documenting this). 15 We see this most clearly in Table 3 - Panel A, where over 7.5 percent of teachers who were not found in the school during the direct observation were marked present in the official log books, suggesting collusion among teachers in the reporting of absence in official records.
12
official non-teaching duties account for less than 1 percent of the observations and under 4
percent of the cases of teacher absence.
4. Cross-section and Panel Regression Results
4.1. Correlates of teacher absence in 2010
Table 4 presents cross-sectional correlations between indicators of school quality and teacher
absence in 2010. As discussed in section 2.4, this analysis is done at the village-level since our
panel analysis will be done at the village-level. Column 1 shows the mean level of each
covariate in the sample, columns 2-4 present the coefficients on each indicator in binary
regressions with the dependent variable being teacher absence, while columns 5-7 do so in
multiple regressions that include all the variables shown in Table 5.
We first show the correlations with no fixed effects, and then with state fixed effects, and
finally with district fixed effects. The comparison of results with and without state fixed effects
is important for interpretation. Many indicators of school quality vary considerably across states
in a manner that is likely to be correlated with other measures of governance and development as
well as the history of education investments in these states. On a similar note, while primary
education policy is typically made at the state level, there is often important variation across
districts within a state based on historical as well as geographical factors (Banerjee and Iyer
2005; Iyer 2010). Thus, specifications with district fixed effects that are identified using only
within-district variation are least likely to be confounded by omitted variables correlated with
historical or geographical factors. However, there may still be important omitted variables
across villages (such as the level of interest in education in the community) that are correlated
with both measured quality of schools and teachers as well as teacher absence. We therefore
present the correlations in Table 4 for completeness and focus our discussion on the panel
regressions presented in Table 5.
Without any fixed effects, teachers who have formal training, who are paid more regularly,
who are eligible for recognition schemes, and who are in schools with better infrastructure are
less likely to be absent (Table 4 – Column 2 and 5). However, none of these correlations are
significant with state or district fixed effects suggesting that states that have a longer history of
investing in education may have better indicators of school and teacher quality, and also lower
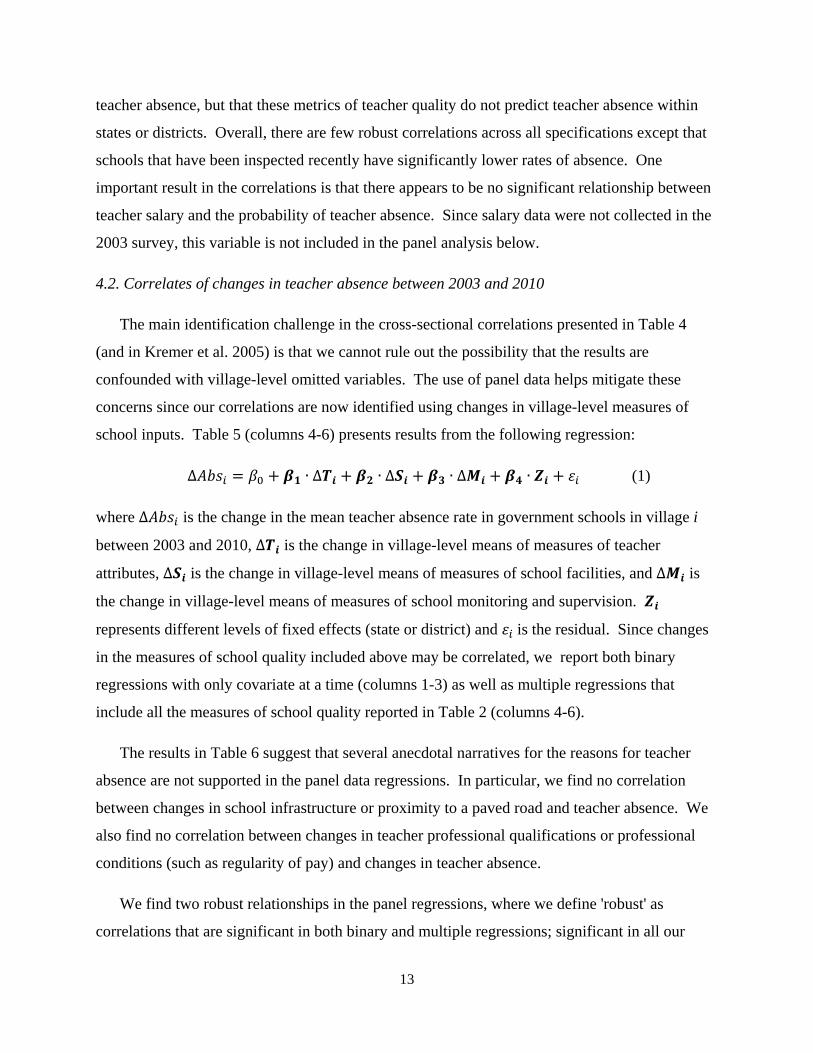
13
teacher absence, but that these metrics of teacher quality do not predict teacher absence within
states or districts. Overall, there are few robust correlations across all specifications except that
schools that have been inspected recently have significantly lower rates of absence. One
important result in the correlations is that there appears to be no significant relationship between
teacher salary and the probability of teacher absence. Since salary data were not collected in the
2003 survey, this variable is not included in the panel analysis below.
4.2. Correlates of changes in teacher absence between 2003 and 2010
The main identification challenge in the cross-sectional correlations presented in Table 4
(and in Kremer et al. 2005) is that we cannot rule out the possibility that the results are
confounded with village-level omitted variables. The use of panel data helps mitigate these
concerns since our correlations are now identified using changes in village-level measures of
school inputs. Table 5 (columns 4-6) presents results from the following regression:
∆ ∙ ∆ ∙ ∆ ∙ ∆ ∙ (1)
where ∆ is the change in the mean teacher absence rate in government schools in village i
between 2003 and 2010, ∆ is the change in village-level means of measures of teacher
attributes, ∆ is the change in village-level means of measures of school facilities, and ∆ is
the change in village-level means of measures of school monitoring and supervision.
represents different levels of fixed effects (state or district) and is the residual. Since changes
in the measures of school quality included above may be correlated, we report both binary
regressions with only covariate at a time (columns 1-3) as well as multiple regressions that
include all the measures of school quality reported in Table 2 (columns 4-6).
The results in Table 6 suggest that several anecdotal narratives for the reasons for teacher
absence are not supported in the panel data regressions. In particular, we find no correlation
between changes in school infrastructure or proximity to a paved road and teacher absence. We
also find no correlation between changes in teacher professional qualifications or professional
conditions (such as regularity of pay) and changes in teacher absence.
We find two robust relationships in the panel regressions, where we define 'robust' as
correlations that are significant in both binary and multiple regressions; significant in all our

14
three main specifications (no fixed effects, state fixed effects, and district fixed effects) and
consistent across all these specifications (we cannot reject that the estimates are the same across
all these specifications).
First, villages that saw a reduction in pupil-teacher ratio (PTR)16 have significantly higher
rates of teacher absence. This is a potentially counterintuitive result because a common narrative
for teacher absence is that their working conditions are poor, with high PTR's cited as a
prominent example of burdensome working conditions. However, the most common outcome
for students when their teacher is absent is that they are combined with other classes (typically
from other grades) whose teachers are present.17 Our results therefore suggest that having more
teachers may make it easier for teachers to be absent (since other teachers can handle their class),
and that the impact of hiring additional teachers may be partially offset through increased teacher
absence. The estimates suggest that a 10 percent reduction in PTR is correlated with a 0.5
percent increase in average teacher absence.
The estimates remain stable when we include state and district fixed effects, and are
unchanged even when we introduce a full set of controls (also measured in changes). These
results are consistent with the hypothesis that the relationship is causal. Some identification
challenges in a cross-section are less salient in the panel. Decisions on teacher placement are
largely based on administrative criteria of whether schools are above or below the PTR norms
and are unlikely to be correlated with contemporaneous changes in teacher absence.18 Indeed, a
causal relationship between increased teacher hiring and increased absence of existing teachers
has been established experimentally in other low-income countries, such as Kenya (Duflo,
Dupas, and Kremer 2012) and India (Muralidharan and Sundararaman 2013). Our estimates
provide complementary evidence and greater external validity to these experimental results and
16 We focus on the school-level pupil-teacher ratio (PTR) because the policy goals for teacher hiring are stated in terms of PTR. But in practical terms, lowering PTR is equivalent to lowering class-sizes. 17 Doing so does not deviate from the norm in the context of rural Indian government-run primary schools because close to 80 percent of schools practice multi-grade teaching (where one teacher simultaneously teaches students across multiple grades at the same time in the same classroom) in any case. Multi-grade teaching in turn is necessitated by the policy priority placed on primary school access. Thus, while most habitations in India now have a primary school within a radius of one kilometer, many of them are 'sub-scale' with enrollment of less than 100 students across five grades, which in turn necessitates multi-grade teaching since the PTR norms are typically between 30:1 to 40:1 (varies by state). These calculations are based on the same survey data used for this paper. 18 The most likely omitted variable concern would in fact go the other way. If communities that cared more about education were more likely to be able to get additional teachers, they would also be more likely to ensure better teacher attendance, suggesting that our results may be a lower bound on the magnitude of this effect.

15
suggest that they generalize to nationally scaled-up programs of reducing class sizes by hiring
more teachers in contexts with weak teacher accountability.
The second robust result in the panel data estimates is the strong negative correlation
between improved school monitoring and teacher absence. In each of the three visits to a school,
enumerators record the date of the most recent inspection and we average across the three visits
to construct the "Inspected in last 3 months" variable which ranges from zero (not inspected in
the prior three months in any of the three visits) to one (inspected in the prior three months in all
of the three visits). The results suggest that villages where the probability of inspection in the
past three months increased from zero to one had a reduction in average teacher absence of
between 8.2 percent (with no fixed effects and no controls) and 6.4 percent (district fixed effects
and a full set of controls). The estimates are remarkably consistent across all 6 specifications,
and even the most conservative estimate suggests that teacher absence rates in schools that are
regularly inspected are over 25 percent lower than in schools that are not.
To further check for patterns in the data that could support a causal interpretation of this
result, Table 6 breaks down the dependent variable (teacher absence) by the various categories of
stated reasons for absence ("absence due to being on official duty", "absence due to being on
authorized leave" and "unauthorized absence"), and shows the coefficient on the "inspections"
variable on each of these dependent variables. Panel A shows the cross-section estimates
(corresponding to Table 4) while Panel B shows the panel ones (corresponding to Table 5).
Increases in inspections are mostly correlated with reductions in unauthorized teacher absences,
whereas there is no significant relationship between inspections and reductions in teacher
absence due to either official duty or authorized leave.19 These results are consistent with the
interpretation that improved 'top down' administrative monitoring can have a significant and
substantial impact on reducing unauthorized teacher absence.
In contrast, there is little evidence that increases in 'bottom up' monitoring by the community
(measured by whether the PTA had met in the past 3 months) are correlated with reductions in
19 The point estimates on these categories suggest that increasing inspections may reduce the fraction of teacher absence that is recorded as "official duty" and increase the fraction that is recorded as "authorized leave". These results are consistent with head teachers and teachers colluding to some extent to record absences as being due to official duty that do not count against a teacher's quota of authorized leave. Increased inspections may make it difficult to sustain this collusion (since the inspector will be able to verify if the teacher is away on official duty) and require more of the absences to be counted against a teacher's official leave quota.

16
teacher absence (Table 5). This is consistent with the experimental results reported in Olken
(2007) on the impacts of monitoring corruption in Indonesia. These results should not be
interpreted as suggesting that bottom-up monitoring cannot be effective, since it is also likely
that they reflect differences in the effective authority over teachers possessed by administrative
superiors (high) and parents (low). PTAs in India typically do not have any authority on
appointment or retention of regular civil-service teachers and cannot sanction teachers for
absence or non-performance. Inspectors and administrative superiors, on the other hand, do
possess considerable authority over teachers, including the ability to demand explanations for
absence, to make adverse entries in their performance record, and in extreme cases to initiate
disciplinary proceedings. These actions do not take place very often, but the administrative rules
provide inspectors with the powers to take these actions, whereas PTAs do not have any such
powers. 20
As in the case of the changes in PTR, the stability of the estimates of the correlations
between increases in inspection frequency and reduction in teacher absence to the introduction of
state and district fixed effects as well as a full set of controls helps mitigate concerns about
omitted variables bias. To further address identification concerns, we examine the extent to
which changes in inspection frequency can be explained by other observables (Table 7). There
are no correlations between changes in inspections and changes in other measures of school
quality that are significant across our three standard specifications. Finally, these results are also
consistent with experimental evidence from India that finds significant reduction in teacher
absence in response to improved monitoring and professional consequences that are linked to
better attendance (Duflo, Hanna, and Ryan 2012). Since the experimental study was carried out
in a small sample of informal schools in one state in India, our estimates using a nationally-
representative panel dataset of rural public schools provides complementary evidence on the role
of improved monitoring on reducing teacher absence.
20 The low frequency of formal action against teachers (in spite of high observed absence rates) may suggest that the inspection system is not very effective. It can be costly for an inspector to take action given pressure from unions and the administrative procedures that need to be followed. Qualitative evidence from field interviews suggest that an important channel of the deterrence effect of increased inspections on teacher absence may be that inspectors can often extract informal payments from teachers who are found to be absent in return for not making an adverse entry on their record. Social norms would make it difficult to 'extort' such payments from teachers who are actually present, but it would be much easier to demand a payment from an absent teacher. Thus, even if the actual incidence of disciplinary action is low, there may be other channels through which more frequent inspections serve as a disincentive for teacher absence.

17
In interpreting the result on school inspections, it is useful to consider why there might be
variation in the frequency of inspections across villages in a district and what this would imply
for interpreting the results causally. One obvious explanation is that inspectors are more likely to
visit villages that are more accessible, but the data do not support this hypothesis since there is
no correlation between changes in proximity/remoteness to facilities and changes in inspection
rates (Table 7).
Qualitative interviews on school governance in India conducted at the district level suggest
two important sources of variation (Center for Policy Research 2012).21 The first is staffing.
Districts are broken down further into administrative blocks,22 and schools within blocks are
organized into clusters. School supervision is typically conducted by "block education officers"
and "cluster resource coordinators". We find that a significant fraction of these posts are often
unfilled. For instance, in 19 percent of the cases (where we have data) even the position of the
"District Education Officer (DEO)", the senior-most education official in a district, was vacant.
Further, there is high turnover in education administration (the average DEO had a tenure in
office of just one year) creating periods when the positions are vacant during transitions. Our
interviews suggest that similar staffing gaps at the block and cluster level are the most important
source of variation in inspection frequency within districts, since blocks and clusters without
supervisory staff are much less likely to get inspected.
The second source of variation in inspections is the diligence of the concerned supervisory
officer. Even if all the positions of block and cluster-level administrative staff were filled, there
would be variation in the zealousness with which these officers visited villages/schools, which
might lead to some areas being inspected more often than others based on whether they were in
the coverage area of a more diligent officer or not. However, variation in inspection frequency
that is driven by inspector-level unobservable characteristics is unlikely to be correlated with
other village-level characteristics that are also correlated with absence (and as a result, the
21 This module was designed to complement the school surveys by allowing us to create quantitative estimates of measures of district-level education governance. Unfortunately, non-completion rates for these interviews was very high (over 40 percent) due to non-availability and non-response of district-level administrators. Since this non-response is clearly not random, we do not use the quantitative measures in regressions. Also, the interviews only cover staffing questions at the district level and not the sub-district level, which would be needed if we wanted to use them as regressors. Nevertheless, important qualitative insights can be obtained from these interview transcripts. These results are summarized in a companion policy report (Center for Policy Research 2012). 22 The size of blocks varies by state, but a typical number is 10-15 blocks per district.

18
estimated coefficients on “inspected in the last 3 months” are unlikely to be biased). Of course,
this source of variation in inspection frequency has implications for thinking about the
effectiveness of hiring new staff. We discuss this issue in section 5.4.
4.3. Correlates of changes in student outcomes
While the focus of our analysis has been on teacher absence, we also briefly consider the
extent to which the improvements in school quality described in Table 2 are correlated with
learning outcomes. Table 8 presents panel regressions of the form in equation (1), where
changes in normalized mean math test scores at the village level are regressed on changes at the
village-level, including teacher absence, school facilities, and monitoring. The only variables
that are significantly correlated with changes in test scores are changes in mean parental
education and changes in the fraction of students taking private tuition. School-level variables
are not consistently significant though higher PTR's and higher teacher absence are both
correlated with lower test scores (and significant in some specifications). However, there is no
positive correlation between the improvements in most of the standard measures of school
quality and student learning outcomes - including school infrastructure, mid-day meals, and
teacher qualifications and training.
We only treat these results as suggestive because the data (with a seven-year gap in mean
village-level test scores) is not ideal for testing the impact of school characteristics on test scores.
The ideal specifications would use annual panel data on student test scores matched to these
characteristics and estimate value-added models of student learning. Nevertheless, the main
findings here are consistent with those in studies set in India using data sets that are better suited
to study student learning outcomes that find that teacher absences significantly hurt student
learning, and that school infrastructure, teacher qualifications, and training certification are not
correlated with improved student learning.23 Thus, while the majority of the education budget is
23 Duflo et al (2012) show experimentally that lower teacher absence raises test scores, while Muralidharan (2012) shows this in value-added estimates with five years of annual panel data on test scores in the state of Andhra Pradesh matched with the absence rate of the teacher of each student that year. Das et al. (2007) show that high teacher absences in Zambia (mainly due to teachers falling sick) lead to significantly lower student test score gains. While not explicitly focusing on the impact of school infrastructure and teacher qualifications on learning outcomes, Muralidharan (2012) also shows that these are not correlated in the control schools (which represent the 'business as usual' scenario).

19
allocated to improving traditional input-based measures of school quality, these appear to not
matter for learning outcomes as much as teacher attendance and effort.24
5. The Fiscal Cost of Weak Governance
5.1. The fiscal cost of teacher absence
High levels of teacher absence translate into considerable waste of public money since
teacher salaries are the largest component of education spending in most countries, including
India.25 Calculating these fiscal costs requires us to estimate and exclude the extent of
legitimate absence from our calculations. As part of the institutional background work for this
project, we obtained teacher policy documents from several states across India. Analysis of these
documents indicates that the annual allowance for personal and sick leave is 5 percent on
average across states. This is close to the survey estimate of 5.9 percent (Table 3), but we use
the official data since the stated reasons may be over-reported.
Estimating the extent of legitimate absence due to ‘official duty’ (outside the school) is
harder because there are no standard figures for the ‘expected’ level of teacher absence for
official duties. Policy norms prescribe minimal disruption to teachers during the school day and
typically stipulate that meetings and trainings be carried out on non-school days or outside
school hours. The figures in Table 3 for the fraction of absences that are claimed to be due to
“official duty” are therefore likely an overestimate. Since we are not able to verify the claim that
teachers were on official duty, and since there is evidence that head teachers may try to cover up
for teacher absences by claiming that these are due to ‘official duties’, our default estimate treats
half of these cases as legitimate. This gives us a base case of legitimate absence of 8 percent (5
percent authorized leave, and 3 percent official duty). We also consider a more conservative
case where the legitimate rate of absence is 10 percent. This 8-10 percent range of legitimate
absence also makes sense because the fraction of teacher observations that are classified as either
‘authorized leave’ or ‘official duty” is in this range for the five states with the lowest overall
absence rates – even treating the stated reasons for absence as being fully true (tables available
on request).
24 See Waldinger (2012) for an interesting parallel in the context of post-World War II higher education in Germany. 25 This waste is especially costly in developing countries because they typically have low tax/GDP ratios and hence face greater fiscal constraints on mobilizing resources for public investment.

20
To estimate the fiscal cost of teacher absence, we use teacher salary data from our surveys
and use administrative (DISE) data on the total number of primary school teachers by state (these
are summarized by state in columns 1 and 2 of Table 9).26 We provide three estimates of the
fiscal cost of teacher absence in columns 3 to 5 of Table 9 (based on assuming the rate of
legitimate teacher absence to be 8, 9, and 10 percent respectively), and these calculations suggest
that the annual fiscal cost of teacher absence is around Rs. 80 to 92 billion (1.4 – 1.6 billion US
dollars/year).
5.2. Calculating the returns to better governance in education
The panel data regressions presented in Table 5-7 suggest that of all the investments made in
improving school quality in the period from 2003 to 2010, the only one that had a significant
impact on reducing absence was increased administrative monitoring and supervision. In this
section, we calculate the returns to a marginal increase in the probability of a school being
inspected. We make the following assumptions: (a) enough inspectors are hired to increase the
probability of a school being inspected in the past 3 months by 10 percentage points (relative to a
current probability of 58 percent); (b) increasing inspection probability by 10 percentage points
would reduce mean teacher absence across the schools in a village by 0.64 percentage points
(this is based on the most conservative estimate of the correlation between increased inspection
probability and reduced teacher absence from Table 5); (c) the full cost (salary and travel) of an
inspector is 2.8 times that of a teacher; (d) an inspector works 200 days per year and can cover 2
schools per day. 27
The results of this estimation are presented in Table 10 and we see in column 3 that the cost
of hiring enough inspectors to increase the probability of a school being inspected by 10
percentage points is Rs. 448 million/year. However, the reduction in wasted salary from this
26 The salary figures in our surveys do not include the fiscal cost of the benefits provided to civil service teachers. Imputing the value of these benefits is difficult for the majority of teachers who are on a defined benefits pension program. However, newer cohorts of government employees are covered by a (less generous) defined contribution retirement program where the government contributes 10% of pay to a retirement account. We use this conservative estimate and add 10% to the average salary figures. No adjustment is made for medical benefits. 27 We use DISE data on the number of schools in each state to calculate the number of inspectors who will be required to increase the probability of inspections in a 3-month interval by 10 percentage points. The cost estimates are conservative and assume that the salary costs are double that of a teacher and that the travel costs are equal to 80 percent of a full months’ salary (which is higher than the typical travel and daily allowance provided to education department employees to travel to/from a village to district headquarters).

21
investment in terms of reduced teacher absence amounts to Rs. 4.5 billion/year, suggesting that
the returns to investing in better governance are ten times greater than the cost. Thus, improving
school governance by hiring enough staff to increase the frequency of monitoring could be a
highly cost-effective investment (on the current margin).
5.3. Hiring more inspectors vs. more teachers
Column 5 of Table 10 calculates the extent to which the EPTR can be reduced by hiring
enough inspectors to increase the probability that a school was inspected in the past three months
by 10 percentage points (the same amount used in the calculations in the previous section). To
compare the relative cost effectiveness of hiring more inspectors versus hiring more teachers, we
calculate the salary cost of hiring more teachers to achieve the same reduction in EPTR and
report these numbers in column 6. Comparing columns 3 and 6, we see that hiring more
inspectors would be 12.8 times more cost effective at reducing EPTR than doing so by hiring
more teachers. The difference between the estimates in columns 4 and 6 stems from accounting
for the fact that hiring more teachers will increase the absence rates of the existing teachers,
which is the other robust result in the panel regressions presented in Table 5 (again, we use the
most conservative estimate). Thus, the estimates in column 6 account for the fact that the
marginal rate of absence from hiring an extra teacher is higher than the average absence rate (as
in Niehaus and Sukhtankar 2013).
5.4. Policy Implications
The difference in the relative cost effectiveness of the two policy options is large enough
(greater than a factor of 10), that the policy recommendation of hiring more inspectors would be
unchanged even if the inspectors were to work less efficiently than assumed in these
calculations. For instance, if inspectors were absent at the same rate as teachers (say 25 percent),
allocating marginal funds to hire an additional inspector would still be over nine times more cost
effective at reducing EPTR than using those funds to hire an additional teacher. At the same
time, our estimates are based on correlations and may not be convincing enough to warrant a
universal scale up. However, as we show below, our results are strong enough to at least
recommend a substantial expansion of school inspections in the context of a large experimental
evaluation.

22
Formally, consider a simple binary policy regarding the number of inspectors to be hired that
can take the values {0, 1}; where the current policy is {0}; and {1} represents a ‘new’ policy of
hiring enough inspectors to ensure that all schools are inspected once in three months. The costs
of the new policy are the additional salary and operational costs of hiring inspectors and the
benefits are the reduced fiscal cost of teacher absence. Denote these by C{1} and B{1}
respectively, and assume that it is optimal to implement the policy if B{1} > C{1}. However,
while C{1} is known, there is uncertainty around B{1} and thus a randomized trial in the context
of a policy movement towards {1} would reduce the uncertainty around B{1}.
Suppose that after the conduct of the trial, the likelihood that the optimal policy switches
from {0} to {1} is p and that the expected per-period benefit of such a switch is q. Denote the
cost of data collection and analysis of a trial as C{data} and let the discount rate be r. Let the
period of the trial be one year; let the fraction of the population participating in the trial be N and
assume that half of those in the trial are allocated to a treatment group and the other half to a
control group. Since data collection will be based on a representative sample of trial sites
(whose size will be determined based on power calculations), we assume that C{data} does not
vary with the size of the trial. The one period cost of the trial is then C{data} + (N/2)*C{1}. The
benefits of the trial are the expected one-period benefit of the new policy (during the trial) and
the discounted benefits of switching to a new policy (in perpetuity), weighted by the probability
that the trial will lead to a switch in the policy. Thus, the trial should be conducted as long as:
C{data} + (N/2)*C{1} < (N/2)*B{1}+ [{1/(1-r)}pq] * [1/(1+r)].
To focus on the benefits of learning if the optimal policy should be {1} instead of {0}, we
abstract away from the benefit of the policy during the trial period and the one-period delay in
implementing the new policy (if found to be optimal), in which case the trial should be
conducted as long as:
C{data} + (N/2)*C{1} < [{1/(1-r)}pq].
Using our results to calibrate these quantities, it is straightforward to see that the expected
benefits of a trial are very large even under extremely conservative assumptions. The estimates
in table 10 suggest that the marginal cost of {1} would be $33 million and that the marginal

23
benefit would be $331 million (using our panel data estimates).28 Thus, if our estimates are true,
q would be around $300 million/year, and using a discount rate of 10%, the net present value of
moving to {1} would be $3 billion. Now suppose there is only a 1 in 10 chance that the causal
impacts of inspections on teacher absence are as great as the panel data estimates presented here
and that there is a 9 in 10 chance that the causal impacts of inspection are not significantly
different from zero (i.e. p = 0.1). Even then, we see that [{1/(1-r)}pq] is $300 million.
On the cost side, we conservatively estimate (using data from our own field costs) that a
highly-powered trial would have C{data} $ 0.5 to 1 million (depending on whether we use our
existing data as a baseline or collect a new baseline). A trial with an N of 0.06 would be a very
large trial and could cover a nationally-representative sample across all major Indian states, but
would only cost $ 1 million/year.29 Thus, even including all costs of data collection, the upper
bound of the costs of such a trial would be $2 million compared to a likely lower-bound expected
benefit of $300 million.30 An expansion of school inspections in the context of an experimental
evaluation would therefore make sense even if there was only a 1% chance of the true effects
being the same as our panel-data estimates.31
28 The estimates in Table 10 are based on hiring enough inspectors to increase the probability of a school being inspected in the previous 3 months by 10 percentage points. Since the current probability of a school being inspected in the previous 3 months is 56 percent (Table 1), we scale up the estimates in Table 10 by a factor of 4.4 since moving to {1} would imply that the other 44 percent of schools should also be inspected. We use an exchange rate of 1 US Dollar equals 60 Indian Rupees. 29 India has around 600,000 villages, 44% of which would be 264,000 villages. An N of 0.06 with half the sample getting the treatment would imply that an additional 7900 villages would be treated (3% of 264,000), which would be a very large trial by the standards of most experiments. Since covering all the remaining 264,000 villages is estimated to cost $33 million, the cost of covering 3% of the villages would be $1 million. 30 Note that we use extremely conservative estimates for p assigning only a 10 percent probability of true estimates as large as our panel-data based estimates and assigning the rest of the 90 percent probability to finding a zero effect. If we were to assign a uniform distribution of likely point estimates between zero and our panel-data estimates (this is also conservative because we would not assign any probability to the true estimate being larger than the panel-data estimate), the expected benefit would be even larger. 31 If we use a medical ethics perspective in this setting, we also need to consider the costs of not providing a treatment that is known (or highly likely) to be effective. In this case, that would be the foregone one-period benefit of scaling up the treatment immediately. However, since the main benefit in our calculations above is the net present value of learning and adopting the ‘better’ policy, a prior belief that the treatment is more effective would still yield an optimal policy of conducting an experimental evaluation, but with a large N and with a greater fraction than 50% being assigned to the treatment group (while only ‘denying’ treatment to a smaller control group to enable the evaluation).,

24
6. Conclusion
The central and state governments in India have considerably increased spending on primary
education over the past decade. We contribute towards understanding the impact of these
substantial nationwide investments in primary education in India by constructing a unique
nationally-representative panel data set on education quality in rural India. We find that there
has been a substantial improvement in several measures of school quality including
infrastructure, pupil-teacher ratios, and monitoring. However, teacher absence rates continue to
be high, with 23.7 percent of teachers in public schools across rural India being absent during
unannounced visits to schools.
Using village-level panel data, we find no correlation between improved school infrastructure
and other measures of working conditions on teacher absence. We do find two robust
correlations in the panel data that provide external validity in nationally-representative data to
results established in smaller-scale experiments. First, reductions in pupil-teacher ratios are
strongly correlated with increased teacher absence, suggesting that the impact of hiring
additional teachers on education outcomes may be partly offset by increased shirking among
existing teachers. Second, increases in the frequency of inspections are strongly correlated with
lower teacher absence, suggesting that of all the investments in improving school quality, the one
that was most effective in reducing teacher absence was improved administrative monitoring of
schools and teachers. We calculate that the fiscal cost of teacher absence is over $1.5 billion per
year, and estimate that investing in improved governance by increasing the frequency of
monitoring would be over twelve times more cost effective at increasing student-teacher contact
time than doing so by hiring additional teachers.
In interpreting our results, it may be useful to think of the performance of the education
system as comprising two components – those that are more easily measured and monitored
(such as school infrastructure, and class size), and those where this is more difficult (such as
teacher performance). Our panel data suggest that the Indian state has made significant progress
on the former, but made less progress on the latter. Using a growth accounting perspective, we
see that the reduction in teacher absence observed between 2003 and 2010 is exactly in line with
what we would expect from the growth in per-capita income that has taken place during this
period. This is consistent with the growth in income enabling an expansion of a broad range of
25
inputs into education that was for the most part a proportional increase along existing spending
patterns (uninformed by empirical research on the relative effectiveness of different inputs in
reducing teacher absence). On the other hand, improving the TFP of public spending (or
‘governance’) to achieve a greater reduction in teacher absence for a given level of GDP/capita
would require a strategic reallocation of spending to programs that are more effective..
Our results suggest that a promising way of improving school governance and achieving such
a reallocation of resources, would be to simply expand the existing system of administrative
monitoring of teachers and schools by hiring more supervisory staff. Our calculations indicate
that such an expansion could (on the current margin) have a significant impact on reducing
teacher absence, and that this would be highly cost effective in terms of reducing the fiscal cost
of weak governance. More broadly, our results suggest that the returns to investing in state
capacity to better monitor the implementation of social programs in developing countries may be
quite high, and that at the very least there is a strong case for expanding such programs in the
context of large experimental evaluations of "as is" implementation to obtain more precise
estimates of their benefits.32
References:
BANDIERA, O., A. PRAT, and T. VALLETTI (2009): "Active and Passive Waste in Government Spending: Evidence from a Policy Experiment," American Economic Review, 99, 1278-1308.
BANERJEE, A., and L. IYER (2005): "History, Institutions, and Economic Performance: The Legacy of Colonial Land Tenure Systems in India," American Economic Review, 95, 1190-1213.
BESLEY, T., and T. PERSSON (2009): "The Origins of State Capacity: Property Rights, Taxation, and Politics," American Economic Review, 99, 1218-44.
CHAUDHURY, N., J. HAMMER, M. KREMER, K. MURALIDHARAN, and F. H. ROGERS (2006): "Missing in Action: Teacher and Health Worker Absence in Developing Countries," Journal of Economic Perspectives, 20, 91-116.
CPR (2012): "Quality of Education in Rural India (Queri): Governance Report," New Delhi: Center for Policy Research.
DAS, J., S. DERCON, J. HABYARIMANA, and P. KRISHNAN (2007): "Teacher Shocks and Student Learning: Evidence from Zambia," Journal of Human Resources, 42, 820-862.
32 Muralidharan, Niehaus, and Sukhtankar (2013) is an example of just such an experimental evaluation, in the context of an ambitious initiative by the Government of Andhra Pradesh to improve governance in public welfare programs through biometric authentication of beneficiaries.

26
DUFLO, E., P. DUPAS, and M. KREMER (2012): "School Governance, Teacher Incentives, and Pupil-Teacher Ratios: Experimental Evidence from Kenyan Primary Schools," National Bureau of Economic Research. Working Paper 17939.
DUFLO, E., R. HANNA, and S. RYAN (2012): "Incentives Work: Getting Teachers to Come to School," American Economic Review, 102, 1241-78.
IYER, L. (2010): "Direct Versus Indirect Colonial Rule in India: Long-Term Consequences," Review of Economics and Statistics, 92, 693-713.
KREMER, M., K. MURALIDHARAN, N. CHAUDHURY, F. H. ROGERS, and J. HAMMER (2005): "Teacher Absence in India: A Snapshot," Journal of the European Economic Association, 3, 658-67.
MURALIDHARAN, K. (2012): "Long Term Effects of Teacher Performance Pay: Experimental Evidence from India," UC San Diego.
MURALIDHARAN, K., P. NIEHAUS, and S. SUKHTANKAR (2013): "Biometric Authentication and Public Sector Performance," UC San Diego.
MURALIDHARAN, K., and V. SUNDARARAMAN (2010): "The Impact of Diagnostic Feedback to Teachers on Student Learning: Experimental Evidence from India," Economic Journal, 120, F187-F203.
— (2011): "Teacher Performance Pay: Experimental Evidence from India," Journal of Political Economy, 119, 39-77.
— (2013): "Contract Teachers: Experimental Evidence from India," UC San Diego. NIEHAUS, P., and S. SUKHTANKAR (2013): "The Marginal Rate of Corruption in Public
Programs: Evidence from India," UC San Diego. OLKEN, B. (2007): "Monitoring Corruption: Evidence from a Field Experiment in Indonesia,"
Journal of Political Economy, 115, 200-249. WALDINGER, F. (2012): "Bombs, Brains, and Science: The Role of Human and Physical Capital
for the Creation of Scientific Knowledge," University of Warwick. WORLD BANK (2003): World Development Report 2004: Making Services Work for Poor
People. Washington, DC: Oxford University Press for the World Bank. ZAMBONI, Y., and S. LITSCHIG (2013): "Audit Risk and Rent Extraction: Evidence from a
Randomized Evaluation in Brazil," Universitat Pompeu Fabra.

DifferenceYear 2003 Year 2010 (Ho: No diff)
TEACHER VARIABLESHave bachelors degree 0.41 0.58 0.174***Have teacher training 0.77 0.68 -0.085***Are contract teachers 0.06 0.30 0.233***Are paid regularly 0.49 0.78 0.285***Recognition scheme exists 0.50 0.81 0.309***
SCHOOL VARIABLESPupil-teacher ratio (PTR) 47.19 39.80 -7.388***Mid-day meals 0.22 0.79 0.576***Infrastructure index (0-4) 2.14 3.35 1.205***
Has drinking water 0.80 0.96 0.160***Has toilets 0.40 0.84 0.440***Has electricity 0.22 0.45 0.236***Has library 0.51 0.69 0.183***
Road is within 1km 0.69 0.78 0.092***Inspected in last 3 months 0.38 0.56 0.176***Inspected in last 2 months 0.31 0.50 0.189***Inspected in last 1 month 0.22 0.38 0.155***PTA met in last 3 months 0.30 0.45 0.153***Mean parental education (1-7 scale) 2.03 2.43 0.394***State per-capita GDP (thousands of Rs.) 14.74 30.21 15.473***Notes:
2) Pupil-teacher ratio is weighted by SCR school enrolment3) Data for number of days since inspection and truncated at 99th percentile4) State per-capita GDP figures are in 2004-2005 prices; obtained from Central Statistical Organization, India5) *** Significant at 1%, ** Significant at 5%, * Significant at 10%
Table 1. Changes in Key Variables Between 2003 and 2010, Village-Level Data
Summary Statistics
MONITORING & COMMUNITY VARIABLES
1) Summary statistics (except PTR) are weighted by rural population of Socio-Cultural Regions (SCRs) in Census 2001

Year 2003 Year 2010 Change Year 2003 Year 2010 Change Year 2003 Year 2010 Change
Andhra Pradesh 23.38 21.48 -1.90 27.51 25.79 -1.71 35.90 32.85 -3.05Assam 36.15 26.26 -9.89*** 28.21 36.07 7.86*** 44.18 48.92 4.74Bihar 39.42 28.69 -10.73*** 72.44 69.01 -3.43 119.57 96.78 -22.79Chattisgarh 30.47 14.20 -16.28*** 42.12 33.05 -9.07*** 60.59 38.52 -22.07Gujarat 17.92 16.14 -1.77* 40.42 31.94 -8.48*** 49.24 38.09 -11.15Haryana 21.07 17.75 -3.31** 34.40 36.34 1.94 43.58 44.18 0.60Himachal Pradesh 22.67 30.74 8.07*** 18.04 21.73 3.69** 23.33 31.38 8.04Jharkhand 43.50 45.84 2.34 52.30 42.84 -9.47*** 92.57 79.09 -13.48Karnataka 22.60 23.93 1.33 29.07 23.62 -5.45*** 37.56 31.05 -6.51Kerala 19.60 15.79 -3.81*** 24.84 24.49 -0.36 30.90 29.08 -1.82Madhya Pradesh 18.19 26.34 8.16*** 37.19 46.57 9.39*** 45.45 63.23 17.78Maharastra 15.43 14.12 -1.31 34.54 28.66 -5.88*** 40.84 33.38 -7.47Orissa 21.69 14.24 -7.46*** 47.01 36.63 -10.38*** 60.04 42.72 -17.32Punjab 36.66 13.54 -23.13*** 30.80 31.43 0.63 48.63 36.36 -12.28Rajasthan 25.13 22.72 -2.42* 38.91 32.05 -6.86*** 51.97 41.47 -10.50Tamilnadu 20.43 12.92 -7.51*** 29.56 25.85 -3.71** 37.15 29.69 -7.47Uttar Pradesh 26.72 31.21 4.49*** 69.37 47.40 -21.97*** 94.66 68.90 -25.76Uttaranchal 32.29 21.02 -11.27*** 24.49 31.02 6.54** 36.17 39.28 3.12West Bengal 26.41 20.97 -5.44*** 58.23 41.61 -16.62*** 79.12 52.65 -26.47
India 26.29 23.64 -2.64*** 47.19 39.80 -7.39*** 64.02 52.13 -11.89Notes:1) All figures are weighted by SCR's rural population2) The absence figures for 2003 differ slightly from the figures in the Kremer et al (2005) paper. This is because the urban schools are removed from the sample3) We do not conduct inference on the changes in "Effective Pupil-Teacher Ratio" because the data on total number of teachers are obtained from administrative (DISE) data4) *** Significant at 1%, ** Significant at 5%, * Significant at 10%
Table 2. Absence Rate of Teachers & Pupil-Teacher Ratios in Rural Public Schools by State by Year
Absence Rates (%) Pupil-Teacher Ratio Effective Pupil-Teacher Ratio
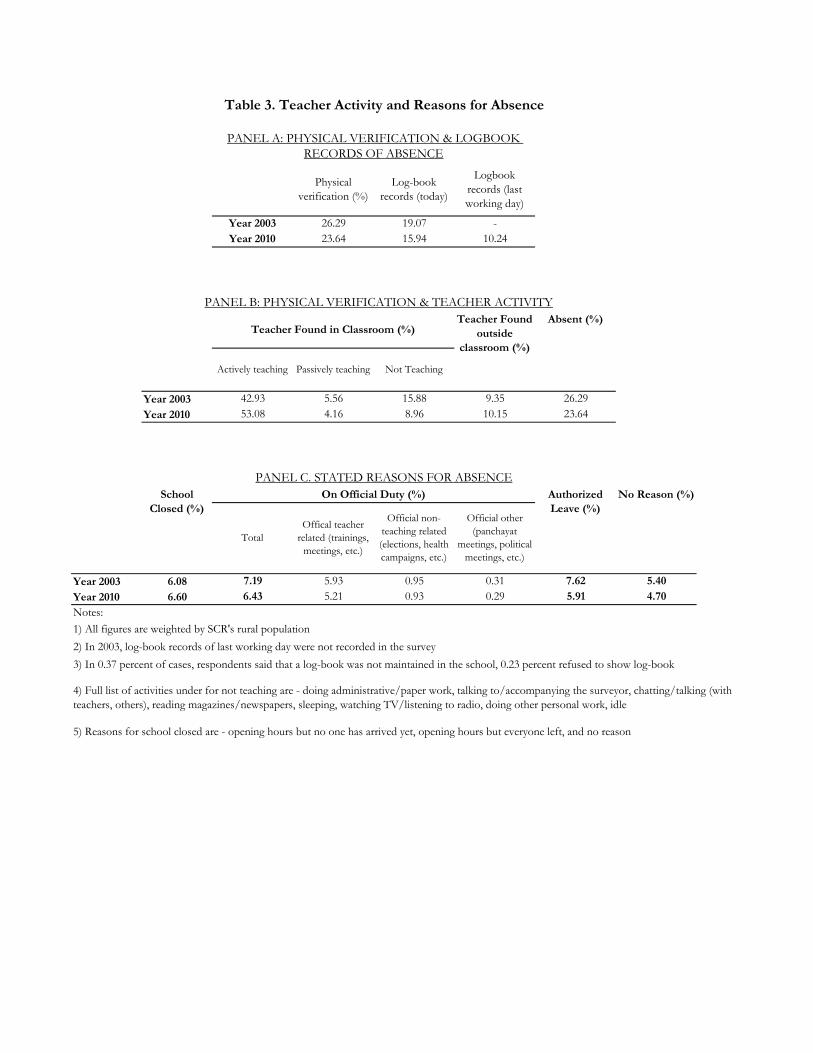
Year 2003Year 2010
Year 2003 6.08Year 2010 6.60Notes:1) All figures are weighted by SCR's rural population2) In 2003, log-book records of last working day were not recorded in the survey3) In 0.37 percent of cases, respondents said that a log-book was not maintained in the school, 0.23 percent refused to show log-book
5) Reasons for school closed are - opening hours but no one has arrived yet, opening hours but everyone left, and no reason
4) Full list of activities under for not teaching are - doing administrative/paper work, talking to/accompanying the surveyor, chatting/talking (with teachers, others), reading magazines/newspapers, sleeping, watching TV/listening to radio, doing other personal work, idle
0.29 5.917.62 5.40
4.706.435.935.21
0.950.93
4.165.5642.93
53.08
7.19
PANEL C. STATED REASONS FOR ABSENCESchool
Closed (%)On Official Duty (%) Authorized
Leave (%)No Reason (%)
TotalOffical teacher
related (trainings, meetings, etc.)
Official non-teaching related (elections, health campaigns, etc.)
Official other (panchayat
meetings, political meetings, etc.)
0.31
26.2923.6410.15
9.3515.888.96
Table 3. Teacher Activity and Reasons for Absence
PANEL A: PHYSICAL VERIFICATION & LOGBOOK RECORDS OF ABSENCE
Logbook records (last working day)
Log-book records (today)
Teacher Found in Classroom (%)Teacher Found
outside classroom (%)
Absent (%)
Actively teaching Passively teaching Not Teaching
PANEL B: PHYSICAL VERIFICATION & TEACHER ACTIVITY
-10.24
19.0715.94
Year 2003Year 2010
Physical verification (%)
26.2923.64
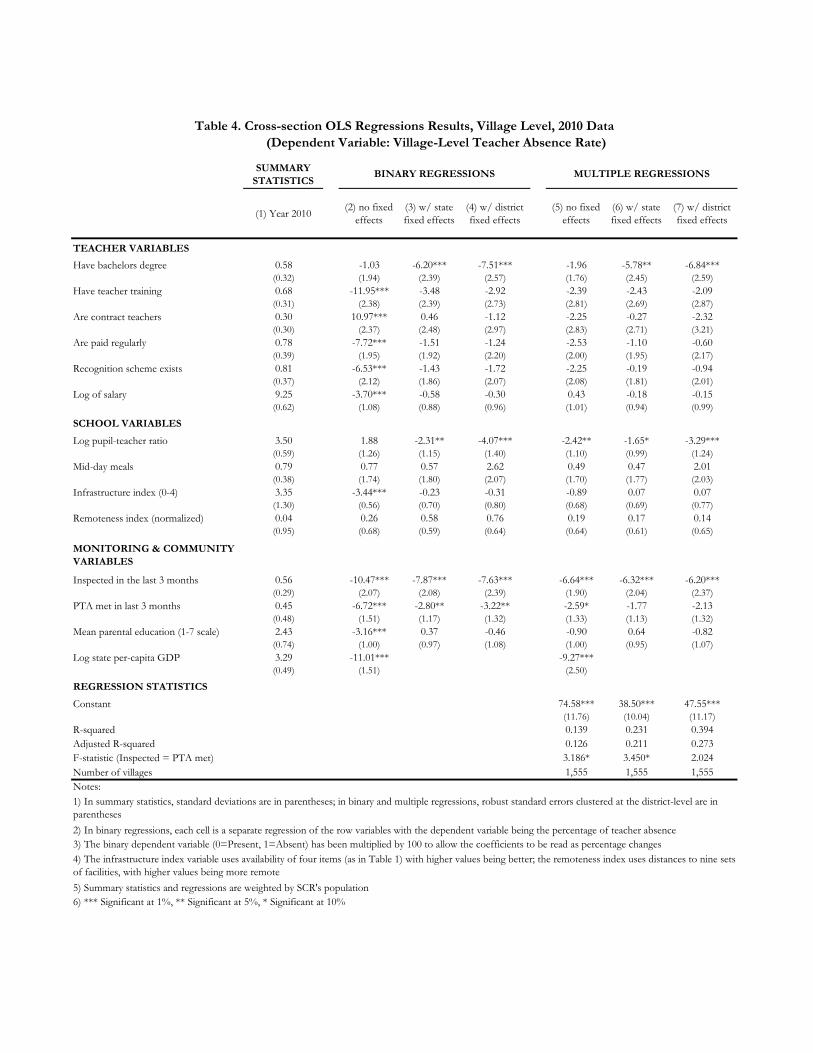
SUMMARY STATISTICS
(1) Year 2010 (2) no fixed effects
(3) w/ state fixed effects
(4) w/ district fixed effects
(5) no fixed effects
(6) w/ state fixed effects
(7) w/ district fixed effects
TEACHER VARIABLESHave bachelors degree 0.58 -1.03 -6.20*** -7.51*** -1.96 -5.78** -6.84***
(0.32) (1.94) (2.39) (2.57) (1.76) (2.45) (2.59)Have teacher training 0.68 -11.95*** -3.48 -2.92 -2.39 -2.43 -2.09
(0.31) (2.38) (2.39) (2.73) (2.81) (2.69) (2.87)Are contract teachers 0.30 10.97*** 0.46 -1.12 -2.25 -0.27 -2.32
(0.30) (2.37) (2.48) (2.97) (2.83) (2.71) (3.21)Are paid regularly 0.78 -7.72*** -1.51 -1.24 -2.53 -1.10 -0.60
(0.39) (1.95) (1.92) (2.20) (2.00) (1.95) (2.17)Recognition scheme exists 0.81 -6.53*** -1.43 -1.72 -2.25 -0.19 -0.94
(0.37) (2.12) (1.86) (2.07) (2.08) (1.81) (2.01)Log of salary 9.25 -3.70*** -0.58 -0.30 0.43 -0.18 -0.15
(0.62) (1.08) (0.88) (0.96) (1.01) (0.94) (0.99)
SCHOOL VARIABLES
Log pupil-teacher ratio 3.50 1.88 -2.31** -4.07*** -2.42** -1.65* -3.29***(0.59) (1.26) (1.15) (1.40) (1.10) (0.99) (1.24)
Mid-day meals 0.79 0.77 0.57 2.62 0.49 0.47 2.01(0.38) (1.74) (1.80) (2.07) (1.70) (1.77) (2.03)
Infrastructure index (0-4) 3.35 -3.44*** -0.23 -0.31 -0.89 0.07 0.07(1.30) (0.56) (0.70) (0.80) (0.68) (0.69) (0.77)
Remoteness index (normalized) 0.04 0.26 0.58 0.76 0.19 0.17 0.14(0.95) (0.68) (0.59) (0.64) (0.64) (0.61) (0.65)
MONITORING & COMMUNITY VARIABLES
Inspected in the last 3 months 0.56 -10.47*** -7.87*** -7.63*** -6.64*** -6.32*** -6.20***(0.29) (2.07) (2.08) (2.39) (1.90) (2.04) (2.37)
PTA met in last 3 months 0.45 -6.72*** -2.80** -3.22** -2.59* -1.77 -2.13(0.48) (1.51) (1.17) (1.32) (1.33) (1.13) (1.32)
Mean parental education (1-7 scale) 2.43 -3.16*** 0.37 -0.46 -0.90 0.64 -0.82(0.74) (1.00) (0.97) (1.08) (1.00) (0.95) (1.07)
Log state per-capita GDP 3.29 -11.01*** -9.27***(0.49) (1.51) (2.50)
REGRESSION STATISTICS
Constant 74.58*** 38.50*** 47.55***(11.76) (10.04) (11.17)
R-squared 0.139 0.231 0.394Adjusted R-squared 0.126 0.211 0.273F-statistic (Inspected = PTA met) 3.186* 3.450* 2.024Number of villages 1,555 1,555 1,555Notes:
2) In binary regressions, each cell is a separate regression of the row variables with the dependent variable being the percentage of teacher absence3) The binary dependent variable (0=Present, 1=Absent) has been multiplied by 100 to allow the coefficients to be read as percentage changes
5) Summary statistics and regressions are weighted by SCR's population6) *** Significant at 1%, ** Significant at 5%, * Significant at 10%
4) The infrastructure index variable uses availability of four items (as in Table 1) with higher values being better; the remoteness index uses distances to nine sets of facilities, with higher values being more remote
1) In summary statistics, standard deviations are in parentheses; in binary and multiple regressions, robust standard errors clustered at the district-level are in parentheses
Table 4. Cross-section OLS Regressions Results, Village Level, 2010 Data
BINARY REGRESSIONS MULTIPLE REGRESSIONS
(Dependent Variable: Village-Level Teacher Absence Rate)

(1) no fixed effects
(2) w/ State fixed effects
(3) w/ district fixed effects
(4) no fixed effects
(5) w/ State fixed effects
(6) w/ district fixed effects
Have bachelors degree -0.42 -1.69 -3.69 -1.68 -2.31 -4.71(2.55) (2.52) (2.91) (2.51) (2.57) (3.04)
Have teacher training 1.10 1.12 0.52 1.08 0.79 1.53(2.51) (2.76) (3.12) (2.81) (2.85) (3.19)
Are contract teachers -4.89 -3.39 -0.86 -5.26 -3.84 -0.83(3.20) (3.41) (3.52) (3.37) (3.60) (4.03)
Are paid regularly -0.18 -0.83 -1.47 -0.28 -0.97 -0.56(1.70) (1.81) (2.11) (1.67) (1.77) (2.24)
Recognition scheme exists -3.87** -3.34* -3.69** -3.06* -2.03 -3.34(1.76) (1.75) (1.87) (1.71) (1.69) (2.23)
Log pupil-teacher ratio -5.33*** -4.89*** -4.48** -5.56*** -4.95*** -4.69***(1.83) (1.68) (1.91) (1.81) (1.57) (1.78)
Mid-day meals 1.31 1.81 4.19 1.62 0.95 2.14(1.73) (2.09) (2.59) (1.73) (2.08) (2.85)
Infrastructure index (0-4) -1.10* -0.97 -1.01 -0.97 -0.68 -0.96(0.66) (0.69) (0.76) (0.66) (0.66) (0.78)
Remoteness index (normalized) -1.16 -0.93 -0.55 -1.25 -1.04 -0.81(1.05) (1.06) (1.08) (1.00) (0.95) (1.13)
Inspected in the last 3 months -8.23*** -7.31*** -6.60*** -7.35*** -6.56*** -6.41***(1.94) (1.98) (1.91) (1.83) (1.83) (2.01)
PTA met in last 3 months -1.65 -3.18* -3.80** -1.71 -2.08 -2.96(1.74) (1.63) (1.72) (1.67) (1.64) (2.02)
Mean parental education (1-7 scale) -1.29 -0.09 0.48 -1.13 -0.46 0.51(1.40) (1.38) (1.44) (1.29) (1.32) (1.46)
Log state per-capita GDP -4.69 -6.18(7.39) (7.18)
REGRESSION STATISTICSConstant 3.43 -0.62 -1.95
(5.50) (2.26) (2.72)R-squared 0.071 0.143 0.346Adjusted R-squared 0.054 0.115 0.188F-statistic (Inspected = PTA met) 4.419** 2.921* 1.268Number of villages 1,297 1,297 1,297Notes:1) Robust standard errors clustered at the district-level are in parentheses2) The infrastructure and remoteness index are as defined in Table 43) Regressions are weighted by SCR's population4) *** Significant at 1%, ** Significant at 5%, * Significant at 10%
CHANGES IN MONITORING & COMMUNITY VARIABLES
CHANGES IN SCHOOL VARIABLES
CHANGES IN TEACHER VARIABLES
Table 5. Panel OLS Regression Results
BINARY REGRESSIONS MULTIPLE REGRESSIONS
(Dependent Variable: Percentage Points Change in Village-Level Teacher Absence)

(1) w/o fixed effects
(2) w/ State fixed effects
(3) w/ district fixed effects
(4) w/o fixed effects
(5) w/ State fixed effects
(6) w/ district fixed effects
PANEL A. CROSS-SECTION ANALYSIS
(Coefficient on Inspection Reported)On Official Duty -2.16** -2.51** -2.48* -1.55 -2.16** -2.06
(1.01) (1.02) (1.29) (1.03) (1.04) (1.30)Authorized Leave 2.35*** 1.65** 1.26 2.28*** 1.44* 1.17
(0.78) (0.84) (1.05) (0.82) (0.85) (1.08)Unauthorized Absence -10.67*** -7.02*** -6.41*** -7.39*** -5.59*** -5.30**
(1.96) (1.84) (2.10) (1.77) (1.81) (2.12)
PANEL B: PANEL ANALYSIS
On Official Duty -1.77* -1.05 -1.45 -1.43 -1.00 -1.49(0.92) (0.85) (0.97) (0.91) (0.83) (0.96)
Authorized Leave 0.77 0.42 0.59 0.59 0.33 0.50(0.83) (0.84) (0.91) (0.85) (0.84) (0.91)
Unauthorized Absence -7.22*** -6.68*** -5.74*** -6.51*** -6.07*** -5.41***(1.69) (1.86) (1.78) (1.66) (1.79) (1.75)
Notes:1) Robust standard errors clustered at the district-level are in parenthesis2) The binary dependent variable (0=Present, 1=Absent) has been multiplied by 100 to allow the coefficients to be read as percentage changes3) Regressions are weighted by SCR's population4) *** Significant at 1%, ** Significant at 5%, * Significant at 10%
(Coefficient on Change in Inspection Reported)
Table 6. Correlation between Inspection Frequency and Teacher Absence by Reason
BINARY REGRESSIONS MULTIPLE REGRESSIONS
Dependent Variable: Village-Level Teacher Absence by Reason (2010)
Dependent Variable: Change in Village-Level Teacher Absence by Reason between 2003 and 2010

(1) no fixed effects
(2) w/ State fixed effects
(3) w/ district fixed effects
(4) no fixed effects
(5) w/ State fixed effects
(6) w/ district fixed effects
Have bachelors degree -0.003 0.042 0.039 0.006 0.037 0.030(0.046) (0.053) (0.050) (0.046) (0.051) (0.055)
Have teacher training 0.041 0.054 0.085 0.029 0.046 0.064(0.056) (0.057) (0.054) (0.053) (0.055) (0.061)
Are contract teachers 0.055 0.063 -0.040 0.108* 0.088 -0.009(0.053) (0.073) (0.069) (0.059) (0.070) (0.082)
Are paid regularly -0.036 -0.010 -0.010 -0.037 -0.005 -0.004(0.030) (0.035) (0.035) (0.031) (0.035) (0.041)
Recognition scheme exists 0.069** 0.062** 0.020 0.067** 0.060* 0.023(0.028) (0.031) (0.032) (0.028) (0.031) (0.037)
Log pupil-teacher ratio 0.055* 0.032 0.029 0.049 0.024 0.012(0.031) (0.032) (0.034) (0.030) (0.031) (0.037)
Mid-day meals 0.007 -0.008 -0.024 0.018 -0.008 -0.017(0.032) (0.041) (0.046) (0.034) (0.042) (0.050)
Infrastructure index (0-4) 0.010 0.011 0.005 0.006 0.011 0.004(0.012) (0.013) (0.015) (0.013) (0.013) (0.015)
Remoteness index (normalized) -0.023 -0.026 -0.032 -0.024 -0.024 -0.028(0.022) (0.022) (0.020) (0.021) (0.021) (0.024)
PTA met at least once in last 3 months 0.018 0.052** 0.068** 0.033 0.053** 0.070**(0.023) (0.024) (0.029) (0.023) (0.024) (0.027)
Mean parental education (1-7 scale) -0.03 -0.04 -0.04** -0.04 -0.04* -0.05**(0.026) (0.026) (0.022) (0.023) (0.024) (0.025)
Log state per-capita GDP -4.69 0.40**(7.392) (0.167)
REGRESSION STATISTICSConstant -0.13 0.13*** 0.18***
(0.138) (0.051) (0.048)R-squared 0.051 0.093 0.315Adjusted R-squared 0.034 0.065 0.152Number of villages 1,300 1,300 1,300Notes:1) Robust standard errors clustered at the district-level are in parentheses2) The infrastructure and remoteness index are as defined in Table 43) Regressions are weighted by SCR's population4) *** Significant at 1%, ** Significant at 5%, * Significant at 10%
CHANGES IN MONITORING & COMMUNITY VARIABLES
CHANGES IN SCHOOL VARIABLES
CHANGES IN TEACHER VARIABLES
Table 7. Panel OLS Regression Results, Village-Level
BINARY REGRESSIONS MULTIPLE REGRESSIONS
(Dependent Variable: Change in Village-Level Inspection Frequency)

(1) no fixed effects
(2) w/ State fixed effects
(3) w/ district fixed effects
(4) no fixed effects
(5) w/ State fixed effects
(6) w/ district fixed effects
Average age 0.09** 0.05 0.07 0.10** 0.07 0.09(0.05) (0.04) (0.05) (0.05) (0.04) (0.05)
Proportion male 0.14 0.13 0.14 0.07 0.10 0.10(0.15) (0.15) (0.17) (0.15) (0.15) (0.17)
Private tuition 0.29** 0.27** 0.19 0.26** 0.30** 0.21(0.13) (0.13) (0.18) (0.12) (0.13) (0.18)
Have bachelors degree -0.22** -0.13 0.03 -0.28** -0.17 -0.02(0.12) (0.12) (0.12) (0.11) (0.12) (0.12)
Have teacher training -0.05 -0.02 0.03 -0.06 0.06 0.07(0.12) (0.11) (0.13) (0.12) (0.11) (0.13)
Are contract teachers -0.13 0.10 -0.07 0.07 0.12 -0.05(0.15) (0.15) (0.18) (0.16) (0.15) (0.19)
Are paid regularly -0.04 0.11 0.12 -0.02 0.10 0.11(0.08) (0.07) (0.08) (0.08) (0.07) (0.08)
Recognition scheme exists -0.05 0.04 0.03 -0.03 0.02 0.01(0.08) (0.08) (0.09) (0.08) (0.08) (0.09)
Absence rate of teachers -0.005*** -0.004*** -0.002 -0.006*** -0.005*** -0.002(0.002) (0.002) (0.002) (0.002) (0.002) (0.002)
Log pupil-teacher ratio -0.07 -0.11* -0.13* -0.09 -0.13* -0.15*(0.08) (0.07) (0.08) (0.08) (0.07) (0.08)
Mid-day meals -0.23* -0.06 -0.05 -0.16* -0.05 -0.04(0.08) (0.09) (0.12) (0.08) (0.09) (0.11)
Infrastructure index (0-4) 0.00 -0.03 0.01 -0.01 -0.02 0.00(0.03) (0.03) (0.04) (0.03) (0.03) (0.04)
Remoteness index (normalized) 0.05 0.04 0.03 0.03 0.04 0.03(0.05) (0.04) (0.05) (0.05) (0.04) (0.05)
Inspected in the last 3 months -0.01 -0.06 -0.10 -0.02 -0.07 -0.12(0.08) (0.08) (0.09) (0.09) (0.08) (0.09)
PTA met at least once in last 3 months -0.06 0.01 0.07 -0.03 0.01 0.06(0.07) (0.07) (0.08) (0.08) (0.07) (0.08)
Mean parental education (1-7 scale) 0.17*** 0.15*** 0.16*** 0.17*** 0.15*** 0.17***(0.05) (0.04) (0.06) (0.05) (0.05) (0.06)
Log state per-capita GDP -5.91 0.71(7.59) (0.44)
REGRESSION STATISTICSConstant -0.86** -0.52** -0.40
(0.41) (0.25) (0.32)R-squared 0.066 0.180 0.434Adjusted R-squared 0.042 0.146 0.277Number of villages 1,155 1,155 1,155Notes:1) Robust standard errors clustered at the district-level are in italics2) The infrastructure and remoteness index are as defined in Table 43) Regressions are weighted by SCR's population4) *** Significant at 1%, ** Significant at 5%, * Significant at 10%
CHANGES IN STUDENT VARIABLES
CHANGES IN TEACHER VARIABLES
CHANGES IN SCHOOL VARIABLES
CHANGES IN MONITORING & COMMUNITY VARIABLES
Table 8. Panel OLS Regression Results, Village-Level
BINARY REGRESSIONS MULTIPLE REGRESSIONS
(Dependent Variable: Change in Normalized Math Score)

Allowed Absence: 8%
Allowed Absence: 9%
Allowed Absence: 10%
Andhra Pradesh 10,299 347,875 6,374 5,901 5,428Assam 9,567 167,161 3,855 3,644 3,433Bihar 8,645 336,359 7,942 7,559 7,175Chattisgarh 8,290 155,573 1,055 885 715Gujarat 15,804 198,584 3,374 2,960 2,546Haryana 16,236 77,980 1,630 1,463 1,296Himachal Pradesh 12,199 48,507 1,776 1,698 1,620Jharkhand 9,734 135,690 6,598 6,423 6,249Karnataka 10,897 195,929 4,489 4,207 3,925Kerala 10,751 54,976 608 529 451Madhya Pradesh 9,294 267,846 6,027 5,698 5,370Maharastra 17,246 288,914 4,025 3,367 2,710Orissa 9,382 192,119 1,484 1,246 1,008Punjab 12,654 105,930 980 803 626Rajasthan 14,165 271,205 7,463 6,956 6,448Tamilnadu 18,489 150,820 1,811 1,443 1,075Uttar Pradesh 10,370 491,455 15,615 14,942 14,269Uttaranchal 17,155 45,782 1,350 1,246 1,143West Bengal 10,555 416,633 7,527 6,946 6,366India 11,368 3,949,338 92,699 86,773 80,847Notes:1) 2010 Teacher Salaries are from Teacher Long and School Census Data2) Data on total number of teachers is obtained from DISE State Report Cards3) All figures are in 2010 prices
Table 9. The Fisal Cost of Absence (in 2010 Prices and Salaries)
Total Loss Due to Absence (millions of Rs.)Number of TeachersAverage Monthly
Teacher Salary (Rs.)
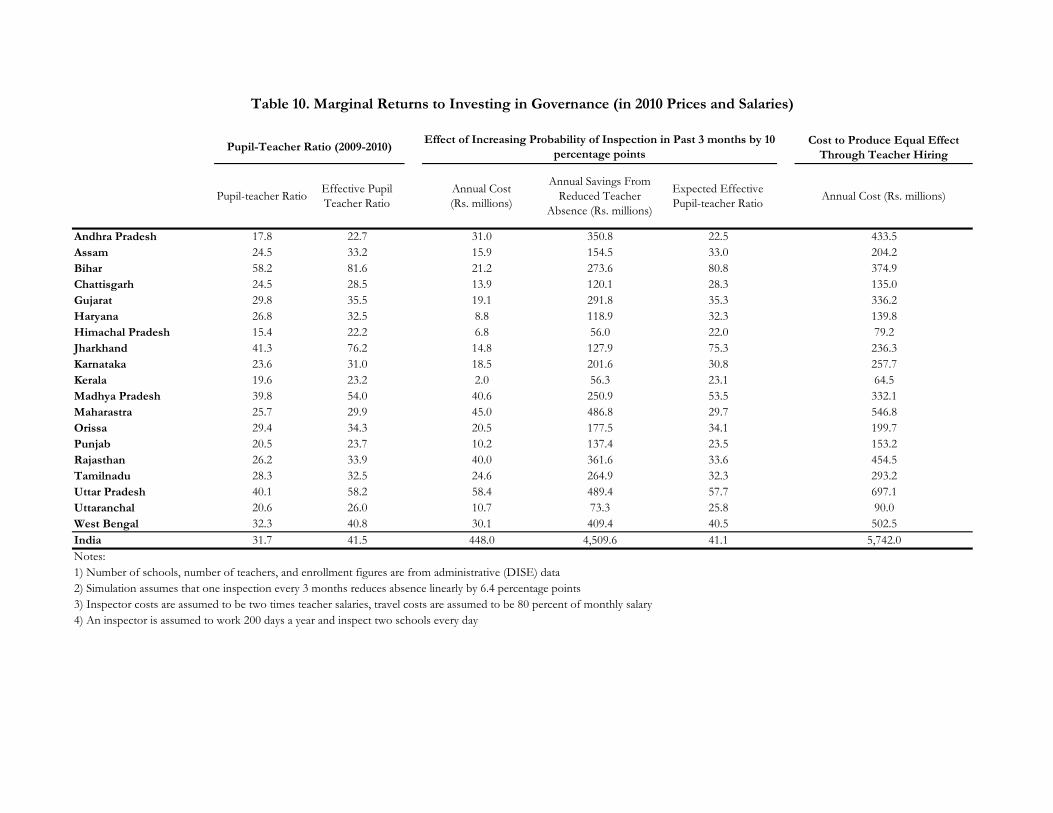
Cost to Produce Equal Effect Through Teacher Hiring
Pupil-teacher Ratio Effective Pupil Teacher Ratio
Annual Cost (Rs. millions)
Annual Savings From Reduced Teacher
Absence (Rs. millions)
Expected Effective Pupil-teacher Ratio Annual Cost (Rs. millions)
Andhra Pradesh 17.8 22.7 31.0 350.8 22.5 433.5Assam 24.5 33.2 15.9 154.5 33.0 204.2Bihar 58.2 81.6 21.2 273.6 80.8 374.9Chattisgarh 24.5 28.5 13.9 120.1 28.3 135.0Gujarat 29.8 35.5 19.1 291.8 35.3 336.2Haryana 26.8 32.5 8.8 118.9 32.3 139.8Himachal Pradesh 15.4 22.2 6.8 56.0 22.0 79.2Jharkhand 41.3 76.2 14.8 127.9 75.3 236.3Karnataka 23.6 31.0 18.5 201.6 30.8 257.7Kerala 19.6 23.2 2.0 56.3 23.1 64.5Madhya Pradesh 39.8 54.0 40.6 250.9 53.5 332.1Maharastra 25.7 29.9 45.0 486.8 29.7 546.8Orissa 29.4 34.3 20.5 177.5 34.1 199.7Punjab 20.5 23.7 10.2 137.4 23.5 153.2Rajasthan 26.2 33.9 40.0 361.6 33.6 454.5Tamilnadu 28.3 32.5 24.6 264.9 32.3 293.2Uttar Pradesh 40.1 58.2 58.4 489.4 57.7 697.1Uttaranchal 20.6 26.0 10.7 73.3 25.8 90.0West Bengal 32.3 40.8 30.1 409.4 40.5 502.5India 31.7 41.5 448.0 4,509.6 41.1 5,742.0Notes:1) Number of schools, number of teachers, and enrollment figures are from administrative (DISE) data2) Simulation assumes that one inspection every 3 months reduces absence linearly by 6.4 percentage points3) Inspector costs are assumed to be two times teacher salaries, travel costs are assumed to be 80 percent of monthly salary4) An inspector is assumed to work 200 days a year and inspect two schools every day
Table 10. Marginal Returns to Investing in Governance (in 2010 Prices and Salaries)
Pupil-Teacher Ratio (2009-2010) Effect of Increasing Probability of Inspection in Past 3 months by 10 percentage points
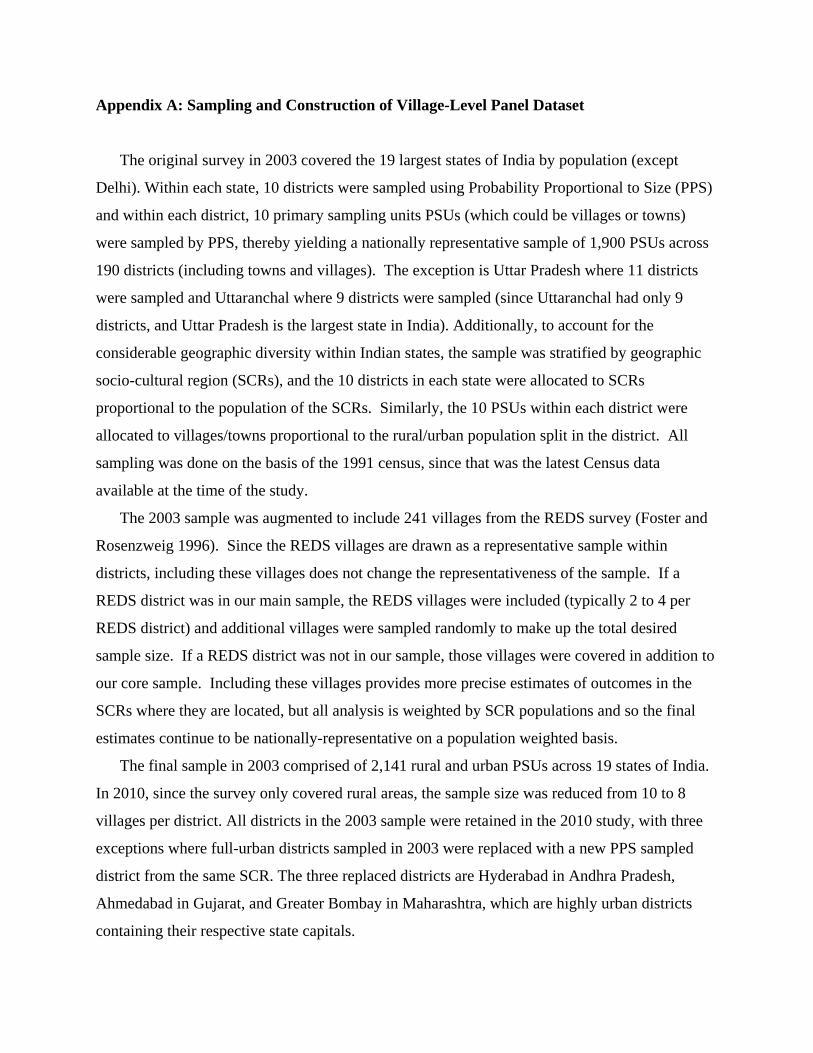
Appendix A: Sampling and Construction of Village-Level Panel Dataset
The original survey in 2003 covered the 19 largest states of India by population (except
Delhi). Within each state, 10 districts were sampled using Probability Proportional to Size (PPS)
and within each district, 10 primary sampling units PSUs (which could be villages or towns)
were sampled by PPS, thereby yielding a nationally representative sample of 1,900 PSUs across
190 districts (including towns and villages). The exception is Uttar Pradesh where 11 districts
were sampled and Uttaranchal where 9 districts were sampled (since Uttaranchal had only 9
districts, and Uttar Pradesh is the largest state in India). Additionally, to account for the
considerable geographic diversity within Indian states, the sample was stratified by geographic
socio-cultural region (SCRs), and the 10 districts in each state were allocated to SCRs
proportional to the population of the SCRs. Similarly, the 10 PSUs within each district were
allocated to villages/towns proportional to the rural/urban population split in the district. All
sampling was done on the basis of the 1991 census, since that was the latest Census data
available at the time of the study.
The 2003 sample was augmented to include 241 villages from the REDS survey (Foster and
Rosenzweig 1996). Since the REDS villages are drawn as a representative sample within
districts, including these villages does not change the representativeness of the sample. If a
REDS district was in our main sample, the REDS villages were included (typically 2 to 4 per
REDS district) and additional villages were sampled randomly to make up the total desired
sample size. If a REDS district was not in our sample, those villages were covered in addition to
our core sample. Including these villages provides more precise estimates of outcomes in the
SCRs where they are located, but all analysis is weighted by SCR populations and so the final
estimates continue to be nationally-representative on a population weighted basis.
The final sample in 2003 comprised of 2,141 rural and urban PSUs across 19 states of India.
In 2010, since the survey only covered rural areas, the sample size was reduced from 10 to 8
villages per district. All districts in the 2003 sample were retained in the 2010 study, with three
exceptions where full-urban districts sampled in 2003 were replaced with a new PPS sampled
district from the same SCR. The three replaced districts are Hyderabad in Andhra Pradesh,
Ahmedabad in Gujarat, and Greater Bombay in Maharashtra, which are highly urban districts
containing their respective state capitals.

As we highlight in the paper, to meet our objective to maintain both representativeness of the
current landscape of schools in rural India and to maximize the size of the panel, we retain
villages from the 2003 study to the extent possible. In Column 1 of Table A1, we provide state-
wise counts of rural PSUs that were sampled in the 2003 study. After removing PSUs in the three
replaced districts altogether and all other urban PSUs from the 2003 study, the maximum panel
size we could draw, including the REDS villages was 1,668. We sampled a 2003 village by
default as long as the village had a population between 250 and 10,000 as per the 1991 Census,
and we could locate the village in the 2001 Census1. In districts where we had more than 8 rural
PSUs in 2003, we sampled 8 PSUs randomly. The lower cutoff on population was based on the
Government of India’s mandate that all rural habitations exceeding 250 people should have a
school with 1 km. Since villages and hamlets can be absorbed into expanding cities over time,
we match the originally sampled 1991 village to the villages in the 2001 Census to make sure
that the sampled village still exists
From the 2003 list of 1,668 villages, we had to remove 249 from the 2010 sampling frame
for reasons we discuss below (see Columns 5 through 9 of Table A1 for the distribution of these
villages across states). 69 villages were dropped because they fall in districts that had more than
8 villages in the 2003 round. A further 129 villages were removed either because their population
was below 250, or had far exceeded 10,000 in the 2001 Census (20,000 for Kerala). A total of 36
villages could not be located in the 2001 Census (suggesting that they had either been
depopulated or absorbed into nearby towns). Finally, 15 villages were replaced due to safety,
logistical and accessibility reasons. Thus, our sample consists of 1,419 villages from 2003
(Table A1 - column 3).
In districts where we had fewer than 8 villages in the 2003 sample (recall that the rural/urban
sampling within districts was done on the basis of population ratios, and thus districts where over
25% of the population in 1991 was urban would have fewer than 8 villages), we sample more
villages as required to reach a minimum sample size of 8 villages per district for the 2010 survey.
The new villages were sampled PPS from the universe of eligible villages in the 2001 Census
that were not already sampled. The cross-section sample (including REDS villages) thus consists
of 1,650 villages (Table A1 - column 2).
1 The exception to this is Kerala, which has a much higher population density, where the upper cut-off was 20,000

Of the 1,650 villages that comprise our 2010 sample, data from 1,555 villages were included
in the analysis presented in this paper (Table A2 - column 2). First, we found that 29 of the
1,650 villages have no schools in the village. A large proportion of these villages (12 out of 29)
are in Himachal Pradesh, which is a sparsely populated mountainous state, with many small
habitations. Another 39 villages did not have a public school within the village, but did have a
private school. Since this paper focuses on changes in public schools, these villages are not
included in the analysis. In Kerala, we lose another 12 villages, because all schools in the village
refused to be allowed to be surveyed.2 Finally, we drop 15 more villages from our analysis
because in these villages, schools were either not functional or closed in all three visits, which
means we were unable to complete surveys. A state-level breakdown of these 95 villages is
provided in Columns 4-7 of Table A2. The decline in the cross-section sample size for reasons
we discussed above, also reduces the number of villages for which we have panel data. After
accounting for the above 95 villages and 53 villages in 2003 for which we have no data (for
similar reasons as outlined for the 2010 survey round), our final panel size is 1,297 villages.
These 1,297 villages form the core of our analysis.
To ensure a representative sample of schools, enumerators first conducted a full mapping of
all public and private schools in each sampled village. Enumerators conducted “Participatory
Resource Assessments” with households at multiple locations (at least three) within each village
to obtain a list of all primary schools within the boundary of the village. All enumerated schools
were administered a short survey that included questions on school administration such as
management (public or private), enrollment, infrastructure etc. Enumerators also collected a list
of all teachers in the school and their demographic characteristics. This school listing in each
sampled village provided the frame for school sampling. We sampled up to three schools per
village. If the village had three or fewer schools, all schools were sampled. If the village had
more than three schools, we stratified the schools by management type and randomly sampled
two public schools and one private school to the extent possible. In the event that there were only
one public school and two or more private schools, one government and two private schools
were sampled. Table A3 provides the state-level breakdown of the number of schools and
teachers in the final (public school) sample used in this paper (both cross section and panel).
2 Permission to survey was refused in spite of the survey team possessing the required permission documents. Kerala has a history of strong unions and it was not possible for the field teams to overcome this opposition.

Year 2003 Sample
Year 2010 Sample
Panel Sample
More than 8 panel
villages in district
Village population less than
250
Village population more than
10,000
Village not found in Census 2001
Other Reasons
Andhra Pradesh 81 87 73 8 3 0 4 1 0Assam 98 87 77 21 5 3 0 10 3Bihar 94 84 84 10 10 0 0 0 0Chattisgarh 85 80 76 9 1 0 1 2 5Gujarat 82 88 74 8 2 2 2 0 2Haryana 81 81 75 6 3 1 1 1 0Himachal Pradesh 89 80 60 29 2 22 0 4 1Jharkhand 87 84 73 14 7 4 0 1 2Karnataka 91 89 84 7 2 3 2 0 0Kerala 83 83 43 40 0 0 40 0 0Madhya Pradesh 88 90 81 7 3 1 2 1 0Maharastra 85 91 80 5 2 0 3 0 0Orissa 92 87 79 13 4 5 1 3 0Punjab 78 82 75 3 0 0 1 2 0Rajasthan 91 98 85 6 1 1 0 4 0Tamilnadu 84 87 69 15 5 0 6 4 0Uttar Pradesh 114 113 104 10 9 1 0 0 0Uttaranchal 80 72 57 23 6 14 1 2 0West Bengal 85 87 70 15 4 3 5 1 2India 1,668 1,650 1,419 249 69 60 69 36 15Notes:1) The upper population cutoff for all states was 10,000 as per the 1991 census, except Kerala where the cutoff was 20,000
Table A1. Description of Sample: Panel Construction
Number of Villages Reasons for Reduction in Panel SizeReduction in Panel Size
2) The category others include: replaced because high Naxalite activity (6 villages), replaced because duplicate in 2003 sample (2 villages), replaced because district was replaced (2 villages) replaced because village too remote (1 village), replaced because name missing in 2003 list (1 village), replaced because of floods in village (2 village), replaced because village could not be located (1 village)

Sampled Included in Analysis Attrition No school in
village
No public school in
village
School(s) refused to
survey
Other reasons Sampled Included in
Analysis Attrition No data for year 2010
No data for year 2003
Andhra Pradesh 87 86 1 0 0 0 1 73 70 3 1 2Assam 87 83 4 1 3 0 0 77 72 5 3 2Bihar 84 81 3 1 1 0 1 84 77 7 3 4Chattisgarh 80 75 5 2 1 0 2 76 69 7 4 3Gujarat 88 85 3 0 3 0 0 74 71 3 3 0Haryana 81 80 1 0 1 0 0 75 63 12 0 12Himachal Pradesh 80 59 21 16 5 0 0 60 43 17 16 1Jharkhand 84 81 3 2 1 0 0 73 58 15 3 12Karnataka 89 88 1 0 1 0 0 84 82 2 1 1Kerala 83 65 18 0 5 12 1 43 31 12 8 4Madhya Pradesh 90 88 2 0 1 0 1 81 78 3 2 1Maharastra 91 83 8 1 3 0 4 80 73 7 7 0Orissa 87 83 4 2 1 0 1 79 73 6 3 3Punjab 82 80 2 1 1 0 0 75 71 4 2 2Rajasthan 98 94 4 1 2 0 1 85 83 2 2 0Tamilnadu 87 79 8 1 5 0 2 69 62 7 5 2Uttar Pradesh 113 111 2 0 2 0 0 104 100 4 2 2Uttaranchal 72 67 5 1 3 0 1 57 52 5 4 1West Bengal 87 87 0 0 0 0 0 70 69 1 0 1India 1,650 1,555 95 29 39 12 15 1,419 1,297 122 69 53Notes:1) The category others include: high Naxalite activity, village not reachable, schools not functional, schools closed in all three visits2) In 2003, if a village did not have any schools, surveyors went to the neighboring village. In 2010, the village was simply recorded as having no school
Table A2. Description of Sample: Data and Attrition
Year 2010 Sample Reasons for Attrition (Year 2010) Panel Sample Reasons for Attrition (Panel)
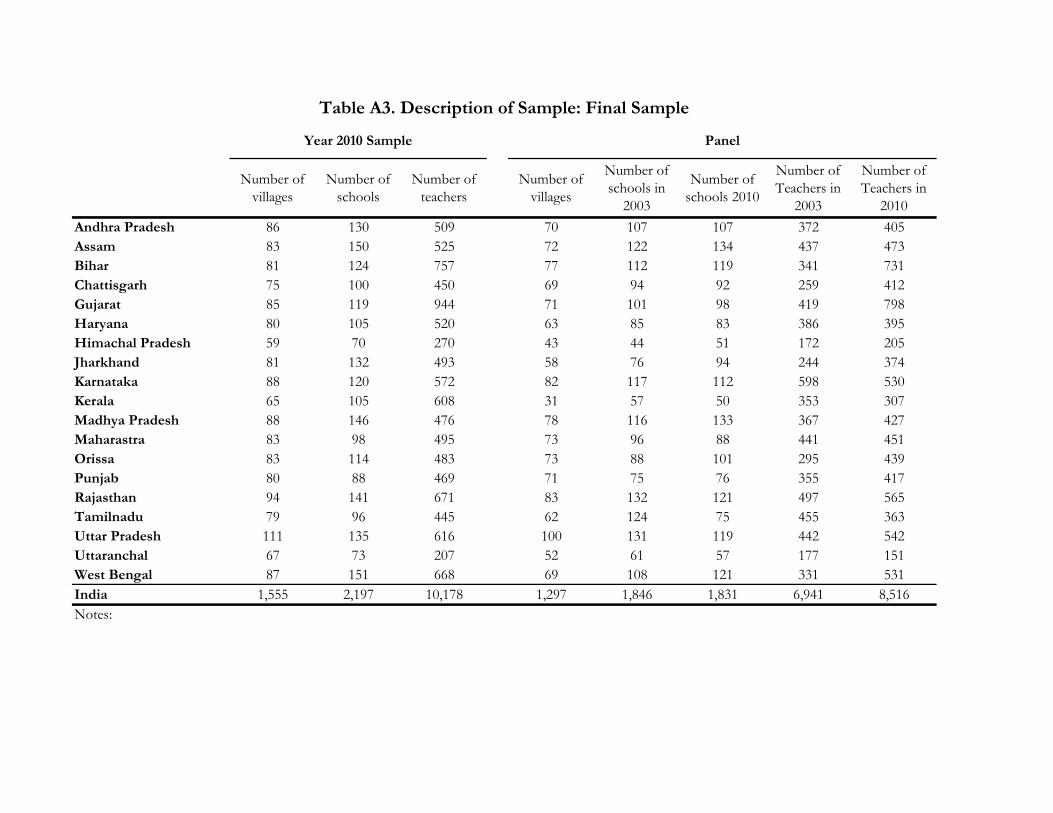
Number of villages
Number of schools
Number of teachers
Number of villages
Number of schools in
2003
Number of schools 2010
Number of Teachers in
2003
Number of Teachers in
2010Andhra Pradesh 86 130 509 70 107 107 372 405Assam 83 150 525 72 122 134 437 473Bihar 81 124 757 77 112 119 341 731Chattisgarh 75 100 450 69 94 92 259 412Gujarat 85 119 944 71 101 98 419 798Haryana 80 105 520 63 85 83 386 395Himachal Pradesh 59 70 270 43 44 51 172 205Jharkhand 81 132 493 58 76 94 244 374Karnataka 88 120 572 82 117 112 598 530Kerala 65 105 608 31 57 50 353 307Madhya Pradesh 88 146 476 78 116 133 367 427Maharastra 83 98 495 73 96 88 441 451Orissa 83 114 483 73 88 101 295 439Punjab 80 88 469 71 75 76 355 417Rajasthan 94 141 671 83 132 121 497 565Tamilnadu 79 96 445 62 124 75 455 363Uttar Pradesh 111 135 616 100 131 119 442 542Uttaranchal 67 73 207 52 61 57 177 151West Bengal 87 151 668 69 108 121 331 531India 1,555 2,197 10,178 1,297 1,846 1,831 6,941 8,516Notes:
Table A3. Description of Sample: Final Sample
Year 2010 Sample Panel

The Effect of a Change in Language of Instruction:The Case of Malaysia’s National Education Policy
Ximena del Carpio∗East Asia and Pacific Unit
The World Bank
Owen Ozier∗Development Research Group
The World Bank
Mauro Testaverde∗East Asia and Pacific Unit
The World Bank
L. Choon WangDepartment of Economics
Monash University
3 December 2013
(EXTENDED ABSTRACT ONLY)
Abstract
We estimate the impacts of the 1970 schooling reform in Malaysia on several forms of literacy, school-ing, and wages. Previous analyses have examined the changes to the supply of secondary and tertiaryeducation, but our study focuses on a particular feature of the policy change: in 1970, the language ofinstruction in English-language primary schools was abruptly changed to Bahasa Malaysia. The policychange switched the language of instruction experienced by the new cohort: in 1970, the change affectedStandard 1; in 1971, Standards 1 and 2; and so on. As a consequence, two adjacent cohorts - those startingschool in 1969 and those starting in 1970 - experienced different instructional environments in primaryschool. Exploiting this discrete policy change, we are able to estimate the impacts of the language changeon outcomes. Our analysis takes place in an unprecedented collection of large survey datasets, allowingus to test for program impacts with unusual rigor. While we find no evidence of change in literacy rates,we see that for some sections of the population, schooling and wages clearly increased. The relationshipbetween the policy change, education, and wage is not the same for all sections of the population, however.
JEL Codes: I25,I28,J15,J24Keywords: Malaysia, language of instruction, regression discontinuity
∗The findings, interpretations, and conclusions expressed in this paper are entirely those of the authors, and do not necessarilyrepresent the views of the World Bank, its Executive Directors, or the governments of the countries they represent.
1