the performance of spin-off companies at the swiss federal
TRANSCRIPT

ETH transfer
The Performance of Spin-Off Companies at the Swiss Federal Institute of Technology ZurichSimon Hofer, Luca Fricker, Barbara Schmidt, Dr Barbara Burkhard and Hanna Brahme

1
Dear reader
ETH spin-offs are highly important ambassadors for taking innovation from the labora-tory into society at large. In recent years ETH has stepped up its support activities by launching new programmes partly based on insights from two previous studies on the performance of ETH spin-offs (Oskarsson & Schläpfer, 2008 and Pinter, 2015). Because this ecosystem is rapidly evolving, however, a follow-up study on the performance of these innovative companies has been conducted in collaboration with the University of St Gallen.
A review of the last few years reveals that the spin-off network is becoming increasing-ly complex and that many parameters can be investigated. I would therefore like to thank the authors and editors of this study for their input and insightful analysis. The four-and-a-half thousand direct jobs that our spin-offs have created and the equity value of close to CHF 5 billion that they have generated to date are evidence of research having been fruitfully transformed into business ideas. Another fact that stands out is that spin-offs founded by pioneer fellows have been acquired over three times more often than other spin-offs. Further interesting findings are the increase in female founders since 2007 and the rising percentage of spin-offs backed by business angels and venture capital. Overall the report indicates that ETH spin-offs are based on fundamentally sound and innovative ideas, have achieved substantial growth and contribute significantly to the economy.
Founding a company requires courage and hard work amid highly demanding business schedules. We therefore appreciate the time that spin-offs have invested in responding to our survey in great detail. We are also grateful to the team of experts who have ex-tracted the relevant information from the data pool and summarised it in this report. We are convinced that you will discover fascinating facts, figures and trends while reading the report and that it will help us improve the support for future generations.
Prof. Dr. Detlef GüntherVice President Knowledge Transfer and Corporate Relations
Foreword

2
The Performance of Spin-Off Companies at the Swiss Federal Institute of Technology Zurich
Authors:
Simon Hofer*, Luca Fricker*, Barbara Schmidt*, Dr Barbara Burkhard*, Hanna Brahme**
Editors:
Prof Dr Dietmar Grichnik*, Dr Silvio Bonaccio**, Dr Marjan Kraak**
Group of Experts:
Dr Stephan Hess (swiss-technology-brokers GmbH), Alexander Schläpfer
(Swisscom Ventures), Prof Dr Jan-Egbert Sturm (KOF), Prof Dr Martin Wörter (KOF),
Dr Jana Thiel (ETH Zurich, Chair of Entrepreneurship)
* University of St Gallen** ETH Zurich
PublisherETH ZurichETH transferRaemistrasse 101HG E 43-498092 Zurich, Switzerlandwww.transfer.ethz.chwww.spinoff.ethz.ch
Text editingMark Strange
Design editingnull-oder-eins visuelle gestaltungenMichael Nitsch
© ETH Zurich, August 2020

3
Table of Contents
1. Introduction 5
2. Methodology 6
2.1. Survey 6
2.2. Sector Definition 7
2.3. Definition of ‘Failure/Ceased Activity’ 7
3. ETH Zurich Spin-Offs 8
3.1. Spin-Off Support at ETH 10
3.2. Community Events 11
4. Value Created by ETH Zurich Spin-Offs 12
4.1. Human Resources-Related Factors 12
4.1.1. Single Founders (n=7) versus Founding Teams (n=136) 12
4.1.2. Novices versus Serial Entrepreneurs 12
4.1.3. Diversity in Entrepreneurial Founding Teams 13
4.1.4. Gender Diversity 13
4.1.5. Ability to Attract Funding 14
4.2. Impact on Local Economy and Innovation 17
4.2.1. Patents and Other Intellectual Property 17
4.2.2. Industrial Collaborations 18
4.2.3. Location 19
4.2.4. Job Creation 20
4.2.5. The Global Presence of ETH Spin-Offs 23
4.2.6. Comparison between Pioneer Fellows and Non-Pioneer Fellows 24
4.3. Financing and Investment 25
4.3.1. Equity Funding History 25
4.3.2. Funding from Non-Dilutive Sources 26
4.3.3. Early-Stage Financing 27
4.3.4. Comparison between Pioneer Fellows and Non-Pioneer Fellows 28
4.3.5. Later-Stage Funding from Business Angels and Venture Capitalists 28
4.3.6. Financial Return 30
4.4. Operations-Related Factors 37
4.4.1. Survival and Failure of ETH Spin-Offs 37
4.4.2. Valley of Death 38
4.4.3. Survival Rate Comparison with the Swiss Start-Up Ecosystem 39
4.4.4. Survival Rate Comparison with University Spin-Offs 40
4.4.5. Exits 41
4.4.6. Exits versus Liquidations per Sector 42
4.4.7. Comparison between Pioneer Fellows and Non-Pioneer Fellows 43
5. Summary and Conclusion 44
6. Table of Figures 46
7. References 47
APPENDIX A: TABLES AND FIGURES 49
APPENDIX B: SURVEY 55

4
ETH Zurich spin-offs1973 – 2018
92.9%
3.6x
KEY FACTS
five-year survival ratepage 38
money multiple, n=128page 34
4.8bnequity value created, n=148page 32
889mrevenue generated in 2017, n=145page 17
direct jobs created, n=145page 20
>3xmore frequent exits among pioneer fellowspage 43
41
429
exits, n=429page 41
4’448

5
1. Introduction
In addition to teaching and research, a so-called ‘third mis-
sion’ – making a direct contribution to the broader social and
economic community – has become a central concern of
universities (Degl’Innocenti et al., 2019). One of the most
important goals within the third mission is the transfer of
scientific knowledge and new technology. The pursuit of this
goal involves a series of processes and instruments aimed
at transferring research products to companies and the
market. Among the various transfer strategies available, the
creation of university spin-offs is an important means of
creating value from scientific knowledge (Visintin & Pittino,
2014). In particular, university spin-offs have increasingly
been recognised as potential drivers of job creation and
innovation (Nörr, 2010). The establishment of university spin-
offs is therefore an important mechanism for the commer-
cialisation of scientific knowledge and thus for the overall
contribution of universities to regional economic develop-
ment and growth (Mathisen & Rasmussen, 2019; Bathel et
al., 2010).
This third mission is also a key part of how ETH Zurich op-
erates, as it seeks to contribute to the exploitation and dis-
semination of knowledge and new technologies throughout
society. In order to fulfil this mission, ETH Zurich has invest-
ed carefully targeted resources in supporting entrepreneur-
ial projects and transferring ETH Zurich technologies to the
market. For example, ETH transfer was set up in 2005 as
a technology transfer unit under the Vice President for
Research and Corporate Relations, subsequently launching
initiatives such as the Spark Award for the most promising
patented innovation of the year, Pioneer Fellowships for the
commercialisation of research findings, and the Innovation
and Entrepreneurship Lab (ieLab) incubator. ETH Zurich
helps start-ups to sharpen their business cases and to
network and develop their technology and innovation for
the market. Start-ups that meet the quality criteria receive
the ETH Zurich spin-off label. An official spin-off from
ETH Zurich commercially uses a technology, software or
know-how developed at ETH Zurich, and at least one of the
founders must have a connection to ETH Zurich (Spin-off
guidelines, RSETHZ 440.5). The following report reflects on
the performance of these spin-offs from ETH Zurich over the
past few decades.
The main objective of this report is to analyse how spin-offs
from ETH Zurich create value and thus contribute to the
economy and society. Out of 429 spin-offs, 143 completed
a survey conducted in autumn 2018. Together with addition-
al information up to 31 December 2018, statistical analyses
were carried out on the economic impact, finances and
success of these start-ups. This is ETH Zurich’s third
in-depth spin-off report and follows the reports authored by
Oskarsson & Schläpfer in 2008 and by Pinter in 2015. It is
based on two master’s degree theses submitted at the
University of St Gallen by Luca Fricker and Simon Hofer.
First, the methodology used is explained. Secondly, the spin-
off support provided by ETH Zurich is introduced. Then the
findings are presented in four sections: human resources-
related factors, impact on the local economy and innovation,
financing and investment, and operational factors. The
report ends with a final summary and conclusion.
1. Introduction
five-year survival ratepage 38
41

6
The Performance of Spin-Off Companies at the Swiss Federal Institute of Technology Zurich
The basis for this study is the total population of 429 ETH
Zurich spin-off companies that were created during the 46-
year period between 1 January 1973 and 31 December 2018.
Information on the entire population of 429 spin-offs was
obtained from ETH Zurich’s internal spin-off database and
from extensive separate research of the Swiss commercial
register, press releases and additional documents provided
by ETH transfer. A survey enabled more granular informa-
tion to be obtained from one-third of the population.
2.1. Survey
A survey designed to measure the performance and impact
of ETH spin-offs (see Appendix B) was developed. On 8 Oc-
tober 2018, after a trial round involving ten selected spin-
offs, ETH transfer officially distributed the questionnaire to
a total of 412 founders for which valid contact data was avail-
able. It should be pointed out that 17 companies out of the
population of 429 could not be contacted because either (i)
their contact data was not available or (ii) they obtained their
spin-off label after the questionnaire was sent out (i.e. be-
tween 9 October and 31 December 2018). We received 143
valid responses, i.e. a response rate of 34.7 per cent. We
have no evidence that the proportion of omitted spin-offs
(4.0 per cent) has produced a systematic bias.
To examine how the sample composition compares to the
population, we conducted chi-square tests and calculated
the correlation factor for the distribution according to sector,
vintage and status (‘exited’, ‘liquidated’ and ‘survived’). While
each sample represents the population fairly in terms of
sector distribution, the chi-square tests strongly reject the
null hypothesis that the samples have the same composition
as the population in terms of vintage and status (refer to
Appendix A, Tables 1, 2 and 3 for details). Comparisons
of expected and actual numbers of observation in the
chi-square tables reveal a clear overrepresentation of
recently incorporated spin-offs in all samples compared
with the population. In terms of status there is a clear
underrepresentation of liquidated spin-offs in all samples
compared to the population. Both biases can be explained
by the fact that older spin-offs, as well as liquidated spin-
offs, were less likely to participate in the survey. These bi-
ases mean that we need to be cautious with extrapolations
from the sample to the population. To account for the differ-
ent status composition (‘exited’, ‘liquidated’ or ‘survived’)
between the sample and the population, we extrapolated (1)
the funds raised among the population by status and (2) the
equity value created among the population by status. This
extrapolation by status yields more accurate estimates for
population than a regular linear extrapolation that assumes
a similar composition and applies a single multiplier. When-
ever extrapolations are made, this is explicitly mentioned in
the report.
Given the sensitive nature of the survey – e.g. funding
amounts, shareholding structure and financial key perfor-
mance indicators (KPIs) – certain questions in the survey
have fewer than 143 valid answers (e.g. ‘Not allowed to dis-
close this information according to investment agreement’).
Our own research of company websites, the Swiss commer-
cial register, press releases, annual reports and information
provided by ETH transfer for its portfolio companies enabled
us to complete certain missing data points and – for specif-
ic questions – even add data points of non-respondents. The
fact that (i) certain data points were not provided by the
founders and (ii) certain data points were added manually
by the authors needs to be considered. The omission in (i)
mostly relates to well-funded and successful spin-offs that
are often contractually bound to strict confidentiality, and (ii)
partially compensates for the omission in (i). The inability to
include some of the most successful spin-offs when esti-
mating the financial return means that the bias yields more
conservative estimates overall.
For each section of the findings we only consider the spin-
offs for which we have complete data points. The sample
size might therefore vary between different parts of the
analysis and is indicated in each section.
2. Methodology

7
2. Methodology
2.2. Sector Definition
The Swiss standard for the general classification of econom-
ic activities is defined as the NOGA code. This nomenclature
consists of five stages differentiating between 794 fields of
activity, with each code consisting of six digits (Bundesamt
für Statistik BFS, 2008). ETH Zurich and other technology
transfer offices have developed their own nomenclatures to
classify spin-off companies. The sectors used by ETH Zurich
are the following:
• Advanced Materials
• Biotech Pharma
• Chemical Processes & Compounds
• Electrical Engineering & Electronics
• Information & Communications Technology (ICT)
• Mechanical Engineering & Aerospace
• Medical Devices
• Micro- & Nanotechnology
• Sensor Analytics
• Others (mainly consulting).
Further analysis includes the sectors used by ETH Zurich.
They do not correspond specifically to the NOGA codes used
by the Swiss government. ETH transfer uses between one
and three different sectors to classify spin-off companies at
the time it awards its spin-off labels. The first sector used
by ETH Zurich is the main sector. To simplify the analysis
process, all companies have been clustered into the prima-
ry sector. To facilitate understanding, here is one example
of the methodology used. If company A belongs to the ICT
primary sector and the Electrical Engineering & Electronics
additional sector, and company B belongs to the ICT primary
sector and the Medical Devices additional sector, they will
both be classified as ICT. Furthermore, it is important to note
that companies are only classified when they are recognised
as ETH Zurich spin-offs. If a company changes its field of
activity during its lifespan, its ETH Zurich classification will
typically not be adjusted accordingly.
2.3. Definition of ‘Failure/Ceased Activity’
The present study will use the designation ‘Failure/ceased
activity’ only for businesses denoted as ‘liquidated’ or ‘in
liquidation’ in the commercial register. All companies indi-
cating in the survey that their company had gone out of busi-
ness are found in this category. This is a different definition
compared with previous studies. Past studies have used the
term ‘failure’ for all companies that have either been liqui-
dated or ceased commercial activity. The term ‘commercial
activity’ has been defined for past studies as 1) the company
having employees, either full-time or part-time, and 2) reg-
ular revenues of CHF 10’000 or more per year (Oskarsson &
Schläpfer, 2008). For this reason, explicit comparisons
with previous studies might be difficult and the reader of
the present study is required to exercise caution in making
comparisons.

8
The Performance of Spin-Off Companies at the Swiss Federal Institute of Technology Zurich
Spin-off support at ETH Zurich goes back to the 1990s, when
the university started to assist in the foundation of new com-
panies based on research findings in order to help convert
such findings into marketable products and, consequently,
the creation of new jobs (ETH Zurich, 2018a). The success of
these support efforts is shown in Table 1: the majority of
spin-off incorporations took place after 2000. Ninety per
cent of the total number of spin-off companies received the
spin-off label in or after 1998. Several developments con-
tributed to this increase. Recognising the importance of
spin-offs as vehicles for transferring innovation from the
institution to society, the ETH Law was revised in 2003 to
include a new article 3a explicitly stating the objective of
spin-off creation. The establishment of ETH transfer, which
had many new competencies and was explicitly committed
to providing spin-off support, helped achieve this objective.
Although the number of companies receiving the spin-off
label has remained fairly stable in the last four years, 2018
reveals an all-time high of 27 newly labelled spin-offs. This
suggests that the growth trend could continue in the future.
3. ETH Zurich Spin-Offs
Table 1: ETH Zurich spin-offs; spin-off labels by year for total population and survey sample size (n=432; n=143)
Year of spin-off label
Total spin-off population Survey respondents
#population %population #sample %sample
1973 – 1997 44 10.2% 8 5.6%
1998 8 1.9% 1 0.7%
1999 16 3.7% 0 0.0%
2000 17 3.9% 4 2.8%
2001 10 2.3% 3 2.1%
2002 10 2.3% 1 0.7%
2003 10 2.3% 1 0.7%
2004 12 2.8% 3 2.1%
2005 9 2.1% 2 1.4%
2006 16 3.7% 3 2.1%
2007 21 4.9% 4 2.8%
2008 23 5.3% 11 7.7%
2009 24 5.6% 6 4.2%
2010 20 4.6% 4 2.8%
2011 22 5.1% 4 2.8%
2012 22 5.1% 8 5.6%
2013 24 5.6% 8 5.6%
2014 22 5.1% 12 8.4%
2015 25 5.8% 13 9.1%
2016 25 5.8% 18 12.6%
2017 25 5.8% 15 10.5%
2018 27 6.3% 14 9.8%
Total 432 100.0% 143 100.0%

9
3. ETH Zurich Spin-Offs
Figure 1 shows the number of recognised spin-offs per sec-
tor and year at ETH Zurich over the last 20 years. The trend
for ETH Zurich spin-offs is moving in the same direction as
the Swiss start-up ecosystem as a whole. After it reached a
peak in 2000, the number of new incorporations declined.
However, since 2004/2005 the number of new spin-off com-
panies has risen sharply, nearly tripling within the last de-
cade. The Swiss Startup Radar has called the underlying
phenomenon ‘From the bubble to the boom’, linking it to the
dotcom bubble1 in 2000. This revival and the resulting rise
1 The dotcom bubble, also known as the internet bubble, was a rapid rise in US technology stock valuations fuelled by investments in internet-based companies during the bull market of the late 1990s followed by a crash ending around 2001 with the result that most dotcom stocks had gone bust by the end of that time (Hayes, 2019).
are also consistent with the data from the Swiss Startup
Radar (Kyora, Rockinger & Jondeau, 2018), which report
a growth factor of four between 2002 (69 Swiss start-up
incorporations) and 2011 (281 incorporations) and a constant
number of around 300 incorporations per year since 2011.
Most ETH spin-offs were founded in the ICT (n=107), Others
(n=94) and Biotech Pharma (n=72) sectors. Similarly, Kyora
et al. (2018) report that the largest proportions of start-ups
in Switzerland are in the Others, Software and Life Sciences
sectors. It is also interesting to note the trends over time
among ETH spin-offs: the Life Sciences sector has remained
almost constant while ICT has grown strongly since 2008,
producing between six and nine new spin-offs every year
and as many as 15 in 2018.
Figure 1: ETH Zurich spin-off labels awarded by sector and year (n=432)
1998
1999
2000
0
5
10
15
20
25
30
2001
2002
2003
2004
2005
2006
2007
2008
2009
2010
2011
2012
2013
2014
2015
2016
2017
2018
Advanced Materials Biotech Pharma Chemical Processes & Compounds
Electrical Engineering & Electronics Information & Communications Technology (ICT) Mechanical Engineering & Aerospace
Medical Devices Micro- & Nanotechnology Others (mainly consulting) Sensors Analytics

10
The Performance of Spin-Off Companies at the Swiss Federal Institute of Technology Zurich
3.1. Spin-Off Support at ETH
University support has been mentioned by Shane (2004) to
be a key driver behind the success of university spin-offs.
Shane develops three arguments to illustrate the ways in
which university support can be beneficial to spin-offs: a
continuing relationship between the university and the spin-
off, a flexible approach to this relationship, and the presence
of external liaison organisations that transform university
research and technology into products and services. ETH
Zurich offers various programmes and events in all of the
three relevant fields mentioned to support young entrepre-
neurs. We will outline further the support structure of these
programmes and summarise the impact that they have
achieved. Figure 2 shows a timeline of all ETH support
activities since the 1990s.
ETH transfer offers advice to aspiring entrepreneurs and
plays an essential role in the development of spin-offs. ETH
transfer also manages the Pioneer Fellowship programme.
This is a combined financial and mentoring programme de-
signed for students who intend to commercialise a highly
innovative technology based on their own research at ETH
Zurich. It is awarded to one or two individuals who receive
CHF 150’000 over 12 to 18 months along with an extensive
mentoring and training programme. Throughout the duration
of the programme they are hosted in the ieLab. The ETH
Zurich Foundation and ETH Zurich fund the programme joint-
ly (ETH Zurich, 2018b) and it is made possible by donations.
When asked for feedback, respondents in the spin-off survey
indicated several ways in which support for ETH Zurich spin-
offs could be improved (see Figure 3). By far the most fre-
quently cited potential improvement was the wish to receive
more funds at an early stage of development to carry out a
proof of concept for the start-up idea. Overall, survey re-
spondents consider funding-related improvements – both
by ETH Zurich itself and by other sources through strength-
ening links with venture capitalists or business angels – to
be the most relevant.
Figure 2: Timeline of ETH support activities2
2 Wyss Zurich is an incubator linked to ETH and the University of Zurich (UZH).
Increased focus on entre-preneurship and spin-off activities at ETH Zurich
Mid 1990s
The ETH Pioneer Fellowship programme is created
2010
Venture business plan competition is introduced
1997
Spin-offs start receiving official spin-off recognition letters confirm-ing their status as ETH Spin-off
Venture Incubator Fund is created
Systematic spin-off support is provided across ETH Zurich
The ieLab is inaugurated
1997 2000 2005 2012
Introduction of the first ETH spin-off logo
2001
Wyss Zurich is launched
2015
ieLab

11
3.2. Community Events
Founders of acquired companies often make their networks,
experience and financial resources available to the ecosys-
tem to support the next generation of start-ups. Since the
Swiss start-up ecosystem is still young, it is essential to
organise events and provide platforms where entrepreneurs
can meet.
ETH transfer promotes social platforms in various ways.
According to the present study, one of the most appreciated
events is the spin-off dinner, which takes place once a year
in the Dozentenfoyer at ETH Zurich (see Figure 4). As one of
the founders mentioned, “[the] spin-off dinner is an out-
standing networking event that generated multiple key con-
tacts from which we still profit years later.”
However, demand for expanding the offering of community
events is also high. Participants suggested “facilitating inter-
action between spin-offs and students or large companies by
inviting open innovation managers to ETH Zurich to look for joint
projects” or organising “investor events where start-ups and
investors can pitch with the main goal of inspiring existing and
future founders to build the next Google rather than getting
bought by it.”
In the meantime, community development has taken off with
yet another highly dynamic drive involving student-based
organisations such as the ETH Entrepreneurs Club and the
ETH Juniors, which foster an entrepreneurial spirit through-
out the institution and stimulate the foundation of start-ups
from the bottom up. Complementing the intiatives launched
by ETH Zurich, these student-driven activites offer great
value to the ecosystem.
3. ETH Zurich Spin-Offs
Figure 3: ETH transfer; feedback from spin-offs for improvements (n=143)
Figure 4: ETH transfer; feedback from spin-offs regarding the most helpful community events organised by ETH (n=143)3
3 Beekeeper is a community online platform used by ETH for spin-off communications; spin-off drinks are held twice per year and are networking events that are more casual than spin-off dinners.
SOLA relay team (5.4%) Spin-off drinks (11.4%) Newsletter (13.4%)
Spin-off community platform on Beekeeper (12.9%)
Spin-off dinner (42.6%) Other (14.4%)
60 70 80
79
ETH to take more equity stakes (as part of the license agreement)
Increase business relevant experience in TTO
Other
Improve the licensing terms
More commercially-oriented R&D
Extend infrastructure and administrative support
Possibility to act as an investor in ETH spin-offs (at market value)
Generate more VC / Angel interest
Provide more proof-of-concept funding
Number of responses (max. three per company)
0 10 20 30 40 50
10
24
29
31
37
42
43
47

12
The Performance of Spin-Off Companies at the Swiss Federal Institute of Technology Zurich
This analysis consists of four main sections. The first section
covers human resources-related factors, such as founder
team composition and diversity. The second section looks at
the impact of ETH Zurich spin-offs on the local economy
to provide insights into intellectual-property strategy and
cooperations between spin-offs and industry. The third
section focuses on financial topics, and the fourth section
explores operational factors.
Within each section a general overview of the topic is pre-
sented to the reader. The results are then compared with
statistics, with previous studies on ETH spin-offs and with
findings from ecosystem reports on the Swiss and European
start-up ecosystems.
4.1. Human Resources-Related Factors
Venture creation requires a wide set of skills and knowledge.
Investors put the greatest emphasis on the quality of the
management team when making investment decisions in the
early stages (Mason & Stark, 2004). Because such teams are
relevant to the success of any start-up, this study looks at
ETH spin-off teams in terms of first-time versus serial en-
trepreneurs, educational level, educational background and
demographic characteristics (nationality, gender). After-
wards, team diversity will be linked to the ability to attract
funding in 4.1.4.
4.1.1. Single Founders (n=7) versus Founding Teams
(n=136)
According to Schjoedt and Kraus (2009), there is a strong
link between the performance of a new venture and the
number of founders involved. One of the great myths in
current entrepreneurship is the image of the lone hero being
successful all by himself. This stereotype has been fuelled
by stories about entrepreneurs such as Mark Zuckerberg
and Elon Musk (Cooney, 2005; Klotz, Hmieleski, Bradley,
& Busenitz, 2014) despite the fact that they too built their
success on strong teams. According to the literature, entre-
preneurial teams lead to higher performance than single
founders because a team has more social and human capital
at its disposal in dealing with the uncertainties associated
with new venture foundation. Since teams tend to have a
better performance record, venture capital firms also prefer
to invest in teams rather than in single founders (Schjoedt &
Kraus, 2009). This picture is seemingly confirmed by ETH
Zurich spin-offs, where 95 per cent of all spin-offs have been
founded by teams. These companies receive on average
nearly seven times more funding than companies set up by
a single founder, illustrating the advantage of a founding
team. According to the underlying sample, entrepreneurial
teams also have a higher probability of staying in operation
(88.2 per cent, n=120) and a significantly lower likelihood of
liquidating their business (4.4 per cent, n=6) compared with
single-founder spin-offs.
4.1.2. Novices versus Serial Entrepreneurs
Serial entrepreneurs are individuals who have founded more
than one venture as opposed to first-time entrepreneurs
(novices), who are founding for the first time (Wright, Robbie,
& Ennew, 1997). Serial entrepreneurship can be seen as a
good predictor of future start-up success, regardless of the
outcome of previous venture(s) (Shane, 2004). In our further
analysis we will only differentiate between prior and no pri-
or experience because the number of previously founded
start-ups does not influence the survival rate (Delmar &
Shane, 2006).
According to the European Startup Monitor (ESM), the pro-
portion of serial entrepreneurs ranges from 49.5 per cent in
Switzerland to as high as 61 per cent in the United States
(Hensellek, Kensbock, Kollmann, & Stöckmann, 2016). 35.6
per cent of ETH Zurich spin-offs have at least one founder
with prior experience of founding a company (see Figure 5).
The proportion of serial entrepreneurs among ETH Zurich
spin-offs is around 15 per cent lower than the overall pro-
portion of serial entrepreneurs in Switzerland. There are a
few potential explanations for this gap. ETH Zurich spin-offs
4. Value Created by ETH Zurich Spin-Offs

13
4. Value Created by ETH Zurich Spin-Offs
are created based on research, with the founders typically
growing into the role of entrepreneurs. They are often found-
ed by first-time entrepreneurs as the founders come from
an academic research background. Moreover, since ETH
Zurich spin-off incorporations by students or staff are typi-
cally opportunistic, those entrepreneurs are less likely to
found again. Serial entrepreneurs, on the other hand, typi-
cally report a family background, and there is a high simi-
larity between the current and previous businesses (West-
head & Wright, 2015).
ETH Zurich spin-off founding teams with prior entrepreneur-
ship experience have a slightly higher probability of staying
in business and a lower probability of being liquidated. This
finding is consistent with prior studies (Holmes & Schmitz,
1996; Headd, 2003).
4.1.3. Diversity in Entrepreneurial Founding Teams
Wright and Vanaelst (2009) find that there are both pros and
cons with diversity. Access to a wider range of information
and alternative points of view supports the case for hetero-
geneous teams. Team diversity can yield more creativity and
greater potential for new innovations. On the other hand,
diversity can also give rise to negative emotions, conflicts
and ineffectiveness. Homogeneity might therefore make it
easier to work towards a common goal.
This report examines the diversity of ETH Zurich spin-off
teams based on four factors: gender, nationality, level of ed-
ucation and field of education. The results show that
although the spin-off teams at ETH Zurich are diverse in
terms of nationality and educational level, they are very sim-
ilar in terms of educational background. However, it is not
surprising that ETH Zurich spin-off companies do not exhibit
a high degree of diversity in the field of education, since these
companies are mainly founded by researchers and students
from the natural sciences and engineering. In addition, the
team diversity survey includes only founders in the present
survey, while non-founding team members who could possi-
bly contribute to this diversity are not taken into account in
the evaluation. Academic research supports these findings:
Nikiforou, Zabara, & Clarysse (2018) conclude that university
spin-offs are generally more homogeneous than other com-
panies in terms of educational background, industry experi-
ence and entrepreneurial experience, as these start-ups typ-
ically recruit their team from the university community.
4.1.4. Gender Diversity
Diversity, and specifically gender diversity, is an important
issue when it comes to business and entrepreneurship.
According to the Global Startup Ecosystem Report (GSER)
(Startup Genome, 2018), there are several differences in the
mindset of founders. However, gender diversity is not just a
social debate – it is economically relevant as well. A McKinsey
report states that companies in the top quartile for gender
diversity on their executive teams are 21 per cent more likely
to have above-average profitability than companies in the
fourth quartile (Hunt, Prince, Dixon-Fyle, & Yee, 2018).
Figure 5: ETH Zurich spin-offs; serial entrepreneurs in the founding team (n=143)
Two or more serial entrepreneurs
One serial entrepreneur
No serial entrepreneurs
Total number of companies
0 10 20 30 40 50 10090807060
9
42
92

14
The Performance of Spin-Off Companies at the Swiss Federal Institute of Technology Zurich
The basis for this comparison is a total of 143 spin-offs,
which were incorporated by a total of 415 founders, of which
only 7.95 per cent (33) were female founders.
Since 2007 there has been a clear shift towards more wom-
en in founding teams (see Figure 6). The trend towards high-
er participation of women in start-up teams is also slightly
positive, but major efforts are still needed to achieve an equal
gender ratio. The Gender Action Plan developed in 2014 (ETH
Zurich, 2014) could help to start closing the gap between fe-
male and male founders, although more concrete measures
need to be taken to achieve gender equality not only at the
educational level but also in the context of spin-offs.
Compared with the Swiss start-up ecosystem, spin-offs from
ETH Zurich thus represent the male-dominated start-up sec-
tor to an above-average extent. The European Startup Mon-
itor estimated the proportion of female founders in Switzer-
land to be 10.7 per cent in 2016, which is below the European
average of 14.8 per cent (Hensellek et al., 2016). The lower
proportion of female founders at ETH Zurich spin-offs can be
explained by the low proportion of women at technical uni-
versities in general. According to Handelszeitung (Mair, 2017),
there are fewer women studying computer science and en-
gineering and they are more likely to get involved in start-ups
in the life sciences, food or creativity sectors. This is con-
firmed by the numbers from ETH Zurich, where the propor-
tion of female bachelor’s and master’s degree students was
31.4 per cent in 2017. The proportion of female PhD students
rose slightly to 31.7 per cent from the year before, and the
proportion of female postdocs exceeded 30 per cent for the
first time in 2017 (Schubert and Storjohann, 2018). However,
if the proportion of women at ETH Zurich (around 31 per cent)
is considered in relation to the proportion of female founders
(roughly 8 per cent), ETH Zurich performs better than the
average for Switzerland as a whole (10.7 per cent), with wom-
en accounting for around 50 per cent of its total population.
Thus, although women make up a lower proportion of grad-
uates here, ETH Zurich seems to encourage the entrepre-
neurial spirit of its female students and employees.
Figure 6: ETH Zurich spin-offs; founding teams’ gender composition by year (n=143) (RHS = right-hand side)
Num
ber
of f
ound
ers
Pro
port
ion
Sum of all male founders Sum of all female founders
Proportion of female founders (RHS) Linear: proportion of female founders (RHS)
1980
1989
1990
1993
1996
1998
2000
2001
2002
2003
2004
2005
2006
2007
2008
2009
2010
2011
2012
2013
2014
2015
2016
2017
2018
0 0%
10 10%
20 20%
30 30%
40 40%
50 50%
60 60%

15
4. Value Created by ETH Zurich Spin-Offs
4.1.5. Ability to Attract Funding
All of the aforementioned human resources-related factors
are combined in the ability to attract financial capital. This
competence is essential to accelerate the technical develop-
ment and thus the success of a spin-off. In addition, the cap-
ital is needed to hire the right people and procure the equip-
ment necessary for technical development. (Shane, 2004)
Recent studies have examined how diversity amongst teams
affects VC investments. Vogel et. al (2014) have been focus-
ing on task-oriented diversity (e.g. education and experience)
and relationship-oriented (e.g. age, nationality and gender)
dimensions of team diversity. According to their study, both
types of diversity are said to affect investment decisions
positively. However, the results regarding relationship-ori-
ented diversity are not unanimous, as previous studies have
come to different conclusions. The findings of this ETH Zu-
rich spin-off report are presented in Table 1 and discussed
in the following sections.
Out of the 143 survey respondents a total of 129 companies
provided information about contributions to equity-based
funding, resulting in an average funding amount of CHF 4.1
million per company. Financing figures range from the lowest
of CHF 10 thousand to the highest of CHF 56.1 million for a
single company. While the smaller amounts have mainly
come from the founders themselves, the larger investments
have come from business angels (BAs) and venture capital-
ists (VCs). As we have calculated these figures on the basis
of the respondents’ data, they are expected to be well below
the actual values for the total population (n=429). This topic
is discussed further in Chapter 4.3.1 (Equity Funding History).
Seven companies reported to have been started by single
founders, while 136 companies were founded by entrepre-
neurial teams. The average funding amount for companies
started by single founders was CHF 0.6 million, while the
average amount per company started by a founder team was
CHF 4.2 million.
Table 1: ETH Zurich spin-offs; equity funding and sources by founder team (FT) composition (n=129)
Indications
Average funding[CHF million]
# BA / VC Other funding sources
Total 4.1 129 85% 15%
FT including serial entrepreneurs 5.1 48 86% 14%
FT with no serial entrepreneurs 3.5 81 84% 16%
FT including females 1.4 25 70% 30%
FT with only male founders 4.7 104 86% 14%
Single founders 0.6 6 87% 13%
Founding teams (FT) 4.3 123 85% 15%
Nationality: homogeneous 4.7 48 83% 17%
Nationality: heterogeneous 3.7 81 86% 14%
Degree of education: homogeneous 4.6 47 94% 6%
Degree of education: heterogeneous 3.8 82 79% 21%
Field of education: homogeneous 4.2 66 81% 19%
Field of education: heterogeneous 4.0 63 89% 11%

16
The Performance of Spin-Off Companies at the Swiss Federal Institute of Technology Zurich
As outlined above, serial entrepreneurship is one of the driv-
ers behind the success of a company. This fact is also re-
flected in the ability to attract funding. While companies
including one or more serial entrepreneurs have been able
to attract an average of CHF 5.1 million per company, the
spin-off teams with no previous experience attracted only
CHF 3.5 million per company.
The gender gap in spin-offs from ETH Zurich, which has been
discussed in 4.1.3, is also reflected in the amount of funds
received and thus contradicts the study by Vogel et al. (2014),
which states that gender diversity among the relation-
ship-oriented dimensions of team diversity improves a start-
up’s chances of receiving investment funding. Out of 30 com-
panies, including at least one female founder, 25 stated that
they had received equity-based financing, resulting in aver-
age funding of CHF 1.4 million. In contrast, start-up teams
consisting only of male founders received an average of CHF
4.7 million. When interpreting these numbers it is important
to consider that the majority of companies with female
co-founders have been incorporated in the last few years
(see Figure 6). This means that they may not have had time
to raise as much money as older companies yet, because
they are only in the seed or Series A stage.
Of particular interest is the fact that homogeneous teams in
the other areas which were investigated further (nationality,
level of education and field of education) on average received
more funding per spin-off than heterogeneous teams. The
survey results contradict the findings of Vogel et al. (2014)
regarding both task-oriented (education) and relation-
ship-oriented (nationality) diversity.
According to Shane’s (2004) university status model, an
entrepreneur with a higher university degree is more likely
to launch a successful spin-off. Since external stakeholders
cannot judge whether an invention will be successful, they
usually reckon that entrepreneurs with a higher degree are
a safer bet and are therefore more willing to invest money
in these projects.
To analyse this theory, the highest university degree of one
of the founders was considered for each spin-off. 142 spin-
offs gave details of their founders’ education. All companies
without financial contributions were excluded from this com-
parison (n=14). Averaging CHF 5.6 million per spin-off, com-
panies with a PhD as the highest level of education among
their founders were able to raise more funds per spin-off
than other types of degree (CHF 3.7 million for a professor-
ship and CHF 1.0 million for a master’s degree as the highest
level of education), thereby contradicting Shane’s university
status model (see Figure 7).
One important aspect to consider when interpreting these
findings is the type of involvement that the different founding
team members typically have in ETH spin-offs. While
co-founders with a master’s degree or PhD typically join the
company as part of the operational team, professors’ involve-
ment is mostly limited to a minority shareholding, a seat on
the management board, or a scientific advisory role. This also
needs to be taken into consideration when comparing with
the findings of Shane (2004) and Vogel et al. (2014).
Figure 7: ETH Zurich spin-offs; equity funding by highest university degree among the founding team (n=128)
Professorship (n=47) CHF 172’232’000 Doctorate (n=60) CHF 333’523’000 Master’s (n=21) CHF 20’733’000

17
4. Value Created by ETH Zurich Spin-Offs
4.2. Impact on Local Economy and Innovation
The establishment of a successful business depends not
only on the team but also on the underlying idea of value
creation. In 2017 a third of the total ETH spin-off population
(n=145) generated revenues of CHF 889 million, creating sig-
nificant value and impact on the local economy. Intellectual
property and collaborations with external partners can have
a significant impact on the success of a start-up from an
early stage as they can help to accelerate technical devel-
opment and realise the growth potential of the company. As
a start-up grows, it has an impact on the local economy, for
example by creating jobs. These topics will be discussed in
the following chapters.
4.2.1. Patents and Other Intellectual Property
Intellectual property rights, such as patents, help to protect
ideas, and the number of patents held by a spin-off may even
reduce the likelihood of failure (Shane, 2004). All spin-offs
were asked to indicate the number of patent families regis-
tered on behalf of the company, the number of patent fami-
lies licensed by ETH and the number of patent families
licensed by third parties. For all ETH spin-offs that partici-
pated in the survey a total of 493 patent families are regis-
tered in the name of the company. In addition, ETH spin-offs
have licensed 74 patent families from ETH Zurich and a fur-
ther 39 patent families from third-party institutions and or-
ganisations. These figures show a multiple of about 6.5x,
which means that for each patent licensed by ETH Zurich,
the spin-off filed on average about 6.5 patents in its own
name.
Of the 143 companies that participated in the study, around
40 per cent of the repondents (n=58) reported that at least
one patent had been granted or applied for on behalf of the
company. With the total number of patents being 493, there
is an average of 3.44 patents per company if you calculate
them for all companies and 8.5 patents if you consider only
those companies which mention that they have filed patents.
However, of these 493 patents, 265 patents are associated
with only three enterprises, as shown in Figure 8.
There are significant differences in the numbers of patents
between the different sectors. Electrical Engineering & Elec-
tronics reports the highest number of patents, while the
Others sector accounts for only one per cent (see Figure 9).
Figure 8: ETH spin-offs; distribution of patent families across companies (n=143)
0%
20%
0 10 20 30 40 50 60
40%
60%
80%
100%
Per
cent
age
of a
ll p
aten
ts
Number of spin-offs

18
The Performance of Spin-Off Companies at the Swiss Federal Institute of Technology Zurich
The large differences between the sectors can be partly ex-
plained by the different sample sizes within each industry
sector (see Figure 1). However, the different importance of
patents for some sectors compared with others might also
play a role. In industries where the ratio between the cost of
counterfeiting and the cost of innovation is lower (e.g. ma-
chinery, electronics, pharmaceuticals), patents are likely to
be more important. Moreover, patents tend to be relevant
when research and development is very capital-intensive
and uncertain (Orsenigo & Sterzi, 2010). The ICT sector has
a relatively low proportion of patents, probably because
software is protected by copyright and not always filed as a
patent based on a computer-implemented invention. In ad-
dition, consultancy services, often offered by start-ups in
the Others sector, are usually not patentable.
4.2.2. Industrial Collaborations
The European Startup Monitor (Hensellek et al., 2016) states
that the willingness of established companies to cooperate
with start-ups is an important factor in creating a vital en-
vironment for entrepreneurship. These findings show that
almost three out of four start-ups participate in collabora-
tions with established companies. At 86.5 per cent, Switzer-
land is slightly above this figure.
Of the 143 companies, 39.16 per cent stated that they had
industrial partnerships that had contributed significantly to
their progress and success. Spin-offs from ETH Zurich have
benefited from industrial partnerships both financially and
non-financially. The most frequently mentioned are financial
contributions that assist in the completion of the first prod-
uct/service, support and financing of pilot projects or sup-
port for one or more specific projects. Partners of ETH
Zurich spin-offs are primarily large national or internation-
al companies. There is a diversity of different partners, with
most of these partners being either technology companies
or pharmaceutical companies. From an industry perspective,
the spin-offs involving advanced materials, chemical pro-
cesses and compounds, and micro-nanotech attach particu-
lar importance to cooperation with industrial partners.
The difference between the results of the European Startup
Monitor and the present research could be explained by the
way in which the question put to participants was framed.
As participants in this survey were asked to indicate impor-
tant contributions from industry partnerships, minor contri-
butions may not have been indicated, apart from the fact that
an accumulation of these minor contributions may have had
a significant impact on the start-up’s history. Furthermore,
very young companies may not have been able to establish
industry partnerships yet.
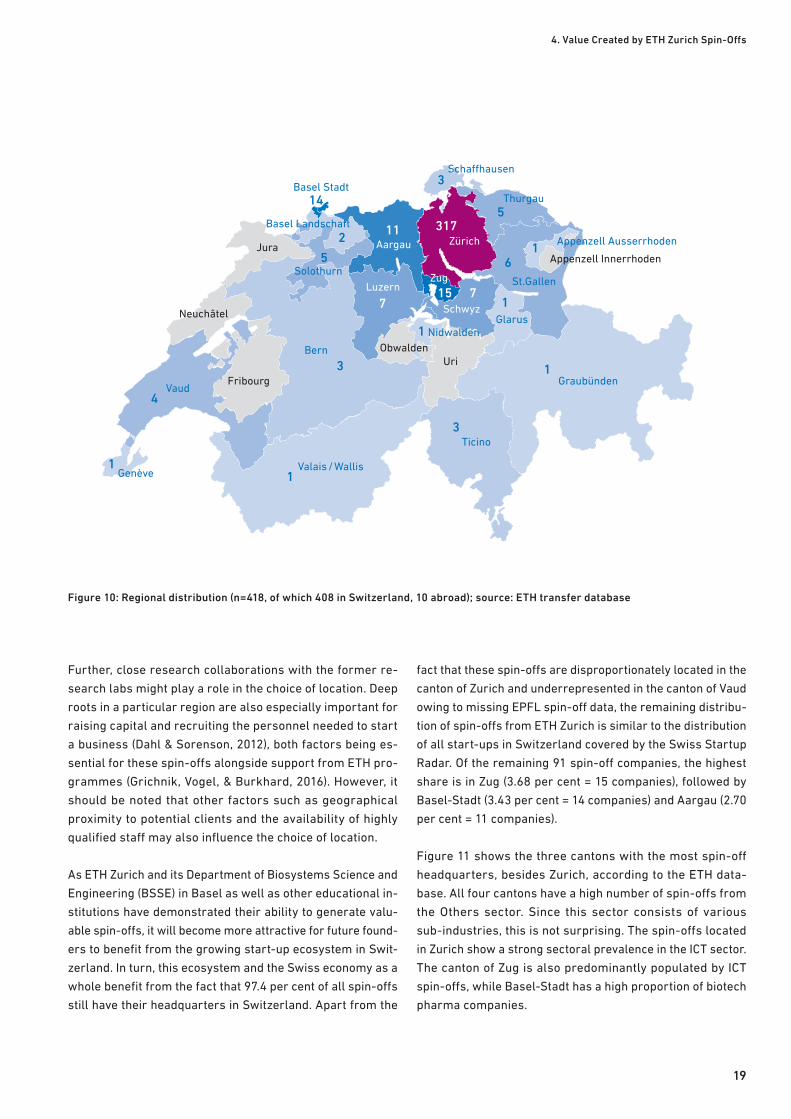
4.2.3. Location
We analysed the headquarters of all ETH spin-offs based on
ETH transfer’s internal database (n=419). The heat map in Fig-
ure 10 shows that the majority of spin-offs (75.7 per cent) are
located in the home region of the parent university in the can-
ton of Zurich. This fact confirms the argument that geograph-
ical proximity to the parent university offers an advantage in
terms of access to academic knowledge and resources.
Figure 9: ETH Zurich spin-offs; number of patents by sector (n=143)
Advanced Materials (3%) Biotech Pharma (13%) Chemical Processes & Compounds (3%) Electrical Engineering & Electronics (49%) Information & Communications Technology (ICT) (6%) Mechanical Engineering & Aerospace (6%) Medical Devices (4%) Micro- & Nanotechnology (15%) Sensors Analytics (0%) Others (mainly consulting) (1%)
19
4. Value Created by ETH Zurich Spin-Offs
Further, close research collaborations with the former re-
search labs might play a role in the choice of location. Deep
roots in a particular region are also especially important for
raising capital and recruiting the personnel needed to start
a business (Dahl & Sorenson, 2012), both factors being es-
sential for these spin-offs alongside support from ETH pro-
grammes (Grichnik, Vogel, & Burkhard, 2016). However, it
should be noted that other factors such as geographical
proximity to potential clients and the availability of highly
qualified staff may also influence the choice of location.
As ETH Zurich and its Department of Biosystems Science and
Engineering (BSSE) in Basel as well as other educational in-
stitutions have demonstrated their ability to generate valu-
able spin-offs, it will become more attractive for future found-
ers to benefit from the growing start-up ecosystem in Swit-
zerland. In turn, this ecosystem and the Swiss economy as a
whole benefit from the fact that 97.4 per cent of all spin-offs
still have their headquarters in Switzerland. Apart from the
fact that these spin-offs are disproportionately located in the
canton of Zurich and underrepresented in the canton of Vaud
owing to missing EPFL spin-off data, the remaining distribu-
tion of spin-offs from ETH Zurich is similar to the distribution
of all start-ups in Switzerland covered by the Swiss Startup
Radar. Of the remaining 91 spin-off companies, the highest
share is in Zug (3.68 per cent = 15 companies), followed by
Basel-Stadt (3.43 per cent = 14 companies) and Aargau (2.70
per cent = 11 companies).
Figure 11 shows the three cantons with the most spin-off
headquarters, besides Zurich, according to the ETH data-
base. All four cantons have a high number of spin-offs from
the Others sector. Since this sector consists of various
sub-industries, this is not surprising. The spin-offs located
in Zurich show a strong sectoral prevalence in the ICT sector.
The canton of Zug is also predominantly populated by ICT
spin-offs, while Basel-Stadt has a high proportion of biotech
pharma companies.
Figure 10: Regional distribution (n=418, of which 408 in Switzerland, 10 abroad); source: ETH transfer database
317
15
11
77
1
1
1
1
6
1
5
2
14
3
3
5
1
4
3Ticino
Nidwalden
Graubünden
Valais / WallisGenève
VaudFribourg
Bern
Neuchâtel
JuraAppenzell Ausserrhoden
Appenzell Innerrhoden
UriObwalden
Basel Stadt
Basel Landschaft
SolothurnSt.Gallen
Glarus
Thurgau
Schaffhausen
Zürich
Zug
Aargau
Luzern
Schwyz

20
The Performance of Spin-Off Companies at the Swiss Federal Institute of Technology Zurich
It is important to note that the start-up ecosystem in Swit-
zerland differs significantly from other markets in which
most start-ups are located in the e-commerce sector. Swit-
zerland is more focused on niche products and more com-
plex innovations in robotics and financial software, which
can be explained by the scientific complexity of research at
ETH Zurich and the technologies developed through this re-
search (Kyora et al., 2018).
The high rate of ICT spin-offs within the canton of Zug is not
surprising. According to the Swiss Startup Radar, the canton
of Zug makes an outstanding contribution to the Swiss eco-
system. Zug is only inhabited by 1.48 per cent of the total
Swiss population but accounts for 2.87 per cent of the coun-
try’s GDP and includes 4.61 per cent of all start-up compa-
nies within Switzerland (Kyora et al., 2018). Zug is able to
attract foreign founders as a result of the excellent condi-
tions that it offers. Incidentally, Zug is known as ‘Crypto Val-
ley’ and provides around 3’000 jobs in the blockchain indus-
try (Torcasso, 2018). Zug is the second-largest region for
ETH Zurich spin-offs – mainly companies from the ICT and
Others sectors – which is consistent with general findings
from other reports.
The northwest of Switzerland is part of the international ‘Bio
Valley’ cluster, which includes pharmaceutical institutions
such as Roche and Novartis and also hosts a compact net-
work of diverse medtech, biotech and nanotech companies
(Grichnik et al., 2016). This fact is confirmed by the data col-
lected, since Aargau and in particular Basel-Stadt show high
proportions of spin-off companies in the life-science sector.
4.2.4. Job Creation
Job creation and job destruction are two crucial factors in
terms of their impact on society. It is in the interest of the
government and society as a whole that net job creation
within an economy is positive. An important question
concerns the role of start-ups in this cycle of creation and
destruction. Looking at US industry, Kane (2010) claims that
there would be no net growth in the US economy without
start-ups. Mauldin (2017) also states that technology is a
job-creating machine because technology start-ups initially
only create jobs and do not destroy them. When analysing
the ETH spin-off sample one needs to bear in mind that the
analysed companies are at very different stages of their
lifecycles and that the survey respondents incorporated
their ventures in a time period spanning from the 1970s to
the same calendar year that the survey was distributed. This
heterogeneous sample composition has implications for sev-
eral aspects of this report, including job creation.
All spin-offs were asked to state the highest number of em-
ployees since their creation. Of the total population, 143
companies reported valid responses, and two companies
were added manually based on publicly available informa-
tion. By 31 December 2018 the 145 spin-off companies from
ETH Zurich had created direct jobs for a total of 4’447.6
Figure 11: ETH Zurich spin-offs; canton of headquarters by sector (n=40) in Zug, Basel-Stadt and Aargau
Zug (n=15) Basel-Stadt (n=14) Aargau (n=11)0
2
4
6
10
8
14
12
16
Biotech Pharma Chemical Processes & Compounds Electrical Engineering & Electronics Information & Communications Technology (ICT) Mechanical Engineering & Aerospace Medical Devices Others (mainly consulting)

21
4. Value Created by ETH Zurich Spin-Offs
full-time equivalents (FTEs). This figure equates to an aver-
age of 30.9 jobs per company, although there are consider-
able differences between sectors, as shown in the table
below. As only one-third (n=143) of all spin-offs from ETH
Zurich have reported valid results, total job creation is only
an approximation and a clear underrepresentation.
4.2.4.1. Job creation per sector
The top three spin-offs have created 2’100 jobs over the
years. The Electrical Engineering & Electronics sector ac-
counts for the highest number of jobs created, with 2’054.7
jobs (46.2 per cent of the total amount of jobs), but includes
only 10.3 per cent of all companies (see Figure 12). The re-
sult is average job creation of 137 jobs per spin-off for this
sector. It is important to note that the two largest companies
in the sector are distorting the average by contributing 1’740
FTEs. One of these two companies did not participate in the
study but was included in the analysis with 1’010 full-time
equivalents – based on its annual report – in order to get a
better approximation of the overall level of job creation. An-
other company from the Mechanical Engineering & Aero-
space sector was added with a contribution of 360 FTEs. ICT,
which accounts for 28.3 per cent of the total spin-off popu-
lation, provides only 697.9 jobs, representing an average of
17 jobs per company. The lowest average job creation is
achieved in the Advanced Materials sector, where the aver-
age is 5.7 jobs per company.
According to the European Startup Monitor (Hensellek et al.,
2016), Swiss start-ups have an average workforce of 13.5
employees and 2.6 founders, which is above the average
European headcount of twelve (9.5 employees plus 2.5
Figure 12: ETH Zurich spin-offs; jobs created per sector (n=145) (RHS = right-hand side)
Total sum of jobs Average per spin-off and sector (RHS)
0 0
500
20
1’000
40
60
80
1’500100
2’000
140
120
2’500 160
Mec
h. E
ng. A
eros
pace
Med
ical
Dev
ices
Mic
ro-N
anot
ech
Sen
sors
Ana
lyti
cs
Oth
ers
ICT
Ele
ctri
cal E
lect
roni
cs
Che
mic
al
Bio
tech
Pha
rma
Adv
ance
d M
ater
ials
Tota
l num
ber
of F
TE
s pe
r se
ctor
Ave
rage
num
ber
of F
TE
s pe
r se
ctor

22
The Performance of Spin-Off Companies at the Swiss Federal Institute of Technology Zurich
founders). With an average workforce of around 31 per spin-
off (n=145), ETH spin-offs employ more than twice as many
staff as the European average. If we do not take the three
largest spin-offs into account, the result of 16.5 FTEs per
spin-off company (n=142) is still above the average of Swiss
and European start-ups. However, this comparison has to be
seen in relation to the respective time span. The ETH spin-off
study includes older and newer spin-offs, while the Europe-
an Startup Monitor may have had a different time limit for
what can still be considered a start-up, which might have an
impact on the measurement of job creation. Although older
companies employ the majority of today’s workforce, early-
stage start-ups are the main source of net new hires (Burk-
hard, 2015). ETH spin-off companies have created an aver-
age of 2.22 jobs per year over the last 18 years. If we com-
pare this annual job creation with the Swiss start-up
ecosystem for the same vintages as Grichnik et al. (2016),
ETH spin-offs also perform better: they indicated annual job
creation of 1.8 per new venture between 2011 and 2013
based on data from the Swiss Federal Statistical Office.
From these figures it can be concluded that the creation of
jobs by spin-off companies from ETH Zurich influences the
Swiss economy and contributes substantially to the growth
of this economy.
4.2.4.2. ETH Zurich graduates employed by ETH spin-offs
On average, ETH spin-offs hire ETH Zurich graduates for
almost a quarter (24.54 per cent) of their jobs, although the
employment rates of ETH Zurich graduates vary consider-
ably between the various industries (see Figure 13). One ex-
planation is the highly specific knowledge or expertise need-
ed in some of these sectors. A good example of this is the
Figure 13: ETH Zurich graduates hired by spin-offs per sector (n=143) (RHS = right-hand side)
Total sum of FTEs per sector Total sum of ETH graduates per sector Percentage of ETH graduates employed (RHS)
0 0
200
400
10%
600
20%
30%
40%
80050%
100060%
1200 70%
Mec
h. E
ng. A
eros
pace
Med
ical
Dev
ices
Mic
ro-N
anot
ech
Sen
sors
Ana
lyti
cs
Oth
ers
ICT
Ele
ctri
cal E
lect
roni
cs
Che
mic
al
Bio
tech
Pha
rma
Adv
ance
d M
ater
ials
Num
ber
of F
TE
s /
grad
uate
s pe
r se
ctor
Sha
re o
f gr
adua
tes
empl
oyed
per
sec
tor

23
4. Value Created by ETH Zurich Spin-Offs
Electrical Engineering & Electronics sector, where spin-offs
have more than 100 employees on average, but still four out
of ten employees are ETH Zurich graduates. In other cases,
however, spin-off companies already have specific expertise
from their founders, so companies are looking for people
from other educational backgrounds to build a team with
different skill sets. A good example here is the ICT sector,
where an average of 17 employees work at each spin-off,
but only 13.7 per cent of them (i.e. roughly two people) are
ETH Zurich graduates. The large proportion of ETH Zurich
graduates working in the Advanced Materials sector makes
sense when compared with the average number of employ-
ees from the previous section. Since on average only around
six people work in these spin-offs, about three of them are
ETH Zurich graduates. This figure should roughly corre-
spond to the size of the founding team. In addition, the low
total number of employees indicates that these spin-offs –
possibly due to their young average age – have not yet sig-
nificantly expanded their human capital. It is important to
note that some of the figures for this section may not be valid
as the founders only gave approximate employment rates.
4.2.5. The Global Presence of ETH Spin-Offs
All ETH spin-off companies have been asked to indicate
whether they have further branches located around the
world. For this reason the world has been divided into eight
regions. In addition to the six continents, the United States
and Germany have been analysed separately in the survey
because they were expected to be of particular importance
to ETH Zurich spin-offs. As can be seen in Figure 14, the US,
Germany and Europe dominate, which indicates the rele-
vance of these markets for spin-offs and, at the same time,
Figure 14: Global presence of ETH spin-offs (n=143)
Germany (n=17) Europe (n=16) United States (n=18) North America (n=4)
South America (n=2) Asia (n=12) Australia (n=3) Africa (n=2)

24
The Performance of Spin-Off Companies at the Swiss Federal Institute of Technology Zurich
their strategic approach to globalisation. Following them,
Asia seems to be the most important region, while other
areas are only marginally represented. Based on these find-
ings, however, it is not possible to say how or to what extent
these regions are relevant to ETH Zurich spin-offs, as no
comparison was made with their value chains. Their impor-
tance may therefore lie in different areas such as resource
acquisition, production, storage or distribution.
4.2.6. Comparison between Pioneer Fellows and
Non-Pioneer Fellows
As briefly mentioned in section 3.1, the Pioneer Fellowship
programme has been supporting promising deep-tech en-
trepreneurial projects since 2010. One way to evaluate ETH
Zurich’s spin-off support is to compare revenue generation
between pioneer fellows and non-pioneer fellows. While 40
companies founded by non-pioneer fellows since 2010 gen-
erated a total of CHF 26 million in revenues in the 2017 finan-
cial year (an average of CHF 650 thousand per company), the
29 companies in the sample that were incorporated by pio-
neer fellows in the same time period generated a total of CHF
5.7 million (an average of CHF 200 thousand per company).
What stands out when looking at the distribution of the sup-
port across sectors is that ICT projects are strongly under-
represented among supported projects. As a result, around
half of all companies without Pioneer Fellowships are ICT
companies, while only around 15 per cent of the companies
with Pioneer Fellowships are ICT companies. All other sec-
tors have relatively equal representation in both clusters,
with a slight tendency for more Biotech Pharma and Electric-
al Engineering & Electronics in the Pioneer Fellowship.
The lower number of ICT projects in the Pioneer Fellowship
programme has significant impact on the average revenues
for these two clusters, as seen in Table 3. Except for an out-
lier for Sensor Analytics, ICT companies have the highest
average revenues and, since they make up around half of the
companies without a Pioneer Fellowship, that average is
improved considerably. Of course, the high revenues from
Sensor Analytics also contribute by raising the average for
this cluster.
The skewed distribution of ICT and Biotech Pharma projects
between the two groups can most likely be explained by the
fact that the Fellowship is often awarded to projects with long
development cycles. These projects are typically more de-
pendent on funding, since the time to revenues is longer. The
Fellowship is one of the tools meant to ensure that promising
technologies can be effectively spun out of ETH Zurich, even
with high development costs and investment needs.
Table 3: Average yearly revenues in 2017 per sector between pioneer fellows and non-pioneer fellows in spin-offs founded since 2010 (n=69)
Average yearly revenues in 2017 per sector
Non-pioneer fellows (n=40) Pioneer fellows (n=29)
Advanced Materials 116’667 100’000
Biotech Pharma 250’000 23’108
Chemical processes & Compounds 165’364 50’000
Electrical Engineering & Electronics 400’000 345’400
Information & Communications Technology ICT 574’885 506’250
Mechanical Engineering & Aerospace 343’715 181’400
Medical Devices 300’000 –
Micro- & Nanotechnology n/a 1’800
Sensors Analytics 10'000’000 55’000
Others 183’767 220’000
Average revenues across all sectors 650’585 197’977

25
4. Value Created by ETH Zurich Spin-Offs
4.3. Financing and Investment
Once a spin-off has been founded and the university patent
or software has been licensed, it is essential to ensure suf-
ficient liquidity to further develop the technology and bring
the product or service to market. In order to avert failure,
a start-up needs adequate financing for further product and
business development. Since the development of higher-
education technology can also cost millions, university spin-
offs in particular are heavily dependent on external sources
of finance. Because financing and the search for investment
are so important for early-stage start-ups, this report fur-
ther examines the financial situation for ETH spin-offs.
4.3.1. Equity Funding History
From the sample of spin-offs with complete fundraising in-
formation (n=131), 58 start-ups participated in a business
angel (BA) or venture capital (VC) round and a total of CHF
570.8 million was raised in equity. In an extrapolation of the
other 298 spin-offs from the total population, with 85 show-
ing evidence of BA or VC financing based on press releases
and additional documents from ETH transfer, it is likely that
the funds drawn from ETH’s entire spin-off population are
well over CHF 1 billion.
In the sample of 131 spin-offs, BAs contributed a total of CHF
154.5 million (27.1 per cent) and VCs invested CHF 336.7
million (59.0 per cent) (see Table 4). The founders them-
selves brought in CHF 12.9 million (2.3 per cent), while
family and friends contributed CHF 19.6 million (3.4 per cent).
The remaining CHF 47.2 million (8.3 per cent) originated from
other sources.
There is an uneven distribution of funds collected per spin-
off, with the leading fundraiser in the sample absorbing 9.8
per cent of total funds and the top ten fundraisers accounting
for 64.5 per cent of total funds. Despite an average equity
per spin-off of CHF 4.4 million, the median is only CHF
350,000 because most spin-offs are not (yet) BA- or VC-fund-
ed. From a sectoral perspective, the spin-offs of Biotech
Pharma attract by far the most capital, both aggregated at
CHF 223.4 million and per spin-off at CHF 10.1 million (see
Appendix A, Figure 1 for details). This will be related to the
very high costs associated with the entire product develop-
ment process, including expensive clinical trials.
As can be seen from Figure 15, the sample of 131 spin-offs
at the time of foundation brought in CHF 27.1 million – an
average of CHF 207’000 per spin-off – to which the founders
contributed the most (CHF 9.2 million, or 33.9 per cent). By
the time the first round after foundation is completed, the
founders’ contribution drops to only 2.1 per cent of the total
financing for that round.
For those start-ups that have succeeded in obtaining venture
backing, the largest contributions in round one come from
BAs (CHF 41.9 million) and VCs (CHF 53.8 million). At CHF 10.7
million (CHF 157’000 per spin-off), significant contributions
Table 4: ETH Zurich spin-offs; equity raised by source (n=131)
Funding in CHF million
Founders FFF BAs VCs Other Total
Non-BA/VC-backed spin-offs (73) 6.6 12.8 – – 15.5 34.9
BA/VC-backed spin-offs (58) 6.3 6.8 154.5 336.7 31.7 535.9
All spin-offs from sample (131) 12.9 19.6 154.5 336.7 47.2 570.8

26
The Performance of Spin-Off Companies at the Swiss Federal Institute of Technology Zurich
were also made in the same round by family members and
friends – mostly for companies that did not receive BA/VC
support. This contribution from the informal network (FFF)
of early-stage start-ups in Switzerland is comparable to oth-
er studies (Oskarsson & Schläpfer, 2008). According to the
Swiss Startup Monitor (Grichnik et al., 2016), the FFFs ac-
count for almost a fifth of all transactions but for only 4 per
cent of the total volume. As these start-ups reach the growth
stage, they are often able to attract external investors who
become the major source of funding since they usually pro-
vide larger investments (Grichnik et al., 2016). Over the
course of the rounds, shareholders’ equity rose from an av-
erage of CHF 207’000 at the time of foundation to CHF 10.8
million five rounds later. The proportion of contributions from
professional investors also rose with each round, reflecting
the greater maturity of the companies concerned.
4.3.2. Funding from Non-Dilutive Sources
From non-dilutive sources, i.e. grants, fellowships and com-
petitions such as CTI / Innosuisse, EU grants, Gerbert Rüf,
the Hasler Foundation, etc., the sample (n=131) received a
total of CHF 57.4 million, with an average of CHF 435’000 per
spin-off and a median of CHF 100’000. The largest amount
reported by a single spin-off from this category was CHF 8
million. The funds raised in equity capital (CHF 570.8 million)
compared with the non-dilutive sources amount to a multiple
of 10x, which shows that although non-dilutive sources have
contributed considerable amounts, the private capital market
is the dominant source of financing. The correlation between
equity funds and non-dilutive funds raised is 16 per cent,
indicating only a small connection between the two sources
of finance. This could be due to the fact that the two sources
substitute each other and thus reduce the correlative effect.
Figure 15: ETH Zurich spin-offs; equity raised by round and source (n=131) (RHS = right-hand side)Averages for fewer than ten observations are greyed out
0 0
20 2
40 4
6
8
60
10
80
12
140
120
100
14
Rou
nd 3
Rou
nd 4
Rou
nd 5
Rou
nd 2
Rou
nd 1
Inco
rpor
atio
n
Equ
ity
rais
ed in
CH
F m
illi
on
Ave
rage
rou
nd s
ize
in C
HF
mil
lion
Founders FFF
BAs VCs
Other Average round size (RHS)

27
4. Value Created by ETH Zurich Spin-Offs
Of all the industry sectors, Micro-Nanotech received the
most financial support at CHF 1.2 million per spin-off, al-
though no conclusions are possible here as there are only
two observations from this sector in the sample. This sector
is followed by Electrical Engineering & Electronics with CHF
856’000 in non-dilutive funds (based on 13 observations).
Although Biotech Pharma companies were leaders in equity
financing, they ranked fourth in terms of non-dilutive financ-
ing per spin-off but were number one in terms of absolute
amounts (see Figure 16). The fact that 39.2 per cent (n=143)
of ETH spin-offs cooperate with industrial partners also
shows that paid pilot projects and other forms of industrial
cooperation are another important source of financing.
4.3.3. Early-Stage Financing
Many of the spin-offs in the survey sample stated that they
did not use VC financing. They use a funding strategy of
reinvesting cash flow from customer projects rather than
relying on external financing from investors. This is particu-
larly feasible in industries where early paid prototypes or
product sales / consulting are possible and investment costs
are relatively low.
ETH Zurich spin-off founders contributed CHF 12.9 million
(n=131) to their companies, ranging from CHF 10 thousand
to CHF 1.45 million. With 372 founders involved in this sam-
ple, the average founder contributed CHF 34 thousand to the
financing of a start-up. Family, friends and fools (FFFs) in-
vested CHF 19.6 million, which equates to an average of CHF
137 thousand per spin-off across the entire sample (n=143)
Figure 16: ETH Zurich spin-offs; non-dilutive funding by sector (n=131) (RHS = right-hand side)Averages for fewer than ten observations are greyed out
Non-dilutive funding Average per spin-off (RHS)
0 0
2 0.2
4
6
0.4
0.6
0.88
1.0
14 1.4
1.2
16 1.6
Mec
h. E
ng. A
eros
pace
Med
ical
Dev
ices
Mic
ro-N
anot
ech
Sen
sors
Ana
lyti
cs
Oth
ers
ICT
Ele
ctri
cal E
lect
roni
cs
Che
mic
al
Bio
tech
Pha
rma
Adv
ance
d M
ater
ials
Non
-dilu
tive
fun
ding
in C
HF
mil
lion
Ave
rage
for
sec
tor
in C
HF
mil
lion
12
10

28
The Performance of Spin-Off Companies at the Swiss Federal Institute of Technology Zurich
or CHF 932 thousand if calculated only for companies that
reported contributions from this stakeholder group (n=21).
Two of the companies reported having received financing of
CHF 6.5 million and CHF 6 million respectively, which is a
very large amount for early-stage high-risk investments.
Neither company has indicated any other third-party funding
(BA/VC).
4.3.4. Comparison between Pioneer Fellows and
Non-Pioneer Fellows
When looking at total funding raised there is a significant dif-
ference between spin-offs with Pioneer Fellowships and
those without. The 33 companies incorporated by pioneer
fellows raised a total of CHF 48.4 million compared with a
total of CHF 132.7 million raised by companies incorporated
in the same time period that did not receive the grant. This
means that the spin-offs without a Pioneer Fellowship raised
on average close to 60 per cent more funding than spin-offs
supported by the Fellowship (see Table 5), which seems a bit
surprising. One possible explanation for this is that pioneer
fellows were able to delay the need for external financing
thanks to the non-dilutive grant money. However, since the
time window for this comparison is 2010 to 2018, it mainly
captures the first few years after incorporation and it is not
possible to draw any conclusions about the effects on fund-
raising ability for scaling the companies in these two clusters.
4.3.5. Later-Stage Funding from Business Angels
and Venture Capitalists
Based on an additional review of company websites and
press releases as well as through feedback from ETH trans-
fer, an effort was made to identify spin-offs that received
venture backing by BAs or VCs across the total population
(even among non-survey respondents). It is still likely, how-
ever, that a few transactions went unnoticed, which makes
this a conservative estimate of the overall number of BA/
VC-backed spin-offs.
Overall, evidence of business angel (BA) or venture capital
(VC) backing was found for 33.3 per cent of all spin-offs (143
out of 429 spin-offs). This is more not only in absolute terms
but also in relative terms compared with what was identified
in the studies on ETH Zurich spin-offs by Oskarsson &
Schläpfer (2008) and Pinter (2015), when 26.1 per cent and
30.8 per cent respectively received BA/VC funding. Wright
& Fu (2015) found that in the top 25 per cent quartile of UK
university spin-offs, 26.2 per cent were VC-backed and 6.1
per cent were angel-backed.
If we only consider the survey responses, 90 per cent of the
BA/VC-backed spin-offs have investors from Switzerland,
30 per cent from Germany and 30 per cent from other parts
of Europe. 20 per cent of the spin-offs are backed by US
Table 5: Average funding raised per sector for spin-offs incorporated between 2010 and 2018 for pioneer fellows versus non-pioneer fellows (n=90)
Average total funding raised per sector
Non-pioneer fellows (n=57) [CHF million] Pioneer fellows (n=33) [CHF million]
Advanced Materials 0.1 1.3
Biotech Pharma 5.5 1.3
Chemical processes & Compounds 0.3 1.1
Electrical Engineering & Electronics 1.4 1.3
Information & Communications Technology ICT 2.7 0.9
Mechanical Engineering & Aerospace 1.8 3.4
Medical Devices 1.1 1.1
Micro- & Nanotechnology n/a 1.5
Sensors Analytics 0.2 1.3
Others 1.4 0.5
Average across all sectors 2.3 1.5

29
4. Value Created by ETH Zurich Spin-Offs
investors and 10 per cent by Asian investors. If we look at
the sectors in Figure 17, ICT (45) and Biotech Pharma (35)
seem to be the most popular sectors for BA and VC invest-
ments in both absolute and relative terms.
Of the sample used for the study, 131 spin-offs indicated
their amount of fundraising. Of this sample, 58 spin-offs re-
ceived funds from BAs or VCs averaging CHF 8.5 million per
company. At the time of their foundation, nine spin-offs re-
ported that they had received an average of CHF 1.3 million
from BA and VC funds and, in the first round, 49 spin-offs
had already received an average of CHF 2 million. The aver-
age amount of BA and VC financing per spin-off increased
with each round and reached an average of CHF 10.1 million
per spin-off in round 5 (n=5).
There is a significant time lag before BAs and VCs start sup-
porting spin-offs, as the 58 BA/VC-backed companies need-
ed an average of 767 days (more than two years) to complete
their first investment round. This gap has widened by 1.5
months since the spin-off study conducted by ETH Zurich in
2008 (Oskarsson & Schläpfer, 2008). According to this study,
spin-offs tended to be backed at a later stage, which result-
ed in a ‘funding gap’. Because VCs seem to be more con-
cerned about the quality and lack of experience in manage-
ment teams of university spin-offs, they are more reluctant
to back these companies at the seed or start-up stage
(Oskarsson & Schläpfer, 2008). However, as we considered
a funding round to be closed at the time the equity was sold,
it is possible that spin-offs obtained BA/VC financing earlier
Figure 17: ETH Zurich spin-offs; BA/VC-backed companies by sector (n=429) (RHS = right-hand side)Percentages for fewer than ten observations are greyed out
Number in sector with BA/VC funding Percentage in sector with BA/VC funding (RHS)
0 0
10
20
30
10%
20%
30%
40%
4050%
50 60%
Mec
h. E
ng. A
eros
pace
Med
ical
Dev
ices
Mic
ro-N
anot
ech
Sen
sors
Ana
lyti
cs
Oth
ers
ICT
Ele
ctri
cal E
lect
roni
cs
Che
mic
al
Bio
tech
Pha
rma
Adv
ance
d M
ater
ials
Num
ber
of s
pin
-off
s
Per
cent
age
wit
h B
A/V
C f
undi
ng

30
The Performance of Spin-Off Companies at the Swiss Federal Institute of Technology Zurich
through mechanisms such as convertible loans4 or, even
more likely, financed their operations through non-dilutive
sources such as grants. Convertibles are a common way for
investors to invest in an early-stage start-up, especially in
the US. Convertible loans are practical, quick, inexpensive
and efficient and, at the same time, provide a legal option for
founders who need money quickly.
4.3.6. Financial Return
As specified in the VC literature, financial returns are mea-
sured using two common indicators: the money multiple and
the internal rate of return (IRR) (Lee & Cherif, 2019). The
money multiple is simply the sum of returns over the sum of
investments. In this study the investment is the sum of all
equity raised by a company, and the return is the equity val-
ue either at the time of exit or – if no exit has occurred – the
valuation on 31 December 2018. For example, a company
that collected CHF 100’000 at the time of incorporation, CHF
1’900’000 in subsequent funding rounds and later sold for
CHF 3’000’000 has a money multiple of 1.55. Since we are
interested in the overall performance of spin-offs, the com-
bined money multiple is calculated as the sum of all returns
for the entire spin-off sample over the sum of all invest-
ments for the entire spin-off sample.
The IRR is a discount rate that sets the net present value
(NPV) of all cash flows from a given project to zero. In this
study the cash flows correspond to the equity raised (out-
flow) and the equity value at the time of exit or – if no exit
has occurred – on 31 December 2018 (inflow). In order to
calculate the IRR, the equity value of the spin-offs must be
measured. The equity value represents the value of a com-
pany available to its owners or shareholders. It is deter-
mined by identifying the ex-post return on equity invested.
The equity of each company was valued individually and all
shares were treated as ordinary shares in a slight simplifi-
cation. By using the data from the survey, additional docu-
ments from ETH Zurich and separate research, it was pos-
sible to evaluate the equity of 148 spin-offs.
The present value of equity was calculated in line with the
study conducted by Oskarsson & Schläpfer (2008):
• Initial public offering (IPO): Two spin-offs underwent IPOs
on the Swiss stock exchange, and their share price at the
end of the first day of trading served as the basis for our
calculations.
• Reverse merger:6 Two companies were listed on the Swiss
stock exchange through a reverse merger, and their share
price at the end of the first day of trading multiplied by the
proportion of the merged company that belongs to the
spin-off’s shareholders is relevant for our calculations.
• Trade sale: 20 companies have been valued based on the
price at which they sold a major equity stake (at least 30
per cent) to an acquirer.
• Financing events: The valuation of 28 companies is based
on recent financing events with BA and/or VC involvement
and factors in the post-money valuation as long as that
financing round has not taken place more than 18 months
prior to 31 December 2018 (in line with the International
Private Equity and Venture Capital Valuation Guidelines).
• Multiples: Multiples were used to estimate the value of 53
companies for which data on revenues and earnings before
interest and tax (EBIT) was available but which had not
gone through an exit or a recent financing event. The mul-
tiples used were enterprise value (EV)/revenue and EV/
EBIT. We used average industry multiples for global com-
panies as listed in the NYU Stern Database and applied
them to the latest yearly performance indicators at the time
of the survey (2017 financial year). This rather conservative
approach (instead of forward multiples and projected earn-
ings) reduces the risk of exaggerating valuations and is 4 A convertible loan is a short-term debt that converts into equity at a later stage. Instead of paying back the money with interest, start-ups ‘pay’ the investor in the form of equity. The conversion usually happens at the conclusion of a new investment round.
5 Money multiple = CHF 3’000’000
CHF 100’000 + CHF 1’900’000
6 In a reverse merger, a private company aquires a majority of the shares in a smaller public company, which is then combined with the purchasing entity.

31
4. Value Created by ETH Zurich Spin-Offs
more appropriate in terms of fair value guidelines. More-
over, as the spin-offs valued on the basis of multiples are
all private companies, a 30 per cent liquidity discount was
applied to the value of the equity. This methodology was
used in accordance with the 2008 study (Oskarsson &
Schläpfer, 2008), which in turn followed a British Private
Equity & Venture Capital Association (BVCA) recommenda-
tion of a minimum liquidity discount of 25 per cent.
• Zero: A zero value was assigned to four companies that
had been liquidated.
• Nominal value of the capital raised: The nominal value of
the intial investment and subsequent investments (all
paid-up equity) are used as a benchmark for 39 spin-offs
for which none of the above is available or appropriate.
Calculation of the ‘pooled IRR’ is based on the investments
made in each company since its formation and the present
value as at 31 December 2018 using the above method. All
investments and valuations are aggregated (‘pooled’), i.e.
investments are added as negative cash flows in the year in
which they were made, exits are added as positive cash
flows in the year in which they were made, and the equity of
the other spin-offs without exits is added as an inflow in
2018. Of the 148 companies for which the valuation was as-
sessed, 128 also had valid funding information (29.8 per cent
of the population, n=429) and could therefore be used in the
multiples and IRR calculations (see Figure 19).
Figure 18: ETH Zurich spin-offs; equity valuation methods applied (n=148)
Equity valuation methods applied
0
10
20
30
40
60
53
39
28
20
2 24
50
Cap
ital
rai
sed
Zero
Mul
tipl
es
Rec
ent fi
nanc
ing
even
t
Trad
e sa
le
Rev
erse
d m
erge
r
IPO
Num
ber
of s
pin
-off
s

32
The Performance of Spin-Off Companies at the Swiss Federal Institute of Technology Zurich
Only nine of the 41 spin-offs (22.0 per cent) that have expe-
rienced an exit are included. In particular, companies with
institutional investors were reluctant to provide detailed
fundraising information and therefore had to be excluded.
Extrapolations for the entire population must thus be carried
out with caution.
4.3.6.1. Equity value created
The sample (n=148) of spin-offs for which an equity value
was calculated – 65 of which included a BA or VC round
– produced an equity value of CHF 4.8 billion in total. In a
projection of the 281 population spin-offs not taken into
account, it is likely that the total equity value created in the
population is in the range of CHF 9.4 billion. As shown in
Figure 20, the total equity value is driven by a few large
companies, i.e. the spin-off with the highest valuation
accounts for 15.0 per cent of the total value, the top three for
37.9 per cent and the top ten for 74.1 per cent. Despite an
average equity value per spin-off of CHF 32.4 million, the
median is therefore CHF 2.6 million.
Figure 19: Venn diagram; spin-offs for which fundraising information was obtained and the equity value calculated
Figure 20: ETH Zurich spin-offs; aggregate equity value created (n=148)
0
2
1
0 5 10 15 20 25 30 35 40 45 50 55 60 65 70 75 80 85 90 95 100
105
110
115
120
125
130
135
140
145
3
4
5
6
Agg
rega
te e
quit
y va
lue
crea
ted
(CH
F bi
llio
n)
Number of spin-offs
Population (n=429)
Funding valuations(n=128)
Valuations(n=148)
Funding(n=131)

33
4. Value Created by ETH Zurich Spin-Offs
Of the CHF 4.8 billion equity value, CHF 3.7 billion is being
realised through exits (two IPOs, two reverse mergers and
20 trade sales), while the remaining CHF 1.1 billion reflects
a current value that has not yet been realised (e.g. equity
was valued using current financing events or multiples, but
there was no exit event). The average exit valued the equity
of the spin-offs at CHF 153 million (median of CHF 37.5 mil-
lion), while the average company that did not experience an
exit was valued at CHF 9.1 million (median of CHF 966’000).
The average spin-off in which we found evidence of BA or VC
support resulted in an equity value of CHF 56.5 million com-
pared with CHF 13.5 million for non-BA/VC companies. This
could be an indicator that BA or VC support increases the
equity value of the company. However, it could also be that
BAs and VCs invest predominantly in more valuable
companies and that the investment per se has not increased
the long-term equity value. Another point to consider is that
the ‘recent financing event’ valuation method was used for
many companies supported by BAs or VCs whereas, for com-
panies not supported by BAs or VCs, ‘multiples’ and ‘capital
raised’ were used more frequently, with the latter lowering
the average valuation.
As can be seen in Figure 21, Biotech Pharma – which was
also the strongest fundraising sector – has created the high-
est equity value both on an aggregate basis at CHF 1.9 billion
and per spin-off at CHF 67.1 million. Electrical Engineering
& Electronics and Mechanical Engineering & Aerospace are
in second and third places respectively both in terms of the
aggregate and per spin-off.
Figure 21: ETH Zurich spin-offs; equity value created by sector (n=148) (RHS = right-hand side)Averages for fewer than ten observations are greyed out and not interpreted
Equity value created Average equity value created (RHS)
0 0
10
20
30
40
50
60
70
2000
1800
1600
1400
1200
1000
800
600
400
200
80
Mec
h. E
ng. A
eros
pace
Med
ical
Dev
ices
Mic
ro-N
anot
ech
Sen
sors
Ana
lyti
cs
Oth
ers
ICT
Ele
ctri
cal E
lect
roni
cs
Che
mic
al
Bio
tech
Pha
rma
Adv
ance
d M
ater
ials
Equ
ity
valu
e cr
eate
d in
CH
F m
illi
on
Ave
rage
equ
ity
valu
e cr
eate
d in
CH
F m
illi
on

34
The Performance of Spin-Off Companies at the Swiss Federal Institute of Technology Zurich
Of particular interest is the large differences in average eq-
uity value created per spin-off from these three sectors
compared with all other categories. The lower average eq-
uity value in other sectors with a comparable number of
spin-offs such as ICT and Others can partly be explained by
the different levels of funding: there is a correlation of 86.2
per cent between the amount of funds raised and the equity
value created across all spin-offs. The statistics are also
affected by some very large share valuations from certain
exits. This is particularly pronounced in the Electrical Engi-
neering & Electronics category, where two spin-offs repre-
sent around 80 per cent of the equity value created in the
sector as a whole.
4.3.6.2. Money multiple
The 128 spin-offs for which calculations were performed
achieved a combined money multiple of 3.6x. Since the sam-
ple contains only a small proportion of the total exits, this
figure reflects a more conservative estimate of the actual
money multiple for the population. Compared with the pre-
vious section, where the equity value was calculated on the
basis of 148 spin-offs (CHF 4.8 billion), the sample of 128
spin-offs represents less than half (CHF 2.0 billion) of the
total equity value owing to the lack of detailed fundraising
information for some of the most valuable companies in the
population. If only the nine companies with an exit are taken
into account, the money multiple – in this case an exit mul-
tiple – is 5.7x. This is what mid-stage VCs normally aspire to
with an investment. The expectation of exit multiples
Figure 22: ETH Zurich spin-offs; absolute returns and money multiples by sector (n=128) (RHS = right-hand side)
Equity value Equity raised Money multiple (RHS)
0 0
200
100
400
300
1x
500
2x
3x
4x
6005x
800
700
6x
900 7x
35.3x
Mec
h. E
ng. A
eros
pace
Med
ical
Dev
ices
Mic
ro-N
anot
ech
Sen
sors
Ana
lyti
cs
Oth
ers
ICT
Ele
ctri
cal E
lect
roni
cs
Che
mic
al
Bio
tech
Pha
rma
Adv
ance
d M
ater
ials
CH
F m
illi
on

35
4. Value Created by ETH Zurich Spin-Offs
usually decreases over the lifetime of a spin-off: while seed-
stage investors seek a multiple of at least 10x, late-stage
investors want 2x to 3x (Hower, 2011).
Looking at the absolute returns and money multiples per
sector, as shown in Figure 22, Electrical Engineering & Elec-
tronics has the highest multiple at 6.7x. We are not consid-
ering Sensor Analytics here, which technically has a multiple
of 35.3x but is based on only two observations and therefore
has little statistical relevance. The only multiple smaller than
1x is in the Advanced Materials sector, although here too the
statistics are based on only six observations and are there-
fore of little significance.
4.3.6.3. Internal rate of return
The pooled IRR as an indicator of value creation is particu-
larly sensitive to the period it covers. In order to allow a fair
comparison with previous studies, the pooled IRR over the
last ten years is considered the most relevant. Schläpfer &
Oskarsson (2008) found a pooled IRR for ETH Zurich
spin-offs of 43.33 per cent in their study. Applied to the same
time span of ten years, a pooled IRR of 55.5 per cent for 94
spin-offs between 2009 and 2018 was calculated.
If, instead, the pooled IRR for the sample of 128 ETH Zurich
spin-offs spanning from 1980 (the incorporation of the first
spin-off in the sample) to 2018 is calculated, the value is 28.6
per cent. In comparison, the public market equivalent (PME)
calculated for the Swiss Market Index (SMI) yielded an IRR of
5.7 per cent. The ETH Zurich spin-offs are therefore outper-
forming the public market by a spread of 22.9 per cent. While
this is an extraordinary return, it is important to note that the
inherent risk associated with ETH Zurich spin-offs is signifi-
cantly higher than for stocks traded on the SMI.
The pooled IRR for all 128 spin-offs in the sample is 28.6 per
cent. Positive net cash flows are grey and negative net cash
flows are black. Source: calculation using data from the sur-
vey and complementary information from ETH transfer.
Figure 23: ETH Zurich spin-offs; net cash flows and pooled IRR (n=128)The pooled IRR for all 128 spin-offs in the sample is 28.6 per cent. Positive net cash flows are grey and negative net cash flows are black.
0
1000
900
800
700
600
500
400
300
200
100
–100
Net
cas
h fl
ow in
CH
F m
illi
on
Year of cash flow
Pooled IRR of 28.6%19
8019
8119
8219
8319
8419
8519
8619
8719
8819
8919
8019
9019
9119
9219
9319
9419
9519
9619
9719
9819
9920
0020
0120
0220
0320
0420
0520
0620
0720
0820
0920
1020
1120
1220
1320
1420
1520
1620
1720
18

36
The Performance of Spin-Off Companies at the Swiss Federal Institute of Technology Zurich
As can be seen in Figure 23, the net cash flows before 2000
are marginal in comparison with the most recent decade and
hence barely visible on the same scale. The net cash flows
from 1980 to 1999 resulted in combined cash outflows of
CHF 3.7 million, mostly in the form of capital invested at
incorporation. The first positive peak in net cash flow in 2007
is the result of a major exit. The overall peak in 2018 is the
result of the many companies that had their equity valued by
multiples or recent financing rounds.
As already mentioned, the pooled IRR is particularly sensitive
to the period it covers (see Figure 24). Although the 128 sam-
ple spin-offs since 1980 have generated CHF 2.0 billion in
equity value as of today, the 85 spin-offs since 2011 that have
created ‘only’ CHF 446 million in equity value are achieving
a much higher pooled IRR of 141.3 per cent. This is because
more return in less time is what drives up the IRR.
Given that ETH transfer started its spin-off activities in the
1990s, another interesting time window would be to consid-
er the IRR for all spin-offs since 1993, thereby excluding the
two spin-offs from 1980 and 1989 and resulting in a pooled
IRR of 42.0 per cent for a sample of 126. In this sample of
126, only nine out of the 41 spin-offs with exits – arguably
the most significant value drivers – are still represented.
Since we do not have the required data to include most of
the exit events in the pooled IRR calculation, the generated
values are likely to be significantly below the true values for
the spin-off population as a whole.
Figure 24: ETH Zurich spin-offs; sensitivity of pooled IRR based on period covered (from n=128 to n=68) (RHS = right-hand side)The pooled IRR calculation is highly sensitive to the time span it covers.
Sample size Pooled IRR (RHS)
0 0%
20
40
20%
60
40%
60%
80%
80
100%
100
140%
120%
140
120
160%
Sam
ple
size
by
tim
e sp
an
Poo
led
IRR
per
tim
e sp
an
1980
– 2
018
1982
– 2
018
1984
– 2
018
1986
– 2
018
1988
– 2
018
1980
– 2
018
1990
– 2
018
1992
– 2
018
1994
– 2
018
1996
– 2
018
1998
– 2
018
2000
– 2
018
2002
– 2
018
2004
– 2
018
2008
– 2
018
2010
– 2
018
2012
– 2
018
2014
– 2
018
IRR=28.6% for the period1980 – 2018 (n=128 covered)
IRR=55.5% for 2009 – 2018 (n=94 spin-offs)
Time span covered

37
4. Value Created by ETH Zurich Spin-Offs
4.4. Operations-Related Factors
If a spin-off is successful, it has several options: these com-
panies can either maintain their operations or make an exit,
e.g. through an IPO or a trade sale. All of these options are
explained in the following section. Unfortunately, not every
start-up will be successful. In fact, most start-ups fail in the
first few years of their existence, which is why this period
– also known as the ‘valley of death’, where net cash flow is
negative – will also be looked at in more detail in the follow-
ing chapter.
4.4.1. Survival and Failure of ETH Spin-Offs
Information about incorporations and liquidations was
obtained from extensive separate research of the Swiss
commercial register.7
Figure 25 shows that out of the total of 429 spin-offs incor-
porated, 57 have been liquidated. The first liquidation that
could be traced back through the Swiss commercial register
happened in 2001. Since then, the number of liquidations has
increased. This trend is explained by a similar rise in the
number of spin-offs per year with a delayed impact on fail-
ure rates. Using only the number of liquidations as an
Figure 25: ETH spin-offs; number of incorporations and liquidations per year (n=429)
30
25
20
15
10
5
0
Num
ber
of c
ompa
nies
Linear (number incorporated) Linear (number liquidated)
Number incorporated Number liquidated
1973
1978
1983
1988
1993
1998
2003
2008
2013
2018
7 In order to analyse the failure rates of spin-off companies from ETH Zurich, the date of their foundation had to be determined first. Since the date on which the label was awarded can differ from the date of incorporation by up to two years, the collection of this data was decisive.

38
The Performance of Spin-Off Companies at the Swiss Federal Institute of Technology Zurich
indicator of failure, the ‘total failure rate’ among the popu-
lation is 13.3 per cent (57 out of 429 spin-offs), resulting in
an ‘overall survival rate’ of 86.7 per cent. This very cautious
approach has been chosen so as not to define market activ-
ity on the basis of uncertain factors. One shortcoming of this
proxy, however, is that it does not take into account compa-
nies that are no longer commercially active but have not
been liquidated either.
In order to compare the results of this study with earlier
ones, from now on only the timed failure rates since 1998
will be considered. Since then, a total of 362 companies have
been founded. Of these, 51 firms have ceased trading, which
corresponds to a rate of 14.09 per cent. Compared with the
2008 study, this failure rate has increased by 2.6 percentage
points from 11.5 per cent (Oskarsson & Schläpfer, 2008). The
overall survival rate for all enterprises with at least five
years of activity is 92.9 per cent, while the survival rate for
ten years of activity is 85.7 per cent (see Table 2).
Compared with the first study ten years ago (Oskarsson &
Schläpfer, 2008), the five-year failure rate has decreased
from 9 per cent to 7.1 per cent, indicating that ETH Zurich
spin-offs now have a better chance of surviving early-stage
development.
4.4.2. Valley of Death
The term ‘valley of death’ has been widely used in entrepre-
neurship and describes the lack of funding available within a
given period. The money cycle is a critical point – especially
Table 2: ETH spin-offs; timed failure rates by vintage (n=429)
Year 1 2 3 4 5 6 7 8 9 10 11 12 13 14 15 16 17 18 19 20 Failures Incorpo-rated
1998 0.00% 0.00% 0.00% 0.00% 0.00% 0.00% 0.00% 0.00% 0.00% 9.09% 9.09% 9.09% 9.09% 18.18% 18.18% 27.27% 27.27% 27.27% 27.27% 27.27% 3 11
1999 0.00% 8.33% 8.33% 16.67% 25.00% 25.00% 25.00% 33.33% 33.33% 33.33% 33.33% 33.33% 33.33% 41.67% 41.67% 41.67% 41.67% 41.67% 41.67% 5 14
2000 0.00% 0.00% 0.00% 0.00% 0.00% 7.69% 7.69% 7.69% 15.38% 15.38% 15.38% 15.38% 15.38% 15.38% 15.38% 15.38% 15.38% 23.08% 3 15
2001 0.00% 0.00% 0.00% 0.00% 0.00% 0.00% 0.00% 0.00% 0.00% 0.00% 0.00% 0.00% 0.00% 0.00% 0.00% 0.00% 14.29% 1 9
2002 0.00% 0.00% 0.00% 0.00% 0.00% 0.00% 0.00% 0.00% 0.00% 0.00% 0.00% 0.00% 0.00% 0.00% 0.00% 0.00% 0 9
2003 0.00% 0.00% 0.00% 0.00% 0.00% 0.00% 12.50% 12.50% 25.00% 25.00% 25.00% 25.00% 25.00% 25.00% 25.00% 2 9
2004 0.00% 0.00% 0.00% 0.00% 0.00% 0.00% 0.00% 0.00% 12.50% 12.50% 12.50% 12.50% 12.50% 12.50% 1 9
2005 0.00% 0.00% 0.00% 0.00% 0.00% 0.00% 0.00% 0.00% 0.00% 0.00% 0.00% 0.00% 0.00% 0 14
2006 0.00% 0.00% 0.00% 7.14% 7.14% 7.14% 7.14% 14.29% 14.29% 21.43% 21.43% 21.43% 3 15
2007 0.00% 9.09% 9.09% 9.09% 13.64% 13.64% 13.64% 18.18% 22.73% 22.73% 22.73% 5 22
2008 0.00% 0.00% 0.00% 0.00% 8.70% 13.04% 13.04% 17.39% 17.39% 17.39% 4 23
2009 0.00% 8.00% 8.00% 8.00% 12.00% 12.00% 12.00% 16.00% 16.00% 4 25
2010 0.00% 0.00% 4.35% 13.04% 13.04% 17.39% 21.74% 26.09% 6 23
2011 0.00% 4.35% 8.70% 13.04% 13.04% 13.04% 17.39% 4 23
2012 0.00% 0.00% 5.88% 5.88% 11.76% 17.65% 3 17
2013 0.00% 0.00% 4.76% 4.76% 9.52% 2 21
2014 0.00% 0.00% 0.00% 0.00% 0 27
2015 0.00% 4.00% 8.00% 2 25
2016 0.00% 3.70% 1 27
2017 8.33% 2 24
Total 0.42% 1.97% 3.17% 4.57% 7.12% 8.44% 9.30% 11.19% 13.05% 14.26% 13.95% 12.97% 11.91% 16.10% 16.71% 16.86% 24.65% 30.67% 34.47% 27.27% 51 362

39
4. Value Created by ETH Zurich Spin-Offs
at the beginning of a new business. During this phase it is
difficult for start-ups to acquire financing, while the cash burn
rate is high and thus increases the risk of failure.
The time between incorporation and failure was measured
for the purposes of this analysis (n=57). These findings might
differ from previous analyses because some of the past
studies have used the label date, which can differ from the
incorporation date by up to two years, and in addition the
definition of failure varies, as explained in section 2.3. As
can be seen in Figure 26, most of the failures in the under-
lying sample occurred within the first ten years after incor-
poration (77.2 per cent of all failed companies). While most
failures happened in year eight, 40.35 per cent of all liqui-
dations occurred within the first five years.
The average time to liquidation of ETH spin-offs is nine
years, with extremes of 16 months at the lower end and 38
years at the maximum (the median is seven years). In terms
of vintages, 1997 had the highest default rate, as five out of
seven spin-offs had been liquidated by the end of 2018.
4.4.3. Survival Rate Comparison with the
Swiss Start-Up Ecosystem
The Swiss Federal Statistical Office (FSO; 2018) has pub-
lished the one-year to three-year ‘timed survival rates’ of all
companies newly incorporated between 2013 and 2015 for
Switzerland as a whole and for the canton of Zurich, where
337 of the 429 spin-offs have their registered domicile. As
shown in Figure 27, the three-year survival rate across all
ETH spin-offs is 97.4 per cent compared with 62 per cent for
all new companies in Switzerland and 64 per cent for all new
companies in the canton of Zurich. As the FSO has not yet
published the official statistics for start-ups and liquidations
beyond 2015, the four-year and five-year survival rates were
forecast using an exponential trend curve that corresponds
to previous findings by Oskarsson & Schläpfer (2008), when
the FSO published five-year survival rates of below 50 per
cent. The chart shows that even in terms of the five-year
survival rate, ETH Zurich spin-offs exceed the average for
Swiss start-ups by more than 40 per cent.
Figure 26: ETH spin-offs; amount of liquidations after x years (n=429)
10
0
1
2
3
4
5
6
7
8
9
Num
ber
of c
ompa
nies
Year of failure
1 2 3 4 5 6 7 8 910 11 12 13 14 15 16 17 18 19 20 21 22 23 24 25 26 27 28 29 30 31 32 33 34 35 36 37 38

40
The Performance of Spin-Off Companies at the Swiss Federal Institute of Technology Zurich
Spin-offs from ETH Zurich have a significantly higher surviv-
al rate than start-ups in Switzerland. These findings confirm
research by Shane (2004) that spin-offs from universities
have significantly higher survival rates than the average new-
ly-founded small business. Universities’ strong research base
in conjunction with their solid technical proofs of concept and
highly talented people is a possible explanation for this.
According to the Swiss Startup Radar (Kyora et al., 2018), the
critical time frame for the liquidation of Swiss start-ups is
in years five and six, when many companies are trying to
enter the market. The reasons for failure are either a lack of
demand for the specific product/service or a lack of funds
for market entry and expansion. The results from ETH Zurich
spin-offs differ slightly from the findings produced by Kyora
et al. (2018). Only 18 per cent of all failures of ETH Zurich
spin-offs happen during years five and six (seven companies
and three companies respectively out of all 57 failures).
Rather, the period from four to eight years after foundation
is particularly susceptible to failures, as about half of all
liquidations fall within this period (28 out of 57).
4.4.4. Survival Rate Comparison with University Spin-Offs
A good benchmark for Swiss spin-off companies is the mar-
ket in the United Kingdom. Since the first study was conduct-
ed at the London Business School, previous comparisons
were made with UK universities. Fu and Wright (2015) car-
ried out a study involving British spin-off companies from
different regions of the UK. They examined the survival rates
of spin-offs by dividing universities into quartiles according
to their position in the UK University League Tables. Both
end-quartiles (top 25 per cent and bottom 25 per cent) had
Figure 27: timed survival rates for all ETH spin-offs and for all incorporations in Switzerland and in the canton of Zurich
ETH Zurich Switzerland Canton of Zurich
50%
55%
60%
70%
65%
80%
75%
90%
85%
95%
100%1
year
2 ye
ars
3 ye
ars
4 ye
ars
5 ye
ars
Per
cent
age
of c
ompa
nies
sur
vivi
ng
Years after incorporation

41
4. Value Created by ETH Zurich Spin-Offs
similar survival and exit rates. While the spin-offs from UK
universities generally have an overall survival rate of 67 per
cent, the total survival rate for the ETH Zurich spin-offs is
significantly higher at 86.7 per cent.
4.4.5. Exits
The ETH Zurich spin-off database and press releases en-
abled 41 exits of spin-offs to be identified – almost a tenth
of the population (9.6 per cent). By far the most common type
of exit was through a trade sale (37 spin-offs, representing
87.8 per cent of all exits). Furthermore, there have been two
IPOs and two reverse mergers. Kyora et al. (2018) reported
a slightly lower exit rate of 6 per cent for Swiss start-ups.
However, the authors expect this rate to increase as the
foundation of new ventures per year has tripled since 2005.
Having achieved an exit rate of 9.6 per cent, ETH Zurich
spin-offs also exceed UK university spin-offs, which reveal
a total trade sale rate of 6.6 per cent and an IPO rate of 0.5
per cent in the top 25 per cent quartile and a rate of 2.0 per
cent in the top 25 per cent to 50 per cent quartile (Fu &
Wright, 2015).
As shown in Figure 28, the existence of BA/VC investments
in exit companies was overrepresented and underrepresent-
ed in liquidated companies. This could be an indicator that
BAs and VCs are particularly adept at identifying successful
spin-offs. Another possibility is that spin-offs receiving BA
or VC funds are more likely to survive and exit owing to their
increased financial resources, managerial and industry ex-
pertise, and their networks. Shane and Stuart (2002) show
that the chance of a successful exit is strongly correlated
with the amount of venture capital funding received.
Figure 28: ETH spin-off population; outcome by BA/VC backing (n=429) (RHS = right-hand side)
BA/VC backing No BA/VC backing Percentage of BA/VC backing (RHS)
0 0
50
100
150
10%
20%
18
227
104
41
1623
30%
40%250
50%
350
300
200
60%
Sur
viva
l
Sur
viva
l
Exi
t

42
The Performance of Spin-Off Companies at the Swiss Federal Institute of Technology Zurich
The average time from foundation to the founders’ exit was
7.4 years: one year at the lower end and 21 years at the
upper end (median of six years). The time to exit also varies
from sector to sector. While it took Biotech Pharma spin-offs
an average of 8.6 years to exit, ICT spin-offs completed an
exit after 5.4 years on average. These numbers are close to
what the Swiss Startup Radar found, where entrepreneurs
exited after an average of nine years, although significant
variance around the mean was reported here (Kyora et al.,
2018).
4.4.6. Exits versus Liquidations per Sector
In summary it can be stated that, within the total population
of 429 companies, the rate for exits is 9.56 per cent and the
total failure rate for the population as a whole is 13.28 per
cent. The value for the number of failures is similar to
previous studies, which found an aggregate failure rate for
the total population of 11.5 per cent in 2008 (Oskarsson &
Schläpfer, 2008) and 14.3 per cent in 2013 (Pinter, 2015).
From a sectoral point of view there are considerable differ-
ences. ICT (12) and Electrical Engineering & Electronics (11)
have the most exits in absolute terms (see Figure 29). In
terms of the number of start-ups per sector, Electrical Elec-
tronics also has the largest share of exits (23.4 per cent).
While the ICT sector accounts for 21.05 per cent of all fail-
ures, only 11.2 per cent fail in terms of the sector’s number
of incorporations. Overall, most failures occur within the
Others sector, which accounts for 38.6 per cent of all liqui-
dations. In terms of the number of liquidated start-ups with-
in the same sector, only the Chemicals sector has a higher
failure rate (33.3 per cent).
Figure 29: ETH spin-offs; liquidations and exits per sector (n=429)
Number of exits (n=41) (including trade sales, IPOs, mergers and reverse mergers) Number of failures (n=57)
–25
–10
–15
–20
0
5
–5–2
–4
8
1112
5
1 13
–5 –5
–12
–3–2
–1 –1
–22
10
15
Mec
h. E
ng. A
eros
pace
Med
ical
Dev
ices
Mic
ro-N
anot
ech
Sen
sors
Ana
lyti
cs
Oth
ers
ICT
Ele
ctri
cal E
lect
roni
cs
Che
mic
al
Bio
tech
Pha
rma
Adv
ance
d M
ater
ials
Num
ber
of c
ompa
nies

43
4. Value Created by ETH Zurich Spin-Offs
Biotech Pharma, Electrical Engineering & Electronics, and
Mechanical Engineering & Aerospace are the only industries
with higher exit rates than liquidation rates. It is not surpris-
ing that the Biotech Pharma sector is one of the most fre-
quently listed sectors to exit, as large pharmaceutical com-
panies strive to keep their development pipelines full and
therefore have to make acquisitions of smaller pharmaceu-
tical companies. On the other hand, it is not surprising that
the Others sector has such a high number of failures: since
this sector consists mainly of consulting firms, these spin-
offs usually do not carry out an exit.
4.4.7. Comparison between Pioneer Fellows and
Non-Pioneer Fellows
In order to measure the impact of the Pioneer Fellowship
programme on the survival rate, all participating companies
incorporated after 2010 have been taken into account (n=95).
While 34 companies have been awarded with the ETH Pio-
neer Fellowship, 61 companies did not receive this grant.
Figure 30 shows that former pioneer fellows have a signifi-
cantly higher proportion of exits (11.8 per cent) than
non-pioneer fellows (3.3 per cent). This could potentially be
attributed to the support provided in the programme.
Figure 30: exits and liquidations of ETH spin-offs incorporated by pioneer fellows versus non-pioneer fellows between 2010 and 2018 (n=95)
Exit Liquidation
With ETH Pioneer Fellowship (n=34) Without ETH Pioneer Fellowship (n=61)
0
1
3
2
11.8%
2.9%
3.3%
1.6%
4
5

44
The Performance of Spin-Off Companies at the Swiss Federal Institute of Technology Zurich
In 2018, Switzerland was again ranked number one in inno-
vation performance by the Global Innovation Index (Cornell
University, INSEAD & WIPO, 2018). With its 429 spin-offs, ETH
Zurich makes a significant contribution to Switzerland’s in-
novative strength by transforming scientific knowledge and
new technologies into marketable innovations. This report
analyses the performance of ETH spin-offs and the success
factors leading to them.
The section on human resources factors analysed the impact
of various elements of a spin-off’s diversity on its ability to
attract finance. Most spin-offs are founded by male-domi-
nated teams with members from the same educational back-
ground. The analysis shows that teams are able to raise
seven times more funds than a single founder. However,
start-up teams, including women, receive significantly less
funding than teams that include male founders only. This is
particularly evident in the differences in funding provided by
BAs and VCs. Teams with entrepreneurial experience had an
advantage when seeking investment from both BAs and VCs
and other sources of finance. The findings are largely con-
sistent with previous research.
The majority (95.1 per cent) of ETH Zurich spin-offs are still
headquartered in Switzerland, with most spin-offs being
deeply rooted in their home canton of Zurich (75.7 per cent).
This is directly related to the impact of these companies on
the local economy, as the survey sample has created a total
of 4’448 jobs, or 31 jobs per spin-off. Representing almost
half of the total number of jobs, Electrical Engineering &
Electronics spin-offs create more jobs than any other sector,
although they account for only 10.3 per cent of all compa-
nies. The Electrical Engineering & Electronics sector also
has the largest number of patents, thereby contributing the
most to local innovation.
One-third of the total population of 429 spin-offs have BA or
VC financing. An extrapolation from the respondents and
additional documents shows that the total financing acquired
by these spin-offs could be well over CHF 1 billion. The Bio-
tech Pharma sector is by far the strongest fundraiser, which
suggests that investors are clearly very willing to finance
companies in this sector. A significant proportion of the
funds comes from external sources, with BA and VC invest-
ments accounting for 86 per cent of the total equity in ETH
Zurich spin-offs. Spin-offs that have obtained financing from
BAs or VCs are able to acquire 20 times more funding than
the others. A total pooled IRR of 56 per cent has been
achieved for the last ten years.
A total failure rate of 13.3 per cent has been calculated for all
spin-offs and is based on 57 liquidations in the total pool of
429 spin-offs. The most critical time frame for failure is be-
tween four and eight years. The ETH Zurich spin-offs have a
significantly higher five-year survival rate (93 per cent) than
Switzerland as a whole. It takes an average of 7.4 years for
the founders to exit a start-up through a trade sale or IPO.
Electrical Electronics has the largest share of exits, which
underlines the position of this sector’s spin-offs as success-
ful, high-impact companies. The Biotech Pharma sector also
has a significant proportion of exits that exceeds the propor-
tion of liquidations. This may be associated with the substan-
tial fundraising opportunities mentioned above, as VCs and
BAs expect a successful exit to maintain their profits.
When comparing ETH spin-offs supported by a Pioneer Fel-
lowship with those spin-offs without one, we can observe
that ICT projects are underrepresented among pioneer fel-
lows, which means that lower average revenues are gener-
ated in the studied sample. Companies incorporated by pio-
neer fellows raise less financing than their peers during the
first few years after incorporation, which suggests that grant
money may delay the need for external funding. With 11.8
per cent of the companies incorporated by pioneer fellows
experiencing a successful exit, the rate of exits is more than
three times higher than for other companies incorporated in
the same time period.
Overall, the findings of the survey and our additional re-
search show that spin-offs from ETH Zurich perform signif-
icantly better than Swiss start-ups as a whole and also
in comparison with spin-offs from universities in other
5. Summary and Conclusion

45
5. Summary and Conclusion
countries. This applies in particular to the high survival rates
of spin-offs from ETH Zurich and also to their fundraising and
job creation. In addition, ETH spin-offs on average hire more
employees than start-ups in Switzerland and Europe overall.
This contribution to the growth of the Swiss economy shows
how beneficial these spin-offs are for the local economy and
the innovative strength of Switzerland as a whole.
The limitations of the study result from the different meth-
ods and time frames used in our analysis. The figures can
therefore only be compared to a certain extent with previous
studies on spin-offs from ETH Zurich, as they may vary ac-
cording to which years are being analysed. This is particu-
larly relevant for the measurement of variables such as the
pooled IRR or the survival rate. These limitations have con-
sistently been discussed in the respective chapters.
This report has highlighted the innovative power and tech-
nological strength of ETH Zurich spin-offs as a key success
factor. However, these start-ups require more support than
the average Swiss start-up as they do not usually have the
managerial or financial resources necessary to develop their
original technology into a viable product. For this reason, the
university’s support structures in the form of units like ETH
transfer are especially important. ETH transfer can, howev-
er, go beyond providing its present support. Spin-offs would
like to have further proof-of-concept financing in future. By
strengthening its support efforts in this area, ETH transfer
could help close the funding gap and thus improve the op-
portunities to develop these start-ups further. Another im-
portant point is its strong network of BAs and VCs. ETH
transfer could expand its international investor network and,
in particular, strengthen its contacts with investors, focusing
on specific industries in order to connect them with the rel-
evant spin-offs. This will enable these investors to support
spin-offs during the early start-up phase and to create the
right conditions for the critical growth phase in which a fund-
ing boost is needed. It is also important to network ETH
founders with management-focused founders in order to
improve the expertise and skill sets of the founding teams,
thereby sustainably increasing their chances of success.

46
The Performance of Spin-Off Companies at the Swiss Federal Institute of Technology Zurich
Figure 1: ETH Zurich spin-off labels awarded by sector and year (n=432) 9
Figure 2: Timeline of ETH support activities 10
Figure 3: ETH transfer; feedback from spin-offs for improvements (n=143) 11
Figure 4: ETH transfer; feedback from spin-offs regarding the most helpful community events organised by ETH (n=143) 11
Figure 5: ETH Zurich spin-offs; serial entrepreneurs in the founding team (n=143) 13
Figure 6: ETH Zurich spin-offs; founding teams’ gender composition by year (n=143) (RHS = right-hand side) 14
Figure 7: ETH Zurich spin-offs; equity funding by highest university degree among the founding team (n=128) 16
Figure 8: ETH spin-offs; distribution of patent families across companies (n=143) 17
Figure 9: ETH Zurich spin-offs; number of patents by sector (n=143) 18
Figure 10: Regional distribution (n=418, of which 408 in Switzerland, 10 abroad); source: ETH transfer database 19
Figure 11: ETH Zurich spin-offs; canton of headquarters by sector (n=40) in Zug, Basel-Stadt and Aargau 20
Figure 12: ETH Zurich spin-offs; jobs created per sector (n=145) (RHS = right-hand side) 21
Figure 13: ETH Zurich graduates hired by spin-offs per sector (n=143) (RHS = right-hand side) 22
Figure 14: Global presence of ETH spin-offs (n=143) 23
Figure 15: ETH Zurich spin-offs; equity raised by round and source (n=131) (rhs = right-hand side) 26
Figure 16: ETH Zurich spin-offs; non-dilutive funding by sector (n=131) – averages for fewer than ten observations are greyed out 27
Figure 17: ETH Zurich spin-offs; BA/VC-backed companies by sector (n=429) – percentages for fewer than ten observations are greyed out 29
Figure 18: ETH Zurich spin-offs; equity valuation methods applied (n=148) 31
Figure 19: Venn diagram; spin-offs for which fundraising information was obtained and the equity value calculated 32
Figure 20: ETH Zurich spin-offs; aggregate equity value created (n=148) 32
Figure 21: ETH Zurich spin-offs; equity value created by sector (n=148) 33
Figure 22: ETH Zurich spin-offs; absolute returns and money multiples by sector (n=128) 34
Figure 23: ETH Zurich spin-offs; net cash flows and pooled IRR (n=128) 35
Figure 24: ETH Zurich spin-offs; sensitivity of pooled IRR based on period covered (from n=128 to n=68) (RHS = right-hand side) 36
Figure 25: ETH spin-offs; number of incorporations and liquidations per year (n=429) 37
Figure 26: ETH spin-offs; amount of liquidations after x years (n=429) 39
Figure 27: Timed survival rates for all ETH spin-offs and for all incorporations in Switzerland and in the canton of Zurich 40
Figure 28: ETH spin-off population; outcome by BA/VC backing (n=429) 41
Figure 29: ETH spin-offs; liquidations and exits per sector (n=429) 42
Figure 30: Exits and liquidations of ETH spin-offs incorporated by pioneer fellows versus non-pioneer fellows between 2010 and 2018 (n=95) 43
Figure 31: ETH Zurich spin-offs; equity funding by sector (n=131) 54
6. Table of Figures

47
7. References
Baldegger, R., Alberton, S., Wild, P., & Gaudart, R. (2018). Global Entrepreneurship Monitor 2017 / 2018: Report on Switzerland.
Bhardwa, S. (2018). https://www.timeshighereducation.com. Re-trieved from https://www.timeshighereducation.com/student/news/top-100-most-innovative-universities-europe-2018 on 3 May 2018.
Allgemeine Systematik der Wirtschaftszweige. Bundesamt für Statistik BFS. (2008). Retrieved from https://www.bfs.admin.ch/bfs/de/home/statistiken/industrie-dienstleistungen/nomenkla-turen/noga.assetdetail.415633.html.
Burkhard, B. (2015). Who creates jobs? The role of start-ups in Swiss job creation. Retrieved from https://www.startupticker.ch/en/news/june-2015/who-creates-jobs-the-role-of-start-ups-in-swiss-job-creation on: 30 June 2015.
Cooney, T. (2005). Editorial: What is an Entrepreneurial Team? International Small Business Journal 23(3), 226–235.
Cornell University; INSEAD; WIPO. (2018). The Global Innovation In-dex 2018: Energizing the World with Innovation.
Dahl, M., & Sorenson, O. (2012). Home sweet home: Entrepre-neurs’ location choices and the performance of their ventures. Management Science 58(6), 1059–1071.
Delmar, F., & Shane, S. (2006). Does experience matter? The effect of founding team experience on the survival and sales of newly founded ventures. STRATEGIC ORGANIZATION 4(3), 215–247.
ETH Zurich. (2014). Gender Action Plan (GAP).
ETH Zurich. (2018)a. ETH Zurich: Annual report 2017.
ETH Zürich. (2018)b. ETH Pioneer Fellowships. Retrieved from https://www.ethz.ch/en/industry-and-society/entrepreneurship/pioneer-fellowships.html.
Grichnik, D., Brettel, M., Koropp, C., & Mauer, R. (2017). Entrepre-neurship: Unternehmerisches Denken, Entscheiden und Handeln in innovativen und technologieorientierten Unternehmen.
Grichnik, D., Vogel, P., & Burkhard, B. (2016). Swiss Start-up Monitor: The Swiss entrepreneurial ecosystem report 2015/2016. The Swiss Start-up monitor.
Hensellek, S., Kensbock, J., Kollmann, T., & Stöckmann, C. (2016). European Startup Monitor (ESM).
Hunt, V., Prince, S., Dixon-Fyle, S., & Yee, L. (2018). McKinsey&-Company: Delivering through Diversity. McKinsey&Company.
Kamm, J., Shuman, J., Seeger, J., & Nurick, A. (1990, July 1). Entrepreneurial Teams in New Venture Creation: A Research Agenda. SAGE journals 14(4), 7–17.
Kane, T. (2010). Kauffman Foundation Research Series: Firm Formation and Economic Growth: The Importance of Startups in Job Creation and Job Destruction. Ewing Marion Kauffman Foundation.
Klotz, A., Hmieleski, K., Bradley, B., & Busenitz, L. (2014). New Venture Teams: A Review of the Literature and Roadmap for Future Research. Journal of Management 40(1), 226–255.
Kyora, S., Rockinger, M., & Jondeau, E. (2018). Swiss Startup Radar 2018/2019.
Mair, S. (2017). Startups: Warum der Schweiz die Gründerinnen fehlen. Retrieved from https://www.handelszei-tung.ch: https://www.handelszeitung.ch/management/start-ups-warum-der-schweiz-die-gruenderinnen-fehlen-1385363 on 19 April 2017.
Mauldin, J. (2017). Startups Will Define The Future Of U.S. Employ-ment. Forbes. Retrieved from https://www.forbes.com/sites/john-mauldin/2017/03/13/startups-will-define-the-future-of-us-em-ployment/#7152b2f65f8d.
Mombelli, A. (2018). The best Swiss start-ups of 2018. Retrieved from https://www.swissinfo.ch/eng/innovation-awards_the-best-swiss-start-ups-of-2018/44377888.
OECD. (2008). Compendium of Patent Statistics.
Oskarsson, I., & Schläpfer, A. (2008). The performance of Spin-off companies at the Swiss Federal Institute of Technology Zurich.
Phalippou, L. (2008). The Hazards of Using IRR to Measure Performance: The Case of Private Equity. Journal of Performance Measurement 12(4) , 55–66.
Pinter, V. (2015). Overview and analysis of the performance of Spin-offs at the Swiss federal Institute of Technology Zurich and their effect on the Swiss Economy. Zurich: ETH transfer.
Rasmussen, E., Mosey, S., & Wright, M. (2011). The Evolution of Entrepreneurial Competencies: A Longitudinal Study of University Spin-Off Venture Emergence. Journal of Management Studies 48(6), 1314–1345.
Sarasvathy, S., Menon, A., & Kuechle, G. (2013). Failing firms and successful entrepreneurs: serial entrepreneurship as a temporal portfolio. Small Business Economics 40, 417–434.
7. References

48
The Performance of Spin-Off Companies at the Swiss Federal Institute of Technology Zurich
Schjoedt, L., & Kraus, S. (2009). Entrepreneurial teams: definition and performance factors. Management Research News 32(6), 513–524.
Schubert, R., & Storjohann, R. (2018). Gender Monitoring 2017/18: Report on the Gender Balance between Women and Men in Studies and Research at ETH Zurich. Zurich.
Shane, S. (2004). Academic Entrepreneurship: University Spin-offs and Wealth Creation.
Staatssekretariat für Bildung, Forschung und Innovation SBFI. (2018). Die Schweizer Forschung und Innovation im internationalen Vergleich – Aktualisierte Indikatoren 2018.
Startup Genome. (2018). Global Startup Ecosystem Report 2018: Succeeding in the New Era of Technology.
Swiss Federal Institute of Intellectual Property. (2019). Annual Report 2017|18.
Bundesamt für Statistik. (2018). Über 80% der Unternehmen sind ein Jahr nach ihrer Gründung noch aktiv. Medienmitteilung (10.12.2018).
telegraph.co.uk. (2014). https://www.telegraph.co.uk. Retrieved from https://www.telegraph.co.uk/education/universityeduca-tion/11299261/League-tables-the-top-universities-for-research.html on 18 December 2014.
Torcasso, D. (2018). Das Zuger «Crypto Valley» ist 44 Milliarden Dollar schwer. Handelszeitung. Retrieved from https://www.han-delszeitung.ch/unternehmen/das-zuger-crypto-valley-ist-44-mil-liarden-dollar-schwer: https://www.handelszeitung.ch/unterneh-men/das-zuger-crypto-valley-ist-44-milliarden-dollar-schwer.
Valero, A., & Van Reenen, J. (2016). The Economic Impact of uni-versities: Evidence from across the globe. NBER Working Paper Series.
Vogel, R., Puhan, T. X., Shehu, E., Kliger, D., & Beese, H. (2014). Funding decisions and entrepreneurial team diversity: A field study. Journal of Economic Behavior & Organization 107, 595–613.
Westhead, P., & Wright, M. (2015, March 13). The habitual entre-preneur phenomenon. International small business journal., Virtual Special Issue, 1–16.
Wright, M., & Fu, K. (2015). University Spin-outs: What do we know and what are the policy implications? Evidence from the UK. Journal of Innovation Management 3(4) , 5–15.
Wright, M., & Vanaelst, I. (2009). Entrepreneurial Teams and New Business Creation.
Wright, M., Robbie, K., & Ennew, C. (1997, May). Venture Capitalists and serial entrepreneurs. Journal of Business Venturing 12(3), 227–249.

49
Appendix A: Tables and Figures
Appendix A: Tables and Figures
Table 1. Chi-square tests for survey (n=143), funding (n=131), equity value (n=148) and return (n=128) sample vs population (n=429) based on their sector composition
Survey sample (n=143) vs population
Sample Population Chi-Square Test
Sector # % # % Observed # Expected #
Advanced Materials 6 4% 14 3% 6 5
Biotech Pharma 25 17% 72 17% 25 24
Chemical processes & Compounds 6 4% 15 3% 6 5
Electrical Engineering & Electronics 14 10% 47 11% 14 16
Information & Communications Technology ICT 42 29% 107 25% 42 36
Mechanical Engineering & Aerospace 16 11% 48 11% 16 16
Medical Devices 10 7% 17 4% 10 6
Micro- & Nanotechnology 3 2% 8 2% 3 3
Sensors Analytics 2 1% 7 2% 2 2
Others 19 13% 94 22% 19 31
Total 143 100% 429 100% 143 143
Correlation factor for sample & population: 92% Chi-square p-value: 0.34
Funding sample (n=131) vs population
Sample Population Chi-Square Test
Sector # % # % Observed # Expected #
Advanced Materials 6 4% 14 3% 6 4
Biotech Pharma 22 15% 72 17% 22 22
Chemical processes & Compounds 4 3% 15 3% 4 5
Electrical Engineering & Electronics 13 9% 47 11% 13 14
Information & Communications Technology ICT 40 28% 107 25% 40 33
Mechanical Engineering & Aerospace 15 10% 48 11% 15 15
Medical Devices 9 6% 17 4% 9 5
Micro- & Nanotechnology 2 1% 8 2% 2 2
Sensors Analytics 2 1% 7 2% 2 2
Others 18 13% 94 22% 18 29
Total 131 92% 429 100% 131 131
Correlation factor for sample & population: 92% Chi-square p-value: 0.40

50
The Performance of Spin-Off Companies at the Swiss Federal Institute of Technology Zurich
For all four samples, the chi-square test does not reject the null hypothesis that the sample has the same composition as the population in terms of sectors. Source: calculations with data from survey and ETH spin-off database.
Equity sample (n=148) vs population
Sample Population Chi-Square Test
Sector # % # % Observed # Expected #
Advanced Materials 6 4% 14 3% 6 5
Biotech Pharma 28 20% 72 17% 28 25
Chemical processes & Compounds 5 3% 15 3% 5 5
Electrical Engineering & Electronics 19 13% 47 11% 19 16
Information & Communications Technology ICT 40 28% 107 25% 40 37
Mechanical Engineering & Aerospace 18 13% 48 11% 18 17
Medical Devices 9 6% 17 4% 9 6
Micro- & Nanotechnology 2 1% 8 2% 2 3
Sensors Analytics 2 1% 7 2% 2 2
Others 19 13% 94 22% 19 32
Total 148 103% 429 100% 148 148
Correlation factor for sample & population: 92% Chi-square p-value: 0.43
Return sample (n=128) vs population
Sample Population Chi-Square Test
Sector # % # % Observed # Expected #
Advanced Materials 6 4% 14 3% 6 4
Biotech Pharma 22 15% 72 17% 22 21
Chemical processes & Compounds 4 3% 15 3% 4 4
Electrical Engineering & Electronics 13 9% 47 11% 13 14
Information & Communications Technology ICT 38 27% 107 25% 38 32
Mechanical Engineering & Aerospace 15 10% 48 11% 15 14
Medical Devices 9 6% 17 4% 9 5
Micro- & Nanotechnology 1 1% 8 2% 1 2
Sensors Analytics 2 1% 7 2% 2 2
Others 18 13% 94 22% 18 28
Total 128 90% 429 100% 128 128
Correlation factor for sample & population: 93% Chi-square p-value: 0.39

51
Appendix A: Tables and Figures
Table 2. Chi-square tests for survey (n=143), funding (n=131), equity value (n=148) and return (n=128) sample vs population (n=429) based on their 5-year vintage composition
Survey Sample (n=143) vs population
Sample Population Chi-Square Test
Vintage # % # % Observed # Expected #
1973 – 1978 0% 1 0% 0 0
1979 – 1983 1 1% 2 0% 1 1
1984 – 1988 0% 6 1% 0 2
1989 – 1993 5 3% 12 3% 5 4
1994 – 1998 3 2% 37 9% 3 12
1999 – 2003 9 6% 56 13% 9 19
2004 – 2008 24 17% 83 19% 24 28
2009 – 2013 29 20% 109 25% 29 36
2014 – 2018 72 50% 123 29% 72 41
Total 143 100% 429 100% 143 143
Correlation factor for sample & population: 86% Chi-square p-value: 0.000003
Funding sample (n=131) vs population
Sample Population Chi-Square Test
Vintage # % # % Observed # Expected #
1973 – 1978 0% 1 0% 0 0
1979 – 1983 1 1% 2 0% 1 1
1984 – 1988 0% 6 1% 0 2
1989 – 1993 4 3% 12 3% 4 4
1994 – 1998 2 1% 37 9% 2 11
1999 – 2003 9 6% 56 13% 9 17
2004 – 2008 19 13% 83 19% 19 25
2009 – 2013 28 20% 109 25% 28 33
2014 – 2018 68 48% 123 29% 68 38
Total 131 92% 429 100% 131 131
Correlation factor for sample & population: 85% Chi-square p-value: 0.000002

52
The Performance of Spin-Off Companies at the Swiss Federal Institute of Technology Zurich
For all four samples, the chi-square test strongly rejects the null hypothesis that the sample has the same composition as the population in terms of 5-year vintages. Source: calculations with data from survey and ETH spin-off database.
Equity sample (n=148) vs population
Sample Population Chi-Square Test
Vintage # % # % Observed # Expected #
1973 – 1978 0% 1 0% 0 0
1979 – 1983 1 1% 2 0% 1 1
1984 – 1988 0% 6 1% 0 2
1989 – 1993 4 3% 12 3% 4 4
1994 – 1998 8 6% 37 9% 8 13
1999 – 2003 13 9% 56 13% 13 19
2004 – 2008 24 17% 83 19% 24 29
2009 – 2013 27 19% 109 25% 27 38
2014 – 2018 71 50% 123 29% 71 42
Total 148 103% 429 100% 148 148
Correlation factor for sample & population: 86% Chi-square p-value: 0.003
Return sample (n=128) vs population
Sample Population Chi-Square Test
Vintage # % # % Observed # Expected #
1973 – 1978 0% 1 0% 0 0
1979 – 1983 1 1% 2 0% 1 1
1984 – 1988 0% 6 1% 0 2
1989 – 1993 4 3% 12 3% 4 4
1994 – 1998 2 1% 37 9% 2 11
1999 – 2003 8 6% 56 13% 8 17
2004 – 2008 19 13% 83 19% 19 25
2009 – 2013 26 18% 109 25% 26 33
2014 – 2018 68 48% 123 29% 68 37
Total 128 90% 429 100% 128 128
Correlation factor for sample & population: 84% Chi-square p-value: 0.000001

53
Appendix A: Tables and Figures
Table 3. Chi-square tests for survey (n=143), funding (n=131), equity value (n=148) and return (n=128) sample vs population (n=429) based on their status (‘exited’, ‘liquidated’ and ‘survived’)
Survey Sample (n=143) vs population
Sample Population Chi-Square Test
Status # % # % Observed # Expected #
Exited 12 8% 41 10% 12 14
Liquidated 4 3% 57 13% 4 19
Survived 127 89% 331 77% 127 110
Total 143 100% 429 100% 143 143
Correlation factor for sample & population: 99% Chi-square p-value: 0.0007
Funding sample (n=131) vs population
Sample Population Chi-Square Test
Status # % # % Observed # Expected #
Exited 12 8% 41 10% 12 13
Liquidated 4 3% 57 13% 4 17
Survived 115 80% 331 77% 115 101
Total 131 92% 429 100% 131 131
Correlation factor for sample & population: 99% Chi-square p-value: 0.002
Equity sample (n=148) vs population
Sample Population Chi-Square Test
Status # % # % Observed # Expected #
Exited 24 17% 41 10% 24 14
Liquidated 4 3% 57 13% 4 20
Survived 120 84% 331 77% 120 114
Total 148 103% 429 100% 148 148
Correlation factor for sample & population: 98% Chi-square p-value: 0.00005

54
The Performance of Spin-Off Companies at the Swiss Federal Institute of Technology Zurich
For all four samples, the chi-square test strongly rejects the null hypothesis that the sample has the same composition as the population in terms of status. Source: calculations with data from survey and ETH spin-off database.
Return sample (n=128) vs population
Sample Population Chi-Square Test
Status # % # % Observed # Expected #
Exited 9 6% 41 10% 9 12
Liquidated 4 3% 57 13% 4 17
Survived 115 80% 331 77% 115 99
Total 128 90% 429 100% 128 128
Correlation factor for sample & population: 100% Chi-square p-value: 0.001
Equity funding Average equity funding (RHS)
0 0
250
150
100
4
6
8
20010
12
Mec
h. E
ng. A
eros
pace
Med
ical
Dev
ices
Mic
ro-N
anot
ech
Sen
sors
Ana
lyti
cs
Oth
ers
ICT
Ele
ctri
cal E
lect
roni
cs
Che
mic
al
Bio
tech
Pha
rma
Adv
ance
d M
ater
ials
Equ
ity
fund
ing
in C
HF
mil
lion
Ave
rage
equ
ity
fund
ing
in C
HF
mil
lion
250
Figure 31: ETH Zurich spin-offs; equity funding by sector (n=131) (RHS = right-hand side)Biotech Pharma is the sector with the most equity funding both in absolute and relative terms. Averages based on fewer than ten observations are greyed out.

55
Appendix B: Survey
The survey was developed by Simon Hofer and Luca Fricker,
two students at the University of St Gallen, in the context of
their master theses, in collaboration with Hanna Brahme and
Marjan Kraak from ETH transfer.
The survey was distributed officially through ETH transfer
by email. It contained a study invitation letter from Detlef
Günther from ETH Zurich and a link to the survey, which was
hosted on the online survey tool Unipark (www.unipark.com).
The study invitation letter and the print format of the survey
can be found on the following pages.
Appendix B: Survey

56
The Performance of Spin-Off Companies at the Swiss Federal Institute of Technology Zurich
Vizepräsident Forschung und Wirtschaftsbeziehungen
ETH Zurich Prof. Dr. Detlef Günther HG F 57 Raemistrasse 101 8092 Zurich, Switzerland Phone +41 44 632 20 39 Fax +41 44 632 15 92 [email protected] www.vpfw.ethz.ch
Participation in a new study regarding the performance of ETH spin-offs
Dear spin-off founder,
In addition to research and education, the transfer of technology and know-how to society has become an important third mission and mandate for ETH Zurich. Spin-offs provide a vehicle of ever-increasing significance for this purpose. ETH Zurich is proud of its growing spin-off community and puts great effort into continuously improving its spin-off support. Our institution receives an increasing number of requests from governmental agencies as well as from society for detailed information regarding the performance and the impact of ETH spin-offs and we are therefore obliged to provide such information in a comprehensive manner. In order to fulfil this obligation and to better understand the factors for success or failure and to quantify the spin-off performance, we have initiated a new study covering the 400 ETH spin-offs to date. The study will be executed by Luca Fricker and Simon Hofer of the University of St Gallen with a mandate from ETH transfer’s Spin-off Group (Silvio Bonaccio, Marjan Kraak and Hanna Brahme). The data collected will belong to ETH Zurich, will be treated confidentially, and only be presented anonymously. Both Luca and Simon have signed NDAs with ETH Zurich that ensure they are obliged to maintain strict confidentiality with regards to all data collected from ETH spin-offs as a part of the study.
We are very much depending on your help in this endeavour and we would be very grateful if you could take the time to share your data and own spin-off experiences. Your contribution will significantly aid the achievement of a complete picture of our ETH spin-off community. This in turn will help us to comply with the reporting requests and define actions to better support you, your colleagues and our future ETH spin-offs.
Should you have any questions regarding the execution of the study or how the data will be used, do not hesitate to contact Hanna Brahme (via email to [email protected] or phone: +41 44 632 81 36), who is responsible for the study.
With best regards, ETH Zürich
Detlef Günther

57
Appendix B: Survey
1. What is the name of your company? 2. In order to get an understanding of the current operational status of your company,
please let us know whether your company is active and if any of the events below applies
a. Operating with _____ employees (full-time equivalent) b. Ceased activities, hibernation or liquidated in year c. Exit in year d. Other (please specify)
3. Activity ceased for one or more of the following reasons a. No market need b. Ran out of cash c. Not the right team d. Got outcompeted
4. What type of exit? a. Merger b. Acquisition c. IPO d. Other (please specify)
5. How much % of equity was sold for what price? (in case of an IPO, please use closing price of first day of listing)
6. Where is your headquarter located? 7. Where do you have branches? (Select if you have at least one office space in the
country/region) a. Switzerland b. Germany c. Europe (other than CH and DE) d. US North America (other than US) e. South America f. Asia g. Africa h. Australia
8. Tell us a bit more about the founding team (For each founding member) a. Gender b. Nationality c. Highest education d. Field of education
9. Are any of the founders serial entrepreneurs? 10. How did the founding team get to know each other?
a. Previous academic work b. Previous industry work c. Friends without prior work relation d. Entrepreneurship course e. Single founder
11. Does your company have an ESOP (Employee stock option pool)? 12. What was the highest number of employees (FTE) your company had during its
lifespan? a. # Employees in total (FTE) b. # ETH graduates employed (FTE)

58
The Performance of Spin-Off Companies at the Swiss Federal Institute of Technology Zurich
c. # ETH graduates in the management board d. # ETH graduates in the board of directors
13. Indicate the equity-funds raised from each source and the corresponding # of shares received (please indicate for the field CHF the amount raised and for the field shared the amount of shares distributed per round. Furthermore the Rx stands for each round)
Round Founders FFF BA’s VC’s Other Date CHF (R1)
Shares (R1) CHF (R2)
Shares (R2) CHF (R3)
Shares (R3) CHF (R4)
Shares (R4) CHF (R5)
Shares (R5) CHF (R6)
Shares (R6) CHF (R7)
Shares (R7) CHF (R8)
Shares (R8) CHF (R9)
Shares (R9) CHF (R10)
Shares (R10)
14. Please list the key accounting indicators for the year 2017 a. Revenue (CHF) b. EBIT (CHF) c. Profit after taxes (CHF) d. Equity at book value, 31/12/07 (CHF) e. Comments (optional)
15. Where are your investors based? a. Switzerland b. Germany c. Europe (other than CH and DE) d. US North America (other than US) e. South America f. Asia g. Africa h. Australia i. No investors involved
16. How many granted or pending patent families does your company have? a. # Registered in the name of the company b. # Licensed from ETH

59
Appendix B: Survey
c. # Licensed from 3rd parties 17. What role does patents play for your business? (tick all that apply)
a. Important to attract investors b. Necessary for the business c. Too expensive for the business d. Useful only in the beginning e. No relevance for the business f. Other (please specify)
18. Do you license out / sublicense out any patents to 3rd parties? 19. Does any of the following make up an important basis for your company? (tick all
that apply) a. Software (developed at ETH or in the company), published under an open
source license b. Software (developed at ETH or in the company), kept closed source c. Registered trademark d. Trade secret / confidential know-how e. Other (please specify) f. None of the above
20. Select all sources that significantly contributed to your progress (coaching, network, etc.) If significant contribution was only through funding, don't select
a. Bridge Grant b. Pioneer Fellowship ETH c. ETH spin-off community d. Gebert Rüf e. Haslerstiftung f. Innosuisse (former CTI/KTI) g. Venture Leaders h. Venture Lab i. Venture Kick j. >>Venture>> k. ZKB Pionierpreis l. Wyss Zurich m. Other (please specify)
21. Please indicate the total amount of contributions from foundations, awards and other support mechanisms
22. On a scale from 1-10 how satisfied are you with the support from and interactions with ETH transfer? (1 means extremely unsatisfied and 10 extremely satisfied)
23. Through which of the following measures could ETH Zurich further improve its technology transfer? (Please tick the three most important ones.)
a. More commercially oriented R&D b. Generate more VC / Angel interest c. Provide more “Proof-of-Concept” funding d. ETH to take more equity stakes (as part of the license agreement) e. Extend infrastructure and administrative support f. Improve the licensing terms (please specify) g. Increase business relevant experience in TTO h. Possibility to act as an investor in ETH spin-offs (at market value) i. Other (please specify)

60
The Performance of Spin-Off Companies at the Swiss Federal Institute of Technology Zurich
24. What kind of community events have been the most helpful during the spin-off process and what events could improve the networking?
a. Spin-off dinner b. Beekeeper platform c. Newsletter d. Drinks e. Sola relay f. Other
25. Did you have an industry partnership that significantly contributed to the progress of your spin-off? (If yes, please give some short information (including the financial contribution if available, e.g. "A pilot project with a pharma company contributed 100k CHF in funding")
26. Would you be available for a more in depth interview to help ETH Transfer improve its support programs? (If yes please enter the contact details for a follow up)