the performance of index based livestock insurance ex ante
TRANSCRIPT
THE PERFORMANCE OF INDEX BASED LIVESTOCK
INSURANCE: EX ANTE ASSESSMENT IN THE
PRESENCE OF A POVERTY TRAP
Sommarat Chantarat. Andrew G. Mude, Christopher B. Barrett and Calum G. Turvey*
November 2009
Comments greatly appreciated
* The authors are Post-Doctoral Research Associate, Cornell University, Research Scientist, International Livestock Research Institute, Nairobi, Kenya, S.B. & J.G. Ashley Professor of Applied Economics and Management, Cornell University, and W. I. Myers Professor of Agricultural Finance, Cornell University, respectively. This research was funded through a USAID Norman E. Borlaug Leadership Enhancement in Agriculture Program Doctoral Dissertation Improvement Grant, the World Bank Commodity Risk Management Program, the USAID Assets and Market Access Collaborative Research Support Program, the International Livestock Research Institute and the Graduate School of Cornell University. Data were made available by the Pastoral Risk Management project of the Global Livestock Collaborative Research Support Program, funded by the Office of Agriculture and Food Security, Global Bureau, USAID, under grant number DAN-1328-G-00-0046-00. We thank Michael Carter, Munenobu Ikegarmi, John McPeak, Sharon Tennyson and seminar participants at Cornell University and the International Livestock Research Institute, Nairobi, Kenya, for their helpful comments. The opinions expressed do not necessarily reflect the views of the U.S. Agency for International Development or the World Bank. Any remaining errors are the authors’ sole responsibility.

1
THE PERFORMANCE OF INDEX BASED LIVESTOCK
INSURANCE: EX ANTE ASSESSMENT IN THE
PRESENCE OF A POVERTY TRAP
Abstract
This paper evaluates the effectiveness of a new index-based livestock insurance (IBLI) product designed to compensate for area average predicted livestock mortality loss in northern Kenya, where previous work has established the presence of poverty traps. We simulate household-specific wealth dynamics based on a model parameterized using rich panel and experimental data from the region. The simulations allow us to investigate patterns of willingness to pay for asset index insurance that is imperfectly correlated with individuals' loss experience. The bifurcated livestock dynamics associated with the poverty trap gives rise to insurance valuation that is highly nonlinear in individual herd size. Willingness to pay among vulnerable groups who most need insurance are, on average, lower than commercially viable rates but subsidization of IBLI premiums appears to offer more cost-effective poverty reduction than direct transfers to the poor.
Keywords: Index insurance, asset risk, bifurcated wealth dynamics, nonlinear growth, poverty traps, safety net, risk preference elicitation, pastoralists, Kenya
1. Introduction
Index insurance has gained widespread interest in recent years as an instrument for
reducing uninsured risk in poor rural areas that typically lack access to commercial
insurance products. These financial instruments make indemnity payments based on
realizations of an underlying index – based on some objectively measured random
variable – relative to a pre-specified threshold, the “strike” (Barnett et al. 2008). Index
insurance offers significant potential advantages over traditional insurance. Because
indemnity payments are not based on individual claims, insurance companies and insured
clients need only monitor the index to know when payments are due. This sharply
reduces the transaction costs of monitoring and verifying losses, while also eliminating

2
the asymmetric information problems (i.e., adverse selection and moral hazard) that
bedevil conventional insurance. These advantages have sparked considerable interest in
index insurance for poor regions otherwise lacking formal insurance access (Barnett and
Mahul 2007).
The advantages of reduced transaction costs and asymmetric information
problems, however, come at the cost of increased “basis risk”, the imperfect correlation
between an insured’s loss experience and the behavior of the underlying index on which
the index insurance contract is written. A contract holder may experience losses but not
receive a payout if the overall index is not triggered. Conversely, the aggregate
experience may trigger indemnity payments even to insurees who experience no loss.
Given this tradeoff between basis risk and reduced incentive problems and
transactions costs, the impact of index insurance on well-being remains unknown,
especially in the case of index insurance on assets that determine the time path of future
earnings and welfare. And because index insurance is so new, with limited uptake and
predictable questions about the quality of the initial contracts, there is no empirical
evidence yet as to the impact of index insurance on the well-being of otherwise-uninsured
poor populations. This paper offers some initial, ex ante impact assessment findings
related to a specific index insurance contract that is scheduled to go on sale in early 2010.
It also offers an innovative approach to establishing the welfare effects of and willingness
to pay for asset insurance and demonstrates how the presence of asset thresholds
associated with poverty traps can affect insurance valuation and performance.
The arid and semi-arid lands (ASAL) of east Africa are among the poorest regions
on Earth, with severe (less than $1/day) poverty rates routinely in excess of 75%. Given
meager rainfall and infrastructure, the pastoralist populations who inhabit these areas rely
heavily on extensive livestock grazing for their livelihood. Recent economic research,
building on extensive prior ethnographic work, finds that east African pastoralists operate
in an environment characterized by multiple herd size equilibria characteristic of poverty
traps (Lybbert et al. 2004, Barrett et al. 2006). The prominent role that covariate climate
risk plays in driving pastoral poverty traps (Santos and Barrett 2007) and growing
concern that droughts are driving growing numbers of pastoralists into destitution
(Sandford 2006, Little et al. 2008), naturally motivated the recent development of index-

3
based livestock insurance (IBLI) against catastrophic herd loss in the northern Kenyan
ASAL (Chantarat et al. 2009a). These IBLI products are being commercially piloted
beginning in January 2010.
Like typical insurance, IBLI compensates for livestock loss. But unlike traditional
insurance, it only compensates for covariate herd losses that are predicted by the
historical relationship with remotely sensed Normalized Differential Vegetation Index
(NDVI) measures; an indicator of vegetative cover widely used in drought monitoring
programs in Africa. These data are publicly available in near-real time and objectively
verifiable. Chantarat et al. (2009a) explain the details of the IBLI contract design and
show that it performs extremely well out-of-sample in insuring against catastrophic
covariate shocks in this region. In this paper we use household-level panel data to
simulate the impact of IBLI on Northern Kenyan pastoral households’ welfare dynamics.
This paper makes several novel contributions to the literature. First, IBLI insures
assets rather than income. Although the overwhelming majority of the global insurance
market insures assets through property and casualty, life or health insurance products,
most index insurance on offer in the developing world focus on replacing lost income,
typically due to rainfall shocks that affect crop production. The loss of productive assets
like livestock potentially disrupts future income processes, not just current earnings.
Furthermore, in the presence of a poverty trap, shocks that push herd sizes below a
critical threshold at which herd dynamics bifurcate can have especially severe
consequences. The point of bifurcation is critical because below this threshold the rate at
which the livestock asset is depleted due to death loss far exceeds any short run
possibility of rejuvenating the herd. Thus insurance that effectively protects households
from slipping into the poverty trap can be of especially high value. Conversely, insurance
that consumes scarce resources and fails to protect the household from catastrophic
shocks can do damage. Given these considerations, we evaluate IBLI’s performance
using a dynamic model rather than the usual static approach employed in the existing
literature. We show that the effectiveness of IBLI depends on initial herd size relative to
the bifurcation threshold as well as, to a lesser degree, on household-specific basis risk
and risk preferences.

4
Second, rather than modeling performance for a representative agent, as is the
norm in the extant literature (Skees et al. 2001; Turvey and Nayak 2003; Vedenov and
Barnett 2004; Deng 2007), we explicitly study how IBLI performance varies based on
variation in household characteristics, such as initial herd size, and key basis risk and risk
preference parameters. And rather than making assumptions about these parameters, we
estimate them from panel data and field experiments from the area. Contracts that
perform well for a representative household may not prove effective for the majority nor
for target sub-populations. We show that to be the case with IBLI.
Third and finally, household-level simulation analysis allows us to compare the
outcomes of various subsidization programs and targeting schemes. Our analysis finds
that IBLI subsidies targeted toward vulnerable-but-non-poor pastoralists create an
effective safety net by protecting such households from slipping into a poverty trap after
a drought. This reinforces prior work suggesting that safety net interventions targeting the
non-poor can reduce poverty in the long run by stemming the rate of inflow into the ranks
of the chronically poor following a shock (Barrett et al. 2008).
The rest of the paper is organized as follows. Section 2 briefly explains the study
locations and the data. Section 3 introduces IBLI. Section 4 then describes the dynamic
model we use in the simulations and introduces the certainty equivalent herd growth rate,
which we use as a key performance evaluation criterion. Section 5 estimates distributions
of basis risk, risk preferences and other key household characteristics necessary for the
simulations. Section 6 reports the estimated IBLI performance and how this varies based
on identifiable household characteristics. Section 7 estimates households’ willingness to
pay for the optimal contract and district-level aggregate demand for IBLI. Section 8 then
explores how alternative approaches to offering IBLI commercially or with safety net
subsidies affect wealth and poverty dynamics in the system. Section 9 concludes.
2. The Study Area and Data
Extensive livestock grazing represents the key livelihood in the northern Kenyan ASAL.
Pastoralists move their herds in response to spatiotemporal variability in forage and water
access. Northern Kenya experiences bimodal rainfall, defined by long rains that fall

5
March-May, followed by a long dry season (June-September) season, then a short rains
season from October-December followed by a January-February short dry season. We
henceforth refer to the March-September period as the LRLD season (for long rains and
long dry), and the October-February period as SRSD (for short rains and short dry).
When the rains fail, especially over two rainy seasons in a row, catastrophic herd losses
commonly ensue.
We investigate IBLI performance in Marsabit District, Kenya, for which this
product was developed on a pilot basis. We use data from four locations – Dirib Gombo,
Logologo, Kargi and North Horr (Figure 1) – from which we have two complementary
household-level data sets: panel data collected quarterly from 2000-2002 on around 30
households in each location by the USAID Global Livestock Collaborative Research
Support Program “Improving Pastoral Risk Management on East African Rangelands”
(PARIMA) project (Barrett et al. 2008), and a separate survey fielded during May-August
2008 among 42 households in each location (Chantarat et al. 2009c). The latter survey
included field experiments to elicit risk preferences.
Table 1 summarizes key characteristics of the four study locations.1 Dirib Gombo,
on Mount Marsabit, enjoys relatively higher rainfall and is occupied mostly by cattle- and
smallstock-keeping Boran pastoralists who also rely on town-based livelihood
opportunities to complement their meager livestock holdings. Logologo is along the main
road, with a relatively more arid climate and larger cattle and smallstock herds based on
transhumant pastoralism. Kargi and North Horr are very arid locations on opposite edges
of the Chalbi dessert, where camel- and smallstock-keeping pastoralists rely on longer
distance migrations to cope with greater spatiotemporal variability in forage and water
availability.
Sample households rely on livestock and livestock products for 18-87% of their
income. Severe poverty is widespread and inversely correlated with herd sizes because
livestock are the main productive asset owned in the region. As a result, livestock
mortality is considered the main threat to pastoralists’ livelihood. Households’ seasonal
livestock loss 2000-2002 (including a bad drought in 2000) ranged from the lowest
average seasonal rate of 7% in North Horr to a high of 21% in Dirib Gombo. The long-
1 All summary statistics are weighted by appropriate stratified sampling weights.

6
term consequence of the 2000 catastrophic drought can be seen in the drastic reduction in
overall mean herd size from 25 TLU at the beginning of 2000 to 15 TLU at the end of
2008. Extreme (>20%) herd losses occurred in roughly 20% (10-15%) of seasons in Dirib
Gombo and Logologo (Kargi and North Horr). These catastrophic losses were typically
due to covariate shocks related to forage and water availability, while modest losses of
individual animals were more commonly idiosyncratic experiences (e.g., due to predators
or injury).
3. Index Based Livestock Insurance
Chantarat et al. (2009a) use a large, repeated cross-sectional household data set collected
by the Kenyan government at monthly frequency, 2000-2008, to predict area average
herd mortality rates, M̂ , from satellite-based, remotely sensed vegetation index series,
the normalized difference vegetation index for different locations l and seasons t
)( ltndvi : )(ˆˆltlt ndviMM . The resulting predicted livestock mortality rate serves as the
index triggering IBLI indemnity payments for that particular location relative to a pre-
specified “strike” level, *M . The IBLI contract )(ˆ,*ltndviMM makes indemnity
payments )(ˆ,*ltlt ndviMM equal to the difference between predicted losses )(ˆ
ltndviM
and the strike *M , expressed as a percentage of the insured herd value,
(1) 0,)(ˆ)(ˆ, ** MndviMMaxndviMM ltltlt .
For IBLI to be commercially viable, the insurance underwriter adds a premium
loading 0a over the actuarially fair rate – i.e., the rate estimated based on the empirical
distribution of NDVI – to take into account administrative costs, model uncertainty and
required profit margins.2 The loaded premium rate for coverage season t and location l,
quoted as a percentage of total insured herd value, can therefore be calculated as
2 The average premium loading for agricultural insurance contracts is in the range of 30-50%. See, for example, the USDA Risk Management Agency’s or the Farmdoc’s Premium Estimator for available
7
(2) )(0,)(ˆ)1()1()(ˆ, **ltltltlt
alt ndvidfMndviMMaxaEandviMM .
The left panel of Table 2 summarizes the predicted mortality index )(ˆltndviM for
each of the four study locations constructed using the full NDVI series available from
1982-2008 and the livestock mortality forecasting model developed by Chantarat et al.
(2009a). The predicted herd mortality indices average 8-9%. The right panel of Table 2
also shows the actuarially fair IBLI premium rate, which varies across locations due to
differences in the distributions of predicted herd mortality index. In what follows, we use
54 seasons of predicted area average herd mortality and the associated fair premium rates
to evaluate IBLI performance.
4. Analytical Framework
With this simple background on the region, the data and IBLI behind us, we now develop
a simple dynamic model that accommodates the nonlinear, bifurcated herd dynamics
previously observed in the region, with a critical herd size threshold typically in the range
of 10-20 tropical livestock units (TLU)3 (Lybbert et al. 2004, McPeak 2004, Barrett et al.
2006, Santos and Barrett 2007). This model generates multiple welfare equilibria, the
lowest of which is associated with a poverty trap. As will be clear, the presence of the
threshold affects the valuation of IBLI conditional on a household’s current herd size.
4.1 A Stylized Model of Bifurcated Livestock Dynamics
Denote the herd size, in TLU, realized by household i in location l at the beginning of
season t (and so at the end of season t-1, where seasons alternate within a year between
LRLD and SRSD) as iltH . Herd dynamics are governed by various stochastic processes:
the rate of biological reproduction, denoted by iltb~
, the gross non-biological herd
insurance policies for several states and important grain crops in the U.S. (http://www.rma.usda.gov/policies/2006policy.html ; http://www.farmdoc.uiuc.edu/cropins/index.html). 3 1 TLU = 1 cattle = 10 goats or sheep = 0.7 camels.
8
recruitment rate, ilti~ (which includes purchases, borrowed animals, transfers in, etc.), the
gross herd offtake rate, ilto~ (which includes slaughters, sales, transfers out, etc.) and the
herd mortality rate, iltM~
. Pastoralists face a subsistence constraint that can be
summarized as a required seasonal livestock offtake level, cH , that covers the minimum
consumption required for every household member. In this model, we assume households
have identical membership structures and thus cH is the same for each household.
Herd reproduction, mortality and herd offtake and recruitment decisions also
depend on the risks inherent in the system. The main covariate component in household
asset risk is related to rangeland conditions, and so is characterized by the vegetation
index ltndvi that follows probability distribution )( ltndvif . This covariate risk is covered
by IBLI. But each household also faces risks, ilt , drawn from probability distribution
)( ilth , that are uncorrelated with the covariate component and therefore uncovered by
IBLI. This latter component includes mainly idiosyncratic shocks experienced by specific
households – such as conflict, raiding, predation, accidents, etc. – as well as other
covariate risk unrelated to range conditions – such as disease outbreaks – although we
find the latter is relatively small compared to the covariate component. Together these
processes generate the net stochastic herd growth rate in period t, which nets out herd
offtake and mortality rates from the reproduction and herd recruitment rates so that the
seasonal herd accumulation can be characterized by
(3) ilt
iltltiltilt
c
iltiltltilt
iltiltltiltiltiltltilt
ilt HndviM
H
HHndvioMax
HndviiHndvib
H
),(~
),,,(~
),,(~
),,(~
1~
1
where the stochastic herd size 1
~iltH is realized at the end of period t. The reproduction
and net offtake rates vary with a household’s beginning herd size, iltH . Note that we
abstract here from modeling each of these livestock reproduction and transaction choices;
instead we simply calibrate this growth function based on the household-specific
longitudinal data.

9
The stochastic net growth function (e.g., iltiltiltilt Moib~~~~
) defined in equation
(3) is assumed to be continuous, equal to zero when the beginning herd size is zero and
bounded from below at zero. Equation (3) thus imply nonlinearities in herd accumulation
due to the consumption requirement, cH , which imposes a regressive fixed cost rate –
inversely proportional to the beginning herd size – on the rate of return on livestock asset.
Given the fixed subsistence consumption requirement, households with smaller herd sizes
must consume a larger portion of their herd. Herd decumulation results where net herd
growth falls below the minimum consumption rate.
The resulting nonlinearity in net herd growth implies a bifurcation in herd
accumulation characterized by at least one (subsistence-driven) threshold )(* cHH above
which herd size is expected to evolve toward a high-level equilibrium and below which it
is expected to fall to a poverty trap equilibrium. Equation (3) can therefore be rewritten as
a nonlinear net herd growth function )( such that the expected net herd growth
conditional on herd size bifurcates at the critical herd threshold )(* cHH :
(4) iltiltltilt HndviH ,,~
1 where 0)( iltHE if )(* c
ilt HHH
0)( iltHE if )(* c
ilt HHH .
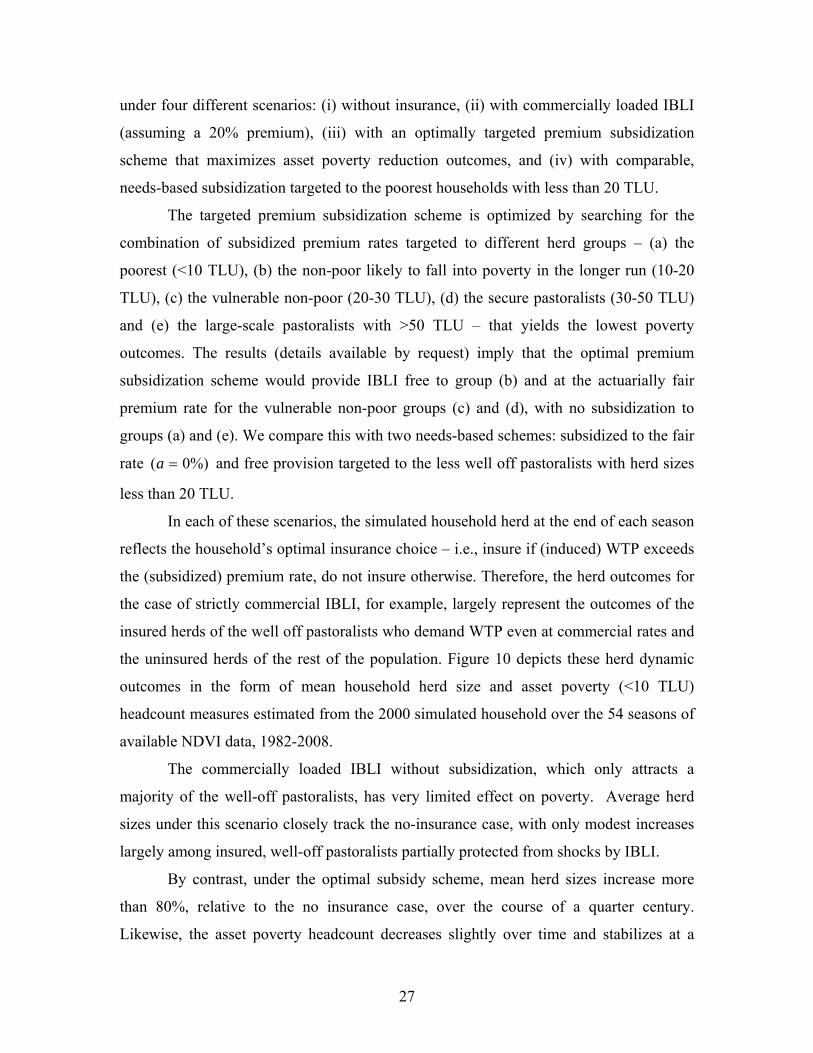
Setting the subsistence consumption level at 0.5 TLU per season per household,4
Figure 2 illustrates the nonlinear expected net herd growth estimated nonparametrically5
using observed household herd data (birth, mortality, purchase, exchange, sale, slaughter
and transfer rates) in 2000-2002 and 2007-2008. This pattern implies the bifurcated herd
threshold at around 15 TLU per household – consistent with previous findings (Lybbert
et al. 2004, McPeak 2004, Barrett et al. 2006, Santos and Barrett 2007) – below which
herds collapse over time toward a stable equilibria of 0 TLU, implying an exit from
4 Previous survey work in this region finds average livestock offtake for household consumption averages slightly less than one goat a month (McPeak 2004). According to FAO (1992), five goats (each yielding 20 kilograms of meat equivalent to 5000 grams of protein) gives an average family of three 46 grams of protein per day per individual, nearly the recommended daily intake of 50 grams of protein per day per individual. 5 The function is estimated using Epanechnikov kernel with rule-of-thumb optimal bandwidth.

10
pastoralism. Above that threshold, herds grow toward a high level stable equilibrium size
of 55-60 TLU.
Household i derives intertemporal utility based on a simplified Constant Relative
Risk Aversion (CRRA) function defined over livestock wealth as
(5)
)(),...(
~),...,(
~, 1
il
t
ttiltiltiltiltilt HuEHHHHHU
where i
Ril
il R
HHu
i
1
~)(
1
10 iR is the Arrow-Pratt coefficient of relative risk aversion and 1,0 is the
discount factor. Because of the direct link between herd and welfare dynamics, the
certainty equivalent growth rate of stochastic herd dynamics provides a direct household
welfare measure. Define the certainty equivalent herd growth rate as the constant net herd
growth rate with respect to the initial herd, iltH , that yields the same intertemporal utility
as the expected intertemporal utility obtained from the stochastic herd dynamics.
Specifically, the certainty equivalent growth rate, cil , of the stochastic herd dynamics,
T
tilH 1
~ , can be written as6
(6) )(~
),...,(~
),(~
,..., 21 iltilTiltiltiltiltiltcililt
cil HHHHHHUHHU
Using this formulation, IBLI increases household welfare if it increases the certainty
equivalent herd growth rate relative to that of the uninsured herd dynamics. Therefore, a
risk premium growth rate, cNIil
cIil
cil , provides a measure of dynamic welfare
improvement due to insurance. This measure has general applicability to dynamic welfare
analysis with respect to any asset insurance.
The certainty equivalent growth rate thereby provides a convenient measure of the
intertemporal welfare impact of IBLI given the underlying herd dynamics, in contrast to
6 If 1 , this can be written more generally as ))(
~()( ilt
Iiltilt
cil HHEUHU .

11
the existing literature, which concentrates on static impact analysis.7 This is important
because IBLI performance in the initial insured seasons affects performance in later
seasons through the reinforcing impact of herd dynamics where growth patterns are
nonlinear, as in this setting. For example, if IBLI fails to protect household from losses in
the initial seasons that set it on the herd decumulation trajectory, IBLI’s long-term
performance could be compromised by the initial herd collapse and ensuing dominant
herd dynamics. Because the welfare and growth effects of loss vary depending on where
in the herd size distribution one experiences loss, standard insurance performance
measures based on induced changes in outcome distributions will not suffice in this
setting.
4.2 Managing Mortality Risk with IBLI
IBLI compensates for covariate livestock mortality loss based on the predicted herd
mortality index in each location, )(ˆltndviM . For simplicity, we assume that the
household insures either all or none of their herd at the start of each season, which
enables us to compare fully insured herds under several contract specifications against the
case of no insurance. The insured herd size realized at the end of coverage season t for a
household in location l can thus be written as
(7) iltaltltiltltilt
ciltiltltilt
Iilt HndviMHHndvigH ),(
~)|,,(~1
~1
where iltg~ represents the non-mortality component in the net growth rate in (3).
IBLI thus reduces expected net herd growth in good seasons by the IBLI
premium, alt , but IBLI should at least partially compensate for losses during periods of
substantial covariate herd mortality through the indemnity payment, lt . Given certain
cost and uncertain benefit, the household-specific basis risk with respect to the contract
7 Another approach concentrates on measuring changes in the distribution of the insured outcome based on mean-variance measures, e.g., coefficient of variation, value at risk and downside risk measures (Skees et al. 2001; Turvey and Nayak 2003; Vedenov and Barnett 2004). Since that approach ignores the insuree’s risk preferences, it may misestimate the benefit of insurance (Fishburn 1977; Breustedt et al. 2008).

12
)(ˆ,*ltndviMM is thus a key determinant of IBLI performance. According to (1) and (7),
basis risk depends on the correlation between the predicted area average mortality index,
)(ˆltlt ndviM , and the individual-specific mortality rate, ),(
~iltltilt ndviM . The larger the
proportion of predictable covariate loss in a household’s individual mortality loss, the
greater the gains from IBLI.
We further investigate the basis risk in IBLI by disaggregating the household-
specific mortality rate into a beta representation form of the hedgable predicted mortality
index. Specifically, household-specific herd mortality ),(~
iltltilt ndviM is orthogonally
projected onto the predicted area average mortality index as8
(8) iltlltltiililtltilt ndviMndviM ˆ)(ˆ),(~
where 0)( iltE , 0)),(ˆ( iltltlt ndviMCov and IVar ililt2)( . Here il reflects
household i’s long-term average mortality rate, which implicitly reflects household-
specific characteristics that determine their livestock loss (e.g., herding ability), l̂ is the
long-term mean of the predicted mortality index for location l and ilt reflects other losses
that are not correlated with the covariate component captured by the index.
This beta representation allows us to identify distinct, interrelated household-
specific basis-risk determinants, ililti ,, . The coefficient i measures the sensitivity
of the household’s mortality experience to the predicted herd mortality index in its area.
1i represents the case in which deviations of household i’s livestock losses from its
long-term average are, on average, perfectly explained by variations in the predicted area
average mortality index, while 0i corresponds to the case, where these two series are
independent. If the household-specific mean mortality il is relatively similar to the
location-specific mean predicted mortality rate l̂ , then the closer i is to one, the better
will the predicted mortality index explain household’s losses, and so the lower the basis
risk. Pastoralists with i lower (greater) than one or with il lower (greater) than l̂
8 Miranda (1991) and Mahul (1999) also use variant of this specification.

13
therefore tend to over (under)- insure their herd mortality losses using IBLI. The risk
component ilt reflects the relative proportion of household’s overall losses that are not
manageable by IBLI. The greater its variance, 2il , the larger the basis risk.
Our analytical framework thus emphasizes the standard theoretical result that the
risk management effectiveness of any IBLI contract specification, altltndviMM ),(ˆ,* ,
measured by ),,,( iiltiltltcil RHndvi depends on household-specific variation in these
key basis risk determinants and risk preferences. A critical innovation with this approach
is that the presence of a threshold-based poverty trap further implies that IBLI
performance also depends on household herd size. This analytical framework serves as
the basis for the estimation and simulation in Section 5.
4.3 Threshold-based IBLI Performance
In order to show analytically how IBLI valuation might deviate from the standard
insurance evaluation in the presence of bifurcated asset dynamics, we discretize the
nonlinear net herd growth in (4) into a simple additive form:
(9) iltiltltiltilt HndviBHAH ),()(~
1 with
HH
HH
ifn
ifnHA
ilt
ilt
H
Lilt
)( and P
P
yprobabilit
yprobabilit
with
withndviB
iltB
iltGiltlt
1
),(
In (9), )(A represents the deterministic component of the herd growth rate, which is
conditional on the initial herd size relative to the critical threshold with 10 L and
1H . The relation )(B is the stochastic component of herd growth written as the sum
of the insurable covariate component captured by NDVI ( 0G in a good season with
probability )()(ˆ*
0
lt
M
lt ndvidfndviMP and 0B in a bad season with probability
14
( P1 ) and the uncovered component with 0)( iltE . Assuming, for simplicity, that
0)1( BG PP , this implies the expected herd dynamics:
(10) iltiilt HHE 1
~ where
*
*
HH
HH
ifn
ifn
ilt
ilt
H
Li
.
This allows us to derive recursively two stable intertemporal welfare levels:
(11) iR
i
iltiltiltilt
HuHHHU
11 1
)(),...(,
where
*
*
HH
HH
ifn
ifn
ilt
ilt
H
Li
with 10 L eventually leading those with *HH ilt into the poverty trap, a long-run
equilibrium herd size close to zero.
We consider the expected impact of IBLI when pastoralists can insure all of their
herds at period t with a contract priced at lt that pays lt in a bad season with
probability P1 and pays nothing during a good season with probability P. Holding risk
preferences and basis risk determinants constant, we will show that the dynamic welfare
effect of an IBLI contract varies with initial herd sizes at time t. In particular, four distinct
cohorts emerge.
(1) For the first cohort, IBLI cannot alter their herd dynamics. Their beginning
herd size is too far beneath the critical herd size threshold to grow past *H by the end of
the season since even in a good season and without insurance *)( HH iltGL . Thus
IBLI only provides typical insurance in reducing the probability of herd loss during a bad
season, while the premium payment speeds up herd decumulation during good seasons.
By (6), the IBLI valuation is the same as that in the standard insurance case without
bifurcated asset dynamics:
(12)
iii RL
iltBLR
L
iltGLR
L
iltcNIil Hu
PHu
PHu
111
1
1
)()1(
1
)(
1
w/o IBLI

15
iii RL
iltltltBLR
L
iltltGLR
L
iltcIil Hu
PHu
PHu
111
1
1
)()1(
1
)(
1
w/ IBLI
So 1111 ))(1()( iii
RRltltBL
RltGL
cil PP
111 ))(1()( iii
RRBL
RGL PP .
For this cohort, the value of IBLI (reflected in a positive risk premium growth rate)
depends on the extent to which IBLI imperfectly compensates for the insured’s losses and
household-specific risk preferences. However, since households in this cohort converge
to the low-level equilibrium with or without insurance, IBLI offers them relatively little
in the way of economic relief.
(2) The second cohort consists of pastoralists expecting to grow their herds.
Beginning herd sizes are modestly above *H and grow if the season is good and when
they do not pay the insurance premium. However, paying the insurance premium drops
them beneath *H so that 1** )( iltltiltGL HHHH in a good season. Because
IBLI shifts down their herd growth trajectory, the risk premium growth rate is effectively
taxed by 11
11
1
i
i
H
L
, as is evident from the certainty equivalent growth rate:
(13) 1112 ))(1()( iii
RRltltBH
RltGH
cil PP
1
111
1
))(1()(1
1
i
ii
i
iR
RBH
RGH
H
L PP
The value of IBLI is therefore lower than it would be absent the bifurcated herd
dynamics, holding risk preference and basis risk determinants constant.
(3) The third cohort consists of pastoralists with beginning herd sizes slightly
above but still vulnerable to the risk of falling below *H . IBLI protects this cohort from
falling below *H while their herd size remains above *H after paying the insurance
premium, iltltiltGL HHH *)( . For them .)()( ** HHHH iltBLiltltlt
16
Since IBLI preserves their herd growth trajectory, IBLI increases their insurance
valuation relative to the case without bifurcated asset dynamics by the factor
.11
11
1
i
i
RL
RH
For this reason, the dynamic welfare impact of IBLI for this cohort is
(14) 1113 ))(1()( iii
RRltltBH
RltGH
cil PP
1
11
11 )()1(
1
1)(
i
i
i
i
i
R
RBHR
L
RHR
GH PP
.
(4) The last cohort consists of pastoralists with herd sizes so large that even
without insurance they are not expected to fall below the critical herd threshold after
covariate shocks; .)( *HH iltBH Thus IBLI would not alter their herd dynamics,
just like the first cohort (with the smallest herds). But because these larger herd sizes
have higher expected net herd growth, H , their valuation of IBLI is significantly more
than those in the first cohort according to
(15) 1114 ))(1()( iii
RRltltBH
RltGH
cil PP
111 )()1()( iii
RRGH
RGH PP .
Overall, cohorts three and four – the wealthier segments of this at risk population –
represent the main source of demand for IBLI in this setting. The expected threshold-
based performance of IBLI in the presence of bifurcated wealth dynamics mirrors the
patterns found in Lybbert and Barrett (forthcoming) in a different poverty trap model that
does not consider insurance options.
5. Empirical Estimation and Simulation
In what follows, we simulate households’ herd dynamics and key performance
determinants – household risk preferences and basis risk – as a first step towards

17
exploring the effectiveness of IBLI contracts over many sets of seasons, with different
initial seasonal outcomes.
The main component in estimating and simulating herd dynamics is the net herd
growth rate in (3). We estimate the non-mortality component separately from the
mortality component as we are particularly interested in estimating the key basis risk
determinants directly from the correlations between individual households’ livestock
mortality and the location-specific predicted herd loss index that triggers IBLI payout.
We first estimate non-mortality component of the seasonal livestock growth
function in (3) by imposing subsistence consumption of 0.5 TLU per household per
season. We pool four seasons of herd dynamics data from 2000-2002 and two seasons
from 2007-2008 under the maintained hypothesis that the expected herd growth function
is stable across 2000-2008. Kernel-weighted local polynomial regression9 is used to
estimate two nonparametric relationships between the non-mortality herd growth rates10
and household beginning TLU herd size conditional on whether the observed season is
good or bad, as defined by seasonal NDVI data according to Chantarat et al. (2009a). The
two estimated non-mortality growth functions conditional on the vegetation condition are
then used in the simulation of herd dynamics. They are plotted in Appendix 1.
Next, we estimate the relationship between household-specific herd mortality
rates and the location-average predicted mortality index described in (8). We pool four
seasons of household-specific mortality rates across the four 2000-2 study locations. A
linear relationship between deviations of the two from their long-term means is then
estimated using a random coefficient model with random effects on the slope coefficient,
commonly known as “beta”.
This model, estimated by maximum likelihood, allows us to take into account
variations of slope coefficients across households.11 The estimated slope coefficient
represents the degree of sensitivity of household’s mortality loss to the predicted
9 Epanechnikov kernel function is used and the optimal bandwidth is chosen according to Silverman’s Rule of Thumb. 10 Growth rates were constructed using observations on births, purchases, borrowing and lending of animals, exchanges, sales, slaughters and transfers. 11 Estimation of models of beta-representation (e.g., the CAPM model in financial econometrics) generally rely on the seemingly unrelated regressions model for sector-specific equations, which allows for unrestricted error structures (e.g., due to potentially cross-sectional correlations). In our case, we do not have enough longitudinal observations of individual households to apply that model.

18
covariate mortality index for their location. Of course there may still be other covariate-
but-unpredicted components, in addition to the idiosyncratic component, in the model’s
disturbances, which can potentially result in cross-sectional correlation. In an attempt to
disaggregate these two components in the disturbances, the predicted seasonal household-
specific residual ilt̂ is projected onto its location-specific mean each season lt .12 So the
model we estimate can be summarized as
(16) iltlltltiililtltilt ndviMndviM ˆˆ),(~
iltltilt e
where lt represents the covariate component in the unpredicted mortality loss with
degree of co-variation measured by , and ilte represents household’s idiosyncratic
mortality loss with 0ilteE , 0jltilt eeE if ji , and IeVar ililt2 . The estimation
results, which allow us to estimate household’s basis-risk-determining parameters and
other key characteristics13 in iltiiltililti eH ,,,,, , are reported in Appendix 2.
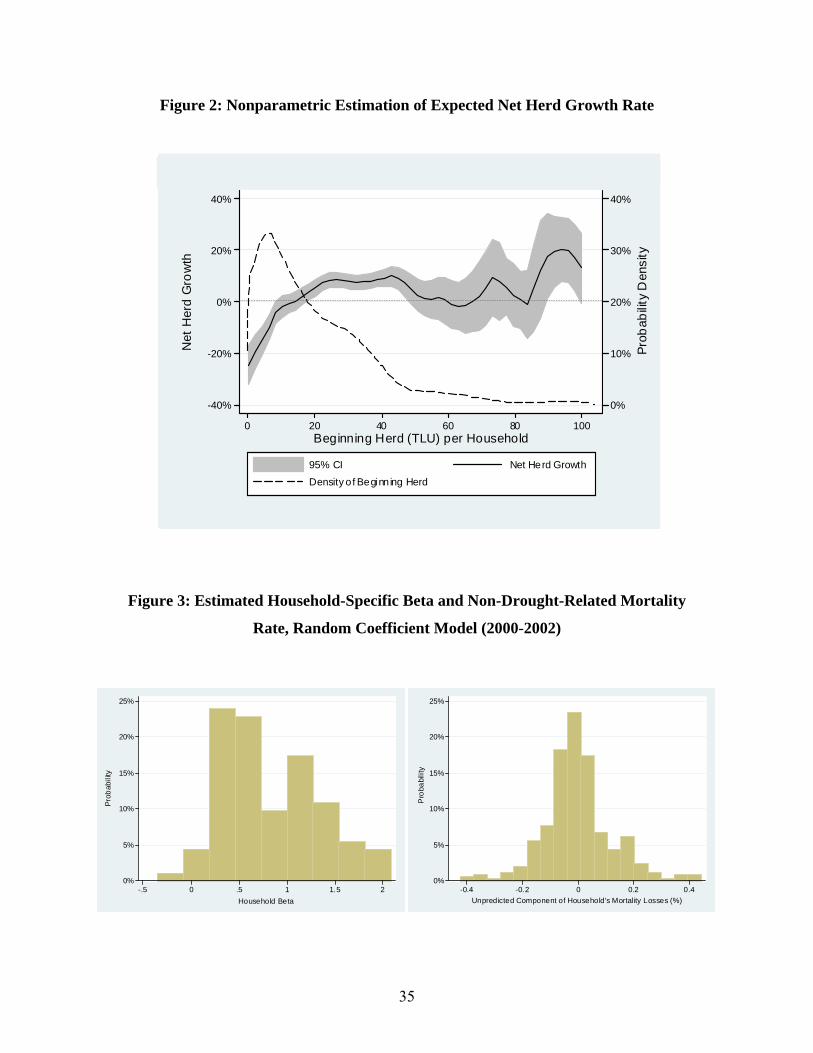
We show in Figure 3 the distributions of estimated household betas, as well as the
unpredicted component of mortality losses, ilt for these four locations.14 Overall, the beta
distribution centered around 0.8 with considerable variation,15 ranging from -0.35 to 2
with a standard deviation of 0.5. The distribution of the mean-zero unpredicted
component of mortality losses also exhibits high variation, ranging from -0.42 to 0.44
with a standard deviation of 0.12. This dispersion indicates considerable basis risk in
IBLI in spite of the product’s very strong out-of-sample performance (Chantarat et al.
12 The intercept for this model is zero by construction. 13 The overall average herd sizes observed from 2000-2002 and 2007-2008 are used as representatives of the beginning herd sizes in the four locations. 14 Though our estimations and simulations from this point on were location-specific, we report overall results. Some location-specific results are reported in the Appendices; the rest can be requested from the authors. 15 Because (16) implies the estimated household beta only with respect to the the hedgeable mortality index, this does not have to be centered at one, unlike the estimated household beta with respect to area-average losses – such as is commonly used in agricultural finance literature for measuring basis risk (Carter et al. 2007; Miranda 1991).

19
2009a), and the potential for significant, predictable variation in performance across
households.
We then estimate parametrically the best fit joint distributions, by location, of the
estimated household-specific characteristics iltiiltililti eH ,,,,, using the @Risk
program, which allows us to specify a correlation matrix that captures pairwise
relationships between these variables, and the upper and lower limits of the distributions.
The best-fit distributions were then chosen based on the χ2 goodness of fit criterion. The
estimation results are reported in Appendix 2.
Using these estimated distributions, we then simulate herd dynamics of 500
representative households in each location as follows. For each location, we randomly
draw 500 combinations of household-specific iltilii H,,, from the joint
distributions – each of which represents a simulated representative household. For each
simulated household, we then randomly draw 54 seasons of idiosyncratic components of
mortality loss, ilte , from the location-specific distribution.16 We also randomly draw 54
seasons of location-average unpredicted mortality losses, lt , from the values estimated
according to (16). Figure 4 presents the overall cumulative distributions of baseline household herds
(i.e., without insurance) during various years for these four locations. More than 50% of
herds collapse toward destitution over time in Dirib Gombo, compared to less than 10%
in North Horr, reflecting the relatively low beginning herd sizes and high seasonal
mortality experience in Dirib Gombo relative to other locations. The bifurcated livestock
growth in the simulated herd dynamics can be shown by simply estimating the
autoregression in (4) for 10-season (5-year) lags. Figure 5 plots the results, which clearly
display a critical herd size threshold around 15 TLU.
We also simulate dynamics for 15 stylized pastoralist households with key
characteristics, e.g., five different beginning TLU herd sizes 30,20,15,10,5 and three
levels of beta coefficients 5.1,1,5.0 for each initial herd size. Each is assumed to have a
long-term mortality rate that resembles the location-specific long-term mean predicted
16 We use the location-specific distribution of ilte since we do not have enough individual data to simulate
the individual-specific distributions.

20
mortality index, and a location-specific uncovered risk component. These stylized
households allow us to better understand how basis risk and initial herd sizes influence
IBLI’s impact on herd dynamics.
We are now ready to analyze the effectiveness of IBLI by simply comparing herd
dynamics with and without IBLI. We construct 54 pseudo sets of 54 consecutive seasons
from the existing vegetation data letting each observation serve as an initial period once
in a revolving 54-season sequence with the working assumption that these 54 seasons
repeat themselves in sequence.17 This allows us to evaluate performance of IBLI taking
into account different possible initial realizations of stochastic range conditions.
We consider five IBLI contracts with five strike levels of five percent increments
from 10-30%. Households are assumed to insure their entire herd. For each contract, we
simulate the resulting insured herd dynamics based on (7) using the distribution of
location-specific seasonal predicted mortality index )(ˆltndviM and the location-specific
premium rate shown in Table 2.
As we compute the value of insurance based on the expected utility approach, the
certainty equivalent herd growth depends on household discount rates and risk
preferences. For simplicity, we assume no discounting, 1 . We calibrate household-
specific CRRA parameters based on a simple experimental lottery game run among the
households in June-July 2008. Our risk elicitation game follows the simple method used
in Binswanger (1980, 1981); Eckel and Grossman (2002); Barr (2003) and Dave et al.
(2007). Households were first given 100 Ksh for participating. Then we introduced five
lotteries, which vary by risk and expected return. Respondents were invited to use their
100 Ksh to play one of the five lotteries for a real prize, if they wished. If they decided to
pay 100 Ksh to play, they were then asked to choose their most preferred lottery to play.
A fair coin was then tossed to determine their prize. Six categories of risk aversion
associated with six (geometric mean) coefficients of relative risk aversion,{0, 0.1, 0.3,
0.4, 0.7, 1}, were derived based on households’ choices (Chantarat et al. 2009c).
Appendix 4 summarizes the results of this risk preference elicitation experiment. For
17 This is a harmless assumption. In essence, the typical burn rate approach to weather insurance evaluation assumes that one year is statistically independent of another and that the universe of possibilities is contained within the historical timeframe represented by the data. Thus in probability the likelihood of 54 seasons repeating in sequence is the same as any other sequence of 54 non-repeating seasons.
21
each location, we then randomly assign each simulated household with one of the six
CRRA parameters based on the observed wealth strata specific distributions of CRRA.
6. The Effectiveness of IBLI for Managing Livestock Asset Risk
Figure 6 depicts some key patterns of insured herd dynamics, using Kargi and 1 as
an example. Panels (a) to (e) each reflect the cumulative distributions of uninsured and
insured herd sizes for a single household over a set of 54 simulated seasons.
Panel (a) shows that IBLI does little for pastoralists with a low beginning herd
size (e.g., 5 TLU). IBLI cannot prevent these households from falling into destitution
given how far they are beneath the critical herd growth threshold (~15 TLU). Indeed,
paying an insurance premium each season without offsetting indemnities slightly
accelerates herd collapse.18
Varying patterns of IBLI performance emerge for pastoralists with herd sizes
around the critical herd threshold, i.e., for those whose herd dynamics are very sensitive
to shocks. Panel (b) represents a pastoralist with an initial herd size of 15 TLU
immediately at or slightly below the critical threshold. This pastoralist was hit by large
covariate shocks that so disrupted his asset accumulation that he ended on a de-
cumulating growth path without insurance. But with IBLI imperfectly compensating for
the losses, decumulation was averted, and the result was a stabilized growth trajectory.
Because IBLI changes his herd dynamics by insuring against catastrophic collapse, the
certainty equivalent herd growth associated with IBLI should be relatively high due to the
added effect of the bifurcated herd dynamics in the system.
Panel (c) presents the opposite case, in which a pastoralist with the same initial
herd size of 15 TLU could slowly climb onto the herd growth trajectory during good
vegetative seasons if he did not pay an IBLI premium. If his luck holds, he could escape
the poverty trap without IBLI; the premium payments in this case actually retard
18 Our model assumes away possible indirect benefits of IBLI, such as its potential to crowd in finance for ancillary investment and growth. If IBLI crowds in credit access, it may alter the growth trajectory and the critical herd size threshold, opening up the possibility that IBLI benefits the least well-off pastoralists as well. Our data do not permit credible parameterization of such shifts, so we abstract from them in this analysis.
22
progress. The difference between panels (b) and (c) purely reflect the ex post effects due
to random draws of seasonal condition and reflect the great value of insurance when it
proves to have been needed, and also the adverse effects on those who enjoyed a streak of
good luck.
Panel (d) presents the case of a pastoralist with 20 TLU, who would be vulnerable
to shocks that could knock him onto the decumulation trajectory in the absence of
effective insurance. Indeed, we see that for vulnerable households just above the critical
herd size threshold, well-designed IBLI can effectively move them away from the
poverty trap, substantially lessening the probability of herd size collapse. This is the
population that benefits most, in expectation, from IBLI.
Panel (e) depicts the common pattern of IBLI performance for pastoralists with
large initial herd sizes – e.g., 30 TLU – who face little immediate danger of falling into
destitution. IBLI contracts provide typical insurance, reducing the probability of herd
losses, while seasonal premium payments also reduce the chance of reaching extremely
large herd sizes. This simply reflects the second-order stochastic dominance of the
insured herd sizes relative to the uninsured. The ex ante wealth impacts on IBLI performance shown in Figure 6, however,
holds constant other household- and location-specific characteristics that determine a
household’s basis risk exposure associated with IBLI.19 Holding other things equal,
pastoralists with low (high) beta will tend to over (under) insure their herd losses with
IBLI, and so they end up paying higher (lower) prices for IBLI that offer unnecessary
(insufficient) compensation for their losses, on average. IBLI performance should vary
based on the location-specific distributions of uncovered asset risk and the distributions
of covariate shocks. On average, IBLI performance will be higher among households
with lower dispersion of uncovered risk, i.e., less basis risk. In addition, IBLI
performance is also expected to be higher among households in the locations with a
higher probability of insurable covariate losses, i.e., greater risk exposure covered by
insurance.
19 And so it is possible for some pastoralists with as high as 40 TLU to still be vulnerable to shock, and so can benefit greatly from IBLI in preserving their growth trajectory.

23
We now consider the performance of actuarially fair IBLI contracts conditional
on contract specifications and household characteristics. Table 3 reports the change in
certainty equivalent herd growth rate (also referred to as the positive risk premium
growth rate) associated with IBLI for 15 stylized households (with individual mean
mortality fixed at the location-averaged mean predicted mortality index) in each of the
four locations.20 Various interesting results emerge.
First, we observe that IBLI performance varies with beginning herd sizes,
confirming the patterns shown in Figure 6. IBLI gains are negligible for pastoralists with
the lowest herd sizes (5 TLU) and highest for those with the herd sizes around the critical
herd threshold (e.g., 15-20 TLU). IBLI does not seem well suited for the poorest herders,
whose low endowments leave them trapped by the underlying dynamics of the system,
not by uninsured risk exposure. By contrast, those with marginally viable herd sizes are
especially susceptible to shocks thus insurance is potentially of considerable benefit to
them.
Second, IBLI performance tends to improve as beta increases, holding other
things equal. This implies that over-insuring tends to have far larger adverse impact on
herd dynamics than does underinsuring. Indeed, IBLI typically benefits most those with
beta=1.5 rather than those whose herd sizes tend to move one-for-one with local
averages. Households with greater-than-average risk exposure (e.g., beta>1) find IBLI
especially valuable, despite only-partial coverage from IBLI.
Finally, these simulations suggest that the IBLI contract with a 10% strike level
outperforms other contracts, on average, even though the 10% strike contract is more
costly than the others. The greater protection apparently is worth it given the risk of
falling beneath the critical herd size threshold. This effect is most pronounced for those
with initial herd sizes just above the threshold (at 20 TLU), whose vulnerability to shocks
is best addressed with a low strike insurance contract.
Having observed how variations in household-specific characteristics could affect
individual-level IBLI performance, we now explore how the observed location-specific
distributions of those characteristics affect IBLI performance at a more aggregate scale.
20 For simplicity, Table 3 only reports certainty equivalent results calculated with respect to a CRRA value of 0.7. Results for other degrees of CRRA are similar and are available by request. Location-specific results are available by request.

24
Table 4 first reports the overall performance of actuarially fair IBLI contracts among
2000 simulated pastoralists across the four locations. The 10% strike contract appears to have the highest performance holding other
things equal. On average, actuarially fair IBLI contracts with a 10% strike level result in
a 17% increase in the long-term mean herd size, and a reduction in downside risk of
12%.21 On average, certainty equivalent herd growth increases only modestly with
increasing risk aversion.
In general, effective demand for IBLI (e.g., positive risk premium herd growth
rate) exists in all locations for IBLI contracts with less than a 30% strike, with the highest
demand for the 10% strike contract. But not everyone benefits. Figure 7 presents the
cumulative distributions of the improvement in certainty equivalent growth rates with
respect to three different IBLI contracts in these four locations. At least half the
households benefit from an IBLI contract with a 10% strike (slightly lower proportions
for other strike levels) with the positive risk premium growth rates associated with the
contract ranging up to almost 100%. The distribution of valuations for the 10% contract
clearly dominates that of the other contracts in these locations.
7. Willingness to Pay and Potential Demand for IBLI
The preceding analysis offers a glimpse into prospective demand patterns for IBLI. So
far, we have explored the performance of IBLI contracts sold at actuarially fair premium
rates. But an insurer needs to add a commercial loading. This will change the impact of
IBLI on herd dynamics by changing the premium paid for insurance. We can use this
same simulation model to estimate demand for IBLI by searching for the alt that drives
the risk premium growth rate to zero. In this section, we explore demand for the 10%
strike IBLI contract previously shown to have the greatest expected benefit for most
pastoralists in the region. 21 These two measures are used widely in the mean-variance evaluation approach of agricultural insurance. Downside risk reduction is measured by semi-variance reduction of the insured herd dynamics with IBLI relative to the uninsured herd. Specifically, semi-variance of the insured herd dynamics over a set of
consecutive seasons Tt,..., , denoted by T tIilH 1
~ , relative to some threshold, for example, household’s
long-term mean herd size ilH , can be well written as 2)0,~
()~
( Iilil
IilH HHEMaxHSV
il .

25
We first estimate the maximum willingness to pay (WTP) for IBLI of each
simulated pastoralist by searching for the maximum premium loading )(a according to
(2) that still yields a non-negative risk premium growth rate. The expected maximum
willingness to pay conditional on household initial herd size is then estimated
nonparametrically across 2000 simulated pastoralists. The average herd-conditional WTP
is shown in Figure 8, plotted against the observed herd size distribution.
WTP for IBLI above the actuarially fair rate is only attained at herd sizes of at
least 15 TLU, just around the threshold at which herd dynamics bifurcate. Since most
households’ herds fall below the threshold level, this implies limited potential demand for
even actuarially fairly priced IBLI. Expected WTP increases at an increasing rate for
those with herd sizes between 15-20 TLU and then continues to increase significantly
toward its peak at an average 18% loading at the herd sizes around 40 TLU – just below
the high-level herd size equilibrium – after which there is no statistically significant
change in WTP as herd size increases. The clear implication is that WTP may not be high
enough for a commercially viable IBLI absent subsidies.
Based on these estimated distributions of households’ WTP for IBLI in each
location, we now study potential aggregate demand. Specifically, we construct a district-
level aggregate demand curve for Marsabit District as follows. Assuming that the 2000
simulated households in the four study locations are randomly drawn from the total
population of 27,780 households in 28 locations in Marsabit District,22 we treat each
simulated household as representing approximately 14 households in the District
population. We then order the WTP across the population and plot the premium loadings
(a) against the cumulative herd sizes of the population whose WTP would support
commercial demand at that loading level.
Figure 9 displays the estimated aggregate demand curve for IBLI in Marsabit
District and disaggregates it for each of three herd size groups: (i) the low herd group
(with < 10 TLU) representing the 26% of the population that currently finds itself on a
herd decumulation trajectory into a stockless poverty trap, (ii) vulnerable pastoralists
(with 10-30 TLU) representing the 47% of the population who risk collapsing into the
22 Per the Administrative Census of Marsabit district (1999) produced by Kenya National Bureau of Statistics and International Livestock Research Institute.
26
poverty trap with the next uninsured shock to their herd size, and (iii) the better off
pastoralists (with > 30 TLU) who represent the 27% of population that control most of
the District’s livestock herd and who, in the absence of an unusually severe shock or
series of such shocks, should be securely on a growth path. Aggregate demand for IBLI seems very price elastic with reduction in quantity
demanded by 55% as the fair premium rate is loaded by 20%, and a further 26%
reduction with an additional 20% premium loading. If the commercially viable IBLI
contract rate is set at a 20% loading, these highly elastic aggregate demand patterns show
potential aggregate demand of approximately 210,000 TLU in Marsabit District alone.
These patterns highlight several points. First, large herd owners will be the key drivers of
a commercially sustainable IBLI product. Second, the apparent price elasticity of demand
in these locations implies that a small premium reduction (e.g., through subsidization)
can potentially induce large increases in quantity demanded. For example, as Figure 9
shows, a decrease in premium loading from 40% to 20% could potentially induce more
than a doubling of aggregate demand. Third, while IBLI appears most valuable for the
most vulnerable pastoralists (those with herd sizes around 10-30 TLU) as it could protect
their herd dynamics from catastrophic shock, most of their WTP lies well below the
commercially loaded IBLI premium (i.e., at least a 20% loading). This, as we showed in
Figure 6 panel (c), is due to the possibility that high premium payments will impede herd
accumulation across the herd growth threshold.
Premium subsidization may therefore be important if it is socially desirable to
stimulate IBLI uptake among vulnerable populations. Might IBLI subsidies provide a
cost-effective and productive safety net in broader social protection programs sponsored
by governments or donors? That is the final question we explore using these simulation
models.
8. Enhancing Productive Safety Nets Using IBLI
In order to investigate whether IBLI subsidies might effectively provide a productive
safety net for pastoralists in northern Kenya, we first explore herd and poverty dynamic
outcomes (using an asset poverty line of 10 TLU) of these 2000 simulated pastoralists
27
under four different scenarios: (i) without insurance, (ii) with commercially loaded IBLI
(assuming a 20% premium), (iii) with an optimally targeted premium subsidization
scheme that maximizes asset poverty reduction outcomes, and (iv) with comparable,
needs-based subsidization targeted to the poorest households with less than 20 TLU.
The targeted premium subsidization scheme is optimized by searching for the
combination of subsidized premium rates targeted to different herd groups – (a) the
poorest (<10 TLU), (b) the non-poor likely to fall into poverty in the longer run (10-20
TLU), (c) the vulnerable non-poor (20-30 TLU), (d) the secure pastoralists (30-50 TLU)
and (e) the large-scale pastoralists with >50 TLU – that yields the lowest poverty
outcomes. The results (details available by request) imply that the optimal premium
subsidization scheme would provide IBLI free to group (b) and at the actuarially fair
premium rate for the vulnerable non-poor groups (c) and (d), with no subsidization to
groups (a) and (e). We compare this with two needs-based schemes: subsidized to the fair
rate %)0( a and free provision targeted to the less well off pastoralists with herd sizes
less than 20 TLU.
In each of these scenarios, the simulated household herd at the end of each season
reflects the household’s optimal insurance choice – i.e., insure if (induced) WTP exceeds
the (subsidized) premium rate, do not insure otherwise. Therefore, the herd outcomes for
the case of strictly commercial IBLI, for example, largely represent the outcomes of the
insured herds of the well off pastoralists who demand WTP even at commercial rates and
the uninsured herds of the rest of the population. Figure 10 depicts these herd dynamic
outcomes in the form of mean household herd size and asset poverty (<10 TLU)
headcount measures estimated from the 2000 simulated household over the 54 seasons of
available NDVI data, 1982-2008.
The commercially loaded IBLI without subsidization, which only attracts a
majority of the well-off pastoralists, has very limited effect on poverty. Average herd
sizes under this scenario closely track the no-insurance case, with only modest increases
largely among insured, well-off pastoralists partially protected from shocks by IBLI.
By contrast, under the optimal subsidy scheme, mean herd sizes increase more
than 80%, relative to the no insurance case, over the course of a quarter century.
Likewise, the asset poverty headcount decreases slightly over time and stabilizes at a

28
level about 10% lower than without insurance. Subsidized IBLI protects many targeted
pastoralists herds against collapse beneath the critical growth threshold.
The most distributionally progressive, strictly need-based schemes achieve less
than half of these optimal outcomes. While they follow similar (herd size increasing and
poverty decreasing) patterns, we still observe increasing poverty headcounts even with
free IBLI for the poorest. This simply reflects the fact that IBLI provides little benefit for
pastoralists with low herd sizes or with high basis risk exposure. Perhaps counter-
intuitively, allocating scarce resources to subsidize the vulnerable non-poor may do more
to keep long-term poverty headcount rates down than allocating the same resources to the
poorest.
In this simple simulation, the average cost of the optimal targeted subsidization
scheme, which reaches 20%-50% of the population over 54 historical seasons, is roughly
$50 per beneficiary per six-month season.23 This implies a $20 per capita cost per one
percent reduction in the poverty headcount rate, in contrast to $38 for the needs-based
scheme. An effective safety net can be both cheaper and more effective in stemming
long-run poverty than traditional transfer programs (Barrett et al. 2008).
9. Conclusions
Covariate livestock mortality is a key source of vulnerability among east African
pastoralists and often drives households into extreme persistent poverty. In the presence
of poverty traps resulting from well-documented nonlinear herd growth dynamics in the
region, effective risk management becomes potentially important as a means of reducing
long-term poverty rates. This paper offers novel dynamic estimates of the welfare effects
of a new index-based livestock insurance (IBLI) product developed to address precisely
this problem; IBLI is scheduled for pilot sales in early 2010 in northern Kenya.
Our analysis adds to the current literature because of our focus on asset risk –
rather than income risk – and the existence of bifurcated asset dynamics in the northern
Kenyan pastoral system. These two characteristics require important innovations in ex
23 One TLU is valued at 12,000 Ksh, approximately $160 based on October 2009 exchange rates (75.05Ksh/US$).

29
ante impact assessment of insurance. We develop a dynamic simulation model and a
modified expected utility-based evaluation criterion in order to take into account the
potential dynamic impact of IBLI. We use household-level parameter estimates
including household-specific risk preferences elicited from field experiments as well as
basis risk parameters estimated from panel data from the region to explore a) key
patterns of variation in IBLI performance, b) patterns of willingness to pay, and c) the
aggregate demand for IBLI.
We find that household initial herd size – i.e., ex ante wealth – is the key
determinant of IBLI performance, more so than household risk preferences or basis risk
exposure. IBLI works least well for the poorest, whose meager endowments effectively
condemn them to herd collapse given prevailing herd dynamics. By contrast, IBLI is
most valuable for the vulnerable non-poor, for whom insurance can stem collapses onto a
trajectory of herd decumulation following predictable shocks.
We find that a 10% strike contract consistently outperforms higher strike level
contracts. District-level aggregate demand appears highly price elastic with potentially
limited demand for contracts with commercially viable premium loadings. Because
willingness to pay is especially price sensitive among the most vulnerable pastoralists
(i.e. those not currently caught in a poverty trap, but on the verge of falling into one) for
whom the product is potentially most beneficial, subsidization of asset insurance as a
safety net intervention may prove worthwhile. Simple simulations find that relatively
inexpensive, partial subsidization targeted to households with herd sizes in specific
ranges can significantly increase average wealth and decrease poverty, at a rate of just
$20 per capita per one percent reduction in the poverty headcount rate.

30
References
Barr, A. 2003. “Risk Pooling, Commitment, and Information: An experimental test of two fundamental assumptions.” Center for the Study of African Economics, Oxford University, WPS2003/05.
Barnett, B.J., C.B. Barrett, and J.R. Skees. 2008. “Poverty Traps and Index-Based Risk Transfer Products.” World Development 36(10): 1766-1785.
Barnett, B.J. and O. Mahul. 2007. “Weather Index Insurance for Agriculture and Rural Areas in Lower Income Countries.” American Journal of Agricultural Economics 89(5): 1241-1247.
Barrett, C.B., M.R. Carter and M. Ikegami. 2008. “Poverty Traps and Social Protection,” Working paper, Cornell University.
Barrett, C.B., S. Chantarat, G. Gebru, J.G. McPeak, A.G. Mude, J. Vanderpuye-Orgle and A.T. Yirbecho. 2008. “Codebook for Data Collected under the Improving Pastoral Risk Management on East Africa Rangelands (PARIMA) Project.” Unpublished, Cornell University.
Barrett, C.B., P.P. Marenya, J.G. McPeak, B. Minten, F.M. Murithi, W. Oluoch-Kosura, F. Place, J.C. Randrianarisoa, J. Rasambainarivo and J. Wangila. 2006. “Welfare Dynamics in Rural Kenya and Madagascar.” Journal of Development Studies 42(2):248-277.
Binswanger, H. 1980. “Attitudes toward risk: Experimental Measurement in Rural India.” American Journal of Agricultural Economics 62: 395-407.
Binswanger, H. 1981. “Attitudes toward risk: Theoretical Implications of an Experiment in Rural India.” Economic Journal 91: 867-890.
Breustedt, G., R. Bokusheva and O. Heidelbach. 2008. “Evaluating the Potential of Index Insurance Schemes to Reduce Crop Yield Risk in an Arid Region” Agricultural Economics 59(2).
Carter, M.R., F. Galarza and S. Boucher, 2007. “Underwriting Area-based Yield Insurance to Crowd-in Credit Supply and Demand” Savings and Development 31(3):335-362.
Chantarat, S., A.G. Mude, C.B. Barrett and M.R. Carter. 2009a. “Designing Index Based Livestock Insurance for Managing Asset Risk in Northern Kenya.” Working Paper, Cornell University.
Chantarat, S., A.G. Mude and C.B. Barrett. 2009c. “Willingness to Pay for Index Based Livestock Insurance: Results from A Field Experiment in Northern Kenya.” Working Paper, Cornell University.

31
Dave, C., C. Eckel, C. Johnson and C. Rojas. 2007. “Eliciting Risk Preferences: When is Simple Better?” Working Paper, University of Texas.
Deng, X., B.J. Barnett, D.V. Vedenov and J.W. West. 2007. “ Hedging Dairy Production Losses Using Weather-based Index Insurance” Agricultural Economics , 36(2):271-280.
Eckel, C.C., and P.J. Grossman. 2003. “Forecasting risk attitudes: An experimental study of actual and forecast risk attitudes of women and men.” Working Paper. Virginia Tech.
Fishburn, P.C. 1977. “Mean-Risk Analysis with Risk Associated with Below Target Returns.” American Economic Review 67(2):116–126.
Food and Agriculture Organization of the United Nations (FAO). 1992. “Meat and Meat Products in Human Nutrition in Developing Countries.” Food and Nutrition Paper 53. FAO, Rome.
Little, P.D., J.G. McPeak, J., C.B. Barrett, and P. Kristjanson. 2008. “Challenging Orthodoxies: Understanding Poverty in Pastoral Areas of East Africa,” Development and Change 39(4): 587-611.
Lybbert, T.J. and C.B. Barrett. Forthcoming. “Risk Taking Behavior in the Presence of Nonconvex Asset Dynamics.” Economic Inquiry.
Mahul, O. 1999. “Optimum Area Yield Crop Insurance.” American Journal of Agricultural Economics 81: 75-82
McPeak, J.G. 2004. “Contrasting Income Shocks with Asset Shocks: Livestock Sales in Northern Kenya.” Oxford Economic Papers 56: 263-284.
Miranda, M. J. 1991. “Area-Yield Crop Insurance Reconsidered.” American Journal of Agricultural. Economics 73:233-254
Sandford, S. (2006) ‘Too Many People, Too Few Livestock: The Crisis Affecting Pastoralists in the Greater Horn of Africa’. Future Agricultures Consortium debate. Brighton: Institute of Development Studies, University of Sussex.
Santos, P. and C.B. Barrett. 2007. “Heterogeneous Wealth Dynamics: On the Roles of Risk and Ability.” Working paper, Cornell University.
Skees, J.R., S. Gober, P. Varangis, R. Lester, V. Kalavakonda, and K. Kumako. 2001. “Developing rainfall-based index insurance in Morocco.” World Bank Policy Research Working Paper.
Turvey, C.G. and G. Nayak. 2003. “The semivariance-minimizing hedge ratio.” Journal of Agricultural and Resource Economics 28: 100-11
Vedenov, D. V., B.J. Barnett. 2004. “Efficiency of weather derivatives for agricultural risk management.” Journal of Agricultural and Resource Economics 29: 387–403.

32
Location
Mean S.D. P(M>10%) P(M>20%) 10% 15% 20% 25% 30%
Dirib Gombo 8% 8% 28% 9% 2.5% 1.3% 0.6% 0.3% 0.1%Logologo 9% 8% 34% 15% 3.4% 1.8% 0.7% 0.1% 0.1%Kargi 9% 9% 38% 11% 3.3% 1.6% 0.9% 0.4% 0.2%North Horr 9% 11% 34% 21% 4.3% 2.8% 1.5% 0.7% 0.3%
Contract StrikeFair Premium Rate (% Herd Value) Predicted Mortality Index
(M) (%)
Variables/Location
Mean S.D. Mean S.D. Mean S.D. Mean S.D. Mean S.D.ClimateAnnual Rainfall (mm) 290 185 366 173 297 137 270 115 227 86Livestock per household, composition and seasonal lossLivestock in 2008 (TLU) 15 18 2 4 16 22 17 10 25 19Camel (%) 6% 8% 0% 4% 3% 9% 10% 5% 9% 8%Cattle (%) 14% 22% 28% 34% 26% 18% 2% 3% 2% 3%Small stock (%) 80% 21% 72% 34% 71% 19% 88% 6% 89% 9%Migration (%) 71% 38% 6% 21% 87% 21% 88% 16% 88% 17%Seasonal livestock loss (%) 9% 15% 3% 8% 15% 22% 5% 6% 11% 15%Income per capitaIncome/day/capita (KSh) 35 89 8 18 32 31 18 28 78 163Livestock share (%) 59% 40% 18% 31% 61% 35% 87% 24% 67% 34%Poverty IncedenceHeadcount (1$/day) 90% 99% 85% 97% 79%Headcount (10 TLU) 49% 97% 52% 30% 18%Statististics from 2000-2002 data (with catastrophic drought in 2000)Livestock in 2000 (TLU) 25 28 14 10 19 16 40 45 26 16Seasonal livestock loss (%) 13% 21% 21% 29% 15% 19% 11% 12% 7% 10%
Kargi North HorrDirib GomboOverall Location-Specific
Logologo
Table 1: Descriptive Statistics, 2007-2008
Note: % Migration represents the percentage of the household herd that moves at least once over the year. 1 TLU is worth approximately 12,000 KSh, equivalent to roughly US$160 based on October 2009 exchange rates (75.05Ksh/US$). Income is calculated from the sum of market value of milk and meat production, crop production, livestock trading, business, salary earnings, casual labor wage and other petty trading.
Table 2: Summary of IBLI Contracts (from Chantarat et al. 2009a)

33
StrikeBeta 0.5 1.0 1.5 0.5 1.0 1.5 0.5 1.0 1.5
Beginning Herd 5 0% 0% 0% 0% 0% 0% 0% 0% 0%10 -8% 4% 11% -1% 7% 9% -3% -1% 0%15 18% 24% 40% 8% 14% 23% -1% 1% 5%20 9% 29% 37% 8% 18% 21% 0% 2% 3%30 2% 15% 29% 2% 11% 17% -1% 0% 3%
10% 20% 30%
Stat. Beta Beginning L-T Mean Strike Increase DecreaseHerd Herd L-T Mean SV(mean)
(TLU) (TLU) Herd (%) (%) 0.9 0.7 0.4 0.1 Simulated
Mean 0.8 16 33 10 17.4% 11.7% 6.4% 6.3% 6.0% 5.7% 6.1%Median 0.7 14 31 20 6.7% 7.8% 2.7% 2.5% 2.3% 2.1% 2.5%
S.D. 0.5 28 30 30 0.2% 0.3% -0.3% -0.4% -0.5% -0.6% -0.4%
CRRA
Without IBLI With IBLIIncrease in CER Growth Rate (%)
Table 3: Change in Certainty Equivalent Growth Rate, by Household Parameter
Note: The cell content reflects the certainty equivalent growth rate of the insured herd dynamics minus that of the uninsured herd dynamics in percentage terms.
Table 4: Simulated IBLI Performance, Four Locations

34
Survey Sites in Marsabit, Northern KenyaSurvey Sites in Marsabit, Northern KenyaSurvey Sites in Marsabit, Northern Kenya
Chalbi
Laisamis
Survey Sites in Marsabit, Northern KenyaSurvey Sites in Marsabit, Northern KenyaSurvey Sites in Marsabit, Northern Kenya
Chalbi
Laisamis
Chalbi
Laisamis
Figure 1: Study Areas in Northern Kenya
35
0%
10%
20%
30%
40%
Pro
bab
ility
Den
sity
-40%
-20%
0%
20%
40%N
et H
erd
Gro
wth
0 20 40 60 80 100Beginning Herd (TLU) per Household
95% CI Net Herd Growth
Density o f Beginn ing Herd
kernel = epanechnikov, degree = 0, bandwidth = 3.53, pwidth = 5.29
Estimated Non-linear Net Herd Growth (%)
0%
10%
20%
30%
40%
Pro
bab
ility
Den
sity
-40%
-20%
0%
20%
40%N
et H
erd
Gro
wth
0 20 40 60 80 100Beginning Herd (TLU) per Household
95% CI Net Herd Growth
Density o f Beginn ing Herd
kernel = epanechnikov, degree = 0, bandwidth = 3.53, pwidth = 5.29
Estimated Non-linear Net Herd Growth (%)
0%
10%
20%
30%
40%
Pro
bab
ility
Den
sity
-40%
-20%
0%
20%
40%N
et H
erd
Gro
wth
0 20 40 60 80 100Beginning Herd (TLU) per Household
95% CI Net Herd Growth
Density o f Beginn ing Herd
kernel = epanechnikov, degree = 0, bandwidth = 3.53, pwidth = 5.29
Estimated Non-linear Net Herd Growth (%)
Figure 2: Nonparametric Estimation of Expected Net Herd Growth Rate
Figure 3: Estimated Household-Specific Beta and Non-Drought-Related Mortality
Rate, Random Coefficient Model (2000-2002)
0%
5%
10%
15%
20%
25%
Pro
babi
lity
-0.4 -0.2 0 0.2 0.4
Unpredicted Component of Household's Mortality Losses (%)
0%
5%
10%
15%
20%
25%
Pro
bab
ility
-.5 0 .5 1 1.5 2
Household Beta
0%
5%
10%
15%
20%
25%
Pro
babi
lity
-0.4 -0.2 0 0.2 0.4
Unpredicted Component of Household's Mortality Losses (%)
0%
5%
10%
15%
20%
25%
Pro
bab
ility
-.5 0 .5 1 1.5 2
Household Beta

36
02
04
06
08
01
00
Her
d (T
LU
/Ho
use
hold
) at t
+10
se
ason
s
0 20 40 60 80 100Herd (TLU/Household) at t
95% CI Kernel smooth
kernel = epanechnikov, degree = 0, bandwidth = 4.31, pwidth = 6.47
Simulated Bifurcated Herd Dynamics
02
04
06
08
01
00
Her
d (T
LU
/Ho
use
hold
) at t
+10
se
ason
s
0 20 40 60 80 100Herd (TLU/Household) at t
95% CI Kernel smooth
kernel = epanechnikov, degree = 0, bandwidth = 4.31, pwidth = 6.47
Simulated Bifurcated Herd Dynamics
02
04
06
08
01
00
Her
d (T
LU
/Ho
use
hold
) at t
+10
se
ason
s
0 20 40 60 80 100Herd (TLU/Household) at t
95% CI Kernel smooth
kernel = epanechnikov, degree = 0, bandwidth = 4.31, pwidth = 6.47
Simulated Bifurcated Herd Dynamics
Figure 4: Cumulative Distributions of Simulated Herds by Key Years
Figure 5: Simulated Herd Accumulation Dynamics, 1982-2008
0%
20%
40%
60%
80%
100%C
um
ula
tive
Pro
babi
lity
0 50 100 150 200 250
Herd (TLU)
1982 1990
2000 2008

37
0.2
.4.6
.81
Cum
ulat
ive
Pro
babi
lity
0 20 40 60 80TLU (Beginning Herd = 15 TLU, Beta = 1)
No Insurance 10% IBLI15% IBLI
(b) IBLI Preserves Growth Trajectory for Herd Size Around Critical Threshold
0.2
.4.6
.81
Cu
mul
ativ
e P
roba
bilit
y
0 20 40 60 80Herd (TLU)
No Insurance 10% IBLI15% IBLI
Kargi ( Beginning herd = 20 TLU, Beta = 1)
TLU (Beginning Herd = 20 TLU, Beta = 1)
20 40 60 80
IBLI Eliminates Probability of Falling into Destitution for Herd Around Critical Threshold0
.2.4
.6.8
1C
um
ulat
ive
Pro
babi
lity
0 20 40 60 80Herd (TLU)
No Insurance 10% IBLI15% IBLI
Kargi ( Beginning herd = 20 TLU, Beta = 1)
TLU (Beginning Herd = 20 TLU, Beta = 1)TLU (Beginning Herd = 20 TLU, Beta = 1)
20 40 60 80
IBLI Eliminates Probability of Falling into Destitution for Herd Around Critical Threshold(d) IBLI Protects Vulnerable Herd from Falling into Destitution
TLU (Beginning Herd = 20 TLU, Beta = 1)
0.2
.4.6
.81
Cum
ulat
ive
Pro
babi
lity
0 2345 20 40 60 801
TLU (Beginning Herd = 5 TLU, Beta = 1)
No Insurance 10% IBLI15% IBLI
(a) Minimal IBLI Performance for Very Small Herd
0.2
.4.6
.81
Cum
ulat
ive
Pro
babi
lity
0 20 40 60 80
TLU (Beginning Herd = 15 TLU, Beta = 1)
No Insurance 10% IBLI
15% IBLI
(c) IBLI Reverts Growth Trajectory for Herd Size Around Critical Threshold0
.2.4
.6.8
1C
umul
ativ
e P
roba
bilit
y
0 20 40 60 80TLU (Beginning Herd = 15 TLU, Beta = 1)
No Insurance 10% IBLI15% IBLI
(b) IBLI Preserves Growth Trajectory for Herd Size Around Critical Threshold
0.2
.4.6
.81
Cum
ulat
ive
Pro
babi
lity
0 20 40 60 80TLU (Beginning Herd = 15 TLU, Beta = 1)
No Insurance 10% IBLI15% IBLI
(b) IBLI Preserves Growth Trajectory for Herd Size Around Critical Threshold
0.2
.4.6
.81
Cum
ulat
ive
Pro
babi
lity
0 20 40 60 80TLU (Beginning Herd = 15 TLU, Beta = 1)
No Insurance 10% IBLI15% IBLI
(b) IBLI Preserves Growth Trajectory for Herd Size Around Critical Threshold
0.2
.4.6
.81
Cum
ulat
ive
Pro
babi
lity
0 20 40 60 80TLU (Beginning Herd = 15 TLU, Beta = 1)
No Insurance 10% IBLI15% IBLI
(b) IBLI Preserves Growth Trajectory for Herd Size Around Critical Threshold
0.2
.4.6
.81
Cu
mul
ativ
e P
roba
bilit
y
0 20 40 60 80Herd (TLU)
No Insurance 10% IBLI15% IBLI
Kargi ( Beginning herd = 20 TLU, Beta = 1)
TLU (Beginning Herd = 20 TLU, Beta = 1)
20 40 60 80
IBLI Eliminates Probability of Falling into Destitution for Herd Around Critical Threshold0
.2.4
.6.8
1C
um
ulat
ive
Pro
babi
lity
0 20 40 60 80Herd (TLU)
No Insurance 10% IBLI15% IBLI
Kargi ( Beginning herd = 20 TLU, Beta = 1)
TLU (Beginning Herd = 20 TLU, Beta = 1)TLU (Beginning Herd = 20 TLU, Beta = 1)
20 40 60 80
IBLI Eliminates Probability of Falling into Destitution for Herd Around Critical Threshold(d) IBLI Protects Vulnerable Herd from Falling into Destitution
TLU (Beginning Herd = 20 TLU, Beta = 1)
0.2
.4.6
.81
Cum
ulat
ive
Pro
babi
lity
0 2345 20 40 60 801
TLU (Beginning Herd = 5 TLU, Beta = 1)
No Insurance 10% IBLI15% IBLI
(a) Minimal IBLI Performance for Very Small Herd
0.2
.4.6
.81
Cum
ulat
ive
Pro
babi
lity
0 2345 20 40 60 801
TLU (Beginning Herd = 5 TLU, Beta = 1)
No Insurance 10% IBLI15% IBLI
(a) Minimal IBLI Performance for Very Small Herd
0.2
.4.6
.81
Cum
ulat
ive
Pro
babi
lity
0 2345 20 40 60 801
TLU (Beginning Herd = 5 TLU, Beta = 1)
0.2
.4.6
.81
Cum
ulat
ive
Pro
babi
lity
0 2345 20 40 60 801
TLU (Beginning Herd = 5 TLU, Beta = 1)
No Insurance 10% IBLI15% IBLI
(a) Minimal IBLI Performance for Very Small Herd
0.2
.4.6
.81
Cum
ulat
ive
Pro
babi
lity
0 20 40 60 80
TLU (Beginning Herd = 15 TLU, Beta = 1)
No Insurance 10% IBLI
15% IBLI
(c) IBLI Reverts Growth Trajectory for Herd Size Around Critical Threshold
0.2
.4.6
.81
Cum
ulat
ive
Pro
babi
lity
0 20 40 60 80
TLU (Beginning Herd = 15 TLU, Beta = 1)
No Insurance 10% IBLI
15% IBLI
(c) IBLI Reverts Growth Trajectory for Herd Size Around Critical Threshold
0.2
.4.6
.81
Cu
mul
ativ
e P
roba
bilit
y
20 30 40 50 60 700 10 80Herd (TLU)
No Insurance 10% IBLI15% IBLI
Kargi (Beginning Herd = 30 TLU, Beta = 1) IBLI Reduces Probability of Extreme Herd Loss for Very Large Herd
0
0 20 40 60 80Herd (TLU)
TLU (Beginning Herd = 20 TLU, Beta = 1)
20 40 60 80
0
0 20 40 60 80Herd (TLU)
TLU (Beginning Herd = 20 TLU, Beta = 1)TLU (Beginning Herd = 20 TLU, Beta = 1)
20 40 60 80
TLU (Beginning Herd = 30 TLU, Beta = 1)
0.2
.4.6
.81
Cu
mul
ativ
e P
roba
bilit
y
20 30 40 50 60 700 10 80Herd (TLU)
No Insurance 10% IBLI15% IBLI
Kargi (Beginning Herd = 30 TLU, Beta = 1) IBLI Reduces Probability of Extreme Herd Loss for Very Large Herd
0
0 20 40 60 80Herd (TLU)
TLU (Beginning Herd = 20 TLU, Beta = 1)
20 40 60 80
0
0 20 40 60 80Herd (TLU)
TLU (Beginning Herd = 20 TLU, Beta = 1)TLU (Beginning Herd = 20 TLU, Beta = 1)
20 40 60 80
TLU (Beginning Herd = 30 TLU, Beta = 1)TLU (Beginning Herd = 30 TLU, Beta = 1)
(e) Second-order Stochastic Dominance with IBLI for Large Herd
TLU (Beginning Herd = 30 TLU, Beta = 1)
0.2
.4.6
.81
Cu
mul
ativ
e P
roba
bilit
y
20 30 40 50 60 700 10 80Herd (TLU)
No Insurance 10% IBLI15% IBLI
Kargi (Beginning Herd = 30 TLU, Beta = 1) IBLI Reduces Probability of Extreme Herd Loss for Very Large Herd
0
0 20 40 60 80Herd (TLU)
TLU (Beginning Herd = 20 TLU, Beta = 1)
20 40 60 80
0
0 20 40 60 80Herd (TLU)
TLU (Beginning Herd = 20 TLU, Beta = 1)TLU (Beginning Herd = 20 TLU, Beta = 1)
20 40 60 80
TLU (Beginning Herd = 30 TLU, Beta = 1)TLU (Beginning Herd = 30 TLU, Beta = 1)
(e) Second-order Stochastic Dominance with IBLI for Large Herd
TLU (Beginning Herd = 30 TLU, Beta = 1)
Figure 6: IBLI Performance Conditional on Beginning Herd Size
(Simulations for Kargi, based on 54 seasons)

38
0.2
.4.6
.81
Cum
ulat
ive
Pro
bab
ility
0 1-0.5 0.50.25 0.75-0.25
Certainty Equivalent Growth Rate with IBLI (%) - Certainty Equivalent Growth Rate without IBLI (%)
10% IBLI20% IBLI30% IBLI
2000 Households in 4 Locations
0.2
.4.6
.81
Cum
ulat
ive
Pro
bab
ility
0 1-0.5 0.50.25 0.75-0.25
Certainty Equivalent Growth Rate with IBLI (%) - Certainty Equivalent Growth Rate without IBLI (%)
10% IBLI20% IBLI30% IBLI
2000 Households in 4 Locations
Fair premium rate
0%
10%
20%
30%
Pro
bab
ility
Den
sity
100
-25%
-50%
0%
25%
50%
75%
WT
P in
term
of p
rem
ium
loa
ding
(a)
0 20 6040 80 120100
Herd size (TLU)
WTP Density of herd sizekernel = epanechnikov, degree = 0, bandwidth = 4.08
Willingness to Pay for One-Season IBLI
Fair premium rate
0%
10%
20%
30%
Pro
bab
ility
Den
sity
100
-25%
-50%
0%
25%
50%
75%
WT
P in
term
of p
rem
ium
loa
ding
(a)
0 20 6040 80 120100
Herd size (TLU)
WTP Density of herd sizekernel = epanechnikov, degree = 0, bandwidth = 4.08
Willingness to Pay for One-Season IBLI
Fair premium rate
0%
10%
20%
30%
Pro
bab
ility
Den
sity
100
-25%
-50%
0%
25%
50%
75%
WT
P in
term
of p
rem
ium
loa
ding
(a)
0 20 6040 80 120100
Herd size (TLU)
WTP Density of herd sizekernel = epanechnikov, degree = 0, bandwidth = 4.08
Willingness to Pay for One-Season IBLI
Figure 7: Cumulative Distributions of Change in Certainty Equivalent Growth Rate
Figure 8: Willingness to Pay for IBLI by Initial Herd Size

39
Fair premium rate0%
20%
40%
60%
80%P
rem
ium
Loa
ding
(a)
0 100 200 300 400 500
Herd (Thousand TLU)
Aggregate Less than 10 TLU
Between 10-30 TLU Greater than 30 TLU
Figure 9: Estimated District-level Aggregate Demand for IBLI

40
Figure 10: Dynamic Outcomes of Alternative IBLI Subsidy Schemes 20
3040
5060
TLU
1982 1987 1992 1997 2002 2007
Year
No insurance Commercial IBLI (a=20%)
Optimal targeted subsidization Subsidization (a=0%)
Free provision of IBLI to herd<20 TLU to herd<20 TLU
Mean Household Herd Size
20%
30%
40%
50%
60%
1982 1987 1992 1997 2002 2007
Year
No insurance Commercial IBLI (a=20%)
Optimal targeted subsidization Subsid ization (a=0%)
Free provision of IBLI to herd<20 TLU to herd<20 TLU
Asset Poverty Headcount
2030
4050
60T
LU
1982 1987 1992 1997 2002 2007
Year
No insurance Commercial IBLI (a=20%)
Optimal targeted subsidization Subsidization (a=0%)
Free provision of IBLI to herd<20 TLU to herd<20 TLU
Mean Household Herd Size
20%
30%
40%
50%
60%
1982 1987 1992 1997 2002 2007
Year
No insurance Commercial IBLI (a=20%)
Optimal targeted subsidization Subsid ization (a=0%)
Free provision of IBLI to herd<20 TLU to herd<20 TLU
Asset Poverty Headcount

41
Good-climate seasons
-.2
-.1
0.1
.2.3
.4.5
.6-.
3-.
4(%
)
0 20 40 60 80Beginning herd (TLU) per household
95% CI growth rate
mortality rate
kernel = epanechnikov, degree = 0, bandwidth = 3.16, pwidth = 4.75
Growth rate (growth less slaughter and net sales)
Bad-climate seasons
-.4
-.2
0.2
.4.4.6
(%)
0 20 40 60 80Beginning herd (TLU) per household
95% CI growth rate
mortality rate
kernel = epanechnikov, degree = 0, bandwidth = 2.94, pwidth = 4.41
Growth rate (growth less slaughter and net sales)Good Season Bad Season
Non-mortality componentof growth rate
Non-mortality componentof growth rate
Good-climate seasons
-.2
-.1
0.1
.2.3
.4.5
.6-.
3-.
4(%
)
0 20 40 60 80Beginning herd (TLU) per household
95% CI growth rate
mortality rate
kernel = epanechnikov, degree = 0, bandwidth = 3.16, pwidth = 4.75
Growth rate (growth less slaughter and net sales)
Bad-climate seasons
-.4
-.2
0.2
.4.4.6
(%)
0 20 40 60 80Beginning herd (TLU) per household
95% CI growth rate
mortality rate
kernel = epanechnikov, degree = 0, bandwidth = 2.94, pwidth = 4.41
Growth rate (growth less slaughter and net sales)
Good-climate seasons
-.2
-.1
0.1
.2.3
.4.5
.6-.
3-.
4(%
)
0 20 40 60 80Beginning herd (TLU) per household
95% CI growth rate
mortality rate
kernel = epanechnikov, degree = 0, bandwidth = 3.16, pwidth = 4.75
Growth rate (growth less slaughter and net sales)
Good-climate seasons
-.2
-.1
0.1
.2.3
.4.5
.6-.
3-.
4(%
)
0 20 40 60 80Beginning herd (TLU) per household
95% CI growth rate
mortality rate
kernel = epanechnikov, degree = 0, bandwidth = 3.16, pwidth = 4.75
Growth rate (growth less slaughter and net sales)
Bad-climate seasons
-.4
-.2
0.2
.4.4.6
(%)
0 20 40 60 80Beginning herd (TLU) per household
95% CI growth rate
mortality rate
kernel = epanechnikov, degree = 0, bandwidth = 2.94, pwidth = 4.41
Growth rate (growth less slaughter and net sales)
Bad-climate seasons
-.4
-.2
0.2
.4.4.6
(%)
0 20 40 60 80Beginning herd (TLU) per household
95% CI growth rate
mortality rate
kernel = epanechnikov, degree = 0, bandwidth = 2.94, pwidth = 4.41
Growth rate (growth less slaughter and net sales)Good Season Bad Season
Non-mortality componentof growth rate
Non-mortality componentof growth rate
Appendix 1: Non-mortality Component of Herd Growth Function
Chantarat at al. (2009a) defines good seasons as those with positive cumulative deviation of NDVI observed at the end of the
season and bad seasons as those with non-positive cumulative deviation of NDVI. Below we plot the two nonparametrically
estimated non-mortality growth functions conditional on vegetation conditions, which we use as the basis for the simulations.
The conditional herd mortality rates are also plotted here to illustrate that during the good seasons, more households enjoy
positive net growth rates (i.e., mortality rate below non-mortality growth rate), while those above the critical herd size
threshold of 12-20 animals maintain just slightly above zero growth during the bad seasons. Santos and Barrett (2007) report
similar findings.

42
Regression of individual mortality on predicted mortality index
Location Variable Obs. Variable(Best-fit distn) Mean S.D. Mean S.D. Mean S.D. Mean S.D.
Household-specific βi Household-specific non-drought related loss εilt (%)
Dirib ExtValue(0.7,0.6) 20 1.08 0.66 1.05 0.60 (Based on the model estimations) -0.02 0.20 -0.01 0.18Kargi Logistic(0.7,0.2) 25 0.71 0.39 0.70 0.34 0.00 0.08 0.00 0.08Logologo Normal(1.1,0.4) 27 1.13 0.38 1.13 0.38 0.00 0.11 0.00 0.13North Horr Logistic(0.3,0.1) 22 0.37 0.18 0.36 0.16 0.00 0.08 0.00 0.07
Regression of predicted residual on location averged residual
Location Variable Obs. Variable(Best-fit distn) Mean S.D. Mean S.D. (Best-fit distn) Mean S.D. Mean S.D.
Household-specific βεi Idiosyncratic loss eilt (%)
Dirib ExtValue(0.6,0.7) 20 1.01 0.77 1.02 0.80 LogLogistic(-1,1,17.7) 0.00 0.12 0.00 0.14Kargi Normal(1,0.3) 25 1.00 0.27 1.01 0.26 LogLogistic(-0.3,0.3,6.9) 0.00 0.07 0.00 0.06Logologo Logistic(1,0.1) 27 1.00 0.26 1.00 0.26 LogLogistic(-1.4,1.4,27.1) 0.00 0.10 0.00 0.11North Horr ExtValue(0.9,0.2) 22 1.01 0.32 1.00 0.29 Lognorm(0.4,0.04,RiskShift(-0.4)) 0.00 0.04 0.00 0.04
Other key household characteristics
Location Variable Obs. Variable(Best-fit distn) Mean S.D. Mean S.D. (Best-fit distn) Mean S.D. Mean S.D.
Household-specific long-term mean mortality rate μil (%) Houehold's beginning herd size Hilt (TLU)
Dirib Logistic(0.2,0.1) 20 0.22 0.14 0.23 0.11 Lognorm(30.2,9.6,RiskShift(-15.3) 12 10 12 8Kargi Logistic(0.1,0.02) 25 0.11 0.05 0.11 0.05 InvGauss(37.5,60.8,RiskShift(-4.3) 33 31 34 29Logologo Logistic(0.1,0.04) 27 0.15 0.07 0.15 0.06 InvGauss(19.8,33.7,RiskShift(-2)) 18 15 17 14North Horr Logistic(0.06,0.03) 22 0.07 0.05 0.07 0.05 Normal(29.6,15.1) 26 17 30 15
Estimated Simulated
Estimated SimulatedEstimated Simulated
Estimated Simulated
Estimated Simulated Estimated Simulated
Appendix 2: Summary of Estimated and Simulated Household Characteristics

43
Household-specific mortality rate (%) Milt
LocationMean S.D. Min Max Mean S.D. Min Max
Dirib 0.21 0.29 0.00 1.00 0.19 0.20 0.00 1.00Kargi 0.11 0.12 0.00 0.50 0.11 0.10 0.00 0.95Logologo 0.15 0.19 0.00 0.74 0.14 0.15 0.00 1.00North Horr 0.07 0.10 0.00 0.37 0.07 0.08 0.00 0.54
Household-specific non-mortality growth rate in (%) gilt
LocationMean S.D. Min Max Mean S.D. Min Max
Dirib -0.05 0.12 -0.22 0.14 -0.07 0.14 -0.84 0.38Kargi 0.05 0.07 -0.22 0.22 0.04 0.12 -0.23 0.38Logologo 0.02 0.10 -0.22 0.30 0.01 0.14 -0.23 0.38North Horr 0.07 0.11 -0.22 0.22 0.08 0.07 -0.23 0.38
Household-specific herd size Hils
Location
Mean S.D. Min Max Mean S.D. Mean S.D.Dirib 5 8 0 30 6 10 6 16Kargi 21 39 0 224 20 43 43 38Logologo 15 17 1 64 16 21 14 23North Horr 24 32 0 53 24 33 68 37
Beginning 1982-2008
Simulated (1982-2008)
Simulated
Observed in PARIMA (2000-2002) Simulated (1982-2008)
Estimated (2000-2002, 2007-2008)
Observed (2000-2002, 2007-2008)
Appendix 3: Summary of Baseline Simulation Results
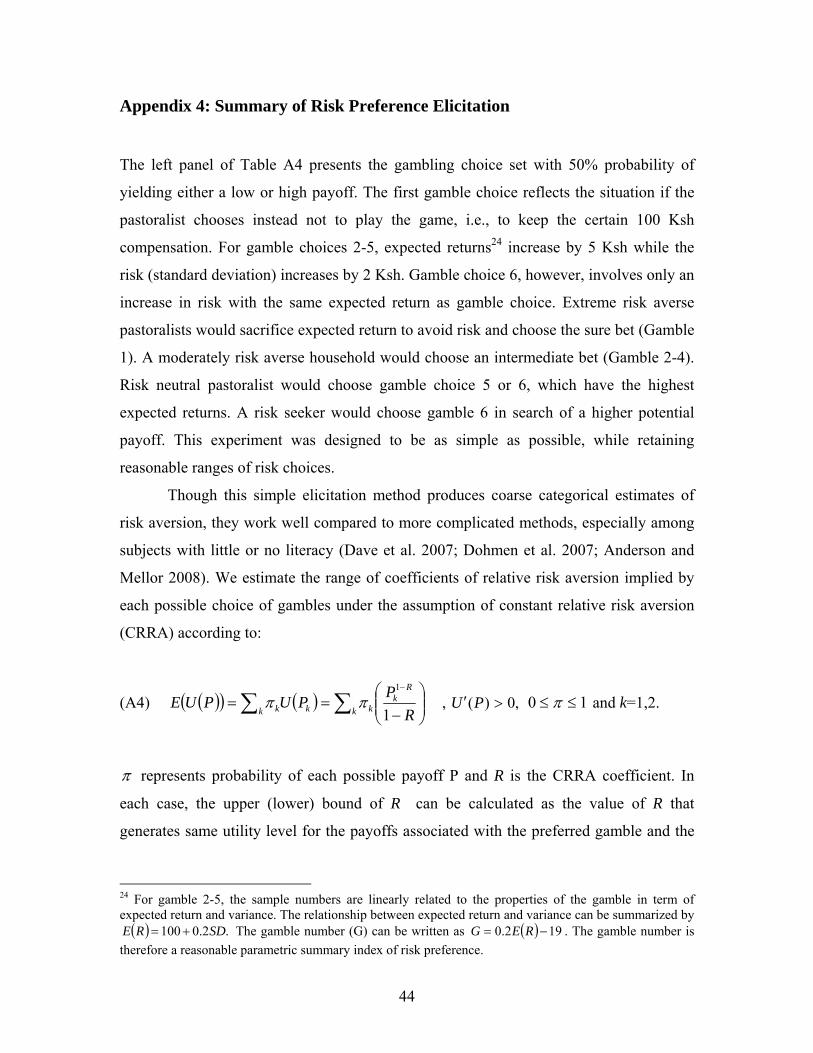
44
Appendix 4: Summary of Risk Preference Elicitation
The left panel of Table A4 presents the gambling choice set with 50% probability of
yielding either a low or high payoff. The first gamble choice reflects the situation if the
pastoralist chooses instead not to play the game, i.e., to keep the certain 100 Ksh
compensation. For gamble choices 2-5, expected returns24 increase by 5 Ksh while the
risk (standard deviation) increases by 2 Ksh. Gamble choice 6, however, involves only an
increase in risk with the same expected return as gamble choice. Extreme risk averse
pastoralists would sacrifice expected return to avoid risk and choose the sure bet (Gamble
1). A moderately risk averse household would choose an intermediate bet (Gamble 2-4).
Risk neutral pastoralist would choose gamble choice 5 or 6, which have the highest
expected returns. A risk seeker would choose gamble 6 in search of a higher potential
payoff. This experiment was designed to be as simple as possible, while retaining
reasonable ranges of risk choices.
Though this simple elicitation method produces coarse categorical estimates of
risk aversion, they work well compared to more complicated methods, especially among
subjects with little or no literacy (Dave et al. 2007; Dohmen et al. 2007; Anderson and
Mellor 2008). We estimate the range of coefficients of relative risk aversion implied by
each possible choice of gambles under the assumption of constant relative risk aversion
(CRRA) according to:
(A4)
k
Rk
kk kk R
PPUPUE
1
1
, ,0)( PU 10 and k=1,2.
represents probability of each possible payoff P and R is the CRRA coefficient. In
each case, the upper (lower) bound of R can be calculated as the value of R that
generates same utility level for the payoffs associated with the preferred gamble and the
24 For gamble 2-5, the sample numbers are linearly related to the properties of the gamble in term of expected return and variance. The relationship between expected return and variance can be summarized by .2.0100 SDRE The gamble number (G) can be written as 192.0 REG . The gamble number is
therefore a reasonable parametric summary index of risk preference.

45
Cumulative Distribution of CRRA
0
0.2
0.4
0.6
0.8
1
1 0.7 0.4 0.3 0.1 0
CRRA coefficient
Cum
ulat
ive
prob
abili
ty
Low
Medium
High
Gamble High Low Expected S.D. CRRA Interval Geometric mean Risk aversion classChoice Payoff Payoff Payoff Payoff CRRA
1 100 100 100 0 R>0.99* 1.0 Extreme2 130 80 105 25 0.55<R<0.99* 0.7 Severe3 160 60 110 50 0.32<R<0.55 0.4 Intermediate4 190 40 115 75 0.21<R<0.32 0.3 Moderate5 220 20 120 100 0<R<0.21 0.1 Low/Neutral6 240 0 120 120 R<0 0.0 Neutral/risk seeking
less (more) risky adjacent. A value of R є (0,1) reflects a risk averse household.25 The
value R = 0 is associated with a risk neutral household, while R <0 indicates a risk seeker.
Following Binswanger (1980), we assign a mean CRRA measures to each of the ranges
using the geometric mean of the two end points.26 In the case of gamble 6, a value of zero
is given to the CRRA measure to represent a class of risk neutral or risk seeker. The value
of one is then assigned to the case of gamble 1 to represent the extremely risk averse
class. We then assign each household to one of the six risk aversion classifications
(extreme, severe, intermediate, moderate, low/neutral and neutral/risk seeker).
Table A4: Summary of Risk Preference Elicitation Set-Up
* Without assumption of 1R , the actual value of R is 1.67.
Below are plots the cumulative distributions of CRRA associated with each of the three livestock wealth strata used in the 2008 survey.
25 In our setting, we truncated R at the maximum value of 1 as we only consider CRRA class utility function that is increasing. Value of R greater than 1 will yield negative value of utility. 26 For the case of gamble 5 with one of the end point at zero, arithmetic mean was chosen in this case.