the perfect storm -
TRANSCRIPT

Oxfam Briefing Paper June 2012
The Perfect Storm:
Economic stagnation, the rising cost of living, public spending cuts, and the impact on UK poverty
www.oxfam.org.uk
Micky works part-time as an administrator for a local charity. He‟s on the minimum wage and
struggles to make ends meet, having a weekly budget for food of £15. Despite his vast experience –
he has run a business and worked in management for a supermarket chain – he cannot find a
permanent job that pays. Photo: Mora McLagan/Oxfam
EMBARGOED UNTIL 00:01 HRS GMT 14th JUNE 2012
The combination in the UK of economic stagnation and public
spending cuts is causing substantial hardship to people living in
poverty. This amounts to a ‘Perfect Storm’ of falling incomes,
rising prices, public service cuts, benefit cuts, a housing crisis,
and weak labour rights. By making different political choices, the
government can both protect people in poverty and help to
stimulate economic recovery in the short term, and set the UK on
the way towards economic, social and environmental sustainability
in the long term.

2
1 Summary
Introduction
The UK is facing a set of serious, interlocking challenges. The economy is stagnating, unemployment is increasing, prices are rising, incomes are falling, and spending on public services is being cut back rapidly.
In this paper, Oxfam has taken its experience of working with partner organisations across the UK and the stories of individuals with whom
those partners work, together with a wider analysis, to outline the
reality of these challenges for people living in poverty.
For the 13.5 million people who currently live in poverty – a fifth of the
population – the combined impact of all these challenges is creating a „Perfect Storm‟ that is pushing already fragile livelihoods to breaking
point.
Background: the reality of poverty in
the UK
The UK is the sixth richest country on earth, yet one in five of its people lives in poverty. Before the financial crisis and the economic recession,
prosperity was not shared. The UK is one of the most unequal rich countries in the world, with the poorest tenth of people receiving only 1
per cent of total income, while the richest tenth take home 31 per cent.
The risk of poverty is not one that is shared equally across society. Twice as many people from ethnic minorities live in poor households
compared with white people; women are more likely than men to live in poverty; and, geographically, there are substantial inequalities both
between and within the regions and nations of the UK.
Poverty in the UK is about material deprivation: for example, more than a fifth of UK households (5.5 million or 22 per cent) are affected by fuel
poverty, and inadequate heating results in thousands of unnecessary deaths each year. But it is also about life and death: premature deaths
caused by health inequalities in England each year lead to the loss of
between 1.3 million and 2.5 million extra years of life. And people living in poverty have to face stigma and prejudice, and a lack of recognition
for the positive, non-financial contributions they make to society.
„We are seeing people on a daily basis who have not got enough money to feed themselves or their children adequately.‟
Feedback from Community Links focus group, 2012
„What worries me, and scares me sometimes, is that there are so many programmes about benefit cheats and scroungers, and the labelling you get because you are someone on benefits.‟
Sandra, Salford

3
The „Perfect Storm‟ and its impact
on poverty
Since the economic crisis of 2008, those already in poverty have seen their poverty deepen, and millions more have become increasingly
vulnerable. A combination of economic stagnation, the rising cost of
living, benefit cuts, falling incomes, rising unemployment, and public service cuts add up to a Perfect Storm for the millions already struggling
to make ends meet.
The Perfect Storm is already affecting partners with whom Oxfam works in the UK, with increased demand on their services, just as the
resources to provide that support are being withdrawn. The coping mechanisms of people living in poverty have included increasing debt,
more people relying on food parcels, and women acting as „shock
absorbers‟, managing budgets and debt and going without in order to ensure that their families have what they need.
Rising unemployment and declining incomes
Average earnings shrank by 4.4 per cent last year. Incomes of the
directors of FTSE 100 companies rose by 49 per cent.
Incomes are decreasing across most of society due to a combination of rising unemployment (particularly youth unemployment), involuntary
part-time working, pay freezes and cuts, and cuts in benefit levels. This is causing the biggest real terms fall in incomes since the mid-1970s.
While real wages are falling for the majority and the National Minimum
Wage has fallen over the past four years, rewards at the top have raced away: last year, earnings of directors and chief executives went up by 15
per cent, and those of directors of FTSE 100 companies soared by 49 per
cent.
Falling incomes and rising inequality are part of a longer-term trend. In
the decade to 2008/09, 40 per cent of total income growth in society went to the richest tenth of people, and a decreasing proportion of gross
domestic product (GDP) has gone to wages. It is predicted that, on
current trends, the UK will rapidly return to levels of inequality not seen since Victorian times.
The increasing cost of living
Food prices have risen by 30.5 per cent in five years. The National
Minimum Wage has risen by 12.1 per cent in the same period.
Prices have risen rapidly, particularly in 2008 and 2011, even as the economy has stagnated. This inflation has been driven by food and fuel
prices, both of which account for a high proportion of the spending of
people living in poverty. In addition, people living in poverty have to pay more than rich people for basic necessities such as gas, electricity,
and banking. This „poverty premium‟ is estimated to cost them an
additional £1,170 a year. Finally, tax rises under the coalition
„Just because people are not screaming, it does not mean that people are not desperate. It does not mean there isn‟t a crisis.‟
Bal Athwal, worker at the Bradford Resource Centre
„I‟ve been unemployed before and it‟s only ever taken three months to find work. Now, I‟ve been looking for full-time work for ten months. It took me a long time to even get any interviews.‟
Christina, Bradford
„I always worry when I make a dish that it might not be enough. And if a friend should appear with my children at dinner time, they‟re always welcome – I give up my plate.‟
Jean, Glasgow

4
government, such as VAT, have been regressive, thus affecting people living in poverty more. The poorest 10 per cent pay twice as much of
their income in VAT as the richest 10 per cent.
The Institute for Fiscal Studies (IFS) has calculated that, between 2008 and 2010, the poorest fifth of households experienced an inflation rate of
4.3 per cent, against 2.7 per cent for the richest fifth. The Joseph Rowntree Foundation estimates that the cost of achieving a Minimum
Income Standard – a minimum standard of living, based on a broad
survey of what members of the public think constitutes the basic requirements of life – has risen by 43 per cent over the past decade,
compared with 27 per cent for general prices.
Public service cuts
Spending cuts hit the poorest tenth of the population 13 times harder
than the richest tenth.
The government plans to achieve the majority of its deficit reduction
programme through public spending cuts. Poorer people rely most on public services, and spending cuts are estimated to hit the poorest tenth
of the UK population 13 times harder than the richest tenth – with
planned reductions to public services being equivalent to more than a fifth of their income being taken away. These cuts mean less health care,
reductions in social care, and the loss of hundreds of smaller services
such as counselling support, care homes, school crossing patrols, and youth clubs.
Cutting public spending has a particularly strong impact on gender equality, with women more likely to be reliant on public services than men. Cuts to the Sure Start programme in England (while the equiva-lent in Wales, Flying Start, is being protected by the Welsh govern-ment), and the thinner spreading of cash support for childcare support under Universal Credit, will particularly affect women.
Public service cuts also have an impact on unemployment. Public sector employment levels are in steep decline, and women form the majority of public sector employees.
Welfare reform and benefit cuts
Seventy-two per cent of the benefit cuts announced in 2010 will be paid
by poor women.
One of the largest contributions to spending cuts has come from reductions in benefits for working-age people, accounting for £18bn per
year by 2014–15. According to the House of Commons Library, 72 per cent of cuts announced in the 2010 Emergency Budget will be met from
women‟s incomes, against 28 per cent from men‟s.
The introduction of Universal Credit will simplify the benefits system, making it easier for people currently on benefits to transition between
unemployment and work. Yet, just as the system is simplified, so eligibility is being tightened for many claimants.
„There are too many cuts in Manchester, and there are too many places closed down, so I don‟t have many places left to go. Since all these cuts have affected me, I‟ve actually relapsed with my mental health.‟
Bridget, Manchester
„[On benefits] you don‟t get enough to live on. £65 or £67 a week, for an adult, is not enough. Sometimes I think, “I am a single person and I struggle, what about families of six kids?”‟
Jo, unemployed, Bradford
5
These changes are increasing the demands on support services, including those of Oxfam partners. They also create severe hardship: the
Trussell Trust food bank network reports that two people out of every
five receiving food parcels do so as a result of benefit changes or delays.
Housing crisis
The number of Housing Benefit claimants in work more than doubled between November 2008 and February 2012.
Before the recession hit, there was an acute housing shortage. There were 1.77 million households in England on social housing waiting lists in 2008, and 489,400 households living in officially overcrowded homes. Government targets for the building of new homes have been missed, with construction slowing to a crawl since the recession.
The cost of housing has continued to rise in spite of the recession in both the private and social rented sectors, with average rents at record highs and homes unaffordable in more than half of English local au-thorities. Newly homeless households increased by 18 per cent in England between 2010 and 2011.
Reforms to social housing are not only increasing rents, but also re-ducing security of tenure. Above-inflation increases in private rents have been compounded by cuts to housing support, even as the need for that help spreads. The number of Housing Benefit claimants in work more than doubled between November 2008 and February 2012, whereas the number of claimants out of work rose by only 9.3 per cent.
The human cost of scarce and expensive housing is stark. Family life is affected, with people forced to delay having children, or to live away
from the support of grandparents, while the cost of housing is forcing millions to cut back on other essential spending, including food and
heating, and pushing many into debt.
Weak labour rights
Since the recession started, 830,000 permanent full-time jobs have been
lost, and half a million new part-time jobs created. The number of
people in temporary work because they cannot find a permanent job has
risen by 73 per cent. The UK has weaker protection for those in work
than Mexico.
For a substantial minority in the UK, work is characterised by insecurity, uncertainty over hours, underpayment, a succession of short-term jobs,
or a combination of these. There are estimated to be two million „vulnerable workers‟ in the UK; decades of deregulation for employers
mean that the UK now has the third lowest level of employment
protection legislation in the OECD – below Greece, Turkey, and Mexico – and the highest number of zero-hours contracts in Europe (contracts in
which a person is required to be on call for work, but has no guaranteed
hours of work and is only paid for the hours they do work); and women are in the most precarious and vulnerable work.
Right now, the loose labour market and the shortage of jobs mean that
„It [the housing benefit cap] fills me with dread and I‟ve tried to move to a flat instead of a house which is about £50 cheaper per month, but no one will touch me because I‟m a [social] housing tenant. So when these changes take place, I will have to end my contract here and probably go homeless – they aren‟t leaving me with any choice.‟
Single mother, London
„My life has not been stable because I cannot find a permanent job. I work whenever it is available. I have to push hard to make sure I have a sensible amount of hours for the week – I have no guaranteed work, it is all ad hoc. The organisation I work for does not commit itself to give me work.‟
Stella, single parent and care worker, lost her permanent job as a housing support worker

6
more power rests with employers, and more people are being forced to turn to insecure work, with few rights – or to waive the rights they do
have – just to survive. The number of „frustrated part-timers‟ – those
who want and need full-time work – is at a record high, which is particularly significant as such work is generally low-paid and less
secure. A very high proportion of jobs created since the first recession
have been part-time, and one in three is a temporary job.
Responding to the Perfect Storm The need for a new approach
The government‟s rapid deficit reduction measures are hitting the
livelihoods of almost everyone in the UK, but the particular approach
taken is hurting people living in poverty the most. The focus on cutting
public spending rather than raising taxes is deeply regressive, and the
blend of tax increases chosen is itself regressive. In addition, both public spending cuts and the tax and benefit changes introduced by this
government will have a significantly more negative impact on women
than on men.
At the same time, we are seeing a synergy of economic and social needs.
Protecting the incomes of the poorest people is crucial for both social and economic reasons. It is people on low incomes who are being hurt
the most by the Perfect Storm, and increasing the incomes of the poorest
will have the strongest multiplier effect on aggregate demand in the economy. By prioritising and targeting social and economic investment,
the government can ensure that it protects the services upon which
those in poverty most rely, while helping to boost demand and provide investment in the long-term productive capacity of the economy.
No return to business as usual
The UK‟s economy and society, as currently constituted, are unsustainable – economically, socially, and environmentally. We need a
people‟s bail-out to protect the millions in poverty and the millions
more who are increasingly vulnerable. But we also need to ensure that there is no return to business as usual.
Protect the incomes of the low-paid
Protecting the incomes of the poorest people is a clear priority, and will help to stimulate demand in the economy. In the long term, action to
reduce pay differentials within businesses, public authorities, and wider society can help to protect the incomes of those at the bottom, as well as
helping to reduce inequality.
To ensure that incomes for those in work are maintained:
Cuts to working tax credits should be reversed;

7
The withdrawal rate for Universal Credit should be reduced
from 65 per cent to 55 per cent, to ensure that the principle that
work should pay is realised in the new system; and
The National Minimum Wage should be increased
automatically at least in line with inflation or average
earnings, whichever is the higher.
Protect people in poverty from the increasing cost of living
To protect people living in poverty from high energy prices, the
government should give the energy regulator, Ofgem, new powers to
cap prices and eliminate excess profits.
To protect people who are forced into debt by high prices, the
government should:
Introduce a maximum level of interest; and
Ensure that access to the Social Fund is maintained for those
on very low incomes, and that its resources are expanded to
meet increased demand.
Reduce public service cuts
In the short term, by changing the ratio of spending cuts to tax increases, the government can protect services by reducing the speed and depth of
cuts. To protect services for the longer term, it can invest in services that
create jobs and increase long-term growth.
As an immediate step, the government should:
Slow the speed and depth of public service cuts by increasing
progressive taxation instead;
In particular, protect Sure Start services by reinstating the
ring-fence to the Sure Start grant to local authorities in
England; and
Explore investing in a national system of universal child care.
Protect the social safety-net
In the short term, the incomes of the poorest people should be protected. In the longer term, overcoming poverty and creating a sustainable
economy will require social protection that provides enough to live on, but which also acts as a springboard towards employment and
progression.
In the short term, the government should protect the level of out-of-work benefits by:
Ensuring that local authorities in England have sufficient
resources to maintain existing levels of Council Tax Benefit,

8
following the examples of the Scottish and Welsh
governments;
Monitoring the effect of the Housing Benefit and overall
benefit caps and reviewing them in light of social impacts; and
Ending stealth cuts to benefits by reversing the switch in
uprating these from the Retail Price Index (RPI) to the
Consumer Price Index (CPI) measure of inflation, to protect
benefit levels for those in or out of work.
To protect the incomes of women both in and out of work, who have
been hit particularly hard by cuts to benefits:
Child Benefit levels for those on low and middle incomes
should be maintained through a reversal of the freeze to 2014; and
Cuts to child-care support should be reversed, to protect both
incomes and work incentives, by restoring support for
child-care costs for low-income families to pre-April 2011
levels and through providing an adequate level of support for
child-care costs in the new Universal Credit system.
Secure, affordable, decent housing for all
There is a clear long-term need for housing, but in the short term there is a need to protect private tenants. Housing is also a very good way of
stimulating the economy. Investment in housing can serve environmental as well as economic ends, for example through
retrofitting existing housing stock.
In the short term, the government should:
Invest in affordable homes to boost the economy and help
solve the housing crisis; and
Consider raising the maximum penalties for offences by
landlords, including increasing the maximum fines to make it
more cost-effective to pursue prosecutions.
Protect rights at work
In the short term, it is crucial that existing labour rights are protected. In
the long term, protecting labour rights is an essential part of ensuring
that decent work becomes the norm in the UK, and that in-work poverty is eradicated.
In the short term, the government should:
Protect access to justice by exempting low-income workers
from employment tribunal fees;
Apply the working practices of the Gangmasters Licensing
Authority to other sectors of the economy, prioritising

9
hospitality, construction, and social care; and
Extend the right to request flexible working to all workers.
A fairer tax system
In the short term, for social and economic reasons, any further tax
increases should be progressive in nature, and future tax cuts should be targeted at people on low incomes. In the long term, a progressive tax
system would help to tackle inequality.
In the short term, to raise money to protect essential services, the government should:
Proactively clamp down on tax avoidance and evasion to
ensure that all tax that is levied is collected;
Introduce a ‘Robin Hood Tax’ on financial transactions of 0.05
per cent, to raise money for services and benefits at home and
to fight poverty overseas; and
Examine options for a land value tax.
The long-term case for a fairer
society
There is a strong relationship in the UK between poverty and inequality. The UK is a rich society, but one in which income, wealth, and
opportunity are unequally distributed.
Inequality harms those who are shut out from wealth and left in
poverty, but there is also substantial evidence that it leads to worse outcomes across society as a whole. Meanwhile, the economic crisis has
to a large extent been caused by unsustainable personal debt and a
bloated financial sector, both of which were driven by inequality. Finally, as a whole, the UK economy is environmentally unsustainable.
The impact of inequality on individuals and society
Inequality has the harshest impacts on those forced to remain at the lower end of the income spectrum, breeding a sense of hopelessness and
status anxiety. More broadly, inequality has negative impacts across
society as a whole, causing lower life expectancy, less social mobility, and poorer health outcomes, and worsening a range of other social
problems. Within rich societies, the way in which resources are
distributed is the key determinant of overall well-being.
The economic case for greater equality
Economic growth over the past three decades has been unequally shared and incomes for low earners have been stagnant, even as
incomes at the top have raced away. With those at the bottom trying to
keep up, personal debt increased by three-and-a-half times between 1981 and 2007, from 45 per cent to 160 per cent of GDP.
„In Britain or Glasgow as a whole, it‟s all slowly eroding. You see wealth creation, and you see wealth, but it never filters down. So you see the very poor getting poorer.‟
Audrey Flannaghan, Trussell Trust food bank manager in Glasgow, Scotland

10
Bridging the widening gap in incomes with borrowing cannot be maintained indefinitely. The World Bank and the IMF have both
recently produced evidence showing that reducing income inequality is
likely to be important in reducing the likelihood of future crises.
Inequality is also bad for growth and, according to the IMF, reduces the
length of growth spells. For example, closing half of the inequality gap between Latin America and emerging Asian economies would more
than double the expected duration of a „growth spell‟.
As a recent Oxfam International report on the G20 puts it, „If we factor in the impact on growth, the double dividend of tackling inequality
becomes a triple dividend: it directly reduces poverty, enhances the ability of future growth to reduce poverty, and, finally, it improves
prospects for growth itself.‟
In order to effect a lasting solution to the crisis, steps taken to fight economic stagnation and to protect people living in poverty must seek
to build a fairer, more sustainable society.
Rethinking what we value as a society
It is not growth that matters, but the type and distribution of growth. Oxfam in Scotland has led the development of a Humankind Index,
which is based on asking people in Scotland what matters to them and
then measuring those things, to see how well Scotland is doing as a society. The UK government should adopt a similarly wide-ranging
approach to measuring well-being, to help ensure that steps taken now
will build a post-crisis economy and society that sustainably serve the interests of the British people.
Conclusion
The aftermath of recession is seeing economic stagnation, falling real incomes, and public service cuts all hitting people living in poverty the hardest. The combined impact of all of these factors adds up to a Perfect
Storm that is pushing people‟s livelihoods to breaking point.
The crisis we are in could be an opportunity to change thinking about what a fair society looks like, and to build the foundations for
overcoming poverty once and for all. We need urgent action right now to reinvigorate both the economy and the social safety-net on which
most of us ultimately rely. But we also need to do so in a way that sets
us on the road to a fair, productive, and sustainable society.
11
2 Introduction The UK is facing a set of serious, interlocking challenges. The economy
is stagnating; unemployment is increasing; prices are rising; incomes are
falling; and spending on public services is being cut back rapidly. For the 13.5 million people living in poverty,1 the combined impact of all of
these factors is creating a „Perfect Storm‟ that is pushing already fragile
livelihoods to breaking point.
When the recession first hit, Oxfam warned that there could be no
return to „business as usual‟.2 This is as true today as it was then. Oxfam also warned that the poorest and most vulnerable people would bear
the brunt. Sadly, as this report shows, this is what is happening right
now.
In the UK, Oxfam‟s anti-poverty programme works with many different
partner organisations, developing projects with people living in poverty to help improve their lives, and to show how things can be changed for
the better. Working with these groups and individuals has helped
Oxfam to understand the impact that the Perfect Storm is having on people living in poverty. Many of their stories are told in this paper. To
deepen its understanding, Oxfam also surveyed all its partners in
autumn 2011 about the impact the Perfect Storm was having on their organisations and on the people they work with. Nearly 50
organisations responded, confirming the depth of the problems, and
helping to inform this paper.
This paper analyses the factors that are making life harder for people
living in poverty, drawing on Oxfam‟s own experience, as well as a wider analysis. This narrative is interspersed with the testimony of
individuals with whom Oxfam‟s programme and its partners work. The
paper goes on to suggest urgent remedies to the immediate crisis, and begins to sketch out a longer-term solution to the underlying causes,
arguing that a return to pre-crisis business as usual is neither possible
nor desirable.
In publishing this paper, Oxfam wishes to tell the untold story of the
millions of people at the bottom who are feeling the worst effects of a crisis that is not of their making. It is aimed at politicians and decision
makers, whose actions can help to mitigate its effects; at the institutions
of civil society, whose task it is to develop a blueprint for a fairer society that is both sustainable and economically successful; and at the media,
who can help to articulate the reality of the Perfect Storm for those
living in poverty.
„We are seeing people on a daily basis who have not got enough money to feed themselves or their children adequately.‟
Feedback from Community Links focus group, 2012
„Government are cutting as much of what they can. They are not taking people into consideration. That‟s why most of the women now, I would imagine, are on anti-depressants, for the simple fact that we can‟t cope with what‟s happening.‟
Kate, Manchester

12
3 Background: the reality of poverty in the UK The UK is the sixth richest country in the world,3 and meets the major conditions for poverty eradication: democracy and good governance,
independent media and judiciary, well-resourced provision of basic
services, and laws enshrining rights and prohibiting anti-discriminatory practices.
Yet, in spite of this, more than a fifth of the population, some 13.5 million people,4 live in poverty.5 The number of people living in poverty
increased from 7.8 million in 1982 to 13.4 million in 1990, and has
remained stubbornly high ever since.6 Even before the recent financial crisis and economic recession, prosperity was not shared. Over the
decade to 2008/09, the poorest tenth of the population saw their
incomes fall by 12 per cent, while the richest tenth saw their incomes grow by 37 per cent.7 Since then, the level of poverty in the UK has
remained consistently high and a combination of factors, stemming
from economic trends and political decisions, has served to make life significantly tougher for people on low incomes (discussed in detail in
Part 4, „The Perfect Storm‟).
Figure 1: Changes in incomes over the 1998/99-2008/09 decade

13
Increasing inequality – whether in or
out of work
In the past three decades, the UK has become a society characterised by enormous inequality. The commonly used Gini co-efficient measure of
inequality rose from 26 in 1979 to 40 in 2009,8 making the UK one of the
most unequal rich countries in the world. The poorest tenth of people in the UK receive only 1 per cent of total income, while the richest tenth
take home 31 per cent.9 Meanwhile, benefit levels have halved
compared with incomes since 1980, falling from one-fifth to one-tenth of average earnings.10
The relationship between work and poverty is crucial, but complex. Unemployment substantially increases the risk of poverty,11 and the
average level of unemployment since 1979 is more than three times the
average level in the two post-war decades.12 Yet having a job is not necessarily enough to lift someone out of poverty, with more
working-age adults in poverty now living in working households than
in workless households.13 Low wages, involuntary part-time working – exacerbated by a part-time pay penalty and in-work benefits that are
insufficient to lift part-time workers out of poverty – together with
inadequate and poorly enforced labour rights, especially for those in the worst-paid and most insecure jobs, combine to cause growing levels of
in-work poverty.
Who is poor in the UK?
The risk of poverty is not one that is shared equally across society. A person‟s ethnicity has a substantial bearing on their likelihood of being
in poverty, and around two-fifths of people from ethnic minorities live
in poor households, twice the rate for white people. There are also substantial disparities between ethnic groups, with 72 per cent of people
of Bangladeshi origin in poverty, compared with 29 per cent of
Indians.16 Women are slightly more likely than men to live in a poor household (21 per cent against 20 per cent17), though this does not
consider the distribution of resources within households, since all
poverty figures are collected at the household level. From what Oxfam knows about the allocation of resources within households,18 and in
view of the persistent gender pay gap in the UK,19 it is likely that
government figures understate the extent to which women are more likely than men to be in poverty – which is problematic in itself.
Geographically, there are substantial inequalities both between and within the regions and nations of the UK. Regionally, the poverty rate
varies between 28 per cent in London (and 32 per cent in inner London)
and 18 per cent in South East England (and 23 per cent in Wales and 19 per cent in Scotland).20 Average incomes in the South East are 15.9 per
cent higher than in the West Midlands.21 Meanwhile, South West
England has both one of the lowest poverty rates – 20 per cent22 – and highest average incomes nationally,23 yet is also home to Cornwall,
John lives with his wife and children in Ebbw Vale, Wales, and works part-time in retail. He works four days of four hours each and, as a result, spends a significant proportion of his wages on petrol. His employer will not consider allowing John to do fewer, longer shifts, to minimise the cost of transport.
38 per cent of black women and 64 per cent of Pakistani and Bangladeshi women live in poverty in the UK, compared with 20 per cent of white women.
14
Women are more likely to be in poverty than men:
• 64 per cent of low-paid workers are women;
• 40 per cent of ethnic minority women live in poverty;
• Women experience a full-time pay gap of 14.9 per cent.
15

14
which ranks 43rd out of 46 English ceremonial counties for Gross Value Added (GVA).24 And being born poor is possibly the single biggest risk
factor in becoming a poor adult: social mobility in the UK has slowed
over the past 30 years, and is low by international standards.25
What does poverty mean in the
UK?
Material deprivation
In practical terms, people living in poverty are often forced to make choices between essentials such as heating and eating. More than a fifth
of UK households (5.5 million or 22 per cent) are affected by fuel
poverty, meaning that adequate heating would cost more than a tenth of
their income.26 In reality, with money needed elsewhere, many are
forced to go without heating, resulting in thousands of unnecessary
deaths each year.27
It is also clear that managing on a low income is time-consuming – and
very hard work. The people with whom Oxfam works report having to visit many different shops in order to buy food at the best prices, rather
than being able to buy everything they need from one supermarket.
Living on a low income makes it difficult to cope with an unexpected „shock‟ such as a broken cooker or boiler, or an electricity bill that is
higher than normal. This is exacerbated by the poverty premium faced
by people living in poverty on the cost of basic necessities such as gas, electricity, and banking, which is estimated to be in the region of £1,170
a year.28 As a consequence, debt is a major concern for people living in
poverty, and is likely to become more acute in the coming years (see Part 4 below). And for many people on low incomes, even a visit to the
cinema – or being able to invite family or friends round for a meal – is an
impossible luxury they cannot afford; they are effectively excluded from participating in the normal activities that are part of everyday life in a
„developed‟ country.
The impact on health
Living in poverty has substantial detrimental consequences for physical and mental health. Being at the bottom of an unequal society fuels status
anxiety and feelings of insecurity, and contributes to mental and
physical ill health.30 The male life expectancy in the healthiest local
authority area (Kensington and Chelsea) is 13.5 years higher than in the
least healthy (Glasgow City).31 The variations in disability-free life expectancy are greater still: those living in the richest neighbourhoods
can expect to enjoy 18 more years of healthy life than those in the
poorest. Premature deaths caused by health inequalities in England each year lead to the loss of between 1.3 million and 2.5 million extra
years of life.32 Inequality is not just causing poverty: it is killing people.33
„Food prices going up create hardship. The idea of choosing between heating and eating used to be a myth. But now it is a reality.‟
Bal Athwal, worker at the Bradford Resource Centre
According to the Marmot Review, wealthy people are more likely to drink excessively than the less privileged. Despite the fact that those with lower economic status are more likely to abstain from alcohol completely, however, they are also more likely to develop alcohol-related illnesses than those who are well off.
29

15
Stigma and prejudice
Media and government portrayals of people living in poverty fuel
poverty prejudice and negative stereotypes. One example of this is the
language used to talk about benefit claimants, with both competing to appear toughest on conditions around receipt of out-of-work benefits,
presenting them as generous and unaffordable, whereas they are in
reality at their lowest level relative to wages since the welfare state was founded.34
Box 1: The labels you get
Sandra lives in Salford, and since losing her job has been on benefits. She
feels that her self-esteem has been severely affected by her situation. She
says, „What worries me, and scares me sometimes, is that there are so many
programmes about benefit cheats and scroungers, and the labelling you get
because you are someone on benefits.
„I think there's a massive link between poverty, stress, and mental health, and
you can‟t get away from it. I felt I was relatively safe. I had a mortgage, I had a
job, I had a good career; now I've been reduced to a set of labels. The
confidence I used to have is gone. What rules most of the time is my electric
meter, constantly going, and I worry about how many showers can I have in a
week? How much television can I watch?‟
The lack of recognition of the contribution that people living in poverty
make to society adds to their negative experiences. People living in
poverty make substantial contributions, whether through undervalued low-income work or non-financial contributions (for example, unpaid
or low-paid caring), and often undertake substantial amounts of
volunteering in their communities. In spite of this, prevailing attitudes in the UK include a lack of recognition of the existence of poverty, a
tendency to believe that poverty is the fault of the individual, and
increasingly harsh attitudes towards benefit recipients.35
In summary, poverty in the UK is about low incomes and material
deprivation, but it is also about social exclusion, stigmatisation, and health inequalities. The causes of poverty are complex, and its risks are
unevenly distributed across society. Ultimately, it is this unevenness
which defines the landscape of poverty in the UK: inequalities of wealth, opportunity, and income explain the paradox that, while the
overall material riches of the nation have grown substantially in the past
30 years, poverty and its consequences have grown in equal measure.

16
4 The „Perfect Storm‟ and its impact on poverty As demonstrated above, the problems of poverty in the UK have not arisen overnight: they are longstanding and are the result of deep,
complex, and long-term factors. Yet, since the economic crisis of 2008,
people already in poverty have seen their poverty deepen, and millions more have found themselves to be vulnerable to economic and political
tides beyond their control. A combination of economic stagnation, the
rising cost of living, benefit cuts, falling incomes, rising unemployment, and public service cuts adds up to a Perfect Storm for the millions
already struggling to make ends meet in the UK. Living standards for
the majority are falling through a combination of declining real incomes and a loss of social benefits due to reduced public services. In a society
where decades of rising inequality have already weakened bonds of
solidarity, this Perfect Storm has left millions of people isolated, with their livelihoods stretched to breaking point.
The recession of 2008/09 was the deepest since the 1930s. The recovery since then has been the weakest in modern history, worse even than the
Great Depression, with output still well below pre-recession levels,36
and the UK recently re-entering recession.37 This has had substantial social consequences in the form of rising unemployment and
involuntary part-time work, falling incomes, and increasing job
insecurity, leading to reduced labour rights. Since it came into power in May 2010, the coalition government has chosen to tackle the debt
accrued since the recession and the 2007/08 financial crisis by
undertaking a programme of deep and rapid public spending cuts and tax increases (originally intended, under plans set out in the 2010
Comprehensive Spending Review, to total £99bn of spending cuts and
£29bn of tax rises per year by 2015/16, equivalent to 6.2 per cent of gross domestic product (GDP).38 These changes have served to reduce
incomes further (through tax increases, benefit cuts, and redundancies),
as well as reducing incomes in-kind provided by public services. Both the total amount and the proportion achieved by spending cuts (which
are substantially more regressive than tax increases) will increase
year-on-year through the five-year spending period from 2010/11 –
meaning that things will get worse for those on low incomes.
The impact of the Perfect Storm is already being felt by people with whom Oxfam works in the UK. Across the country, many of Oxfam‟s
partners say that the combination of government cuts, economic
recession, and welfare reform has led to an increasing number of service users seeking support. In many cases, the complexity of the support
needed has increased. Yet, just as the need for support becomes more
acute, so the resources to provide it are being withdrawn: 19 Oxfam partners have experienced a recent cut in funding.39
„Just because people are not screaming, it does not mean that people are not desperate. It does not mean there isn‟t a crisis.‟
Bal Athwal, worker at the Bradford Resource Centre

17
Box 2: What Oxfam’s partners say
When Oxfam surveyed its partners in 2011, it found that many of them,
despite the decreases in their funding streams, were facing a growing
demand for their services. „Due to cuts in mainstream services and benefits,
the number of clients needing our support has increased drastically,‟ the
Rochdale Women‟s Welfare Association reported.
Many of Oxfam‟s partner organisations are concerned about a decline in
health and nutrition, especially for young families and older people, as they
are faced with tough choices in the distribution of their household
expenditure. Other partners have seen increasing levels of debt and
homelessness befalling their clients. Oxfam‟s partners reported that there is
low morale in the communities they work in with more anti-social behaviour,
including religious and racial prejudice
The unbalanced impact of the recession on women is something that Oxfam‟s
partners have witnessed themselves. The Pankhurst Centre said: „We have
seen a marked increase in women presenting themselves as homeless, and
these women are not typical; they are increasingly women who have lost jobs
or are experiencing domestic abuse. And job losses are affecting more
women than men.‟
Changes to the make-up of communities due to the recession are also being
witnessed. „Many shops have closed, especially unusual shops, and there is
an increase in budget and “cut-price” shops. Now, there are lots of charity
shops, pawnshops, empty shops, shops with broken windows,‟ said the
Swansea Women's Asylum and Refugee Group.
Most of all, Oxfam‟s partners recognise that this crisis is hitting those at the
bottom the hardest. Thrive said: „There appears to be a double standard in
this country between the way rich people and poor people are treated.‟
In order to cope with the impact on their lives, people living in poverty have been forced to rely upon damaging coping strategies. Frequently,
Oxfam partners have reported an increase in service users experiencing
debt,40 and this is borne out in national figures: because economic growth is below its initial expectations, since last year the Office for
Budget Responsibility has revised upwards its forecast for total
household debt in 2015, from £1,823bn to £2,126bn.41 The impact is being felt at the basic level of providing food. The UK‟s largest food
bank network, the Trussell Trust, has seen the number of people
receiving its food parcels double in the past year, and it predicts further increases, from 128,000 people last year to half a million by 2016.42
Finally, as Oxfam knows from its work, and extensive academic
literature has proved, women tend to act as „shock absorbers‟ in times of
crisis, managing budgets and debt, and going without in order to ensure
that their families have what they need.43
The Perfect Storm is so damaging in part because it is made up of a combination of factors, all hitting at the same time. So, while this paper
considers below the impact in six particular areas, millions of people are being affected by a combination of several of these issues:
• Rising unemployment and declining incomes;
• The increasing cost of living;
• Public service cuts;
„All our users are in debt. We have definitely seen an increase in bankruptcy and debt relief orders in the last year to 18 months. The people I see have debts to credit cards, catalogues, loan sharks. […] It‟s often only when they can see a financial statement that they really appreciate they don‟t have enough money to live on.‟
Feedback from Community Links worker in focus group, 2012

18
• Welfare reforms and benefit cuts;
• The housing crisis; and
• Weakening labour rights.
Box 3: A family in East London hit by the Perfect Storm
David used to work for his local council, and his wife Catherine works for the
local hospital. Over a year ago, David lost his job and, as Catherine‟s job is
low-paid and their son is struggling to find a job, the family started having
trouble making ends meet.
Despite trying his best, David couldn‟t find a job, so he turned to taxi driving.
Renting his cab costs him £250 per week, and he cannot always find
customers on a regular basis, due to the recession. The family cannot miss
any more mortgage payments, or their house will be repossessed, so they are
having to go without food to keep up with their payments, and haven‟t been
able to put the heating on all winter. They use gas and electric keys, and when
they run out, David goes out to try and pick up a fare, and then comes home
to put the money on the key.
The pressure on the couple is mounting and both Catherine and David are
now on anti-depressants. David is not entitled to any benefits as his wife
works, and the couple‟s son is not classified as a dependant any more, even
though he cannot provide for himself, as he doesn‟t have a job. They have
other debts that they can‟t pay, and if they decide to go bankrupt, they won‟t
be able to afford to rent another property or to live in a council property, as
they aren‟t vulnerable adults.
Source: Community Links
19
Rising unemployment and declining
incomes
A number of factors are pulling down incomes across most of society. Rising unemployment, involuntary part-time working, pay freezes and
cuts, and cuts in benefit levels are all contributing to the biggest real-terms fall in incomes since 1974–77. According to the Institute for
Fiscal Studies (IFS), median incomes will drop by 7 per cent between
2009/10 and 2012/13,44 having fallen modestly during the recession itself.45
The squeeze on incomes for the majority is not new. Real wages for most have been stagnant since the mid-2000s, and are now falling –
earnings growth in February 2012 was 1.2 per cent,46 against inflation of
3.4 per cent measured by the Consumer Price Index (CPI),47 while average earnings fell by 4.4 per cent in 201148 – and they are set to
continue to do so. In the first six months of 2011, almost three-fifths of
employees experienced a pay freeze (rising to over three-quarters in the public sector), with a further one in twenty having their pay cut.49 The
National Minimum Wage (NMW), the level at which millions of
workers are paid, has fallen in real terms for three of the past four years, and was frozen in the other.50
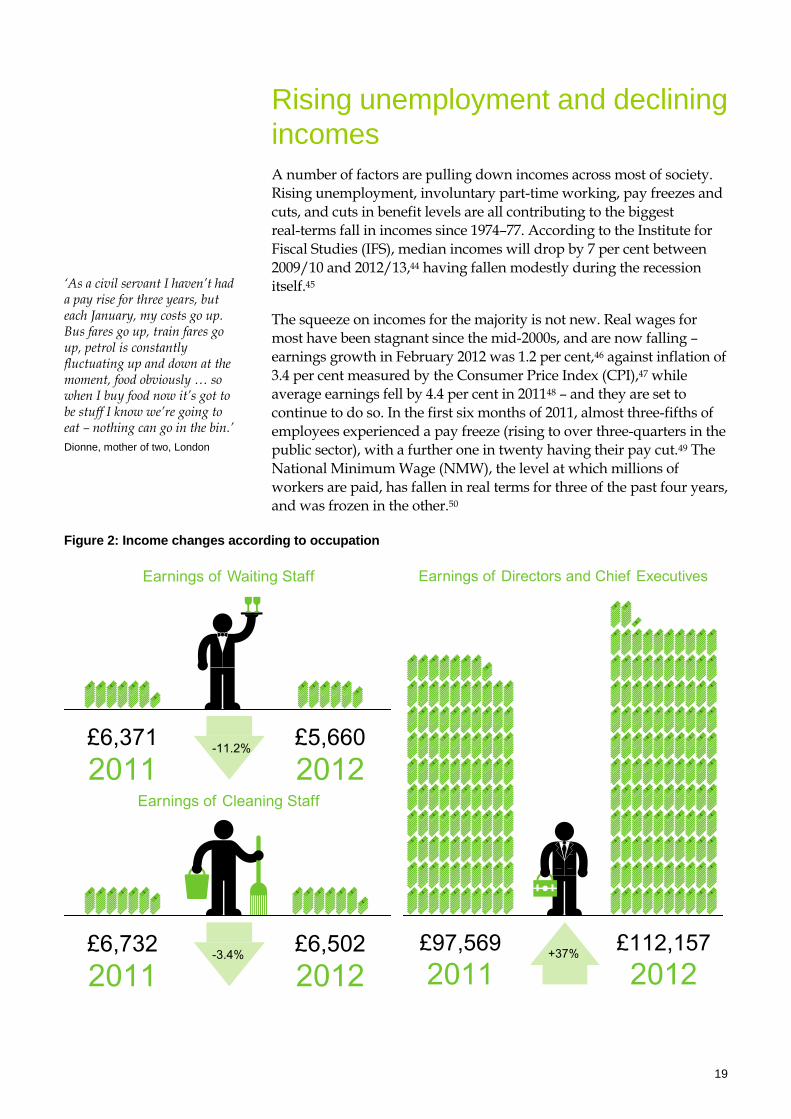
Figure 2: Income changes according to occupation
„As a civil servant I haven‟t had a pay rise for three years, but each January, my costs go up. Bus fares go up, train fares go up, petrol is constantly fluctuating up and down at the moment, food obviously … so when I buy food now it‟s got to be stuff I know we‟re going to eat – nothing can go in the bin.‟
Dionne, mother of two, London

20
At the same time, rewards at the top have raced away compared with those at the bottom. Last year, the earnings of company directors and
chief executives went up by 15 per cent, while the annual pay of waiters
and waitresses fell by 11.2 per cent and the earnings of cleaning staff fell by 3.4 per cent.51 Directors of FTSE 100 companies saw their earnings
increase by 49 per cent.52 The average FTSE 100 executive now earns 145
times more than their average worker. On current trends, by 2035 this inequality will reach levels last seen in the Victorian era.53
Even during the good times, the majority of rewards went to the richest: in the decade to 2008/09, 40 per cent of total income growth in society
went to the richest tenth of people.54 The progressive initial response to
the recession helped briefly to reverse this trend, with incomes growing fastest for the poorest fifth (3.4 per cent) and slowest for the richest
two-fifths (0.3 per cent) from 2008/09 to 2009/10.55 Since then, however,
the new government‟s deficit reduction plan has been substantially
regressive, hitting the poorest hardest.56 The contrast does demonstrate,
however, the potential for positive government action to protect people
living in poverty, through decisions on how tax and benefit changes are targeted.
Meanwhile, levels of unemployment have reached their highest for 17 years, at 2.67 million people (8.4 per cent).57 This represents a second
post-recessionary spike in unemployment, with levels initially having
begun to fall in the wake of recovery in 2009/10, suggesting that the impacts of stagnating growth and of public sector redundancies (public
sector employment having fallen for eight successive quarters since the
start of 201058) are starting to be felt in the job market. Moreover, long-term unemployment is at a 14-year high of 882,821 claimants,
having more than doubled since the financial crisis of 2008.59
Box 4: Fewer opportunities for young people
Community Links, an Oxfam partner based in East London, delivers training
to young people not in education, employment, or training (NEETs). The
trainers usually compile a list of apprenticeships that the participants can
apply for, but they are witnessing a decline in the number of opportunities
available. „Each year the list has got shorter and shorter,‟ says one
Community Links worker.
Last year there were only three apprenticeships, one of them in child care,
she adds. „Three of the girls on my course applied for the place in child care,
so you can imagine what the competition for that was like. Do you know what
that placement was for? It was to work with terminally ill kids. They wanted to
pay a 16–18-year-old £100 a week to work full-time with terminally ill children.‟
Source: Community Links
Levels of youth unemployment are notably high, with more than a fifth of young people, over one million of them, unemployed.60 This last
statistic is of particular concern, given evidence that unemployment has
a permanent „scarring‟ impact on the life prospects of young people.61 It is estimated that for every young person not in education, employment,
or training (NEETs), there is an average cost of £56,000 to public
„I‟ve been unemployed before and it‟s only ever taken three months to find work. Now, I‟ve been looking for full-time work for ten months, and there are jobs but a lot of people are going for each job. It took me a long time to even get any interviews, but once it happened, I was always competing against internal candidates and, fair enough, the internal candidate gets the job because they know the company, but it makes it difficult for people that are not working.‟
Christina, Bradford
21
authorities over their lifetime.62 There are also impacts in terms of equality and social cohesion, as one in two young black people is
unemployed. The likelihood is that unemployment will get worse
before it gets better, with employers seeking to reduce staffing levels outnumbering those looking to increase them.63
Unfortunately, even these figures understate the extent of the employment problem. Many of those currently in work are
under-employed – involuntarily working fewer hours than they would
like. The number of such „frustrated part-timers‟ has reached 1.4 million – the highest figure since records began in 1992.65 Oxfam‟s own
experience demonstrates the impact of the weak labour market for
people living in poverty: several of its partners report that the numbers of their service users experiencing redundancy have recently increased.
In addition, several partners have told Oxfam that more of their
employed service users are facing reduced incomes due to shorter
working hours.66
Falling incomes and higher levels of unemployment, while particularly acute at present, are part of a longer-term trend. The average level of
unemployment since 1979 – of 7.9 per cent – is more than three times the
average level recorded in the two post-war decades. At the same time, a decreasing proportion of GDP has gone to wages,67 with the bottom half
and the bottom 10 per cent taking less,68 while corporate profits and the
incomes and wealth of the very rich have sped upwards.69 To bridge the gap and allow workers to buy the increasing output (and thus keep the
economy functioning), consumers have needed to borrow. As a result,
levels of personal debt have more than tripled in less than 20 years: from 45 per cent of incomes in 1981 to 157 per cent in 2008.70 Moreover, those
with incomes of less than £10,000 per annum have a consistently higher
unsecured debt-to-income ratio than any of the higher-income groups, rising to almost 300 per cent in 2010.71
The increasing cost of living
A major reason why real incomes have been falling is that prices have been rising rapidly. While, typically, inflation is associated with an economy operating above full capacity (i.e. the end of a boom), both
recession and stagnation have been accompanied by high rates of
inflation, with peaks of 5.2 per cent (CPI; RPI was 5 per cent) in September 2008 and 5.2 per cent (CPI; RPI was 5.6 per cent) in
September 2011.72 More significant than the headline figures has been
what is driving price rises. The peaks in 2008 and 2011 were driven by food and fuel prices, both of which account for a high proportion of the
spending of people living in poverty.
In addition, tax rises under the coalition government have been regressive, thus affecting people living in poverty more, when the
poorest fifth are already taxed more heavily (35.5 per cent of their income in 2009/10) than the richest fifth (33.7 per cent).73 In particular,
the increase in VAT from 17.5 per cent to 20 per cent from January 2011
(having been reduced to 15 per cent between December 2008 and
„I‟m struggling because I‟ve had to give up work … the hours they gave me wasn‟t enough so it‟s got me into debt … they said I‟d have 15 hours a week and they knocked it down to six, which was no good at all.‟
White woman, interviewed for „Recession, Poverty and Sustainable Livelihoods in Bradford‟ report
64
„I look at the amount of food I used to buy: I could spend £10 or £15 a week, and I would have loads of food; now, when I look at it, I have half a bag of food. And I don‟t want to buy stodgy white bread, because it‟s processed food. You want to keep your diet to a good standard.‟
Jo, unemployed, Bradford

22
January 2010) is making the tax system more, not less, regressive. VAT continues to constitute a greater proportion of household disposable
income – more than double – for the poorest people (almost 10 per cent)
than for the richest (under 5 per cent). Indeed, the gap between the richest and the poorest in terms of the proportion of disposable income
spent on VAT has grown from 1 percentage point in 1986 to almost 5
percentage points in 2009/10.74
In the past five years, food prices have risen at approaching double the
rate of average inflation (30.5 per cent against 17.4 per cent),75 a trend that is likely to continue, with food prices expected increase by 50 per
cent in real terms over the next 40 years.76 Meanwhile, fuel prices have
also risen above inflation: between January 1997 and December 2010, electricity prices rose by 67 per cent and gas prices increased by 139 per
cent, compared with a rise of 48 per cent in the overall RPI,77 with
dual-fuel bills expected to rise by up to 50 per cent from 2011 to 2015.78
This, in turn, has contributed to a rise in the proportion of homes facing
fuel poverty in England and Wales from 18 per cent to 24 per cent in two
years.79
Figure 3: National Minimum Wage increase vs. food prices increase
In addition, people living in poverty face a „poverty premium‟ on the
cost of basic necessities such as gas, electricity, and banking, estimated to be in the region of £1,170 a year (for example, because the best tariffs
are only available to those able to pay by direct debit, while
pre-payment meters offer the worst rates of all).80 As incomes for people living in poverty have tended to rise with average inflation (benefits
have historically been uprated along with RPI, though that will change
to CPI from this year – and the National Minimum Wage has gone
The South West Community Mental Health project in Glasgow reported, in March 2012, that all its users had seen large increases in their energy bills recently. Because all users have low incomes, they cannot access the most economical payment methods for basic utilities like gas and electricity. As a result – and paradoxically – those who have less money end up paying the highest price, through pay-as-you-go methods such as power cards or keys.

23
down in real terms in the same five-year period), this means that their ability to pay for essentials has been reduced.
Box 5: Buying bigger clothes for the children to grow into
Andrea is a single mother of three in Newport, South Wales, the youngest
being two years old. She feels that the cost of food, electricity and gas, and
clothes has risen sharply. She has to budget more and more carefully when
she goes shopping, and can no longer afford to buy treats for the children
without thinking twice.
„I have to think a lot more about where the money goes. I prioritise fruit and
vegetables rather than sweets and crisps. I always try to pass toys and
clothes on from the older children to the youngest, and when I do buy clothes,
I look at the quality of the material and buy clothes that will last. I buy bigger
sizes so that the children will grow into the clothes. I worry about the children
getting older and demanding more things. It is difficult when we live in a
society that is so built around consumption.‟
A number of attempts have been made to quantify the impact of this differential inflation. Comparing patterns of spending across income
groups and associated price rises, the IFS has calculated that, between
2008 and 2010, the poorest fifth of households experienced an inflation rate of 4.3 per cent, compared with 2.7 per cent for the richest fifth.81 As
food and fuel prices have since undergone a second peak, it is likely that
this differential pattern has continued into 2011/12. The Joseph Rowntree Foundation (JRF) annually uprates the level of the Minimum
Income Standard – a minimum standard of living, based on a broad
survey of what members of the public think constitutes the basic requirements of life. The JRF calculates that the cost of achieving the
Minimum Income Standard has risen by 43 per cent over the past
decade, compared with 27 per cent for general prices.82
Oxfam is seeing the effects of price rises in its day-to-day work, with its
partners increasingly reporting that service users are finding it harder to get by because of the increased cost of living, particularly food and fuel
prices. In the majority of cases, they report a „large increase‟ in these
instances.83
Public service cuts
The political climate today is dominated by deficit reduction, largely in
the form of public spending cuts. The government plans, by 2016–17, to
instigate average cuts of 19 per cent to each government department, or £126bn over six years. It also plans £29bn of tax increases over that
period, the bulk of which will come from the increase in VAT from 17.5
per cent to 20 per cent.84
The decision to focus so heavily on spending cuts is significant, since
these are known to have a far greater impact on poorer people, who rely most on public services. Research shows that spending cuts will hit the
poorest tenth of the UK population 13 times harder than the richest
tenth. The impact on those poorest households will be enormous –
„I always worry when I make a dish that it might not be enough. And if a friend should appear with my children at dinner time, they‟re always welcome – I give up my plate.‟
Jean, Glasgow
„We are being told about the Big Society, and that all this will be provided by charitable organisations, and people in communities will band together and do it all. That‟s not happening because all those organisations that have been helping people are under threat left, right, and centre in my community. They are fighting for every pound that they get in.‟
Cllr Suzanne Richards, Manchester

24
equivalent to more than a fifth of their income being taken away (even more if benefit cuts and tax increases are taken into account).85 In
addition, research shows – and the government acknowledges – that
spending cuts will be proportionately larger for more deprived local authorities than for richer ones. For example, within London and the
South East, Hackney and Tower Hamlets Councils will see cuts of 8.9
per cent per year, while Richmond and Windsor will see cuts of 1 per cent or less.86
Figure 4: Percentage of income lost as a result of spending cuts
At a time when substantial social damage is being caused by the Perfect Storm, the resources to deal with its impacts are being withdrawn. The
cuts mean less health care, reductions in social care, and the loss of
hundreds of smaller services such as counselling support, care homes, school crossing patrols, and youth clubs. This is liable to lead to a
double effect of existing services dropping in quality and more of these
problems being inadequately dealt with, and of money for preventative public services being diverted into short-term, curative spending,
decreasing well-being for future generations. The pressure to make such
short-term decisions is particularly acute for local government, which is suffering the biggest overall cut, at a cumulative 27 per cent by 2014–15.
One particular function of local government is to provide many of the
essential personal services that women and their families need.
Cutting public spending has a particularly strong impact on gender
equality.89 This is before considering the secondary effects, as women are more likely to make up the shortfall in public services by their own
unpaid efforts in the home. They can also suffer knock-on financial
impacts, as they will in some cases reduce their own employment and
Sixty-one per cent of voluntary organisations in the North East of England that provide services to women reported a decrease in income last year, compared with 43.9 per cent in 2009 and 37.5 per cent in 2010.
87
„If grant funders and Government all think it‟s someone else‟s responsibility to fund key crisis services like ours, where is this magical funder that will pick it all up?‟
NEWomen‟s Network member88
25
incomes to make that additional work in the home possible.
Box 6: The health consequences of the cuts
Bridget is 52 years old and is on employment support allowance due to her
mental health issues. She lives alone in Manchester and, due to her
condition, she used to rely on support groups in her area, but now most of
them have closed as a result of the cuts. „There are too many cuts in
Manchester, and there are too many places closed down, so I don‟t have
many places left to go. There were some groups that I used to go to for mental
health therapy, and they‟ve lost their funding, so they‟re just not there any
more,‟ she explains.
She would like to move out of Manchester because she feels there is no
service provision for people her age in her area any more, but she can‟t afford
to move house.
„Since all these cuts have affected me, I‟ve actually relapsed with my mental
health, and I don‟t go out as much as I used to. The one thing I will do is use
my bus pass to go on the bus to somewhere that is free because that‟s all I
can afford to do now. I can‟t afford to go for treats or to places like the cinema
any more, and things like that,‟ she says. The isolation has made her
condition worsen: „I‟ve pretty much had a relapse and gone back to stage one,
when I‟d come so far with the help and support of these groups. Now they‟re
not there, I‟ve gone backwards again.‟
One area in which spending cuts will bite especially hard, affecting
women in particular, is child care. Already, the UK has the third most expensive child care amongst OECD countries. While the UK
government spends a high proportion of GDP on family benefits (3.6
per cent compared with an OECD average of 2.2 per cent; only France
and Denmark spend more, at 3.7 per cent), most of this is spent on cash
transfers to families. Countries that allocate proportionately more of
such spending to services (even if the total amounts spent are lower) obtain better outcomes in terms of child poverty, gender equality,
employment rates in families, and rates of child-care enrolment. In spite
of this, spending on Sure Start, the major service of this kind in England, is being cut back – particularly heavily in poor areas, at £100 per child,
compared with £30 per child in rich areas. Between April 2010 and
November 2011, there was a net reduction of 124 Sure Start centres in England.90 In contrast to this approach, the Welsh government has
chosen to protect and expand its equivalent service, Flying Start, which
demonstrates the potential for taking different approaches within the same spending context (see Box 7).
Meanwhile, cash support for child care is to be spread more thinly under Universal Credit, meaning that many families on low incomes
will be worse off in work once child-care costs are taken into account.
Already, the average second earner in the UK keeps only 32 per cent of their earnings once child-care costs are taken into account, compared
with 48 per cent on average in OECD countries.92 This and other cuts to
family benefits, including Child Benefit and Tax Credits, will make the situation significantly worse. To reach the Minimum Income Standard,
families requiring child care would have to earn over 20 per cent more
„A lot of staff at Sure Start has been made redundant and we had made good bonds with those staff, so it is a shame to lose them. Also there is less provision; they used to run various parenting courses which have been cut.‟
Andrea, single mother of three, Newport, Wales
• 75 per cent of local government workers are women.
• 77 per cent of NHS workers are women.
• 80 per cent of adult social care workers are women.
• 82 per cent of education workers are women.
91

26
in 2011 than in 2010 to meet the shortfall in government support.93
Box 7: Wales: investing more in children
In stark contrast with the UK government‟s approach to services in England,
the Welsh government decided last year to invest in its Sure Start equivalent,
Flying Start, in order to double the number of children it reaches.
An extra £55m will be injected into Flying Start over the next three years, on
top of the regular £39m a year, to benefit an extra 18,000 2–3 year olds, at a
time when 32 per cent of children in Wales live in poverty (compared with 28
per cent in 2003–06).94
This extra funding will be applied differently, through
data on households that receive Income Benefit, rather than based on the
Welsh Index of Multiple Deprivation, which will ensure that families struggling
in well-off areas are less likely to lose out.
Finally, public service cuts feed back into the Perfect Storm through
their impact on unemployment. Public sector employment levels are in steep decline, with a 4.3 per cent drop in employment levels (270,000)
over the past year,95 which has contributed to unemployment
continuing to rise far beyond the technical end of the recession (prior to the onset of a second recession). In their secondary effects, too, public
service cuts have a gendered impact. Women form the majority of
public sector employees,96 and are particularly concentrated where the cuts are deepest, with women constituting 68 per cent of those
employed by local authorities.97
Welfare reform and benefit cuts
One of the largest contributions to spending cuts has come from the welfare budget. In total, benefit cuts for working-age people (and, by
extension, the children they support) will account for £18bn per year by
2014–15. This is the context in which an ambitious programme of welfare reform – with Universal Credit as its centrepiece – is being
pursued. The amount being cut from the budget is 36 times greater than
the amount being invested in the new system.
The major components of these cuts to benefits include caps and other
reductions to Housing Benefit (to be followed by an overall benefit cap); a three-year freeze in Child Benefit, together with means-testing for
higher-rate taxpayers; a one-year time limit for contributory
Employment and Support Allowance (ESA); a 10 per cent reduction in
the budget for Council Tax support (with administration of the cut
devolved to a local level); reduction in Child Tax Credits and a
tightening of eligibility criteria for Working Tax Credit; a reduction in child-care support; and a change to uprating benefits annually by the
CPI, rather than the RPI, measure of inflation.
„Things are changing all the time and it‟s very confusing and worrying for people… Especially when they think they are going to be losing their benefits.‟
Dorothy, volunteer at the Clydebank Resource Centre, Scotland

27
Box 8: Tax credits cuts: a tough blow on single parents
Becky is a single parent working 28 hours a week, on a four-day week. Her
three-year-old daughter goes to child care while she‟s at work, and this costs
£565 a month. Becky receives the maximum 80 per cent support to pay for
child care, but cuts to tax credits mean that she will lose over £1,300 a year in
support.
Becky says: „This will be very, very hard for me. I was going to try and set up a
pension but I won‟t be able to afford those payments every month now. I‟ve
already cut down on all our non-essential spending, so the only way to get
around these costs is to try and negotiate working a shorter day, from 9.30 to
2.30, so I don‟t have to use child care at all – although this will mean I work
fewer hours and so I earn less.
„I honestly have no idea how I‟m going to manage with this. I am a manager,
I‟m well qualified, I have 11 years‟ experience – I contribute to my local
economy through my skills and experience. But I feel that I‟m being forced to
consider giving this up.‟
Source: Gingerbread98
Figure 5: Benefits rise vs. earnings
This last issue is highly significant, since benefit levels have steadily been falling further behind average incomes since the link with earnings
was broken in 1980. Unemployment benefit has fallen from one-fifth to
one-tenth of average earnings.99 If benefits had continued to increase with earnings, Jobseeker‟s Allowance would have been £123.69 a week
in 2010/11, rather than £65.45 a week (for single people aged 25 and
above).100 With each subsequent year, the impact of the switch to uprating via the CPI will be compounded, a major factor in the
„[On benefits] you don‟t get enough to live on. £65 or £67 a week, for an adult, is not enough. Sometimes I think, “I am a single person and I struggle, what about families of six kids?”‟
Jo, unemployed, Bradford
28
increasing scale of welfare cuts over the four-year spending review period to 2014–15. The change is predicted to save the government
£1.2bn in 2011–12, rising to £5.8bn in 2014–15.101 This seemingly
technical change will ensure that benefits become increasingly more residual, year by year, accelerating the creation of a „them and us‟
welfare system.
On a positive note, the introduction of Universal Credit will simplify the benefits system, making it easier for people currently on benefits to take
short-term, part-time, or insecure work. It will also help to protect people as they transition between unemployment and work, or as the
hours they are able to work rise and fall.
Yet, just as the system is simplified, so eligibility is being tightened for many claimants, making it harder for people to claim their rights to
social protection. New tests for ESA (which has replaced Incapacity
Benefit as the main means of support for people who cannot work due
to ill health), and soon for the Personal Independence Payment (which
will replace Disability Living Allowance from 2013), have caused a great deal of hardship in the form of incorrect decisions, appeals, and a
reduction in financial support for many.103 Meanwhile, successive
governments have increased „conditionality‟, or the requirements that claimants must meet in order to receive benefits, including, from
October 2011, the requirement for single parents of children aged five
and over to seek work. The latest Welfare Reform Bill has introduced a maximum sanction for non-compliance of three years‟ loss of benefits.
Box 9: Benefit sanctions: one step closer to destitution
The users of the Bradford Resource Centre (BRC), an Oxfam partner, have
noticed an increase in welfare sanctions in the area, with people having their
benefits stopped for two weeks, two months, or even six months. People are
penalised for not applying for the jobs they have been assigned, even if these
jobs prove to be unsuitable for their skills, or for missing appointments with the
job centre. „On benefits, you are not allowed to be ill, to go on holiday, or to be
under stress,‟ says Bal, from the BRC.
„The problem with welfare sanctions is that people lose their Jobseeker‟s
Allowance (JSA), and all their other benefits. It stops immediately, and then it
takes ages to sort out getting all the benefits again,‟ she explains. Those
affected rarely have any savings, and find it even harder than before to get by,
having to resort to food banks.
The workers at Community Links, an Oxfam partner based in East London,
have noticed the same trend, with many of their service users being pushed
into extreme poverty or into debt after being sanctioned. One Community
Links worker says: „People are experiencing benefits sanctions much more
frequently now. If they miss appointments or the benefit office decides that
they are not actively looking for work, that they are being lazy – rather than
there actually being no job supply at the moment – their benefits are stopped.‟
The combination of these changes, of cuts to funding for advice and
support services, and of the increased need for benefits due to the
Perfect Storm, has resulted in large numbers of Oxfam partners reporting an increase in the number of service users experiencing
Sharon, from North Wales, has chronic fatigue syndrome. Despite this, she ran her own company until 2010, but she was forced to close it because her health deteriorated. She applied for Employment and Support Allowance (ESA), and what followed was a lengthier and more emotionally taxing process than she had expected. She only started receiving money eight weeks later and, not long after, the benefit was stopped because she was declared fit for work in an assessment. She finally secured her entitlement to ESA after appealing against the decision.
Source: Cutswatch Cymru102

29
problems in claiming welfare support.104 The Trussell Trust food bank network reports that two people out of every five receiving food parcels
do so as a result of benefit changes or delays.105
As with public service cuts, welfare reform is likely to result in a negative impact on gender equality. In part, this is because women are
more likely than men to rely on benefits for the bulk of their income: twice as many women (30 per cent) as men (15 per cent) rely on state
support for at least three-quarters of their income.108 Research by the
House of Commons Library also showed that, of the measures announced in the 2010 Emergency Budget, 72 per cent of cuts would be
met from women‟s income as opposed to 28 per cent from men‟s.109 The
Commons Library found a similar differential impact in the Comprehensive Spending Review later that year, with women affected
twice as badly as men.110 However, it is also about the way in which the
government has chosen to pursue welfare reform. In particular, the
Welfare Reform Bill focuses on improving incentives for first earners
(more likely to be men) rather than for second earners (more likely to be
women). There have also been significant cuts to child-care support, which make it harder for women to enter or progress in employment,111
and to other family benefits. Combined with a single household-level
payment for all benefits (which threatens to increase intra-household inequality of access to income), a move away from the few remaining
non-means-tested benefits, and the use of stronger conditionality that
particularly affects women, the way in which Universal Credit is being pursued will have a differential impact on women.112
Housing crisis
The cost and availability of housing have both long since reached crisis point for people living in poverty. There is evidence, however, that recent economic realities and political decisions have made the situation
worse – whereas tackling the housing crisis could be part of the solution
to the economic crisis.113
Before the recession hit, there was an acute housing shortage. There
were 1.77 million households in England on social housing waiting lists in 2008, and 489,400 households living in officially overcrowded
homes.114 The government of the time set a target of 3m new homes by
2020, and 240,000 per year by 2016, in order to tackle the shortage.115 Since then, construction has slowed to a crawl. Over the past year, there
have been 107,140 new housing starts in England, only 20,900 of which
were in the social housing sector – representing the lowest level of house building since the Second World War.116 In Scotland, last year
there were 156,200 people waiting for social housing117 and 10,685
households in temporary accommodation,118 against only 15,150 house completions (in all housing sectors) – a decrease of 41.1 per cent
compared with 2007,119 and short of the 19,000 required annually simply
to keep pace with the growth of household numbers.120
The human cost of this shortage is stark. It affects family life, including
forcing people to delay having children, preventing adults from living
In Wales, the areas that will see the biggest drop in ESA claimants, due to proposed changes, are those that are least able to offer suitable job opportunities to former claimants, due to rising unemployment and weak job markets.
106
„Research has suggested that, particularly in low-income households, the [...] assumption with regard to income sharing within couples is not always valid as men sometimes benefit at the expense of women from shared household income.‟
Chris Grayling, Minister of State for the Department for Work and Pen-sions
107

30
near their parents and keeping children away from their grandparents, and making it more difficult to develop and maintain relationships.
Unaffordable housing is forcing millions of people to cut back on other
essential spending, with research by Shelter showing that housing costs lead over a quarter of people to reduce how much they spend on food,
and a similar number to cut back on home fuel consumption.121 It can
also lead to problem debt, with millions resorting to borrowing on credit cards to pay their housing costs, and can harm job prospects by
preventing people from moving for work.122 Homelessness is rising,
with households accepted as homeless by local authorities up 18 per cent in England in the year to October–December 2011123 and on an
upward trend in Wales since 2009.124 Scotland experienced a 20 per cent
decrease in the year to June–September 2011, after five years of relatively stable numbers,125 though it is unclear at this stage to what
extent this is a genuine fall in homelessness resulting from an
investment of resources into homelessness prevention, and to what
extent it reflects a change in recording practice.
Prices in the private housing sector have risen at historically fast levels, more than doubling in real terms in the decade to 2008,126 contributing
to inequality of wealth (80 per cent of first-time buyers now rely on
money from their parents – the proportion has more than doubled in six years – meaning that the majority of the major source of wealth in
society is now inherited127) and acting as a major factor behind a rising
state welfare bill.128 Thanks largely to historically low interest rates, house prices are currently still at around 2008 levels (albeit slightly
down from their 2007 peak).129
Box 10: Families at breaking point
Paula lives in London, with her husband and their two children. The house
rented by the family is going on the market soon, and even though both
parents work, they are struggling to find another place to live due to rising
rents and the impossibility of raising a deposit to buy a house.
„We moved to the area when we were students because it was cheap. We set
up home, put down roots. My salary has increased as my career has
developed, but it simply hasn‟t kept pace with housing costs,‟ Paula explains.
The couple don‟t want to move because the children are doing well at school,
but it‟s looking impossible to stay in the area. They have been looking at
two-bedroom houses, but even if they find one Paula anticipates problems.
„With a teenager who is increasingly in need of his own space, and a
boisterous six-year-old, having them together in one room is likely to cause
many family rows.‟
Source: Shelter
Significantly for people living in poverty, the cost of renting in the
private sector has been rising sharply. According to Shelter, rents rose
more than one-and-a-half times faster than incomes in the decade to 2007, with the result that homes are now unaffordable in more than 55
per cent of local authorities in England.130 Average private sector rent
for England is now 58 per cent of the average income of the poorest quarter of the population.131 Since the start of the recession, the
„Being in the system of public housing, which I wasn‟t before, I haven‟t been able to choose where I live. It‟s like you never have a home, you don‟t have control.‟
Sandra, Salford

31
combination of low levels of house building and more restricted credit for first-time buyers has seen rents continue to rise. Average private
rents in England and Wales reached a record high of £718 per month in
September 2011, having risen by 7.4 per cent over the previous two years.132 According to one study, renting privately is now typically 17
per cent more expensive than owning a home, based on total monthly
costs.133
Increasingly, this means that the need for government support with
housing costs extends to those in work: the number of Housing Benefit claimants in work more than doubled between November 2008 and
February 2012, whereas the number of claimants out of work rose by
only 9.3 per cent in the same period.135
Figure 6: Number of housing benefit claimants in work
The government‟s programme of spending cuts has had a two-fold
impact on the housing crisis (as well as the indirect impact on house building described above). First, a substantial proportion of the cuts to
the welfare budget (discussed above) has fallen on housing support.
The move to decrease the maximum level of support available through
November 2008 February 2012
430,160 878,190
Housing Benefit Claimants in Work
+104.3%
represents 1,000 people
„It [Housing Benefit cap] fills me with dread and I‟ve tried to move to a flat instead of a house which is about £50 cheaper per month, but no one will touch me because I‟m a [social] housing tenant. So when these changes take place, I will have to end my contract here and probably go homeless – they aren‟t leaving me with any choice.‟
Single mother, London
Source: Netmums online forum134

32
benefits, from covering half to one-third of housing in a given area, will undoubtedly add to the 48 per cent of claimants whose housing benefit
already fails to cover the whole of their rent, and who pay £23 per week
on average from other sources.136 Together with plans to increase future support by the CPI measure of inflation rather than actual rents in an
area (as has been the case to date), this will ultimately destroy the
principle that housing support should meet housing needs.
Second, changes made as part of the government‟s welfare reform
agenda (and enacted through the Localism Act 2011) will substantially increase the cost of housing outside the private sector. Rents for new
tenants in the social housing sector have been increased to 80 per cent of
market rates, under the new Affordable Rent scheme. According to the National Housing Federation, this could increase rents for low-income
families to up to £9,000 a year,138 while a report by the London
Assembly gave the example of a four-bedroom house in Haringey, the
rent for which would more than triple.139 In addition, a new
„under-occupation‟ penalty will, according to government figures, affect
670,000 social housing tenants, who will lose an average of £676 per year. With 180,000 social tenants in England „under-occupying‟
two-bedroom homes, but only 68,230 one-bedroom social homes
becoming available for rent in 2009–10, many will be unable to avoid the penalty, making it essentially punitive.140 Moreover, the problem of a
shortage of affordable housing is likely to worsen as a result of the cuts
programme, with resources allocated to building affordable housing falling by 63 per cent in real terms in 2011–15 compared with 2008–11.141
Finally, housing tenure will be made less secure for many under the provisions of the Localism Act. Having a secure place to live can be an
important aspect of constructing a sustainable livelihood, particularly
for people living in poverty, for whom social and community assets can be especially crucial.142 The introduction of new Flexible Tenancies
under Affordable Rent – which the government estimates will affect
29–39 per cent of social tenants in 30 years‟ time143 – will carry a statutory fixed-term minimum of two years, rather than permanent
Secure Tenancies as at present. This will mean that many of those
renting outside the private market will have less long-term security in their homes, reducing their ability to put down roots in their
community and increasing uncertainty, particularly for families with
children. The Act also allows councils to discharge homeless households into the private rental sector, which is characterised by
insecurity of tenure, high and increasing prices, and weak regulation.
This is likely to increase the insecurity of a highly vulnerable proportion of the population, and to reduce the prospect of these households ever
finding the secure home that should be a basic right for all.
Weak labour rights
For a substantial minority in the UK, work is characterised by insecurity, uncertainty over hours, under-payment, a succession of short-term jobs,
or a combination of all these. Across the UK, the Trades Union Congress
(TUC) estimates that there are two million „vulnerable workers‟ in
Westminster Council expects to find around 2,000 families not being able to afford their current rents, as a result of the Housing Benefit cap. The council has accepted that there will be a 20 per cent reduction of the school population in the borough.
137

33
precarious, low-paid, and insecure employment,144 and research from across Europe shows that it is women who are in the most precarious
and vulnerable work.145
The UK labour market as a whole has unprecedented levels of „flexibility‟, which corresponds to low levels of rights for workers.
Successive governments have decreased regulation for employers since the 1970s, making it easier for them to hire and fire workers, in order to
meet what they perceive to be their business needs, despite the evidence
to support this claim being mixed at best.147 Indeed, evidence suggests that the relationship between employment protection legislation and
productivity growth is an „inverted U-shape‟, whereby both very low
and very high levels of employment protection legislation have been found to reduce productivity growth, and levels in between are best.148
It is therefore significant that the UK now has the third lowest level of
employment protection legislation in the OECD, below less developed
economies such as Greece, Mexico, and Turkey,149 which affects the type
of jobs available at the bottom end of the labour market. The UK also
has the second highest prevalence in Europe of very short-hours contracts of less than ten hours per week (8 per cent) and the highest
number of zero-hours contracts – contracts in which a person is required
to be on call for work but has no guaranteed hours in a particular week, and is only paid for the hours they do work (5 per cent).150
Box 11: The inflexibility of the care industry
Jasmine is a single mother with three children, aged ten, seven, and 17
months. She has worked for five years as a night care assistant, working
12-hour shifts, looking after severely disabled children.
The problems with her employer started with her recent pregnancy, which
was deemed risky, causing Jasmine to go to hospital more often than normal.
„They [the employers] made me take my hospital ante-natal appointments as
holiday. I looked on the internet to see what my legal rights were and I asked
my employer about their maternity policies. They didn‟t have any,‟ she says.
Jasmine went on maternity leave, and when she returned to work she asked
to reduce her hours, but her request was refused. Jasmine was told that if she
wanted to come back to work she would have to sign a new contract of
employment, working seven nights each fortnight.
Jasmine works nights because she can‟t afford child care. Her nieces are able
to stay overnight at her house to look after her children. When Jasmine
needed to take emergency leave to care for a member of her family, her
request was refused. „When I phoned work they said: “Since you came back
[from maternity leave] you have been causing a lot of trouble.” They refused
to let me even take the time as holiday.‟
There is a clear link between living in poverty and having few labour
rights. Low-paid workers in sectors such as hospitality and social care are often employed on flexible labour contracts, such as being paid at a
piece rate (per room cleaned, for example). Research has also shown
that 41 per cent of temporary workers are low-paid.151 ‟Flexibility‟ includes very short-term contracts, work paid at piece rates, and
zero-hours contracts where the worker has no guarantee that they will
receive any hours of paid work in a particular week, often under the
The proportion of those in a low-paid job in Wales is higher than in the UK as a whole, with more than one in ten in-work households living in poverty.
146
„My life has not been stable because I cannot find a permanent job. I work whenever it is available. I have to push hard to make sure I have a sensible amount of hours for the week – I have no guaranteed work, it is all ad hoc. The organisation I work for does not commit itself to give me work.‟
Stella, single parent and care worker, lost her permanent job as a housing support worker

34
guise of supposed „self-employment‟. An employee‟s vulnerability to adverse treatment is determined by a wide range of factors which affect
the balance of bargaining power between them and their employer.152
Where the balance of power favours the employer, there may be less incentive for them to protect their employees against adverse
treatment.153
The Perfect Storm is exacerbating the situation for people living in poverty. The loosening labour market and shortage of jobs means that
more power rests with employers, and more people are being forced to turn to insecure work, with few rights – or to waive the rights they do
have154 – just to survive. The private sector has created fewer jobs since
the recession ended than the government predicted, and those that have been created are often poorly paid and part-time.155
Figure 7: Change in job availability since May 2008
Change in
part-time jobs
+500,283
Change in
full-time jobs
-830,880
Change in
temporary
jobs
+138,786
no. people
in part-time
jobs who
want full-time
("frustrated
part-timers")
no. people
in temporary
jobs who
want
permanent
jobs
Change in job availability between May 2008 and March 2012
+113%
+72.6%

35
Since May 2008 – after which unemployment began to rise – the numbers of people in both part-time and temporary work have
increased. Full-time employment has fallen by 3.8 per cent, while
part-time employment has increased by 6.7 per cent, and temporary employment by 9.7 per cent.156 Furthermore, men have accounted for 83
per cent of new jobs added to the economy,157 at a time when women
are losing their jobs in the public sector, and female unemployment is at a 23-year high.158
There are now a record 1.42 million „frustrated part-timers‟ – those who want and need full-time work – doubling as a proportion of part-time
workers since May 2008.159 This is highly significant as part-time
workers are generally low-paid, with two-fifths paid under £7 an hour, and half of all part-time workers paid under £8 an hour. The number of
people working in temporary jobs because they cannot find permanent
employment has increased by 72.6 per cent.160 Similarly, while the rise
in self-employment has offset around 40 per cent of the loss in employee
jobs since the onset of recession, this rise has been atypical, with women
accounting for 60 per cent of the rise (when they constitute less than a third of self-employed people overall), and nine in ten of the additional
self-employed working less than 30 hours per week (compared with less
than one-third of self-employed people overall).161 In short, people are doing any job they can find, even if that means having a very unstable
income.
In addition, the government‟s commitment to expanding the „contracting out‟ of public services, for example through the Localism
Act 2011, is likely to further undermine labour rights.162 The move towards contracting out has led to an almost four-fold expansion in the
agency sector in the past two decades, and the number of workers
employed by agencies doubled between 1996 and 2006 – with nearly 1.265 million workers employed by agencies by 2006, or 4.5 per cent of
the workforce.163 In the public sector, there are already 1.2 million
people employed through contractors.164 With estimates that outsourced public services cost 20 per cent less,165 there is concern that
squeezed national and, in particular, local government budgets will lead
to greater outsourcing of public services and will exacerbate the race to the bottom for workers‟ pay and terms and conditions.
Government deregulation is at present further increasing labour market flexibility, ostensibly to encourage increased employment, but at the
expense of increasing insecurity and reducing labour rights. For
example, the proposed fee of £200 to deter frivolous cases being taken to employment tribunals – and up to £1,000 before a case is heard – is
likely to discourage the most vulnerable workers from making claims
against exploitative employers. This is in addition to the abolition of Legal Aid for employment advice, which will further undermine access
to justice. Crucially, in the absence of an enforcement body with the
appropriate authority, employment tribunals constitute the only way of claiming for unpaid holiday pay166 – the number one violation
reported.167

36
The government has also increased the qualification period for unfair dismissal to two years, making the jobs of three million workers more
insecure,169 and adding greater insecurity for those in low-paid jobs. As
the Chartered Institute of Personnel and Development (CIPD) has noted, raising the qualification period yielded no discernible benefit in
the 1980s and is „detrimental to fostering a culture of genuine
engagement and trust between employers and their staff, and potentially harmful to the long-term performance of the UK
economy‟.170 Overall, evidence from the OECD has shown that less job
protection simply makes employment rates less stable over the economic cycle, with little impact upon the structural rates of
employment or unemployment.171 This is particularly significant
because people in low-paid jobs are increasingly likely to become long-term unemployed.172
These changes to employment protection legislation will have an impact
on the security of the poorest people and will continue a strategy that
has been marked by calls to abolish protection against unfair dismissal
altogether,173 and to suspend the minimum wage for young workers in small businesses.174 This is despite the evidence that, given the UK‟s
very low levels of employment protection, a further, substantial
reduction in employment protection is unlikely to enhance labour market performance, and could instead worsen performance.175
Moreover, efforts to improve labour rights may not reach people in the most need. Though decisions have yet to be taken on the extension of
flexible working, the government‟s proposals indicate that those unable
to work regular hours due to other responsibilities will not receive any further rights if they are working in temporary jobs or working for small
businesses. This means no ability to negotiate for better working terms
for the one-third of temporary jobs that are low-paid.176
In the absence of government stepping in to increase protection for
workers, it is likely that the introduction of Universal Credit will increase the prevalence of vulnerability in work. Universal Credit will
make it easier for people to take up short-term or part-time work, and,
while it is positive that people currently excluded by an inflexible benefits system will be empowered to take existing work of this nature,
the danger is that an increase in the supply of flexible labour will
unleash pent-up demand from employers. With welfare reform increasing the power of employers, it is likely that the position of
workers will be weakened without a commensurate increase in their
rights.
In addition, there is evidence that the Mandatory Work Activity
workfare scheme, enabled by the previous government‟s Welfare Reform Act 2009, has been used by private sector employers to replace
regular, waged work with unpaid labour.177 This breaks the link
between work and pay, forcing people to work for up to 30 hours a week for four weeks (an equivalent of £2.37 an hour for those on the
adult rate of Jobseeker‟s Allowance of £71 a week), and threatens to
undermine the labour rights of those already in work, as it further reduces the power of workers.
Martin applied for a job in a local supermarket and got an interview. He was later told that the interview was cancelled, as they were no longer hiring. „Despite my frustration, I wasn‟t all that surprised. With this supermarket having originally been named as one of the prime leaders in the government‟s “work experience” scheme, why on earth would they hire me for a permanent position when they can sift through all the eager, cheap young labour being filtered through the system?‟
Source: The Guardian168
„I don‟t want to do more [mandatory work]. It‟s like I‟m being punished for being unemployed. If you‟re unemployed and you‟re forced to do voluntary work, they‟re putting me on the same level as criminals, basically.‟
Rita, unemployed, Bradford

37
Finally, the shortage of formal job opportunities – there are 5.6 unem-ployed people for every vacancy178 – is likely to force many people living in poverty into working informally. Workers in the informal economy lack the labour rights of those working formally, meaning that they are vulnerable to exploitation, including being paid below the National Minimum Wage. Working informally also limits routes for progression, since experience gained outside of formal employ-ment cannot necessarily be presented when applying for jobs.179 The introduction of Universal Credit will help to reduce the benefit traps that force many people into informal work, but with work incentives under the new system being lower than originally envisaged due to public spending cuts,180 and with economic stagnation meaning a re-duction in employment generation in the formal economy, there will still be many who are forced into informal work.
Research by Oxfam in one city in the North West found that a significant minority of unemployed people had worked informally in the past year, and that this work was accepted by many in the community as a survival strategy. Those who work cash-in-hand reported that they did so to make ends meet, and because of the lack of adequately paid jobs in the area.

38
5 Responding to the Perfect Storm
The need for a new approach
As demonstrated in the previous section, the economic crisis and the political responses to it are having enormous, negative social
consequences. Rapid deficit reduction is hitting the livelihoods of almost everyone in the UK, but the particular approach taken is hurting
people living in poverty the most. The effect is two-fold: the focus on
cutting public spending rather than raising taxes is deeply regressive,181 and the blend of tax increases chosen – particularly the focus on
increasing indirect taxation – is itself regressive.182 In addition, both
public spending cuts183 and the tax and benefit changes introduced by this government will have a significantly more negative impact on
women than on men.184
At the same time, we are seeing a synergy of economic and social needs. Even within the terms that the government has set itself regarding the
pace and depth of deficit reduction, there are far fairer and more economically productive ways of doing things. First, protecting the
incomes of the poorest people is crucial for both social and economic
reasons. It is people on low incomes who are being hurt most by the Perfect Storm; but they also have the highest marginal propensity to
consume (i.e. they spend most of their income because they have to),
and so increasing the incomes of the poorest will have the strongest multiplier effect on aggregate demand in the economy. Conversely, at
present, with the impacts of falling incomes and spending cuts falling
most heavily on the poorest, the reductions in demand are multiplied, thus reducing economic growth.
Second, by prioritising social and economic investment, and targeting that investment in pro-poor ways, the government can ensure that it
protects the services upon which people in poverty (and women in
particular) most rely; it can ensure that money is circulated directly into the economy, helping to boost demand; and it can provide investment
in the long-term productive capacity of the economy, at a time when
business investment has collapsed.185 With bond rates in the UK at historically low levels, according to one commentator „it is
inconceivable that creditworthy governments would be unable to earn a
return well above their negligible costs of borrowing, by investing in physical and human assets, on their own or together with the private
sector‟.186 Indeed, since such investment can create the potential for
future growth, it can not only help to solve the cyclical fiscal deficit by stimulating the economy now, but can also reduce the structural deficit
by raising the long-term potential output of the economy.
There are two main ways in which the government can respond to the Perfect Storm, and ensure that people in poverty or vulnerable to

39
poverty are protected. The first is to continue deficit reduction at its current pace, but to alter the balance and make-up of tax rises and
spending cuts to ensure that they better protect people on low incomes.
The second involves softening its stance on deficit reduction, in order to allow room for investment in the economic and social infrastructure of
the UK, boosting both short-term demand and the long-term potential
output of the economy, and tackling both the cyclical and structural deficits (see Part 6 below, „The long-term case for a fairer society‟ for a
discussion on tackling the structural social and environmental deficits.)
Shifting the iron triangle
There is an „iron triangle‟ in fiscal policy. Tax, government cash transfers to boost incomes (both in and out of work), and government spending
on public services must all be increased or decreased in relation to each
other, in what amounts to a zero-sum game. To keep budgets in balance, a change in one side must ultimately be met with a commensurate
change in another. For example, a tax decrease must lead to a cut in
public services or cash transfers (or both), and an increase in public services must be funded by a decrease in cash transfers or an increase in
tax (or both). In the context of economic recession, tax revenues tend to
decrease and cash transfers increase (through „automatic stabilisers‟ such as increased unemployment benefits), and political decisions must
be made on how to deal with the resulting fiscal deficit.
Figure 8: The ‘iron triangle’ in fiscal policy
The severity of the Perfect Storm is largely the result of a political
decision to respond to a crisis in tax revenues187 predominantly through
cuts to cash transfers and public services. A switch from the planned 77:23 ratio of public spending cuts to tax increases in a more equal
direction could help to shift the balance of that triangle away from cuts
and back towards cash transfers and services. As well as the balance of the triangle, the detail of each side is crucial to how fiscal decisions
affect different groups in society. Thus, below, this paper sets out
priorities for protecting benefits and public services, but also focuses on ensuring that any new sources of revenue are fair.
Public services
Tax
Cash transfers

40
Investing our way out of the crisis
This approach – of shifting the iron triangle to protect those must vulnerable to the Perfect Storm – can be complemented by investment in the economic and social infrastructure of the UK. Since such spending
raises the long-term productive potential of the economy, it sits outside
the short-term iron triangle, and can help to stimulate the economy out of the deepest recession it has experienced since the nineteenth
century.188 With private investment collapsing and the UK now
experiencing a double-dip recession,189 such government investment can help to counteract the negative economic consequences of rapid
deficit reduction. The International Monetary Fund (IMF),190 the UK
Treasury,191 and the National Institute of Economic and Social Research (NIESR) have all concluded that deficit reduction will both act as a drag
on growth and raise unemployment, with the result that, even if the
government reaches its targets for spending reduction, it will not meet its borrowing targets.192
The evidence above shows that the Perfect Storm is doing enormous damage to individuals and to society, compounding existing
inequalities. Meanwhile, enormous amounts have been spent on bank
bail-outs: according to calculations by the IMF, these amounted to over 100 per cent of annual GDP in 2009.193 A modest degree of investment in
the social and economic fabric of the UK can help both to stimulate the
economy out of recession and to protect the essential services and social protection upon which millions of people rely – provided it is targeted
to ensure that the most vulnerable can access the economic benefits
through jobs and services.
No return to business as usual
The UK‟s economy and society, as currently constituted, are unsustainable – economically, socially, and environmentally (see Part
6). Actions taken now, as an urgent response to the urgent situation created by the Perfect Storm, should be taken with an eye on building a
more sustainable future. By protecting services and social protection
through progressive taxation, inequality can be reduced. By targeting government investment towards transitioning the economy to an
environmentally sustainable footing, and by investing in the social as
well as the economic infrastructure of the country, government
investment today can help to overcome ecological and social deficits as
well as the fiscal deficit. And by rethinking existing tax and government
spending so that they are more progressive and encourage more sustainable growth, we can build on the actions taken to ease the current
crisis to build a more economically, socially, and environmentally
sustainable future.
We need a „people‟s bail-out‟ to protect the millions in poverty and the
millions more who are increasingly vulnerable. But we also need to ensure that there is no return to business as usual.

41
Responding to the Perfect Storm
The Perfect Storm is a set of interlocking crises, and, while particular problems have particular solutions, there is a need for joined-up thinking, for example around how rethinking state support for housing
can help to free up money to maintain social protection for all. In
particular, the area of tax connects many of the issues addressed below, with a fairer, more progressive tax system being central to protecting
both the incomes of people in or vulnerable to poverty and the public
services upon which they rely. Overall, however, it is imperative to recognise the Perfect Storm for what it is: an urgent crisis for the
livelihoods of people living in poverty. The measures below, therefore,
are crucial in the short term – but they must also be enacted with a view to effecting a fair and sustainable longer-term exit from the crisis.
Protect the incomes of the low-paid
With incomes being squeezed and the prices of essentials rising, protecting the incomes of the poorest people is a clear priority. Not only will this be socially beneficial, but concentrating resources on the
poorest will help to stimulate demand in the economy, since people on
low incomes have the highest marginal propensity to consume. It is crucial to protect the incomes of those both in and out of work, through
maintaining real benefit levels for both groups, as well as guarding
against the erosion of wage levels (see below for more on out-of-work benefits). In the long term, action to reduce pay differentials within
businesses, public authorities, and wider society can help to protect the
incomes of those at the bottom, as well as helping to reduce inequality in the long term.
A double effect of reduced wage protection and cuts to out-of-work benefits is compounding falling incomes at the bottom. Cuts in working
tax credits will mean that more than 200,000 working families will lose
up to £3,870 per year, with the average qualifying family expected to lose £2,000 a year because of benefit cuts.194 Meanwhile, the National
Minimum Wage, which provides a floor for wages, has fallen or has
been frozen in real terms in each of the last four years.195 To ensure that incomes for those in work are maintained:
Cuts to working tax credits should be reversed;
The withdrawal rate for Universal Credit should be reduced
from 65 per cent to 55 per cent, as recommended by the Centre
for Social Justice,196 to ensure that the principle that work
should pay is realised in the new system; and
The National Minimum Wage should be increased
automatically at least in line with inflation or average
earnings, whichever is the higher.

42
Protect people in poverty from the
increasing cost of living
The combination of falling incomes and rising prices has driven many people living in or near poverty into unsustainable debt. In order to
protect vulnerable people suffering financial shocks from exploitation, a
maximum level of interest should be set, along with action to crack down on unscrupulous lending. The government should also take
positive action by promoting and funding credit unions, and ensuring
that access to the Social Fund for those on very low incomes is protected and its resources expanded. In addition to protecting benefit levels (see
below), the government should instigate an additional increase to reflect
the higher inflation recently faced by people living in poverty (due to high food and energy prices) – which will also provide a short-term
economic boost.
Rising energy prices have coincided with substantial increases in the profit margins of energy companies: the energy regulator, Ofgem,
estimated that profit margins on dual-fuel deals for the big six energy companies increased by 733 per cent between June and October 2011,
from £15 to £125 per household.197 Oxfam is supporting calls for the
government to take action to make the energy market work more in favour of people living in poverty, based on an independent public
inquiry.198
To protect people living in poverty from high energy prices, the
government should give the energy regulator, Ofgem, new powers to
cap prices and eliminate excess profit.
To ensure that people who are forced into debt by high prices do not
have their situation further compounded by having to pay exploitative levels of interest on that debt, the government should:
Introduce a maximum level of interest; and
Ensure that access to the Social Fund is maintained for those
on very low incomes, and its resources expanded to meet
increased demand.
Reduce public service cuts
Public service cuts form the largest aspect of the government‟s response to the economic crisis. Yet these cuts to services disproportionately
affect people living in poverty. In the short term, by changing the ratio of spending cuts to tax increases (see „Shifting the iron triangle‟ above),
the government can protect services by reducing the speed and depth of
cuts. It is particularly crucial to protect services that support women and children, who are being hit hardest by public sector cuts. One quick way
of doing this would be to reinstate the ring-fencing of the Sure Start
grant to local authorities in England, while providing additional money to fund it so that other services are not affected.199

43
To protect services for the longer term, the government can invest in services that create jobs and increase long-term growth (for example,
through a national investment bank focusing on green, social, and other
productive investment that is empowered to draw in funding from bond markets200). Investment in early years education through an
expanded Sure Start scheme (following the positive example of Flying
Start in Wales) and a universal system of child care would create employment (in a sector in which women are over-represented), and
would help to make work pay for second earners and single parents
(both of whom are more likely to be women). Such services are more cost-effective than the system of cash transfers that the UK currently
relies heavily upon, while public services have proved particularly
powerful in reducing inequality.201
As immediate steps, the government should:
Slow the speed and depth of public service cuts by increasing
progressive taxation instead;
In particular, protect Sure Start services by reinstating the
ring-fence to the Sure Start grant to local authorities in
England; and
Explore investing in a national system of universal child care.
Protect the social safety-net
As discussed above, protecting the incomes of the poorest people, vital in itself, can also play a crucial role in stimulating the economy. Indeed,
social protection spending, which must in the short term form the core
of the boost to incomes, has been praised internationally for the double effect of fighting poverty and acting as a macro-economic stabiliser, thus
fuelling demand.202
In the longer term, overcoming poverty and creating a sustainable economy can only be achieved by rebalancing incomes across society.
This will require fair social protection that provides enough to live on but also acts as a springboard towards employment and progression. It
also requires making all work decent work (see below). The UK
urgently needs to begin a conversation about creating a pro-poor system of social protection for the post-crisis era, much as the Beveridge Report
led the way after the twin crises of the Great Depression and the Second
World War.
In the short term, the government should protect the level of
out-of-work benefits by:
Ensuring that local authorities in England have sufficient
resources to maintain existing levels of Council Tax Benefit,
following the Scottish government’s example;203
Monitoring the effect of the Housing Benefit and overall
benefit caps and reviewing them in light of social impacts; and

44
Ending stealth cuts to benefits by reversing the switch in
uprating from the RPI to the CPI measure of inflation, to
protect benefit levels for those in or out of work.
To protect the incomes of women in and out of work, who have been hit particularly hard by cuts to benefits:
Child Benefit levels for those on low and middle incomes
should be maintained through a reversal of the freeze to 2014;
and
Cuts to child-care support should be reversed, to protect both
incomes and work incentives, by restoring support for
child-care costs for low-income families to pre-April 2011
levels of up to 80 per cent of costs, and through providing an
adequate level of support for child-care costs in the new
Universal Credit system.204
Secure, affordable, decent housing
for all
The UK is suffering from an acute housing crisis, with rents soaring and house building grinding to a halt. There is a clear, long-term need for
housing205 but, in the short term, housing is also a very good way of
stimulating the economy. House building generates a multiplier of 3.51, meaning that every pound invested adds £3.51 of output to the
economy.206 Construction lead times are relatively short, especially
given high unemployment among construction workers; house building
is relatively labour-intensive, using skilled and unskilled labour; and
the investment will create jobs in the UK.
Housing investment also supports the economy in the long term by increasing labour market mobility, with one in five businesses
considering housing costs to be a constraint to their business growth.207 The investment will also boost government finances over the long term,
with the creation of assets that generate rental income, and a reduction
in spending on housing support through the benefits system – rising housing costs have meant that the average weekly Housing Benefit
claim for recipients in the private rented sector has increased by 47 per
cent in a decade.208
Investment in housing can also serve environmental as well as
economic ends, for example through retrofitting existing housing stock. According to research by the Energy Saving Trust, full-scale
refurbishment of the entire UK housing stock could support 4.7 million
jobs and add £280bn to the economy (though of course a more modest programme could also be implemented).209 It would also have
long-term benefits, saving £8.7bn a year on domestic energy bills and
cutting CO2 emissions by 48m tonnes.210 Investing in retrofitting has the advantage that it can create jobs quickly, and the money remains in the
UK, boosting the economy.

45
In addition, there is a need to provide greater protection for private tenants. Numbers in private housing have risen to 3.6 million
households – one in six. There are now more than one million families
with children renting privately, almost double the number five years ago.211 Promoting security for people who are likely to be in privately
rented accommodation for the long term can help them to develop
social assets and play an active part in their community. The government should as a matter of urgency explore ways to increase
certainty of tenure and to stabilise rents. As an immediate step, it is
crucial for action to be taken against serial „rogue landlords‟ – of which local authorities say they are aware of 1,477. Complaints about the
private rented sector have increased by 22 per cent in three years, with
research suggesting that the true number of problems is more than four times higher than reported.212
In the short term, the government should:
Invest in affordable homes to boost the economy and help
solve the housing crisis; and
Consider raising the maximum penalties for offences by
landlords, including increasing maximum fines to make it
more cost-effective to pursue prosecutions.
Protect rights at work
In the short term, it is crucial that existing labour rights are protected. Higher levels of labour market regulation have not hindered economic
recovery in countries such as Germany, while some observers have
found „flexibility‟ in the UK to be positively associated with
unemployment.213 Similarly, the UK‟s high level of labour market flexibility has not resulted in a rapid return to growth or increased job
creation as expected. As the CIPD has recently noted, „the case for
wholesale employment deregulation is thus far from being a no-brainer‟.214 As such, it is vital to maintain and enforce existing rights.
In particular, it is vital to ensure that low-paid workers continue to have free access to employment tribunals, in light of the proposed
introduction of a £200 fee. The government should also rigorously
assess the decision to increase the qualification period for protection against unfair dismissal in light of its impacts on the job security of
those at the bottom of the labour market and on employment levels.215
Promoting security in work for those in employment will increase consumer confidence, encouraging spending, which is vital in the short
term to boost demand in the economy.
It is also important that those with jobs are encouraged to enter into dialogue with employers, so that they can better balance work with
their responsibilities. As research has shown, extending the right to request flexible working to all workers would be a driver towards wider
provision of flexible working arrangements,216 improving the ability of
those on low-paid, temporary contracts to negotiate for better working

46
conditions.
Furthermore, the government should protect workers‟ existing rights
more effectively and efficiently, prioritising sectors in which labour rights violations are significantly high.217 This would ensure that those
at most risk of exploitation by unscrupulous employers in today‟s tough
economic climate are able to secure their livelihoods. Better protection of existing rights could be achieved by applying the cost-effective
working practices of the Gangmasters Licensing Authority (GLA) to
other sectors of the economy, including hospitality, construction, and social care. In the long term, protecting labour rights is an essential part
of ensuring that decent work becomes the norm in the UK, and that
in-work poverty is eradicated. It requires making all work decent work, with strong, enforced labour rights and wages that provide enough to
live on. Strengthening the bargaining power of workers over labour
rights and pay levels will help to ensure that there is upward pressure
on wages and conditions for those on low incomes, and downward
pressure on inequality. Long-term solutions will also include the
creation of a single Employment Status that affords „Workers‟ (including temporary workers) the same employment rights as
„Employees‟.218
In the short term, the government should:
Protect access to justice by exempting low-income workers
from employment tribunal fees;
Apply the working practices of the Gangmasters Licensing
Authority to other sectors of the economy, prioritising
hospitality, construction, and social care; and
Extend the right to request flexible working to all workers.
A fairer tax system
As discussed above, tax increases undertaken with the aim of closing the fiscal deficit under the current government have been regressive overall. 219 In the short term, it makes social and economic sense to
ensure that any further tax increases are progressive in nature, and that
any future tax cuts to stimulate that economy are targeted at people on low incomes.
Given the squeeze on incomes among those paid the least, where revenue does need to be raised – for government investment, to boost
the incomes of the poorest, or to reduce the fiscal deficit once the
economy is moving – targeting tax avoidance should be the first priority. According to HM Revenue and Customs, the UK tax gap is
£35bn a year,220 while other sources estimate that it could be as high as
£120bn a year. 221 The proposed introduction of a statutory general anti-avoidance rule (GAAR) promises be a good short-term method of
clamping down on tax evasion, prior to addressing the fundamental
causes of avoidance in the medium term.222

47
Free School Meals for all children
in families in receipt of Universal Credit
Cost of Social Fund na tionally
before welfare reform
Cost of keeping the
Educational Maintenance Allow ance
Cost of Sure Star t programme
in 2010/11 – before cuts
Total for Incapacity Benefit plus
Employment and Suppor t Allowance
Cost of unemployment
benefits nationally
Cost of fully insulating
every home in Britain
UK tax gap –
HM Revenues and
Customs
estimate (2011)
This could
pay for
or
Cost of primary,
secondary and
nursery education
for the whole of
England
Figure 9: What the UK tax gap could pay for223
Much of the current deficit was caused by the cost of bailing out financial institutions. In the long run, to create a sustainable economy,
we will need to construct a financial system that serves the economy,
rather than its own interests, and as such it will be desirable to promote
productive investment and to discourage speculation. Part of that will
be achieved by reducing the need for a large financial sector by reducing
inequality and therefore the need for debt-fuelled consumption by the poorest. But in the short term, a financial transaction tax (FTT) could
help both to dampen the most destructive financial speculation and to
raise vital revenue.224 A modest FTT of 0.05 per cent could raise £20bn per year, which the financial sector could afford,225 and which
represents almost twice as much as the increase in VAT. VAT has
double the impact on the poorest tenth of the population as on the richest tenth,226 and the IMF has said that an FTT would be „highly
progressive‟, falling predominantly on the richest institutions and
individuals in society.227
In the long term, a progressive tax system would help to tackle
inequality: at present, the poorest pay more of their incomes in tax than the richest.228 Progressiveness must be built into the system as a whole.
This allows green taxes to be introduced to help reduce the UK‟s
ecological footprint, without such taxes unduly affecting people living in poverty as their regressive effects are offset elsewhere in the system.
The details of a fairer tax system for the long run will be subject to
debate in the years ahead, but the policies and priorities could include:
• A focus on targeting wealth inequality, since wealth is essential as a
cushion against economic shocks229 and helps to facilitate economic

48
independence and reduce vulnerability to exploitation;230
• Discouraging asset bubbles and wealth inequality through a form of
land value tax,231 which has advantages over other methods of tackling inequality, since it is less vulnerable to global wage and tax
competition;232
• Tackling the long-term causes of tax avoidance, for example by equalising taxes on income and capital gains;233
• Rethinking the contribution of businesses: companies paying below a „living wage‟ cost the taxpayer between £5.9bn and £6.3bn a year in
benefit payments and loss of tax,234 while the largest companies, which operate in tax havens, pay just 5.75 per cent tax on the
resulting profits.235
In the short term, to raise money to protect essential services, the
government should:
Proactively clamp down on tax avoidance and evasion to
ensure that all tax that is levied is collected;
Introduce a ‘Robin Hood Tax’ on financial transactions of 0.05
per cent, to raise money for services and benefits at home and
to fight poverty overseas; and
Examine options for a land value tax.

49
6 The long-term case for a fairer society There is a strong relationship in the UK between poverty and inequality. The UK is a rich society, but one in which income, wealth, and
opportunity are unequally distributed. Yet inequality causes damage
not only to those who are shut out from wealth and left in poverty: there is also a substantial body of evidence demonstrating that it leads to
worse outcomes across society as a whole. On a range of indicators,
from violence and imprisonment, through physical and mental health, to social mobility, more equal societies fare better across the board.236
Meanwhile, the economic crisis in which we find ourselves is to a large extent due to unsustainable levels of personal debt and a bloated
financial sector, both of which were substantively driven by ballooning
levels of inequality. These left people in poverty (and vast swathes of those in the middle) with insufficient income to meet their consumption
needs (especially with pressure to consume fostered by an unequal
society in which status anxiety is rife), while the rich were left with a surplus of capital from corporate profits and accelerating personal
incomes, for financial speculation. The resultant combination of
debt-fuelled consumption at the bottom and widespread speculation at the top – and the vast edifice of financial institutions that facilitated it –
have led to an unbalanced and unsustainable economy, which is
trapped in long-term stagnation.
Finally, as a whole, humanity is using up nature‟s renewable resources
between 20 per cent and 50 per cent faster than the planet can renew them.237 The UK‟s contribution to the global ecological footprint is far
out of proportion to its size: if everyone in the world consumed the
planet‟s resources in the way that the UK does, humanity would need more than three planets to sustain itself.238 Over the past 15 years, the
UK has modestly decoupled its production-based carbon emissions
from economic growth, but this is reversed if consumption-based emissions – i.e. the carbon emissions embodied in net imports – are also
taken into account. Carbon emissions will need to fall far more rapidly
and more consistently if the UK‟s economic growth is to decouple from carbon use and become environmentally sustainable.239 Our society and
the economy that serves it require a substantial reordering if we are to
meet the interlocking challenges of social justice, sustained economic recovery, and environmental sustainability. Each of these is necessary if
we are to achieve a lasting end to the Perfect Storm.

50
The impact of inequality on
individuals and society
Inequality has the harshest impact on those forced to remain at the lower end of the income spectrum. It breeds a sense of hopelessness and
status anxiety,240 and the experience of inequality is often feeling that
„you‟ve lost the competition‟.241 Status anxiety in turn encourages materialistic goals, and there is evidence linking this consumerism with
children in low-income households feeling unsafe and insecure.242
Where an individual has an unfavourable relative position in a social hierarchy, this creates chronic stress if they are without other resources
to buffer against the damage to well-being.243 Wealth and income
disparities have a negative impact on those at the bottom of the income distribution, over and above the impact of insufficient income.244
More broadly, inequality has negative impacts across society as a whole, beyond those individuals who find themselves at the wrong end of the
income spectrum. There is comprehensive evidence – from numerous
countries – that life expectancy, social mobility, health outcomes, and a range of other social problems, from murder rates to levels of infant
mortality, are all directly related to levels of inequality in societies. Yet
within rich countries, there is no link between income per head and social well-being. Rather, it is the way in which resources are distributed
within society that is the key determinant of overall well-being, once a
country has reached a certain level of income.245
Therefore, from the perspective of the UK‟s social development, the
overall level of GDP growth is less important than what that growth
looks like, and whom it benefits. Brazil‟s economy grew by 2.5 a year
from 1990 to 2009 and the poverty rate halved; Peru‟s grew by 3.9 per
cent a year from 1997 to 2007, and poverty increased.246 Based on a large sample of countries, former chief economist of the World Bank Francois
Bourguignon found that variation in growth rates on their own
explained only 26 per cent of the variation between countries in rates of poverty reduction.247 Policies that lower inequality can both reduce
poverty immediately and accelerate the poverty-reducing impact of
growth in the future – this is known as the „double dividend‟ of redistribution.248 On that basis, the UK has been doing very badly for
some time – 40 per cent of income growth from 1998/99 to 2008/09
went to the richest 10 per cent of the population249 – and by international standards, with one of the highest levels of inequality in the OECD.250
The economic case for greater
equality
With economic growth for the past three decades being unequally shared, and incomes stagnant at the bottom of the distribution, low
earners, and particularly the millions living in poverty, have
increasingly needed to resort to borrowing to maintain a decent
„In Britain or Glasgow as a whole, it‟s all slowly eroding. You see wealth creation, and you see wealth, but it never filters down. So you see the very poor getting poorer.‟
Audrey Flannaghan, Trussell Trust food bank manager in Glasgow, Scotland
„They [the media] portray a certain material lifestyle that not everyone can achieve. Society is splitting into two halves: the haves and the have-nots; the people who can achieve this lifestyle and those who can‟t. London has been broken down into very different areas now. You can predict what is going to happen to the upbringing of a child from one place to another.‟
Dionne, single mother of four, London

51
standard of living. While average real incomes have stagnated,251 incomes at the top have raced away, with the share of income going to
the top 0.1 per cent of earners increasing by two-and-a-half times in the
past three decades,252 and the top tenth enjoying pay increases four times higher than low earners in the same period.253 The share of
national output taken by wages fell from 60 per cent in 1980 to 53 per
cent in 2008.254 As a result, the proportion of people working on low pay has doubled to more than one in five.255 Consumption levels for those
on low incomes have been maintained through a bubble of consumer
debt, which lax financial regulation has helped to inflate. Personal debt increased by three-and-a-half times between 1981 and 2007, from 45 per
cent to 160 per cent of GDP.256
Bridging this widening gap in incomes with borrowing cannot be maintained indefinitely. We have developed a society in which those at
the bottom need to borrow to survive, and those at the top have
enormous amounts of money to lend (even once they have substantially
increased their consumption), leading to an expanded financial sector.
This led the lead economist in the World Bank research group, Branko Milanovic, to conclude that „the real cause of the crisis lies in huge
inequalities in income distribution that generated much larger
investable funds than could be profitably employed‟.257 The IMF has recently produced evidence reaching the same conclusion,258 and
suggests that „any success in reducing income inequality could therefore
be very useful in reducing the likelihood of future crises‟.259
In addition, inequality is bad for growth. Detailed investigation of data
from both developed and developing countries from the mid-1990s onwards offers significant evidence that a high level of inequality is a
barrier to future economic growth.260 Indeed, the Asian Development
Bank (ADB) suggests that growth and equality can „be seen as part of a virtuous circle‟.261 Research by the IMF shows that income inequality is
a „key driver of the duration of “growth spells”‟: i.e. economic growth is
much more likely to endure in countries with more equal income distributions. The IMF suggests that the effect is large, and estimates
that closing half of the inequality gap between Latin America and
emerging Asian economies would more than double the expected duration of a „growth spell‟.262
Greater equality, then, is good for society, but it is also good for the economy as a whole. According to a recent Oxfam International report
on the G20, „if we factor in the impact on growth, the double dividend of
tackling inequality becomes a triple dividend: it directly reduces poverty, enhances the ability of future growth to reduce poverty, and,
finally, it improves prospects for growth itself.‟263
No return to business as usual
What we see, then, is a synergy of social, economical, and environmental necessities. In order to effect a lasting solution to the
crisis, steps taken to fight economic stagnation and to protect people
living in poverty must seek to build a fairer, more sustainable society.

52
That task is a long-term one, and Oxfam is committed to being part of the conversation about what such a society would look like. Yet the
outlines are clear. We need a society underpinned by decent work that
pays enough to live on, and in which the distribution of resources is far more equal than it is today. We also need a system of social protection
that acts both as a safety net and as a springboard, preventing poverty
without trapping anyone on benefits. And the imperative to reduce the UK‟s ecological footprint should be imprinted across everything we do
as a society, building towards an environmentally sustainable future.
As the IMF points out, even successful debt reduction on its own will only store up more problems for later, since „a long-lasting trend toward
higher debt-to-income ratios resumes immediately after the debt reduction, because workers continue to have a reduced share of the
economy‟s income‟.264 We therefore need to restore the earnings of
workers as a proportion of national income to stave off future crises. The
blend of solutions could include strengthening the collective bargaining
power of workers,265 switching from labour income taxes to economic
rents (such as taxes on land, natural resources, or the financial sector),266 and tackling excessive incomes at the top of the distribution.267
Add in the social costs of continuing inequality, and the ecological imperative to decouple economic output from environmental resource
use, and it is clear that we need a new paradigm. The details are up for
debate, and should urgently be the subject of national conversation, but one thing is clear: there can be no return to business as usual.
Rethinking what we value as a
society
The social damage wrought by inequality, persistently high unemployment, and the unsustainable ecological footprint incurred in
achieving growth all tell us that it is not growth that matters, but the
type and distribution of growth. It is clear that our predominant mode of measuring economic success, GDP, is no longer fit for purpose (if it
ever was).
We therefore need to reconsider how we measure what we value as a society. Oxfam in Scotland is leading on this, through the development
of a Humankind Index, which is based on asking people in Scotland what matters to them, and then measuring those things, to see how well
Scotland is doing as a society.268 The UK government‟s commitment to
exploring measures of well-being is welcome,269 and Oxfam would encourage it to a adopt a similarly wide-ranging approach to the
Humankind Index, so that it can be sure that steps taken now will build
a new post-crisis economy and society that sustainably serve the interests of the British people. More emphasis should be placed upon
social return on investment, rather than on more conventional measures
based on cost and price.270
53
7 Conclusion and summary of urgent recommendations In the aftermath of the recession, economic stagnation, falling real
incomes, and public service cuts are all hitting people living in poverty the hardest. The combined impacts of all of these factors add up to a
Perfect Storm which is pushing people‟s livelihoods to breaking point.
The current government approach, of balancing the budget on the backs of the poorest, is not working, socially or economically.
The crisis we are in could be an opportunity to change thinking about what a fair society looks like, and to build the foundations for
overcoming poverty once and for all. In the long term, people,
government, and businesses must all be part of that effort. Yet we need
urgent action right now to reinvigorate both the economy and the social
safety-net on which most of us ultimately rely. We also need to do so in
a way which sets us on the road to a fair, productive, and sustainable society.
To defend the rights of people who are in poverty or vulnerable to poverty, and to start us on the road to economic recovery, we need
urgent action now on each aspect of the Perfect Storm. Only the state
has the resources and the reach to take these immediate steps. Therefore, we urge the government to:
• Protect the incomes of the low paid, reducing the withdrawal rate of Universal Credit from 65 per cent to 55 per cent to ensure that work
pays, and increasing the National Minimum Wage at least in line
with inflation or average earnings, whichever is the higher;
• Protect people in poverty from the increasing cost of living, by
giving new powers to Ofgem to cap fuel prices; introducing a maximum level of interest; and protecting the Social Fund and
expanding its resources, to protect people from exploitation and to
guard against problem debt;
• Protect public services, by using progressive taxation to slow the
speed and depth of cuts; ring-fencing the Sure Start grant to local authorities in England; and exploring investing in a national system
of universal child care, to make work pay for women and to build the
social infrastructure of the country;
• Protect the social safety-net, by giving local authorities in England
and Wales sufficient resources to maintain existing levels of Council Tax Benefit; monitoring the effect of the Housing Benefit and overall
benefit caps; reversing the switch from RPI to CPI inflation for
benefit uprating; maintaining real Child Benefit levels; and reversing cuts to child-care support;
• Provide secure, affordable, decent housing for all, by investing in affordable homes to boost the economy and to help solve the housing
crisis; and increasing maximum penalties for rogue landlords;
• Protect rights at work: the weak labour market is adding to the

54
power that employers have over workers, and so it is essential to maintain and enforce the vital protections that do exist for vulnerable
workers;
• Move towards a fairer tax system by clamping down on tax avoidance; introducing a Robin Hood Tax on financial transactions,
to help protect public services and benefits and ensure that everyone pays their fair share; and exploring options for a land value tax; and
• Rethink how we measure value: the social damage caused by inequality, high unemployment, and environmental degradation all
tell us that it is not growth that matters, but the type and distribution
of growth; measuring true social value through a measure of well-being such as Oxfam Scotland‟s Humankind Index will help us
to measure whether what we are doing to fix the economy is really,
sustainably benefiting society.

55
Notes
1 Department for Work and Pensions (DWP) (2011) „Households Below Average Income 1994/5–2009/10‟. Figures for 2009/10, May 2011
2 M. Haddad with A. Bance (2009) „Close to Home: UK poverty and the economic
downturn‟, Oxfam GB, April 2009 3 World Bank (2010). Countries ranked by GDP at purchaser‟s prices.
4 DWP (2011) „Households Below Average Income 1994/5–2009/10‟, op. cit.
5 Defined as having a household income below 60 per cent of median income.
6 DWP (2011) „Households Below Average Income 1994/5–2009/10‟, op. cit.; and
Institute for Fiscal Studies (IFS) (earlier years). 7 'DWP (2011) „Households Below Average Income1994/5–2009/10‟, op. cit. Figures for
1998/99 and 2008/09. 8 http://www.poverty.org.uk, calculated from DWP, „Households Below Average Income‟
(1994/95 onwards) and the Family Expenditure Survey (earlier years). 9 DWP (2011) „Households Below Average Income 1994/5–2009/10‟, op. cit.
10 DWP (2011) „Abstract of Statistics for Benefits, National Insurance Contributions, and
Indices of Prices and Earnings, 2010 Edition‟, July 2011. 11
Poverty risk among working-age adults is 70 per cent for unemployed families; 57 per cent for economically inactive families; and (notably) 28 per cent for those with some paid work. Source: DWP (2010) „Households Below Average Income 1994/95–2008/09‟, May 2010.
12 H. Reed and N. Lawson (2011) „Plan B: A good economy for a good society‟, Compass,
October 2011. 13
DWP, „Households Below Average Income‟ series. 14
C. Warburton Brown (2011) „Exploring BME Maternal Poverty: The financial lives of ethnic minority mothers in Tyne and Wear‟, Oxfam GB, January 2011.
15 Fawcett Society (2012) „The Impact of Austerity on Women‟, Policy Briefing, March
2012. 16
DWP (2011) „Households Below Average Income 1994/5–2009/10‟, op. cit. 17
Ibid. 18
See, for example, C. Warburton Brown (2011) op. cit. 19
Estimated at 16.4 per cent. Fawcett Society (2010) „Equal Pay: Where Next?‟, November 2010.
20 DWP (2011) „Households Below Average Income 1994/5–2009/10‟, op. cit.
21 Adjusting for regional price relativities. Institute for Fiscal Studies (IFS) (2011) „Poverty
and Inequality in the UK: 2011‟, May 2011. 22
DWP (2011) „Households Below Average Income 1994/5–2009/10‟, op. cit. 23
At 99 per cent of the UK average, ranking fourth of 12 regions and countries of the UK. Office for National Statistics (ONS) (2011) „Regional Gross Disposable Household Income (GDHI) 1995–2009‟, March 2011.
24 ONS (2009) „NUTS3 Regional Gross Value Added 1995-2007', December 2009.
25 Government Equalities Office (2010) „An Anatomy of Economic Inequality in the UK‟.
26 Department of Energy and Climate Change (DECC) (2011) „Annual Report on Fuel
Poverty Statistics 2011‟. 27
J. Hills (2011) „Fuel Poverty: The problem and its measurement‟, Interim Report of the Fuel Poverty Review, Department for Energy and Climate Change, October 2011.
28 Save the Children (2010) „The UK Poverty Rip-Off: The Poverty Premium 2010‟.
29 The Marmot Review (2010) „Fair Society, Healthy Lives‟.
30 K. Trebeck (forthcoming) „Our Economy‟, Oxfam GB.
31 ONS (2011) „Life Expectancy at Birth and at the Age 65 by Local Areas in the United
Kingdom 2004–06 to 2008–10‟, October 2011. 32
The Marmot Review (2010) op. cit. 33
For example, one study suggested that the loss of life from income inequality in the USA in 1990 was the equivalent of the combined loss of life due to lung cancer, diabetes, motor vehicle accidents, HIV-related causes, suicide, and homicide. J.W. Lynch et al. (1998) „Income inequality and mortality in metropolitan areas of the United States‟, American Journal of Public Health, 88(7), 1074–80.
34 DWP (2011) „Abstract of Statistics for Benefits, National Insurance Contributions, and
Indices of Prices and Earnings, 2010 Edition‟, op. cit. 35
For more detail, see C. Cochrane (2010) „Something for Nothing‟, Oxfam GB, May 2010.
36 National Institute of Economic and Social Research (NIESR).
http://www.niesr.ac.uk/images/progres3a.jpg

56
37
ONS (2012) „Economic Review – April 2012‟, 25 April 2012. 38
HM Treasury (2010) ‟Spending Review 2010', HM Treasury, October 2010. 39
Oxfam GB: UK Partner Survey, October 2011. 40
Seventy-seven per cent of partners surveyed. Oxfam GB: UK Partner Survey, op. cit. 41
D. Weldon (2011) „Far from cutting debt Osborne‟s plans will make it soar‟, False Economy, 29 March 2011. http://falseeconomy.org.uk/blog/household-debt-up
42 The Trussell Trust (2012) „UK foodbanks double numbers fed in one year‟, press
release: 26 April 2012. http://www.trusselltrust.org/resources/documents/UK-foodbanks-double-numbers-fed-in-one-year1.pdf
43 See, for example, Women‟s Budget Group (2005) „Women‟s and Children‟s Poverty:
Making the links‟. 44
IFS (2011) „Child and Working-Age Poverty from 2010 to 2020‟, October 2011. 45
According to the IFS, real household incomes from 2008–11 will have fallen by 1.6 per cent. IFS (2011) „Living Standards during the Recession‟, March 2011
46 ONS (2012) „Average Weekly Earnings‟, April 2012.
47 ONS, Consumer Price Index – Time Series data, retrieved May 2012.
48 ONS (2011) „2011 Annual Survey of Hours and Earnings‟, November 2011.
49 Chartered Institute of Personnel and Development (CIPD) (2011) „Employee Outlook:
Focus on pay‟, August 2011. 50
ONS. Figures for the NMW increase and CPI inflation respectively were: October 2008, 3.8 per cent and 4.5 per cent; October 2009, 1.5 per cent and 1.5 per cent; October 2010, 2.2 per cent and 3.2 per cent; October 2011, 2.5 per cent and 5 per cent.
51 ONS (2011) „2011 Annual Survey of Hours and Earnings‟, op. cit.
52 Incomes Data Service (2011) „FTSE 100 directors get 49 per cent increase in total
earnings‟, press release, 26 October 2011. 53
The High Pay Commission (2011) „Cheques With Balances: Why tackling high pay is in the national interest, Final report „, November 2011.
54 DWP (2010) „Households Below Average Income 1994/95–2008/09‟, op. cit.
55 IFS (2011) „Poverty and Inequality in the UK: 2011‟, May 2011.
56 IFS (2010) „The Distributional Effect of Tax and Benefit Reforms to be Introduced
between June 2010 and April 2014: A revised assessment‟, August 2010. 57
ONS (2012) „Labour Force Survey‟, March 2012. 58
ONS (2012) „Public Sector Employment – Q4 2011‟, March 2012. 59
ONS (2012) „Labour Force Survey‟, March 2012. 60
Ibid. 61
See, for example, D.N.F. Bell and D.G. Blanchflower (2011) „Young People and the Great Recession‟, IZA, April 2011.
62 B. Coles, C. Godfrey, A. Keung, et al. (2010) „Estimating the Life-time Cost of NEET:
16–18 year olds not in Education, Employment or Training‟, University of York. 63
The Labour Market Outlook net employment index, which measures the difference between the proportion of employers who intend to increase total staffing levels and those who intend to reduce them, stands at -8; this is the worst net employment balance score since the recession began. CIPD (2012) „Labour Market Outlook, Winter 2011–12‟, February 2012.
64 B. Athwal, L. Brill, G. Chesters, and M. Quiggin (2011) „Recession, Poverty and
Sustainable Livelihoods in Bradford‟, Joseph Rowntree Foundation (JRF), p.27. 65
ONS (2012) „Labour Market Statistical Bulletin: March 2012 ‟, p.2. 66
Oxfam GB: UK Partner Survey, op. cit. 67
The share of wages as a proportion of GDP peaked at a high of 64.5 per cent in 1975. It then started drifting downwards reaching a post-war low of 51.7% in 1996. In 2008, the share of wages was 53.2%. ONS cited in Trades Union Congress (2009), 'Unfair to Middling: How Middle Income Britain's shrinking wages fuelled the crash', Trades Union Congress.
68 Between 1977 and 2010, people in the bottom half of earnings distribution saw their
share of gross value added (GVA) drop from 16.2 per cent to 12 per cent, and the bottom 10 per cent saw their share drop from 1.2 per cent to 0.8 per cent. Resolution Foundation (2011) „Missing Out‟.
69 Between 1977 and 2010, the share of GVA accrued as capital (profits and business
return) increased from 36 per cent to 39 per cent, the top 10 per cent of earners increased their share of GVA from 11.7 per cent to 14.2 per cent, and the top 1 per cent increased their share from 2 per cent to 3.1 per cent. Ibid.
70 S. Lansley (2011) „Britain‟s Livelihood Crisis‟, Trades Union Congress.
71 ClearDebt (2011) „2010: Unsecured Debt Amongst Poorest Households Goes Up‟.
72 ONS, Consumer Price Indices – Time Series data, retrieved April 2012. The current
(April 2012) rate of inflation is 3.0 per cent (CPI; 3.5 per cent RPI). 73
ONS (2011) „The Effects of Taxes and Benefits on Household Income, 2009/10‟, May 2011.
74 ONS (2011) „Poorest Households Spending More on VATable Items than in 1986‟,

57
October 2011.
75 March 2007 to March 2012, calculations based on ONS, Consumer Price Indices –
Time Series data, retrieved May 2012. 76
Government Office for Science (2011) „The Future of Food and Farming. Final Project Report‟, Government Office for Science.
77 IFS (2011) „The Spending Patterns and Inflation Experience of Low-Income
Households over the Past Decade‟, P. Levell and Z. Oldfield, June 2011. 78
M. Brough (2011), Deutsche Bank, cited in Daily Mail (2011), 'Gas and electricity prices are set to soar by an average of £500 over next four years', 14 May 2011. http://www.dailymail.co.uk/news/article-1386847/Gas-electricity-prices-set-soar-50-year.html
79 Consumer Focus (2011), 'Fuel Poverty Statistics NowCast 2011', November 2011.
http://www.consumerfocus.org.uk/files/2011/10/Estimated-UK-fuel-poverty-levels-in-November-2011-xlsx-247-KB.xlsx
80 Save the Children (2010) „The UK Poverty Rip-Off: The Poverty Premium 2010‟.
81 IFS (2011) „The Spending Patterns and Inflation Experience of Low-Income
Households over the Past Decade‟, op. cit. 82
JRF (2011) „A Minimum Income Standard for the UK in 2011‟, D. Hirsch, July 2011. 83
Oxfam GB: UK Partner Survey, op. cit. 84
HM Treasury (2012) „Budget 2012‟. 85
A loss in income and services equivalent to 20.3 per cent of household income for the poorest tenth of households, and 1.5 per cent of household income for the richest tenth. T. Horton and H. Reed (2010) „Where the Money Goes: How We Benefit From Public Services‟, Trades Union Congress (TUC), September 2010.
86 D. Taylor-Robinson (2011) „Bigger cuts to local authority budgets in the most deprived
areas are likely to widen health inequalities‟, London School of Economics, 4 April 2011. http://blogs.lse.ac.uk/politicsandpolicy/2011/04/04/bigger-cuts-to-most-deprived-local-authorities-widen-health-inequalities/; and Channel 4 (2011) „Minister admits poorest areas will be hardest hit by cuts‟, 31 March 2011. http://www.channel4.com/news/minister-admits-poorest-areas-will-be-hardest-hit-by-cuts
87 NEWomen‟s Network (2011) „Findings of the Health of the Women‟s Sector in the
North East‟, December 2011. 88
Ibid. 89
See Centre for Human Rights in Practice, University of Warwick and Coventry Women‟s Voices (2011) „Unravelling Equality? A Human Rights and Equality Impact Assessment of the Public Spending Cuts on Women in Coventry‟; and Bristol Fawcett Society (2011) „Cutting Women Out in Bristol
90 Hansard (2011) Written Answer, 14 November 2011.
http://www.publications.parliament.uk/pa/ld201011/ldhansrd/text/111114-0001.htm 91
Fawcett Society (2012) „The Impact of Austerity on Women‟, op cit.. 92
Organisation for Economic Cooperation and Development (OECD) (2011) „Doing Better for Families‟.
93 JRF (2011) „A Minimum Income Standard for the UK in 2011‟, op. cit.
94 Welsh Assembly Government (2010) „Eradicating Child Poverty in Wales: Child
Poverty Milestones and Targets Update‟, November 2010. 95
Public sector employment fell from 6.212 million in Q4 2010 to 5.942 million in Q4 2011. ONS (2012) „Public Sector Employment – Q4 2011 Statistical Bulletin‟, March 2012.
96 Trades Union Congress (TUC) (2012) „Women‟s Pay and Employment Update: A
public/private sector comparison‟, March 2012. 97
Women‟s Budget Group (2011) „Osborne & his team propose „stealth tax‟ on women”‟ press release, 20 October 2010 http://www.wbg.org.uk/documents/WBG_CSR_Announcement_Press_Release_20_October_2010.pdf
98 Gingerbread (2011) „Tax credit cuts will hammer hard-working single parents‟, 10
March 2011. http://www.gingerbread.org.uk/news/99/Tax-credit-cuts-hammer-single-parents
99 From 20.6 per cent in November 1979 to 10.9 per cent in April 2010. DWP (2011)
„Abstract of Statistics for Benefits, National Insurance Contributions, and Indices of Prices and Earnings, 2010 Edition‟, op. cit.
100 Ibid. Calculations based on ratio of unemployment benefits to earnings in November 1979 and April 2010.
101 IFS (2010) „The Distributional Effect of Tax and Benefit Reforms to be Introduced between June 2010 and April 2014: A revised assessment‟.
102 Cutswatch Cymru (2012) „Wales on the Edge: An overview of the current and predicted impact of welfare reforms on people and communities across Wales‟, February 2012.
103 For the experiences of an Oxfam partner, the Clydebank Independent Resource Centre, relating to the introduction of Employment and Support Allowance, see C. Collins (2009) „To Banker, From Bankies: Incapacity Benefit: Myth and Realities‟,

58
Oxfam GB.
104 Oxfam GB‟s UK Partner Survey, op. cit.
105 It reports that 11.47 per cent received crisis food support due to „benefit changes‟ and 29.59 per cent due to „benefit delay‟. Trussell Trust (2012) „Trussell Trust Foodbank Network Summary for Financial Year 2011–12‟, April 2012.
106 Cutswatch Cymru (2012) „Wales on the Edge‟, op. cit.
107 Fawcett Society (2012) „The Impact of Austerity on Women‟, op. cit.
108 Fawcett Society (2005) „Who Benefits? A gender analysis of the UK benefits and tax credits system‟.
109 Gender audit of the June 2010 Emergency Budget, commissioned by Yvette Cooper M.P. http://www.yvettecooper.com/uploads/80cd9d9f-7659-7584-2578-8d558da3ccc1.xls
110 The Guardian (2010) „Cuts will hit women twice as hard as men, Commons research shows‟, 22 October 2010. http://www.guardian.co.uk/politics/2010/oct/22/cuts-women-spending-review
111 See, for example, D. Hirsch (2011) „Childcare Support and the Hours Trap‟, Resolution Foundation, May 2011.
112 For more detail on these arguments, see J. Veitch (2010) „A Gender Perspective on 21st Welfare Reform‟, Oxfam GB, October 2010.
113 This is explored in more detail in Part 5 of this paper.
114 Communities and Local Government (2009) „Local Authority Housing Statistics, England: 2007/08: Housing Strategy Statistical Appendix and Business Plan Statistical Appendix‟.
115 Communities and Local Government (2007) „Homes for the Future: More Affordable, More Sustainable‟.
116 Communities and Local Government (2011) „House Building: March Quarter 2011, England‟, May 2011.
117 As at 31 March 2011. The Scottish Government (2011) „Housing Statistics for Scotland – Housing Lists‟, September 2011.
118 As at end December 2011. The Scottish Government (2012) „Quarterly Reference Tables: Households in temporary accommodation to 31 December 2011‟, March 2012.
119 A fall from 25,741 in 2007 to 15,150 in 2011. The Scottish Government (2012) „Housing Statistics for Scotland – All sector new build‟, May 2012.
120 General Register Office for Scotland (2010) „Household Projections for Scotland, 2008-based‟, May 2010.
121 B. Turffrey (2010) „The Human Cost: How the lack of affordable housing impacts on all aspects of life‟, Shelter, March 2010.
122 Ibid.
123 Communities and Local Government (2012) „Statutory Homelessness: October–December Quarter 2011, England‟, March 2012.
124 Welsh Government (2012) „Homelessness, October to December 2011‟, April 2012.
125 Scottish Government (2012) „Operation of the Homeless Persons Legislation in Scotland: Quarters ending 30 June and 30 September 2011 (including households in temporary accommodation at 31 December 2011‟, February 2012.
126 Nationwide Building Society, House Price Index, Q2 2011.
127 Clydesdale and Yorkshire Banks (2011) 84 percent of first time buyers rely on parental support, 26 May 2011 http://www.cbonline.co.uk/media/news-releases/2011/84-percent-of-first-time-buyers-rely-on-parental-support The figure for 2005 was 38 per cent, according to the Council of Mortgage Lenders.
128 In the decade to 2006, the number of recipients in the private rented sector fell by 21 per cent from 1,066,000 to 838,000, while their average weekly Housing Benefit increased by 47 per cent, from £58 to £85. As a proportion of all benefits and tax credits, Housing Benefit has remained relatively stable at around 14 per cent of the total for the past 20 years, yet total expenditure has risen sharply, with increased rents, from £12bn in 2003/04 to over £20bn in 2009/10. Building and Social Housing Foundation (2010) „Support with Housing Costs: Developing a simplified and sustainable system‟.
129 The average house price in Q3 2008 was £165,188, and stood at £162,722 for Q1 2012. Nationwide Building Society, House Price Index.
130 Defined as a median private rent for a two-bedroom house which costs more than 35 per cent of median take-home pay. Shelter (2011) „Private Rent Watch, Report One‟, October 2011.
131 Cambridge Centre for Housing and Planning Research (2011) „Market-Pegged Social Rents and Local Income Distributions‟, University of Cambridge, July 2011.
132 In February 2012, the average rent in England and Wales fell by 0.6 per cent to £707 per month, following a rise in January. Despite the monthly drop, rents continue to rise on an annual basis, increasing by 3.5 per cent. LSL Property Services, „Buy-to-Let Index‟, September 2010, September 2011, February 2012.
133 Research by Halifax for Guardian Money, 11 November 2011.

59
http://www.guardian.co.uk/money/2011/nov/11/rental-market-reaches-crisis-point?INTCMP=SRCH
134 Netmums forum, March 2011. http://www.netmums.com/coffeehouse/house-garden-194/money-finance-entitlements-267/550208-housing-benefit-cuts-will-i-forced-move.html
135 An increase for in-work claimants from 430,160 in November 2008 to 878,190 in February 2012, against an increase for out-of-work claimants from 3,741,780 in November 2008 to 4,126,310 in February 2012. DWP (2012) „Housing Benefit and Council Tax Caseload‟, statistical release, May 2012.
136 Hansard (2010) Written Answer, 5 March 2010. http://www.publications.parliament.uk/pa/cm200910/cmhansrd/cm100305/text/100305w0002.htm#10030529000282
137 The Guardian (2012) „Housing benefit cap forces families to leave central London or be homeless‟, 16 February 2012. http://www.guardian.co.uk/society/2012/feb/16/housing-benefit-cap-families-central-london
138 Quoted in The Independent (2011) „Anger as social housing rents set to rise‟, 20 October 2011. http://www.independent.co.uk/news/uk/politics/anger-as-social-housing-rents-set-to-rise-2111879.html
139 For four-bedroom properties rented by the L&Q housing association, rent would increase from £168 per week to £390 per week, an increase of 210 per cent. London Assembly Planning and Housing Committee (2011) „Implications of the Affordable Rent Model in London‟, July 2011.
140 National Housing Federation (2011) „Briefing on Welfare Reform Bill, Second Reading (Lords)‟, October 2011.
141 National Housing Federation (2010) „Comprehensive Spending Review – A Briefing for National Housing Federation Members‟, October 2010.
142 For more detail on the importance of housing as an asset in constructing a sustainable livelihood, see J. Viitanen, „Homes and Neighbourhoods‟ in E. Cox (ed.) (2011) „Community Assets First: The implications of the Sustainable Livelihoods Approach for the Coalition agenda‟, Church Action on Poverty, IPPR North, Oxfam, Urban Forum, October 2011.
143 Communities and Local Government (2011) „Localism Bill: A fairer future for social housing: impact assessment‟, January 2011, p.39.
143 TUC (2008) 'Hard Work, Hidden Lives: The Full Report of the Commission on Vulnerable Employment', May 2008
145 European Women's Lobby and Oxfam International (2010) 'Women's poverty and social exclusion in the European Union at a time of recession: An Invisible Crisis?', March 2010.
146 Cutswatch Cymru (2012) „Wales on the Edge‟, op. cit.
147 See, for example, H. Reed (2010) „Flexible with the Truth? Exploring the Relationship between Labour Market Flexibility and Labour Market Performance‟, Landman Economics,, p.8.
148 Ibid., p.9.
149 Ibid., p.66.
150 European Foundation for the Improvement of Living and Working Conditions (2010) „Flexible Forms of Work: “Very atypical” contractual arrangements‟, pp.10-11.
151 TUC (2008) 'Commission on Vulnerable Employment: Full Report'.
152 Ibid.
153 H. Bewley and J. Forth (2010) „Vulnerability and Adverse Treatment in the Workplace‟, Employment Relations Research Series 112, Department for Business, Innovation and Skills, September 2010.
154 See, for example, The Telegraph (2010) „Tesco‟s temp agencies to waive new EU rights on workers‟ pay‟, 22 October 2011. http://www.telegraph.co.uk/finance/newsbysector/retailandconsumer/8843393/Tescos-temp-agencies-to-waive-new-EU-rights-on-workers-pay.html
155 N. Hossain et al. (2011) „The Impact of the Global Economic Downturn on Communities and Poverty in the UK‟, JRF, p.34.
156 Full-time employment has fallen by 830,880 jobs; part-time employment has increased by 500,283; temporary employment has increased by 138,786. ONS (2012) „Labour Force Survey‟, May 2012.
157 J. Philpott (2010) „The 2010 Jobs Recovery‟, CIPD, p.2.
158 1.123 million in October-December 2011, and 1.120 million in January-March 2012. ONS (2012) 'Labour Force Survey', May 2012.
159 From 9.1 per cent to 18 per cent. ONS (2012) „Labour Force Survey‟, May 2012.
160 Ibid.
161 John Philpott, (2012), 'The Rise in Self-Employment', Chartered Institute of Personnel and Development, January 2012.
162 HM Government, Open Public Services, July 2011.
163 A. Rogers (2009) „Recession, Vulnerable Workers and Immigration‟, Centre on

60
Migration, Policy and Society, University of Oxford, p.33. 164
UNISON (2010) „The Hidden Workforce‟, p.1. 165
D. Julius (2008) „Understanding the Public Services Industry: How big, how good, where next?‟, Department for Business, Enterprise and Regulatory Reform.
166 Citizens Advice (2010) „Evidence, Winter 2010‟, p.10.
167 Citizens Advice (2011) „Give Us A Break!‟, p.6.
168 M. Dunne (2012) „My job was replaced by a workfare placement‟, The Guardian, 3 March 2012. http://www.guardian.co.uk/commentisfree/2012/mar/03/job-replaced-workfare-placement
169 Citizens Advice (2010) „Evidence: Winter 2011‟.
170 CIPD (2011) „The Economic Rights and Wrongs of Employment Regulation‟, p.11.
171 Ibid., p.11.
172 TUC (2011) „Jobless Cleaners, Caterers and Machine Operators amongst Those Most at Risk of Long-Term Unemployment‟, 12 December 2011.
173 Daily Telegraph (2011) „Give firms freedom to sack unproductive workers, leaked Downing Street report advises‟, 25 October 2011.
174 Dominic Raab M.P. (2011) „Red-tape in business is socially unjust, as well as being economically uncompetitive‟, Conservative Home, 16 November 2011.
175 H. Reed (2010) „Flexible with the Truth?‟, op. cit., p.9.
176 H. Metcalf and A. Dhudwar (2010) „Employers‟ Role in the Low-Pay/No-Pay Cycle‟, JRF.
177 The Guardian (2011) „Young jobseekers told to work without pay or lose unemployment benefits‟, 16 November 2011. http://www.guardian.co.uk/society/2011/nov/16/young-jobseekers-work-pay-unemployment
178 TUC (2011) „Labour Market Report, Number 19‟, October 2011.
179 For more on the experiences of Oxfam‟s partners of the informal economy, see Community Pride Initiative and Oxfam GB (2009) „Invisible Workers: The Informal Economy‟.
180 For arguments in favour of a taper rate of benefit withdrawal of 55 per cent rather than the currently proposed 65 per cent, see Centre for Social Justice (2009) „Dynamic Benefits: Towards welfare that works‟, September 2009.
181 T. Horton and H. Reed (2010) „Where the Money Goes: How We Benefit From Public Services‟, op. cit.
182 James Browne (2010) 'Distributional analysis of tax and benefit changes', Institute for Fiscal Studies, 21 October 2010.
183 Gender audit of the June 2010 emergency budget, commissioned by Yvette Cooper M.P., op. cit.; and Fawcett Society (2012) „Benefits and service cuts hitting women hardest‟. http://www.fawcettsociety.org.uk/index.asp?PageID=1237
184 Fawcett Society and IFS (2011) „Single Mothers: Singled Out: The impact of 2010–15 tax and benefit changes on women and men‟, June 2011.
185 Investment by UK businesses fell by nearly 20 per cent from 2007 to 2009, and is now £44.5bn below its pre-recession peak, accounting for 80 per cent of the output lost since 2008. H. Reed and N. Lawson (2011) „Plan B: A good economy for a good society‟, op. cit.
186 See M. Wolf (2011) „We must listen to what bond markets tell us‟, Financial Times, 6 September 2011. http://www.ft.com/cms/s/0/9cbe577a-d872-11e0-8f0a-00144feabdc0.html#axzz1dydoTRdw
187 Channel 4 News (2011) „Who‟s deceiving who?‟, Factcheck blog, 6 January 2011. http://blogs.channel4.com/factcheck/whos-deceiving-who-on-the-deficit/5465
188 NIESR. http://www.niesr.ac.uk/images/progres3a.jpg
189 ONS (2012) „Economic Review – April 2012‟, op. cit.
190 The IMF has performed simulations which suggest that implementing spending cuts and/or tax rises to close a fiscal deficit equal to 1 per cent of national output typically reduces output by around 0.5 per cent within two years and raises the unemployment rate by about 0.3 per cent, while domestic demand falls by about 1 per cent. International Monetary Fund (IMF) (2010) „World Economic Outlook‟, Chapter 3, October 2010.
191 The Treasury suggests that a 1 per cent reduction in GDP relative to trend increases the Public Sector Borrowing Requirement (PSBR) by around 0.75 per cent. HM Treasury (2008) „Public Finances and the Cycle‟, November 2008.
192 NIESR has suggested that, because of the weakness of the economic recovery, even if the government manages to meet its targets for spending reductions over the next four years, public sector net borrowing will fall only to 3.6 per cent of GDP in 2015–16 rather than the 1.5 per cent that the Office for Budget Responsibility projects (missing the government‟s target for balancing the budget by around 2 per cent of national output, or about a third of the total size of the fiscal consolidation). NIESR (2011) „Prospects for the UK Economy‟, May 2011. http://www.niesr.ac.uk/pdf/040511_230126.pdf

61
193
IMF (2010) „A Fair and Substantial Contribution by the Financial Sector‟. 194
TUC (2012) „Budget Submission 2012‟, March 2012. 195
ONS. Figures for the NMW increase and CPI inflation respectively were: October 2008, 3.8 per cent and 4.5 per cent; October 2009, 1.5 per cent and 1.5 per cent; October 2010, 2.2 per cent and 3.2 per cent; October 2011, 2.5 per cent and 5 per cent.
196 Centre for Social Justice (2009) „Dynamic Benefits: Towards Welfare That Works‟, September 2009.
197 Ofgem (2011) „Electricity and Gas Supply Market Report‟, 14 October 2011.
198 See „End the Big 6 Energy Fix‟ campaign statement. http://action.compassonline.org.uk/page/content/campaign-statement/
199 See Fawcett Society (2011) „A life raft for women‟s equality‟, November 2011. http://www.fawcettsociety.org.uk/documents/A%20Life%20Raft%20for%20Women%27s%20Equality%20FINAL%281%29.pdf
200 See R. Skidelsky and F. Martin (2011) „A way out of Britain‟s growth dilemma‟, Financial Times, 20 March 2011.
201 OECD (2011) „Divided We Stand: Why Inequality Keeps Rising, Country Note: United Kingdom‟, December 2011.
202 International Labour Organization (2011) „Social protection floor for a fair and inclusive globalization: Report of the Advisory Group chaired by Michelle Bachelet, Convened by the ILO with the collaboration of the WHO‟, ILO, Geneva.
203 The Scottish Government (2012) „Council tax support to be protected‟, press release, 19 April 2012. http://www.scotland.gov.uk/News/Releases/2012/04/counciltax19042012
204 See Fawcett Society (2011) „A life raft for women‟s equality‟, op. cit.
205 Institute for Public Policy Research (IPPR) (2011) „The Good, the Bad and the Ugly: Housing demand 2025‟, March 2011.
206 Shelter (2010) „Housing Investment Part 1‟, June 2010.
207 Shelter (2011) „Housing Investment Part 2‟, January 2011.
208 An increase from £58 to £85 in the decade to 2006. Building and Social Housing Foundation (2010) „Support with Housing Costs: Developing a simplified and sustainable system‟.
209 Energy Saving Trust „Home Economics: Cutting carbon and creating jobs, by nation and region‟, March 2011.
210 Ibid.
211 B. Turffrey (2010) „The Human Cost: How the lack of affordable housing impacts on all aspects of life‟, op. cit.
212 R. de Santos (2011) „Policy Briefing: Asserting Authority – Calling time on rogue landlords‟, Shelter, September 2011.
213 V. Monastiriotis (2006) „Employment Flexibility and UK Regional Unemployment: Persistence and Macroeconomic Shocks‟, Department for Trade and Industry.
214 CIPD (2011) „The Economic Rights and Wrongs of Employment Regulation‟, p.2.
215 See K. Poinasamy (2011) „When Work Won‟t Pay: In-work poverty in the UK‟, Oxfam GB, November 2011.
216 D. Leighton and T. Gregory (2011) „Reinventing the Workplace‟, Demos.
217 K. Poinasamy with A. Bance (2009) „Turning the Tide‟, Oxfam GB, July 2009.
218 „The current employment status regime leaves some classes of worker with very few rights. “Employees” enjoy full employment rights, but „workers‟, usually employed by agencies, do not have the right to claim unfair dismissal, redundancy pay, or sick pay, or request time to train. Of particular significance to working parents is the lack of the right to request flexible working, maternity pay or leave, or time off for emergencies. The third category in the employment status regime, “self-employed”, refers to workers who produce goods and services for a range of customers and take responsibility for both their own working practices and for setting the price for the work that they do. If the worker is genuinely independent and working for a number of customers they should be able to set a fair price for their work, but the category is open to abuse (“false self-employment”) and can be used by companies to evade their responsibilities as employers.‟ Taken from K. Poinasamy (2011) „When Work Won‟t Pay‟, op. cit.
219 See, for example, James Browne (2010) 'Distributional analysis of tax and benefit changes', op. cit.
220 The UK government (HMRC) defines the tax gap as: „the difference between tax collected and the tax that should be collected (the theoretical liability). The theoretical tax liability represents the tax that would be paid if all individuals and companies complied with both the letter of the law and HMRC‟s interpretation of the intention of Parliament in setting law (referred to as the spirit of the law). The tax gap estimate is net of the Department‟s compliance activities. An equivalent way of defining the tax gap is the tax that is lost through non-payment, use of avoidance schemes, interpretation of tax effect of complex transactions, error, failure to take reasonable care, evasion, the hidden economy and organised criminal attack‟. HMRC (2011) „Measuring Tax Gaps 2011‟, September 2011.

62
221
Richard Murphy (2012), 'Why are they increasing the tax gap?‟, Public and Commercial Services Union, May 2012.
222 See „Tax by Design‟, the Mirrlees Review, IFS, September 2011, pp.470-503.
223 Sources for the data on the infographic: Tax gap: HM Revenue and Customs (2011) „Measuring the Tax Gap 2011‟, 21 September 2011; cost of education system in England: Department for Education (2012) „Statistical Release‟, Department for Education, 25 January 2012; cost of unemployment benefits, incapacity benefits, ESA, and Social Fund: DWP (2011) 'Autumn 2011 Summary table: Benefit expenditure, Department for Work & Pensions and predecessors'; cost of Sure Start before cuts: Channel 4 (2011) „Is Cameron sure about that Sure Start budget?‟, 9 February 2011; cost of insulation in Britain: Local Government Association (2008) Switched off, switched on: how to cut every household’s carbon footprint and energy bill.
224 For more on the benefits and feasibility of a unilateral UK financial transaction tax, see Robin Hood Tax campaign (2011) „There is an Alternative: Time for a Robin Hood Tax‟, policy brief.
225 T. Dolphin (2010) „Financial Sector Taxes‟, IPPR, June 2010.
226 VAT takes up 12.1 per cent of the incomes of the poorest 20 per cent, compared with 5.9 per cent of the richest 20 per cent. A. Barnard (2009) „The effects of taxes and benefits on household income, 2007/08‟, Economic & Labour Market Review, Vol. 3, No 8, August 2009. http://www.statistics.gov.uk/elmr/08_09/downloads/ELMR_Aug.pdf
227 See IMF (2010) „Taxing Financial Transactions: Issues and Evidence‟, September 2010.
228 ONS (2011) „The Effects of Taxes and Benefits on Household Income, 2009/10‟, op. cit.
229 See R. Lister, „Poverty, material insecurity, and income vulnerability: the role of savings‟, in S. Sodha and R. Lister (2006) „The Saving Gateway: From Principles to Practice‟, London: IPPR, pp.8-33: and L. Brill and M. Haddad, „The Sustainable Livelihoods Approach‟, in E. Cox (2011) „Community Assets First‟, op. cit., pp.9-16.
230 S. White (2003) The Civic Minimum: On the Rights and Obligations of Economic Citizenship, Oxford: Oxford University Press.
231 See IFS (2011) „Tax by Design‟, op. cit., pp.368-405.
232 See M. Kumhof and R. Rancière (2010) „Inequality, Leverage and Crises‟, IMF Working Paper, November 2010.
233 See IFS (2011) „Tax by Design‟, op. cit., pp.470-503.
234 M. Brewer and D. Phillips (2010) „IFS Analysis on the “Living Wage”‟, IFS.
235 ActionAid (2012) 'Collateral damage: How government plans to water down UK anti-tax haven rules could cost developing countries - and the UK - billions', March 2012
236 R. Wilkinson and K. Pickett (2009) The Spirit Level: Why More Equal Societies Almost Always Do Better.
237 R. Gower, C. Pearce, and K. Raworth (2012) „Left Behind by the G20? How inequality and environmental degradation threaten to exclude poor people from the benefits of economic growth‟, Oxfam International, January 2012.
238 According to the Global Footprint Network, the UK‟s per capita biocapacity is around 1.4 global hectares (a common unit based on all the biologically productive land and sea area in the world in a given year), and its per capita eco footprint is around 4.8. See http://www.footprintnetwork.org/en/index.php/GFN/page/trends/unitedkingdom/
239 R. Gower, C. Pearce, and K. Raworth (2012) „Left Behind by the G20?‟, op. cit.
240 R. Wilkinson and K. Pickett (2009) The Spirit Level, op. cit.
241 'Whose Economy' seminar series, Oxfam Scotland focus groups, Oxfam Scotland, 2011
242 T. Kasser (2002) The High Price of Materialism, MIT Press, Cambridge.
243 S. Carlisle, P. Hanlond, and M. Hannah (2008) „Status, taste and distinction in consumer culture: acknowledging the symbolic dimensions of inequality‟, Public Health, 122: 6 631-637.
244 See also K. Trebeck (forthcoming) „Our Economy‟, Oxfam GB.
245 R. Wilkinson and K. Pickett (2009) The Spirit Level, op. cit. The key findings of The Spirit Level were found to hold, in light of critiques of that work and of the broader peer-reviewed literature, in K. Rowlingson (2011) „Does Income Inequality Cause Health and Social Problems?‟, JRF, September 2011.
246 R. Gower, C. Pearce, and K. Raworth (2012) „Left Behind by the G20?‟, op. cit.
247 F. Bourguignon (2002–03) „The Growth Elasticity of Poverty Reduction: Explaining heterogeneity across countries and time periods‟, Département et Laboratoire d'Economie Théorique et Appliquée, Paris. See also: Oxfam (2011) „Making Growth Inclusive: Some lessons from the literature and from countries‟, Washington DC: Oxfam.
248 F. Bourguignon (2004) „The Poverty-Growth-Inequality Triangle‟, Indian Council for Research on International Economic Relations, New Delhi.
249 DWP (2010) „Households Below Average Income 1994/95–2008/09‟, op. cit.

63
250
The UK‟s Gini co-efficient of inequality ranks 8th out of 34 in the OECD. OECD (2011) „Growing Income Inequality in OECD Countries: What Drives it and How Can Policy Tackle it?‟, Forum, Paris, 2 May 2011.
251 M.
Whittaker and L. Savage (2011) „Missing Out: Why ordinary workers are
experiencing growth without gain‟, London: Resolution Foundation. 252
High Pay Commission (2011) „Interim Report‟, May 2011. 253
S. Lansley (2011) „Britain‟s Livelihood Crisis‟, TUC. 254
H. Reed and N. Lawson, „Plan B: A good economy for a good society‟, op. cit. 255
S. Lansley (2011) The Cost of Inequality: Three Decades of the Super-Rich and the Economy, Gibson Square.
256 S. Lansley (2011) „Britain‟s Livelihood Crisis‟, TUC.
257 B. Milanovic (2010) „The Haves and the Have Nots: A Brief and Idiosyncratic History of Global Inequality‟.
258 M. Kumhof and R. Rancière, „Inequality, Leverage and Crises‟, op. cit.
259 M. Kumhof and R. Rancière (2010) „Leveraging Inequality‟, Finance and Development, December 2010.
260 See, for example, T. Persson and G. Tabellini (1994) „Is inequality harmful for growth?‟, American Economic Review, Volume 84, Issue 3, pp.600-621; and A. Alesina and D. Rodrik (1994) „Distributive politics and economic growth‟, Quarterly Journal of Economics (109).
261 Asian Development Bank (2011) „Asia 2050: Realizing the Asian Century‟.
262 A. Berg and J. Ostry (2011) „Inequality and Unsustainable Growth: Two Sides of the Same Coin‟, IMF Staff Discussion Note, April 2011.
263 R. Gower, C. Pearce, and K. Raworth (2012) „Left Behind by the G20?‟, op. cit.
264 M. Kumhof and R. Rancière (2010) „Leveraging Inequality‟, op. cit.
265 Ibid.
266 M. Kumhof and R. Rancière (2010) „Inequality, Leverage and Crises‟, op. cit.
267 High Pay Commission (2011) „Interim Report‟, op. cit.
268 Friends of the Earth Scotland, Oxfam Scotland, and WWF Scotland (2011) „Revising Scotland‟s National Performance Framework‟, September 2011; see also www.oxfam.org.uk/humankindindex
269 See ONS (2011) „Measuring National Well-Being – Discussion paper on domains and measures‟, October 2011.
270 See Cabinet Office (2009) „A Guide to Social Return on Investment‟, Office of the Third Sector, April 2009.

64
© Oxfam GB June 2012
This paper was written by Moussa Haddad. Oxfam acknowledges the
assistance of Krisnah Poinasamy, Joana Martinho, Louie Fooks, Kate
Raworth, Ruth Kelly, Nicola Hughes (Shelter), and Fiona King (Shelter
Scotland) in its production. Infographics created by Garth Stewart. It is part of a
series of papers written to inform public debate on development and
humanitarian policy issues.
Oxfam would like to thank the many individuals who have shared their
experiences of working poverty with us. Some names have been changed.
Some quotes and case studies have previously been published in other Oxfam
papers. All quotes and case studies relate to experiences reported in the past
two years.
This publication is copyright but the text may be used free of charge for the
purposes of advocacy, campaigning, education, and research, provided that
the source is acknowledged in full. The copyright holder requests that all such
use be registered with them for impact assessment purposes. For copying in
any other circumstances, or for re-use in other publications, or for translation or
adaptation, permission must be secured and a fee may be charged. E-mail
For further information on the issues raised in this paper please e-mail
The information in this publication is correct at the time of going to press.
Oxfam’s work in the UK: Oxfam works to overcome poverty in the UK in
three ways. We develop projects with people living in poverty to improve their
lives and show how things can change; we raise public awareness of poverty
to create pressure for change; and we work with policy makers to tackle the
causes of poverty. For more information visit www.oxfam.org.uk/uk
www.oxfam.org.uk Published by Oxfam GB under ISBN 978-1-78077-118-2 in June 2012. Oxfam GB, Oxfam House, John Smith Drive, Cowley, Oxford, OX4 2JY, UK.