the perception and production of lexical stress by l2 learners...
TRANSCRIPT
The Perception and Production of Lexical Stress by L2 Learners of Arabic:a Usage-Based Account
Cheng-Wei Lin (cwlin@umich)
Motivation
• Observation from language classroom
• Limited discussion in the literature
• Emerging discussion of frequency effect on language processing
2
From the Arabic classroom
• Foreign Accent derided from misplacement of stress
• Variability in L2 stress production
3
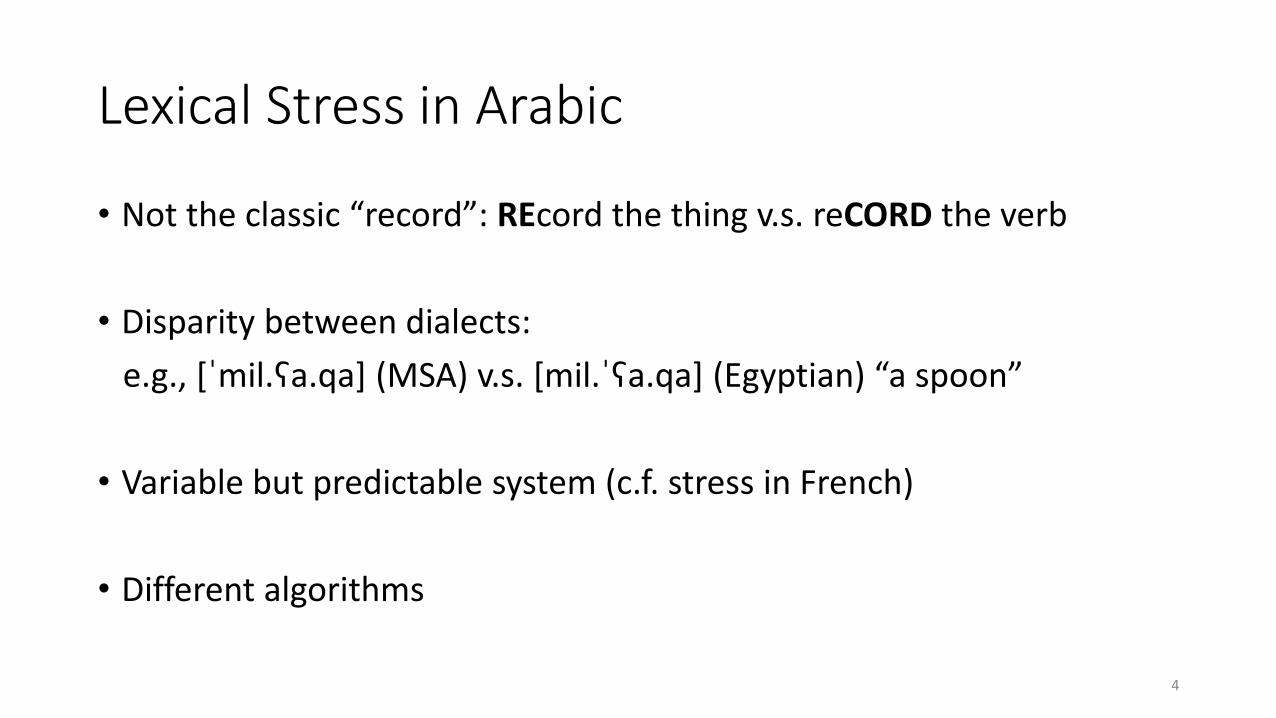
Lexical Stress in Arabic
• Not the classic “record”: REcord the thing v.s. reCORD the verb
• Disparity between dialects:
e.g., [ˈmil.ʕa.qa] (MSA) v.s. [mil.ˈʕa.qa] (Egyptian) “a spoon”
• Variable but predictable system (c.f. stress in French)
• Different algorithms
4
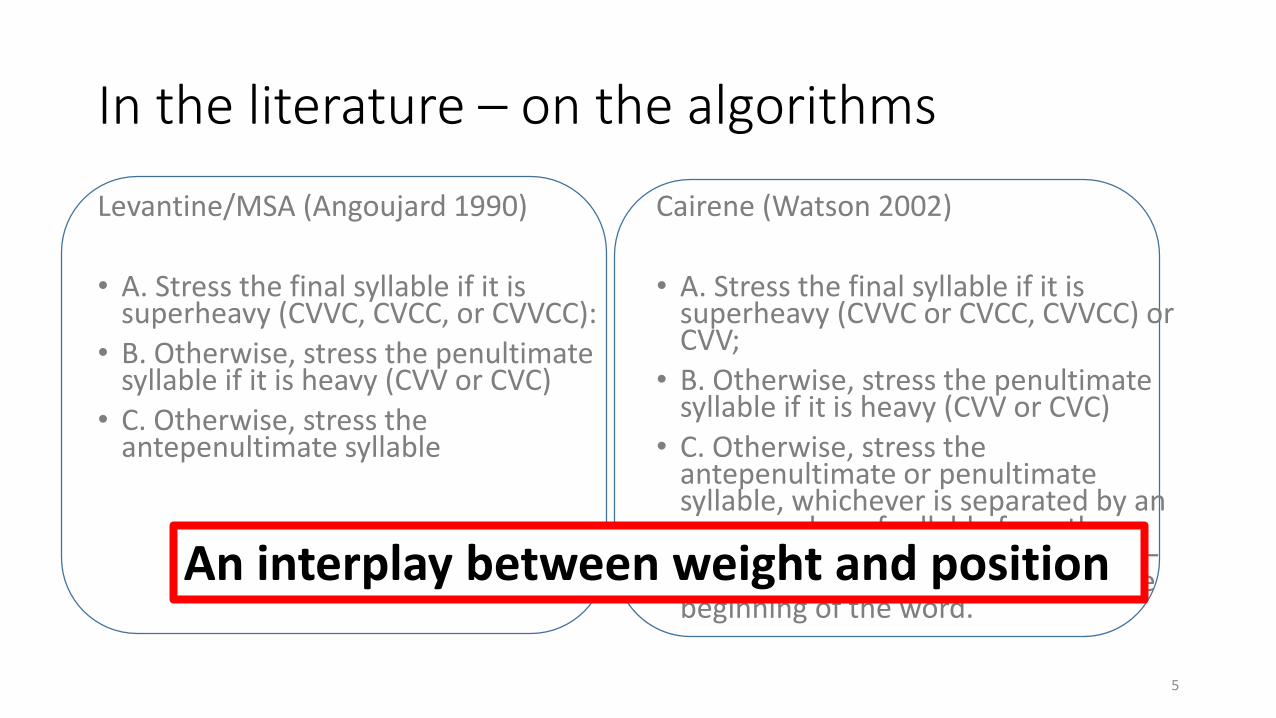
In the literature – on the algorithms
Levantine/MSA (Angoujard 1990)
• A. Stress the final syllable if it is superheavy (CVVC, CVCC, or CVVCC):
• B. Otherwise, stress the penultimate syllable if it is heavy (CVV or CVC)
• C. Otherwise, stress the antepenultimate syllable
Cairene (Watson 2002)
• A. Stress the final syllable if it is superheavy (CVVC or CVCC, CVVCC) or CVV;
• B. Otherwise, stress the penultimate syllable if it is heavy (CVV or CVC)
• C. Otherwise, stress the antepenultimate or penultimate syllable, whichever is separated by an even number of syllable from the closest preceding heavy syllable, or –if there is no such syllable – from the beginning of the word.
An interplay between weight and position
5
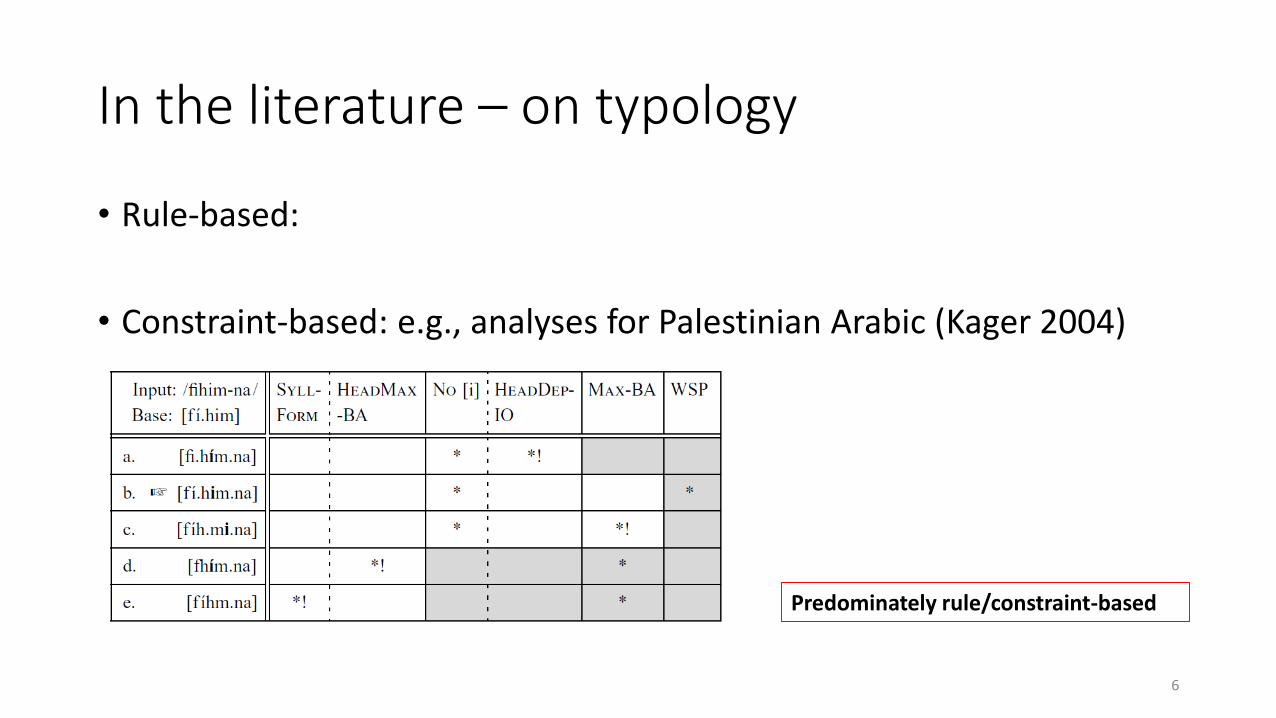
In the literature – on typology
• Rule-based:
• Constraint-based: e.g., analyses for Palestinian Arabic (Kager 2004)
Predominately rule/constraint-based
6
Emerging discussion on frequency effect
Frequency effect on facets of language processing and learning: (summarized from Ellis (2002))• bigram frequencies in word identification
• phonotactics knowledge in speech segmentation
• spelling-to-sound correspondences in reading
• cohort effects in spoken word recognition
• friends/enemies effects in morphology, spelling, reading
• competition model
• syntactic productivity depends on type frequency
• constraint satisfaction in sentence processing
• essential to statistically augment NLP grammars
How about lexical stress in Arabic?
7
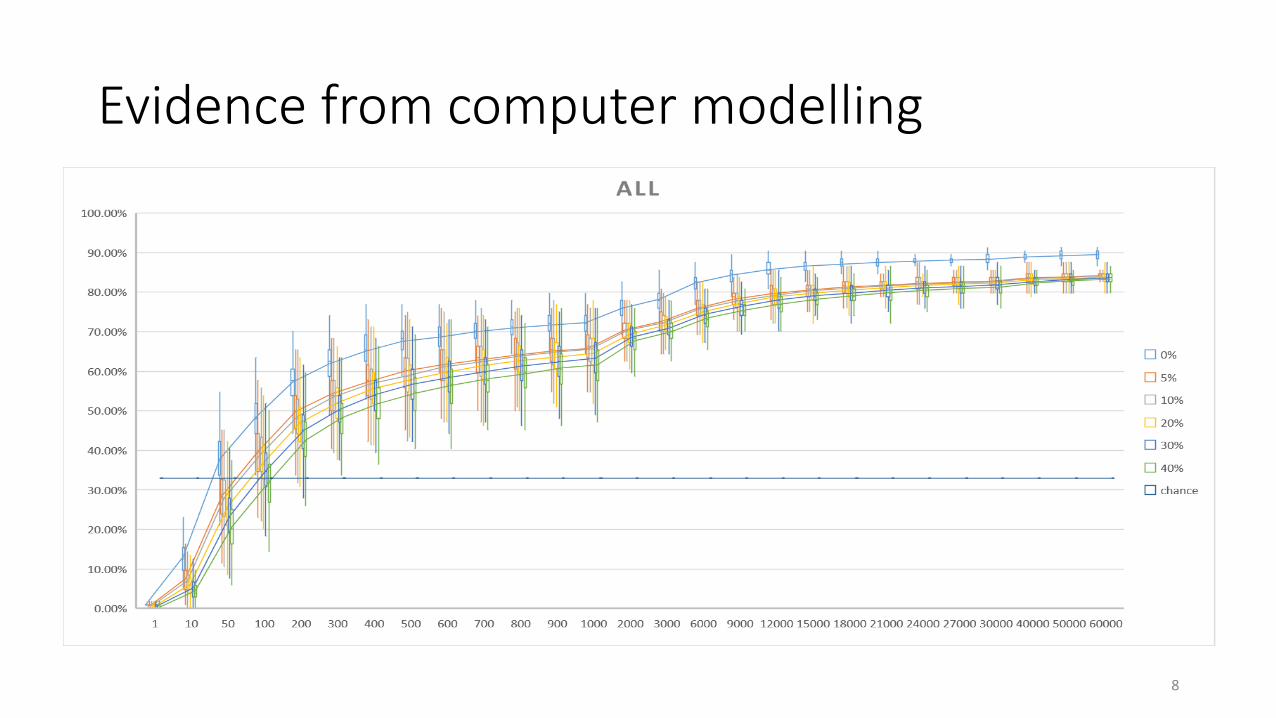
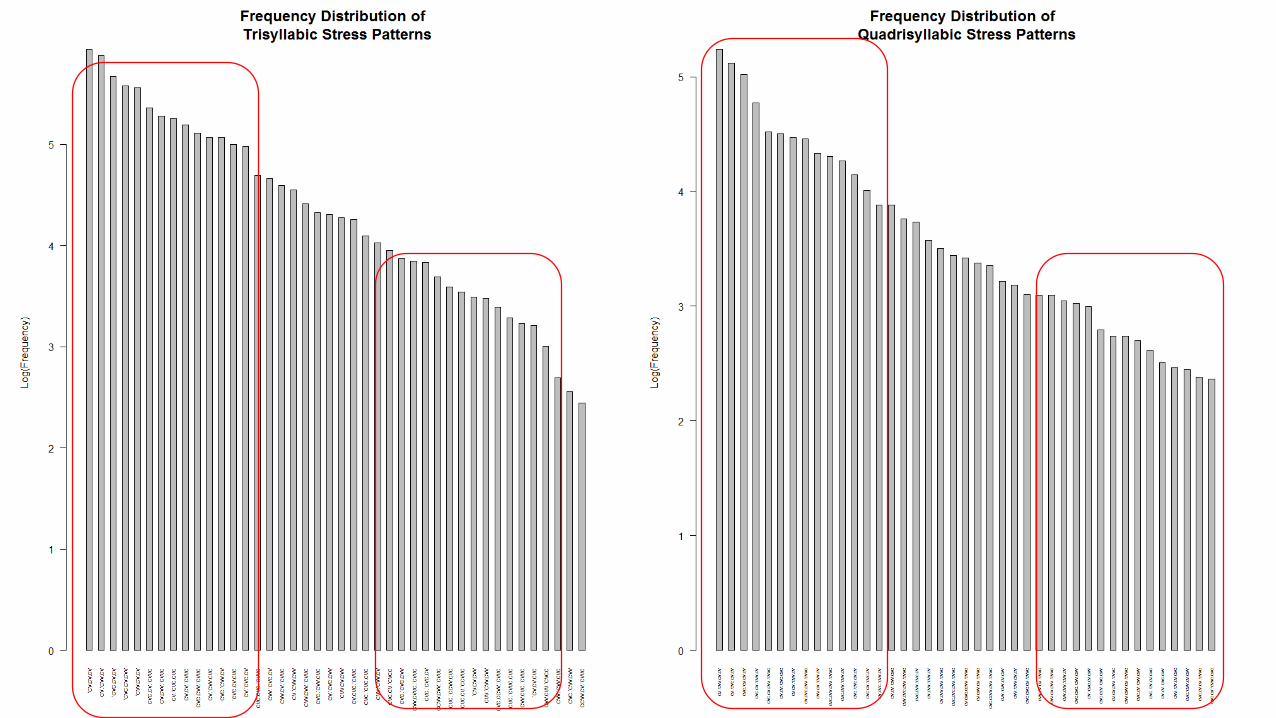
Evidence from computer modelling
8
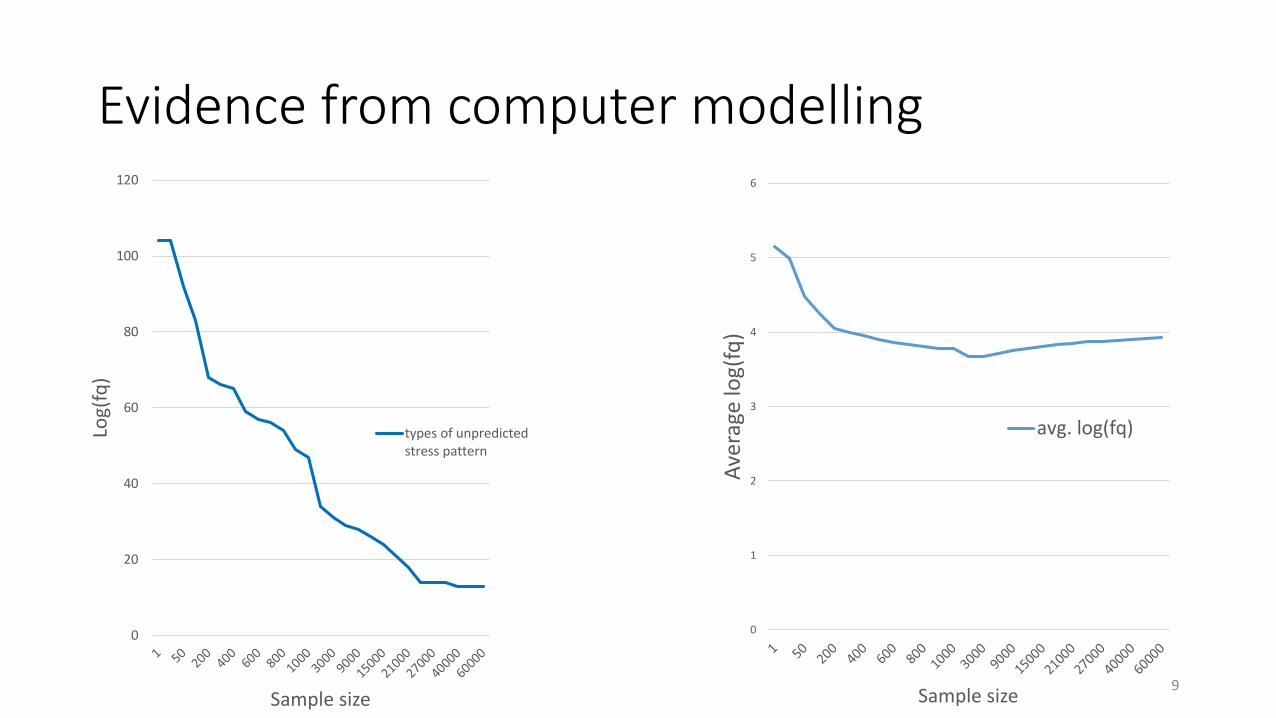
Evidence from computer modelling
0
20
40
60
80
100
120
Log(
fq)
Sample size
types of unpredictedstress pattern
9
0
1
2
3
4
5
6
Ave
rage
log(
fq)
Sample size
avg. log(fq)
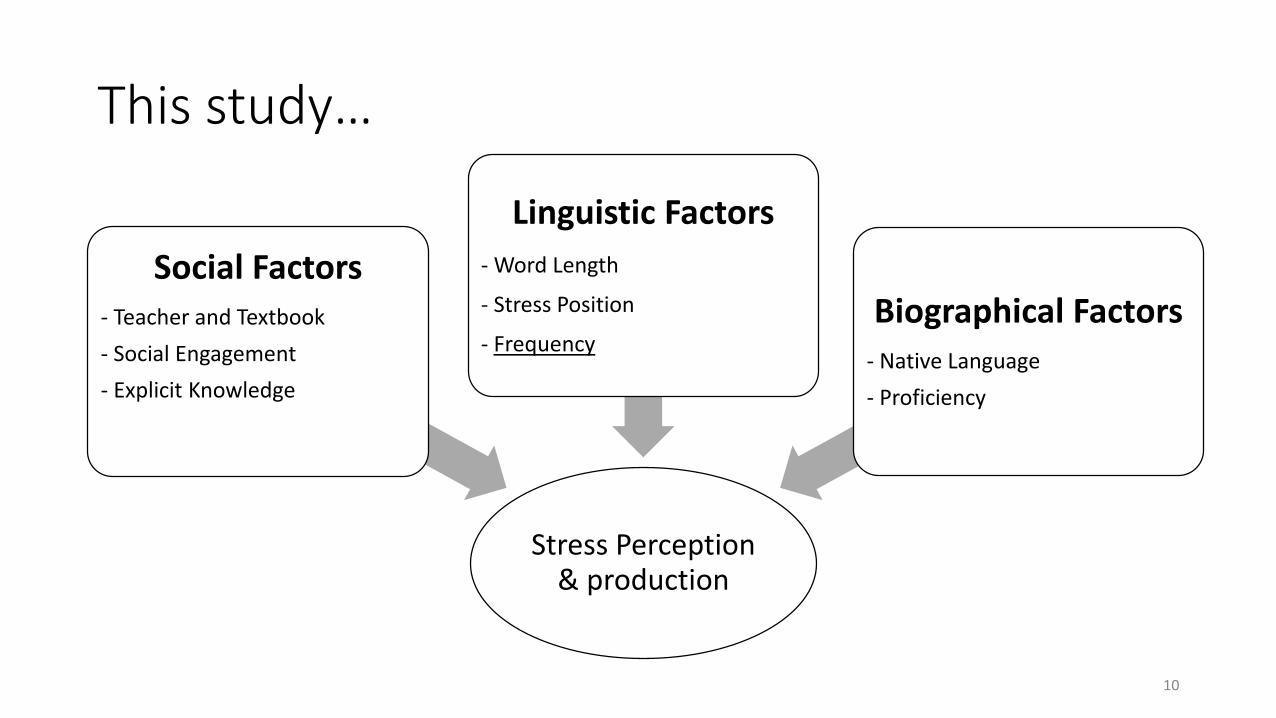
This study…
Stress Perception & production
Social Factors- Teacher and Textbook
- Social Engagement
- Explicit Knowledge
Linguistic Factors
- Word Length
- Stress Position
- FrequencyBiographical Factors
- Native Language
- Proficiency
10
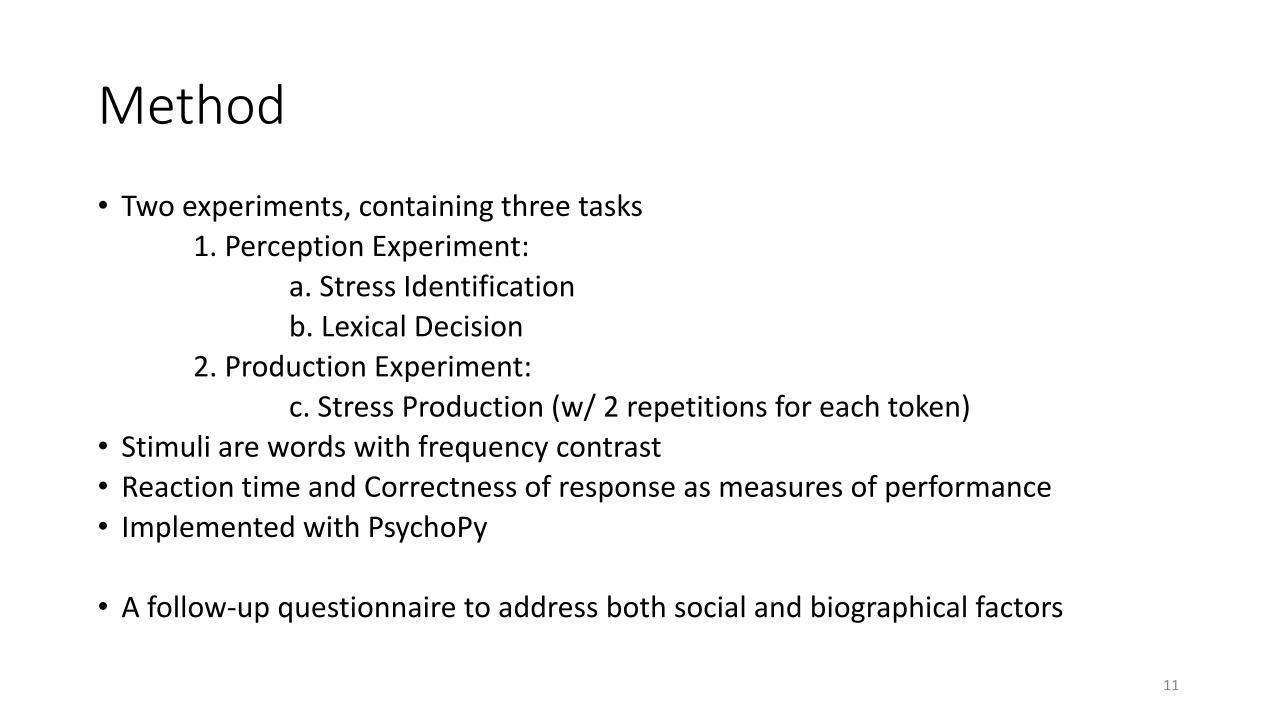
Method
• Two experiments, containing three tasks
1. Perception Experiment:
a. Stress Identification
b. Lexical Decision
2. Production Experiment:
c. Stress Production (w/ 2 repetitions for each token)
• Stimuli are words with frequency contrast
• Reaction time and Correctness of response as measures of performance
• Implemented with PsychoPy
• A follow-up questionnaire to address both social and biographical factors
11
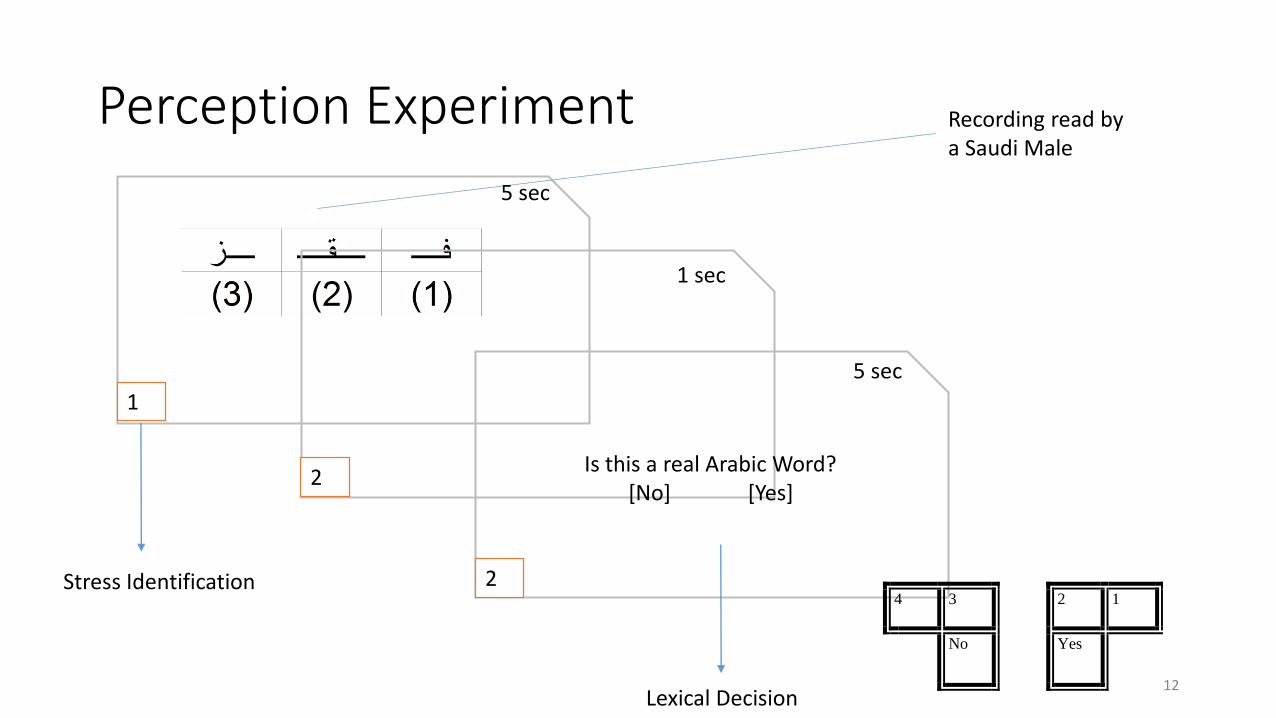
Perception Experiment
12
1 sec
Is this a real Arabic Word?[No] [Yes]
Stress Identification
Lexical Decision
Recording read by a Saudi Male
1
2
24 3 2 1
No Yes
5 sec
5 sec
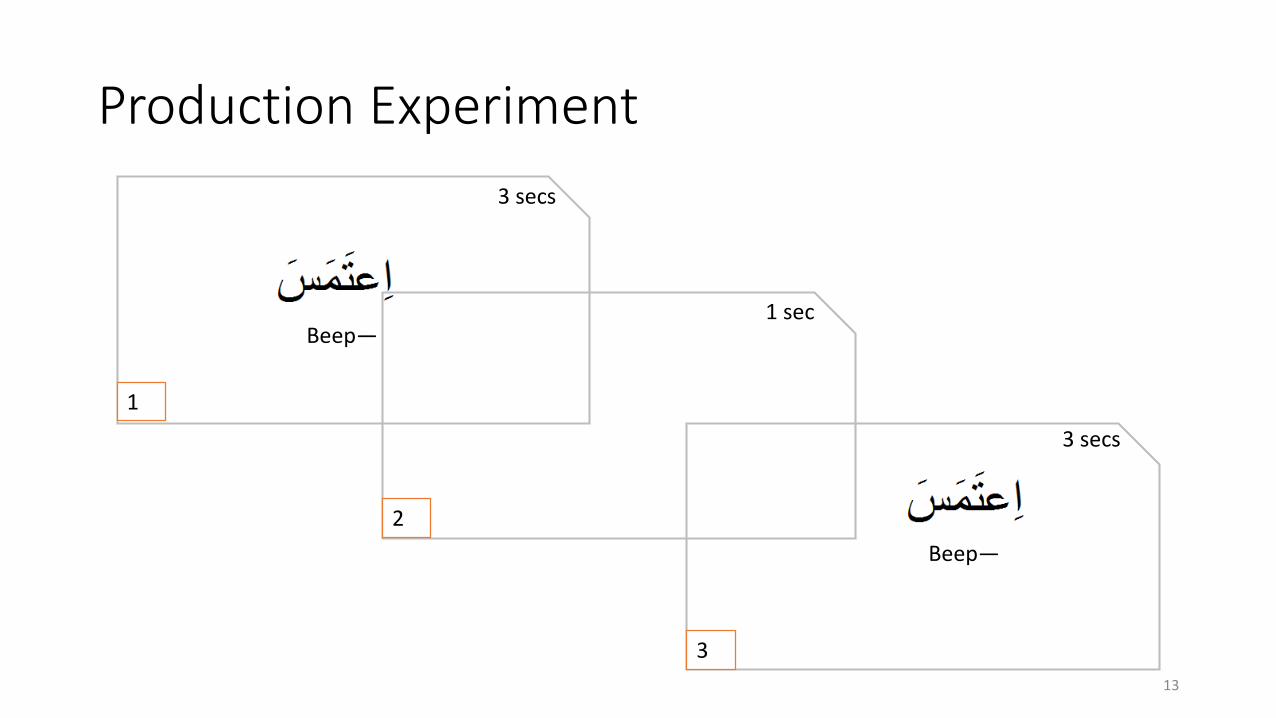
Production Experiment
13
Beep—
Beep—
3 secs
1 sec
3 secs
1
3
2
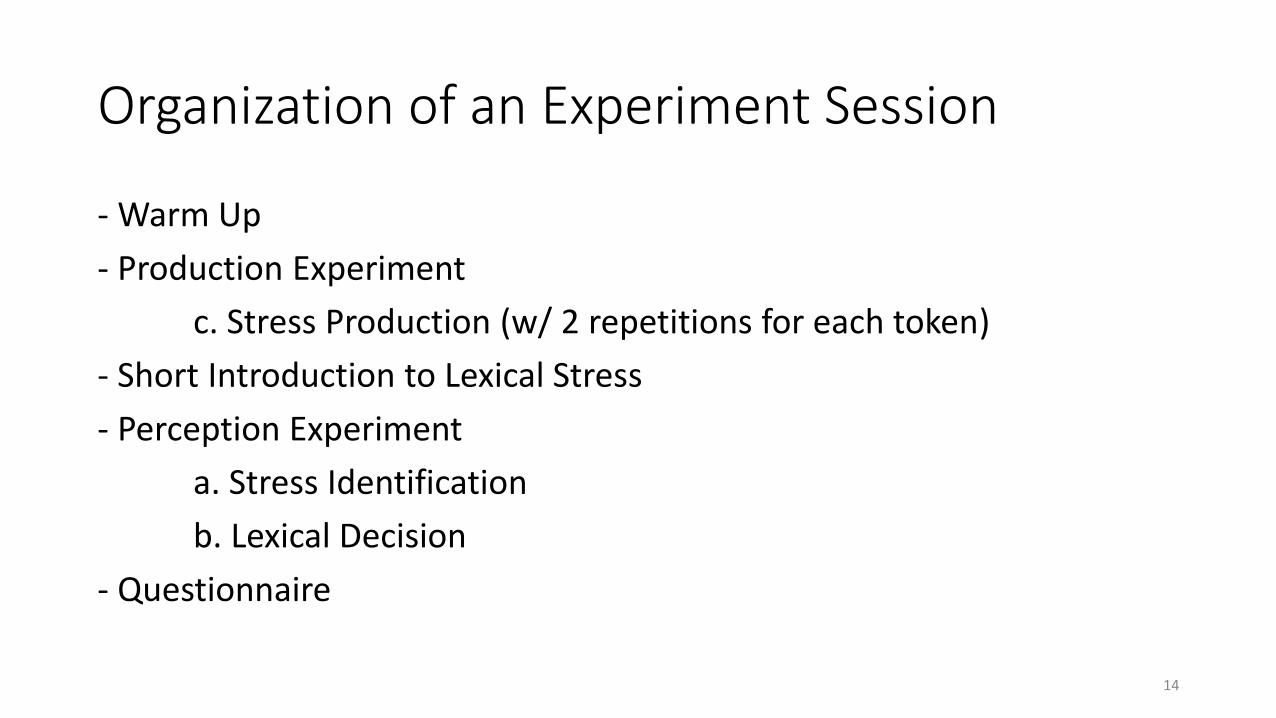
Organization of an Experiment Session
- Warm Up
- Production Experiment
c. Stress Production (w/ 2 repetitions for each token)
- Short Introduction to Lexical Stress
- Perception Experiment
a. Stress Identification
b. Lexical Decision
- Questionnaire
14

The Stimuli
15
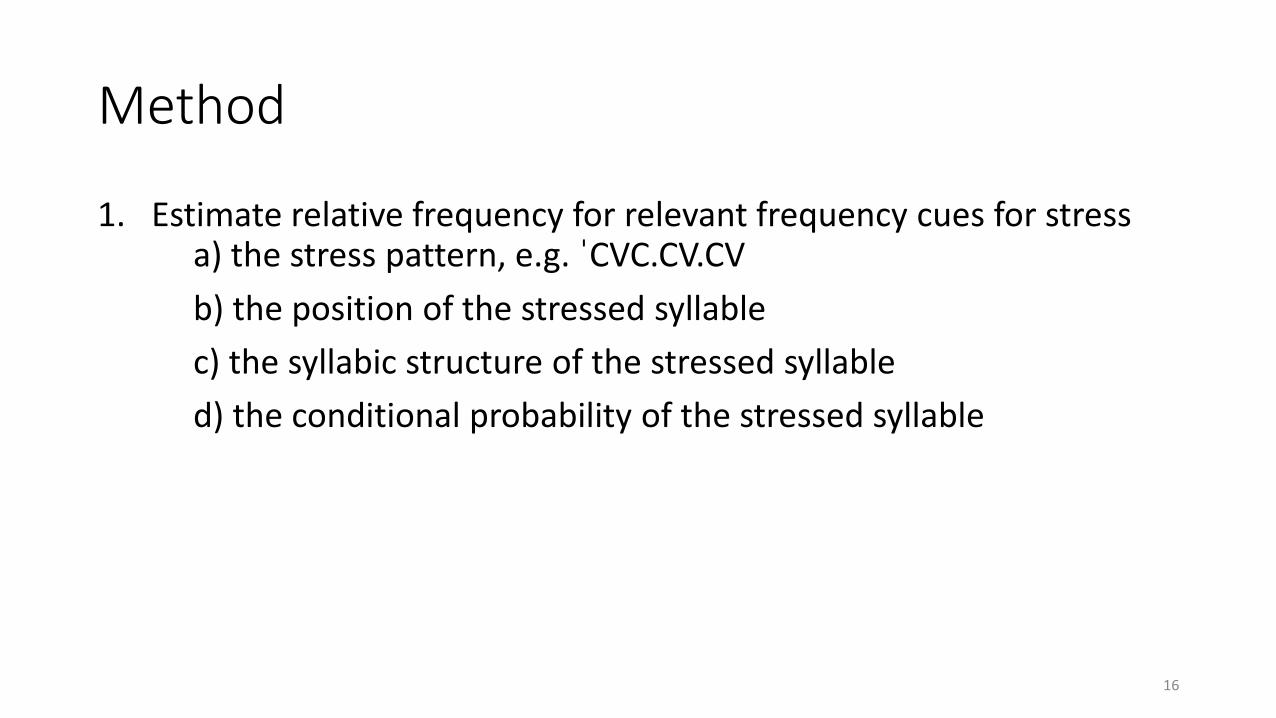
Method
1. Estimate relative frequency for relevant frequency cues for stress a) the stress pattern, e.g. ˈCVC.CV.CV
b) the position of the stressed syllable
c) the syllabic structure of the stressed syllable
d) the conditional probability of the stressed syllable
16
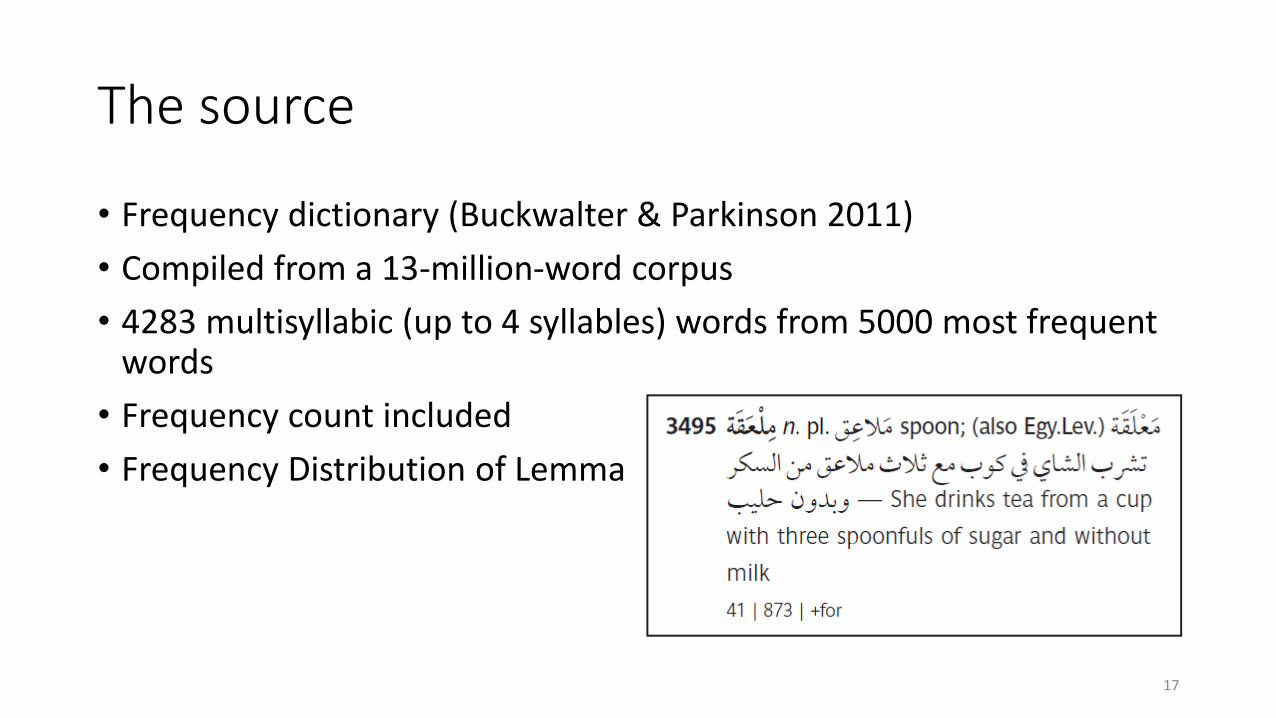
The source
• Frequency dictionary (Buckwalter & Parkinson 2011)
• Compiled from a 13-million-word corpus
• 4283 multisyllabic (up to 4 syllables) words from 5000 most frequent words
• Frequency count included
• Frequency Distribution of Lemma
17
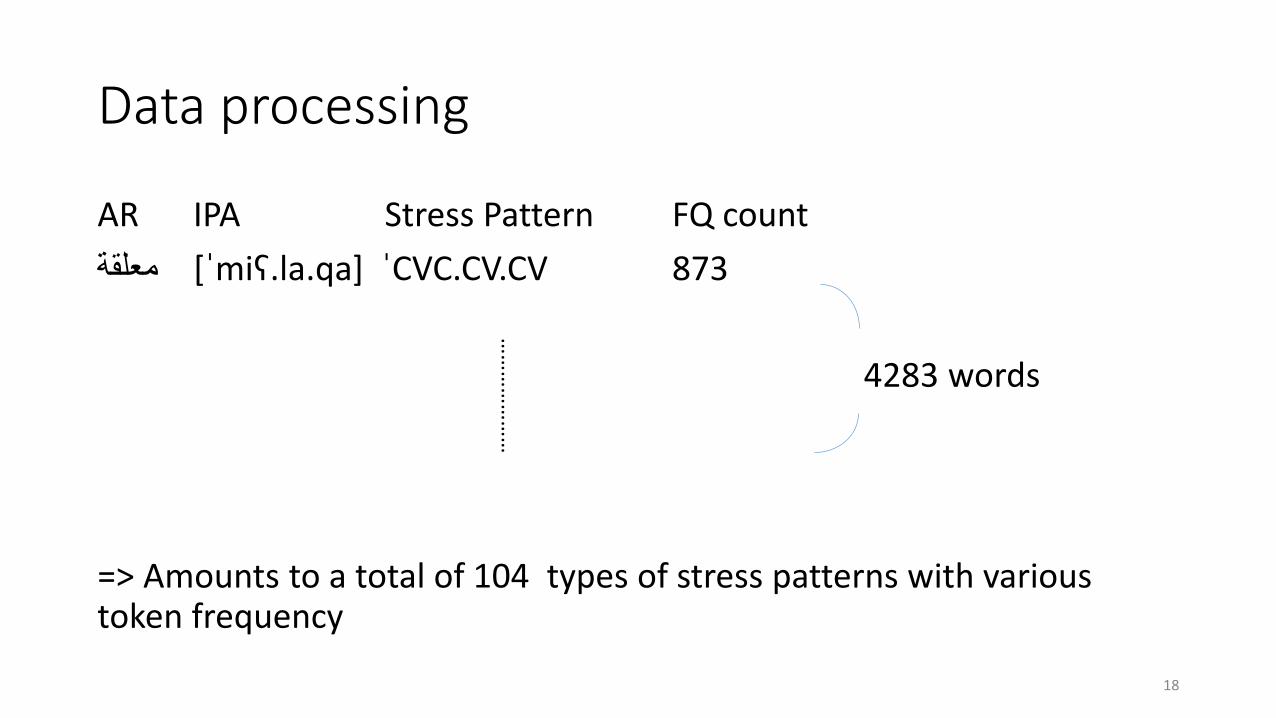
Data processing
AR IPA Stress Pattern FQ count
معلقة [ˈmiʕ.la.qa] ˈCVC.CV.CV 873
4283 words
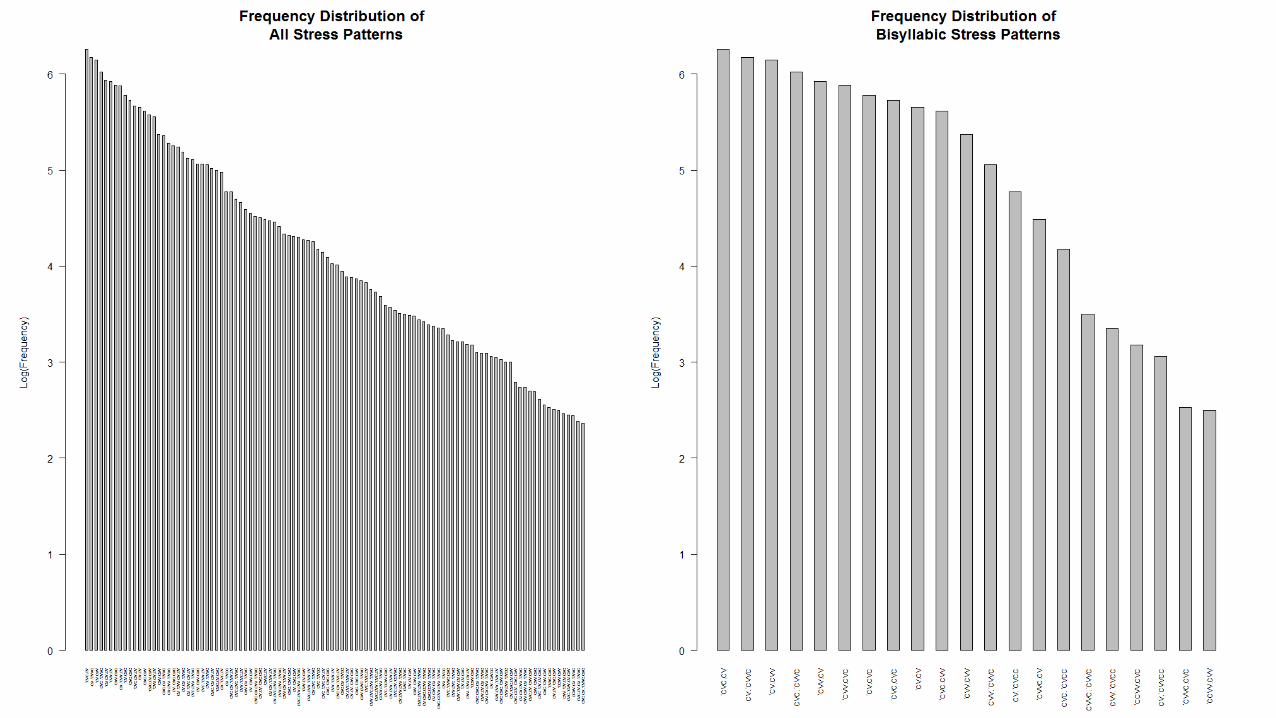
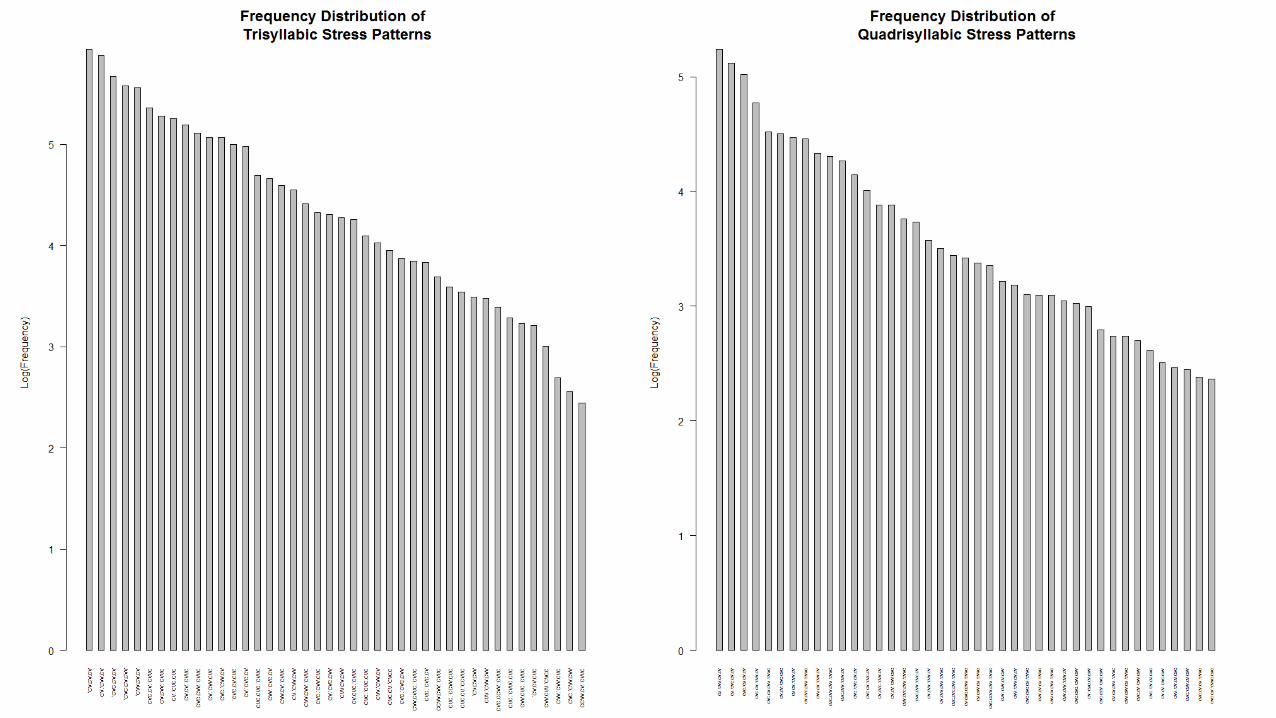
=> Amounts to a total of 104 types of stress patterns with various token frequency
……
……
……
…
18
19
20
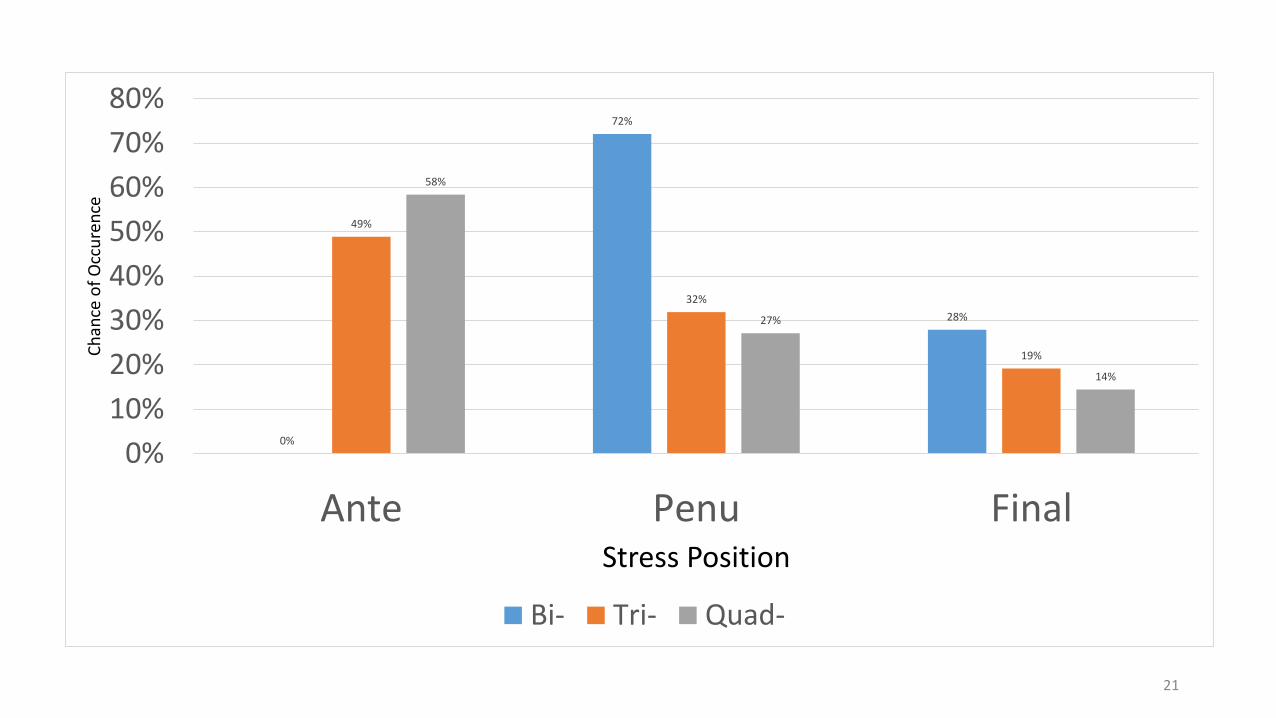
0%
72%
28%
49%
32%
19%
58%
27%
14%
0%
10%
20%
30%
40%
50%
60%
70%
80%
Ante Penu Final
Ch
ance
of
Occ
ure
nce
Stress Position
Bi- Tri- Quad-
21

0%
5%
10%
15%
20%
25%
30%
35%
40%
45%
50%
CVC CVVC CV CVV CVCC CVVCC
Ch
ance
ofO
ccu
ren
ce
Syllabic Structure
Bi- Tri- Quad-
22
0%
10%
20%
30%
40%
50%
60%
70%
80%
90%
100%
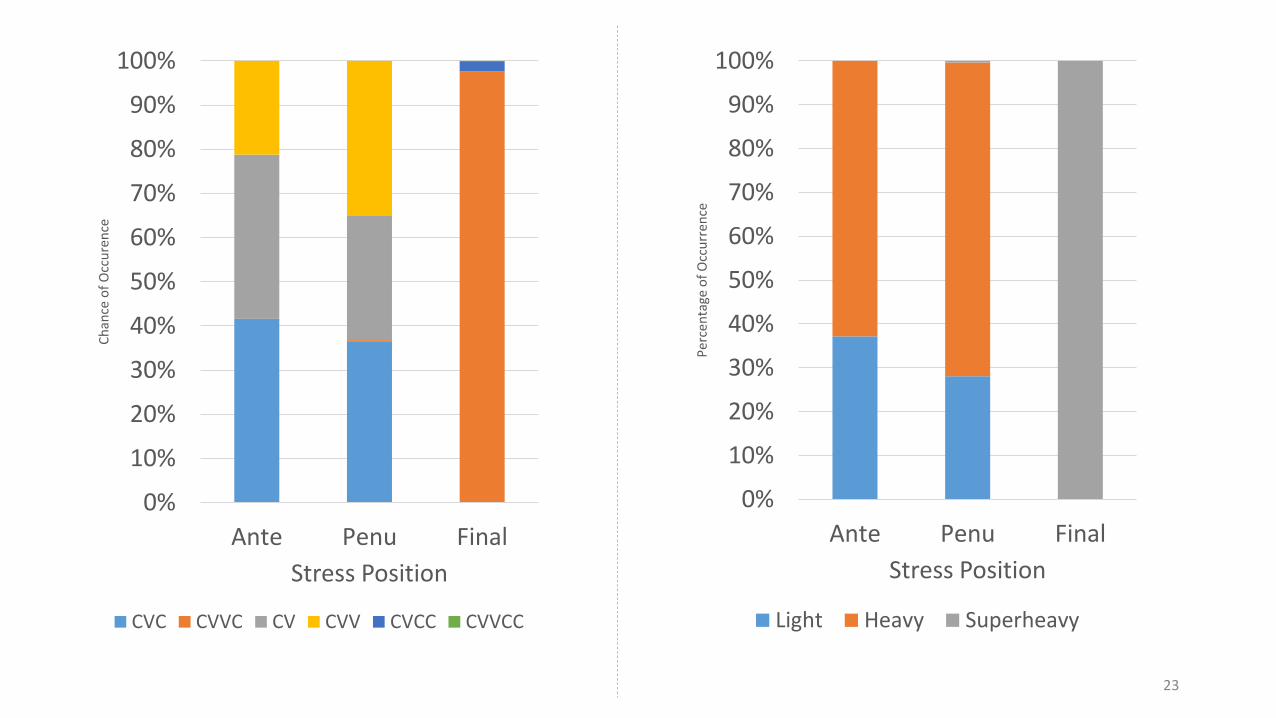
Ante Penu Final
Ch
ance
of
Occ
ure
nce
Stress Position
CVC CVVC CV CVV CVCC CVVCC
0%
10%
20%
30%
40%
50%
60%
70%
80%
90%
100%
Ante Penu Final
Per
cen
tage
of
Occ
urr
ence
Stress Position
Light Heavy Superheavy
23
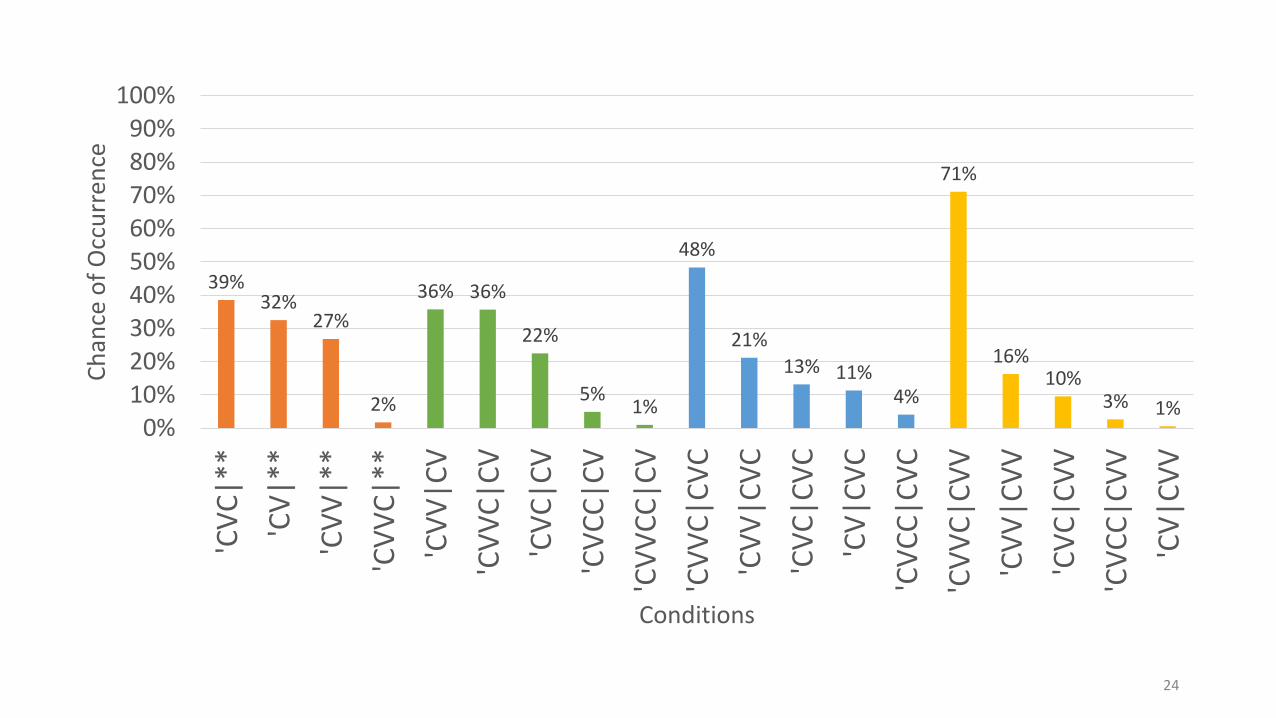
39%32%
27%
2%
36% 36%
22%
5%1%
48%
21%
13% 11%4%
71%
16%10%
3% 1%0%
10%20%30%40%50%60%70%80%90%
100%
'CV
C|*
*
'CV
|**
'CV
V|*
*
'CV
VC
|**
'CV
V|C
V
'CV
VC
|CV
'CV
C|C
V
'CV
CC
|CV
'CV
VC
C|C
V
'CV
VC
|CV
C
'CV
V|C
VC
'CV
C|C
VC
'CV
|CV
C
'CV
CC
|CV
C
'CV
VC
|CV
V
'CV
V|C
VV
'CV
C|C
VV
'CV
CC
|CV
V
'CV
|CV
V
Ch
ance
of
Occ
urr
ence
Conditions
24
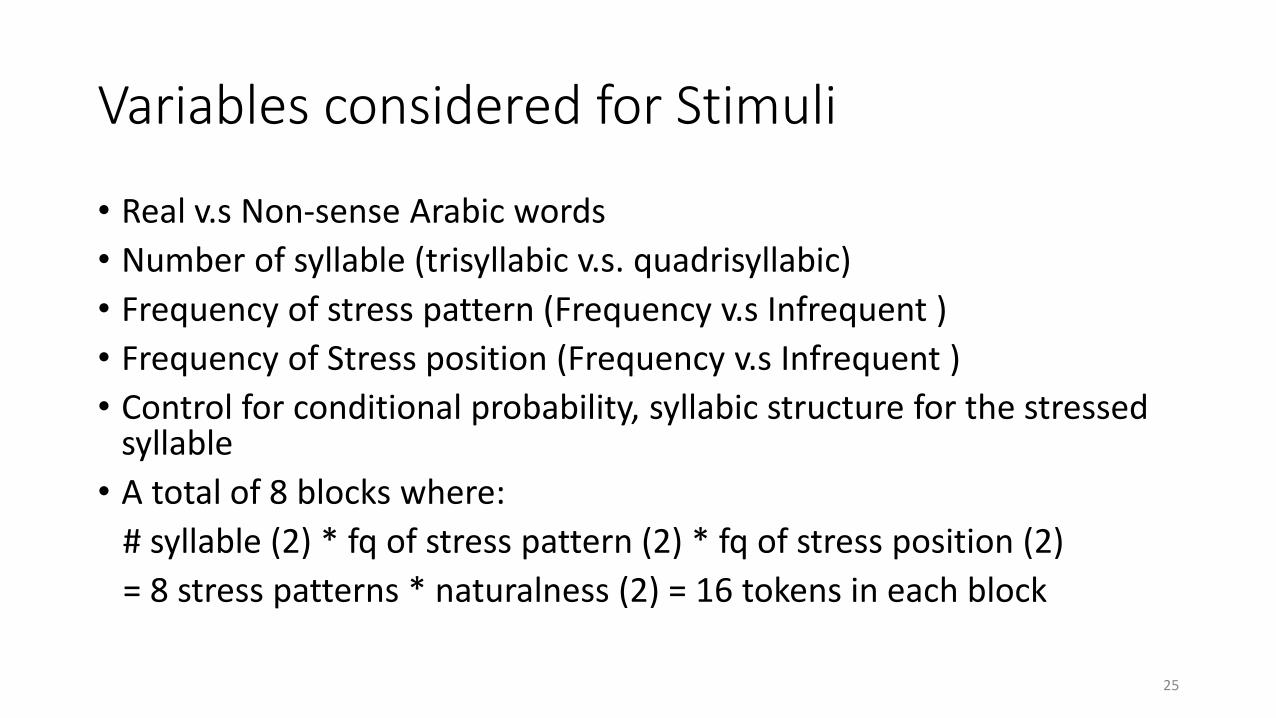
Variables considered for Stimuli
• Real v.s Non-sense Arabic words
• Number of syllable (trisyllabic v.s. quadrisyllabic)
• Frequency of stress pattern (Frequency v.s Infrequent )
• Frequency of Stress position (Frequency v.s Infrequent )
• Control for conditional probability, syllabic structure for the stressed syllable
• A total of 8 blocks where:
# syllable (2) * fq of stress pattern (2) * fq of stress position (2)
= 8 stress patterns * naturalness (2) = 16 tokens in each block
25
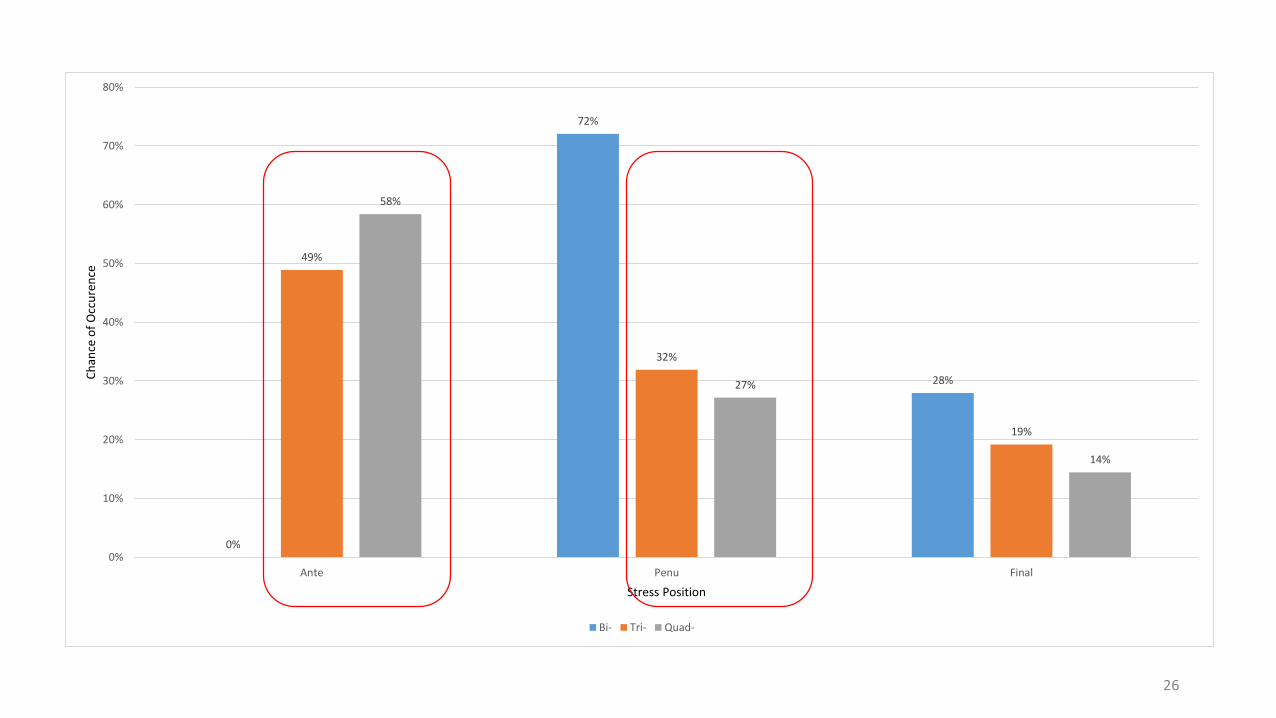
0%
72%
28%
49%
32%
19%
58%
27%
14%
0%
10%
20%
30%
40%
50%
60%
70%
80%
Ante Penu Final
Ch
ance
of
Occ
ure
nce
Stress Position
Bi- Tri- Quad-
26
27
28
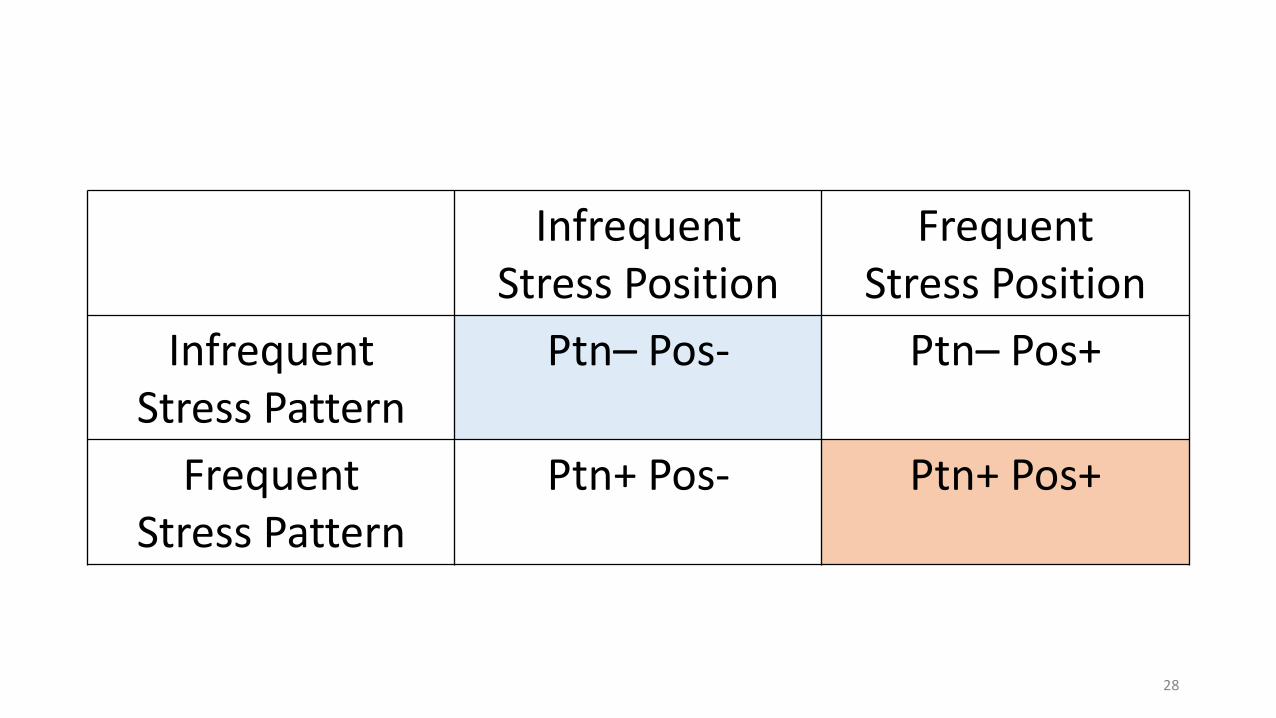
Infrequent Stress Position
FrequentStress Position
InfrequentStress Pattern
Ptn– Pos- Ptn– Pos+
FrequentStress Pattern
Ptn+ Pos- Ptn+ Pos+
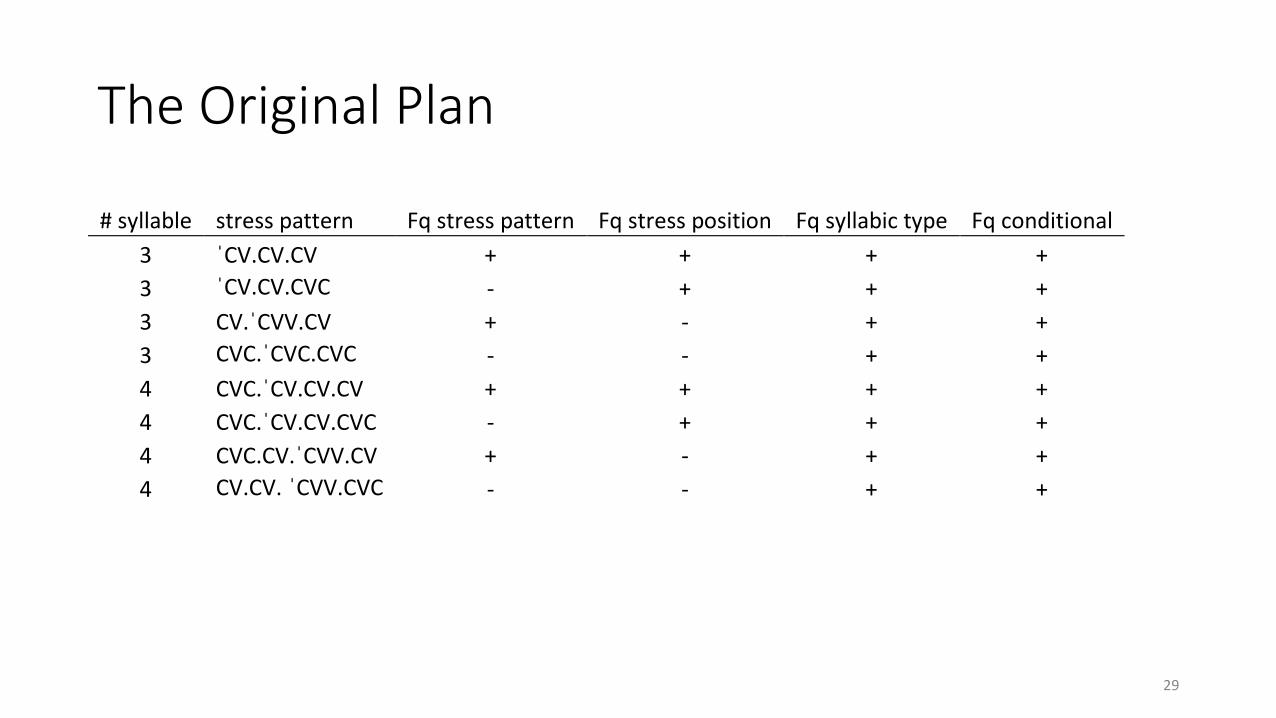
The Original Plan
29
# syllable stress pattern Fq stress pattern Fq stress position Fq syllabic type Fq conditional
3 ˈCV.CV.CV + + + +
3 ˈCV.CV.CVC - + + +
3 CV.ˈCVV.CV + - + +
3 CVC.ˈCVC.CVC - - + +
4 CVC.ˈCV.CV.CV + + + +
4 CVC.ˈCV.CV.CVC - + + +
4 CVC.CV.ˈCVV.CV + - + +
4 CV.CV. ˈCVV.CVC - - + +
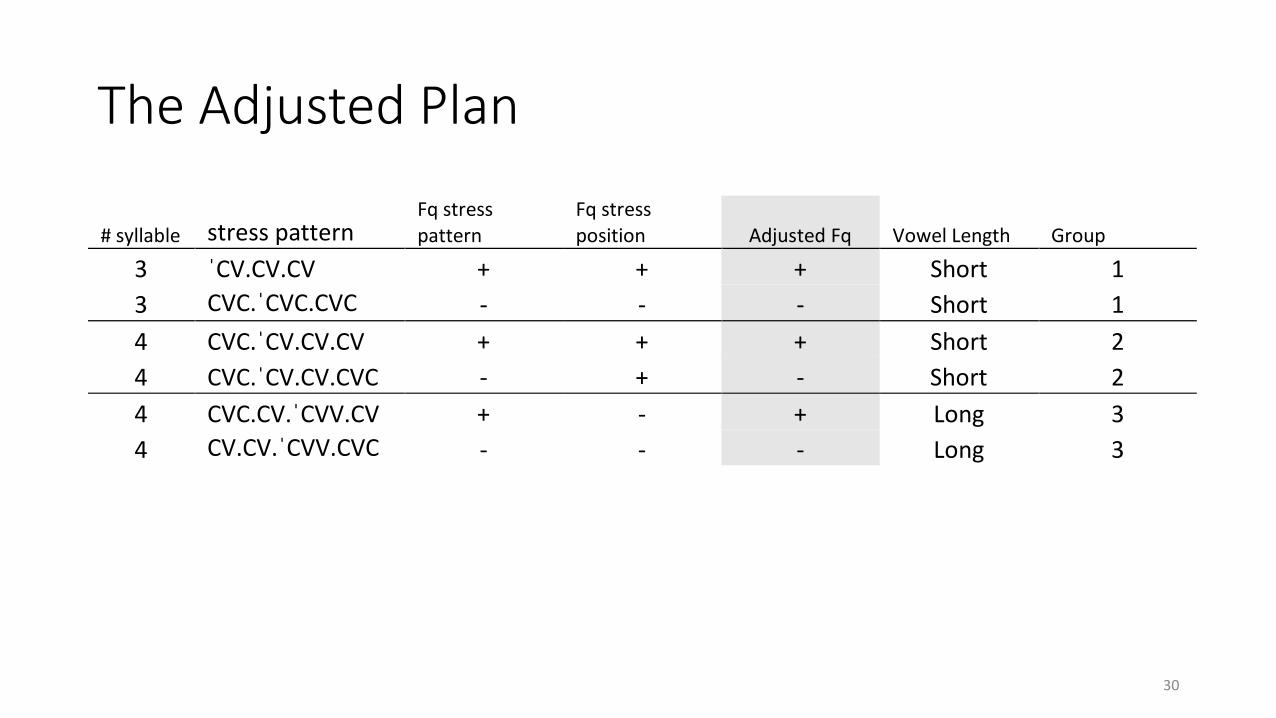
The Adjusted Plan
30
# syllable stress pattern Fq stress pattern
Fq stress position Adjusted Fq Vowel Length Group
3 ˈCV.CV.CV + + + Short 1
3 CVC.ˈCVC.CVC - - - Short 1
4 CVC.ˈCV.CV.CV + + + Short 2
4 CVC.ˈCV.CV.CVC - + - Short 2
4 CVC.CV.ˈCVV.CV + - + Long 3
4 CV.CV.ˈCVV.CVC - - - Long 3
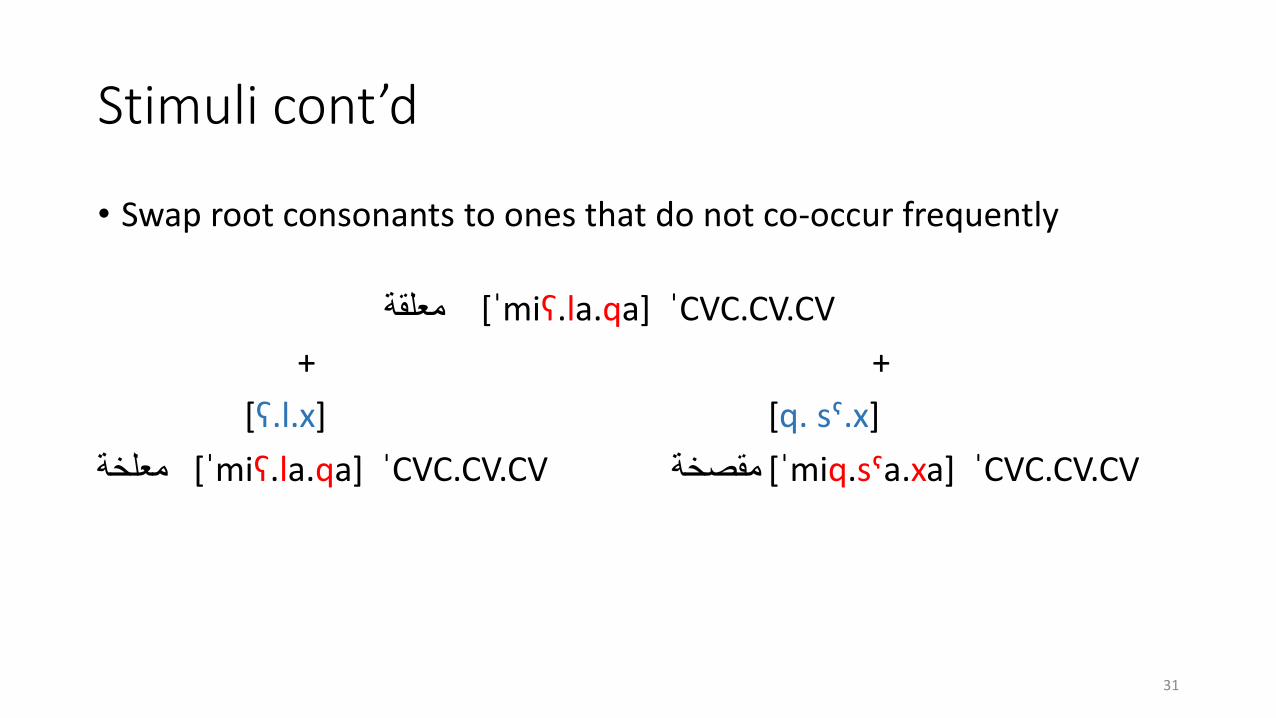
Stimuli cont’d
• Swap root consonants to ones that do not co-occur frequently
معلقة [ˈmiʕ.la.qa] ˈCVC.CV.CV
+ +
[ʕ.l.x] [q. sˤ.x]
معلخة [ˈmiʕ.la.qa] ˈCVC.CV.CV مقصخة [ˈmiq.sˤa.xa] ˈCVC.CV.CV
31
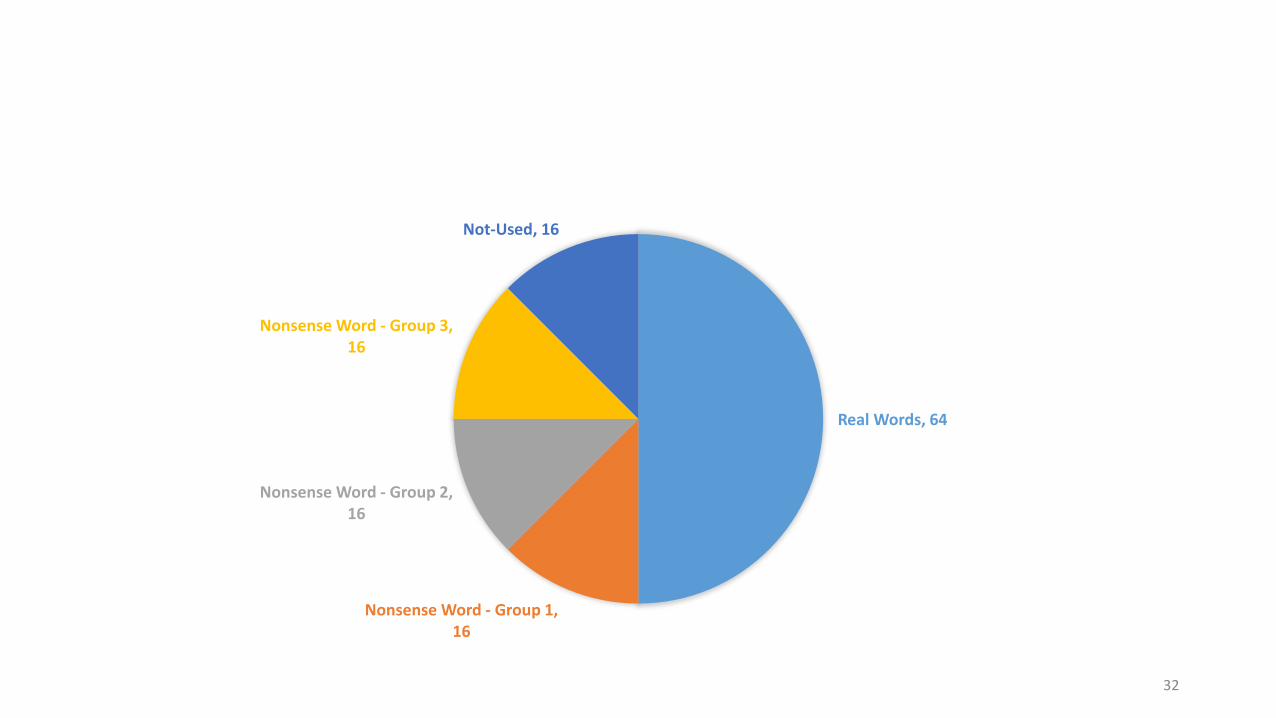
Real Words, 64
Nonsense Word - Group 1, 16
Nonsense Word - Group 2, 16
Nonsense Word - Group 3, 16
Not-Used, 16
32
The Participants
33
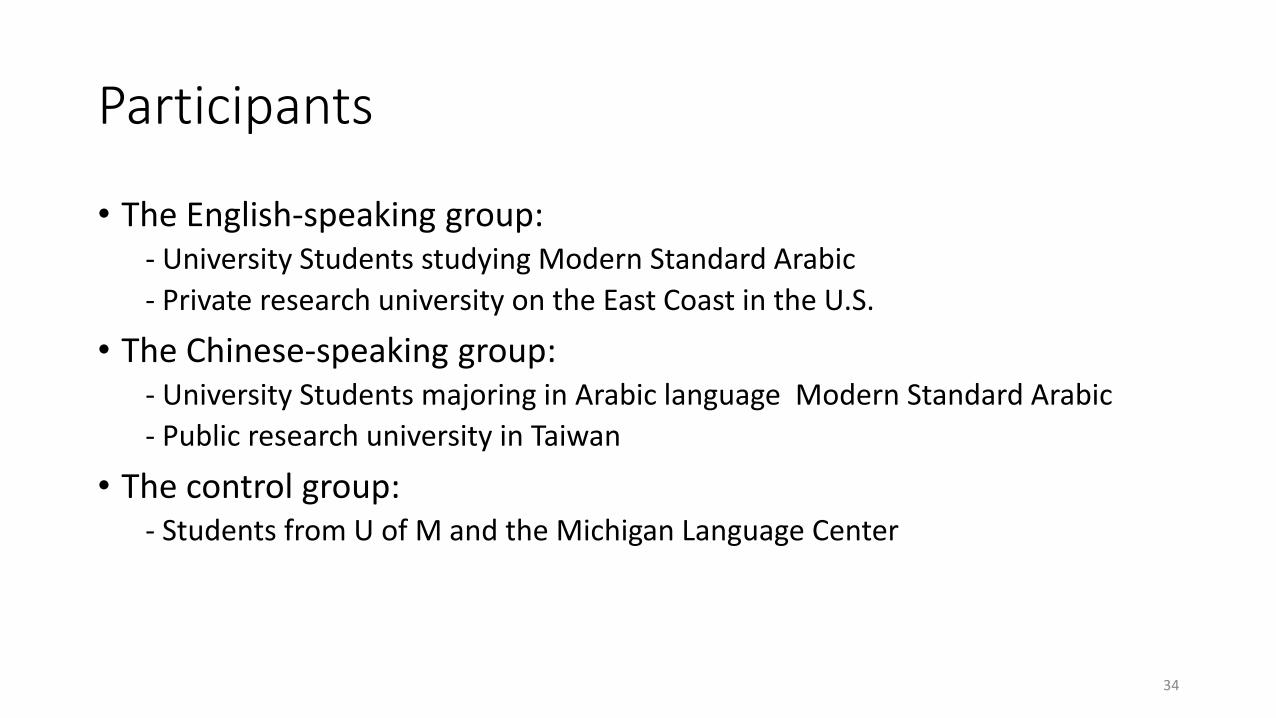
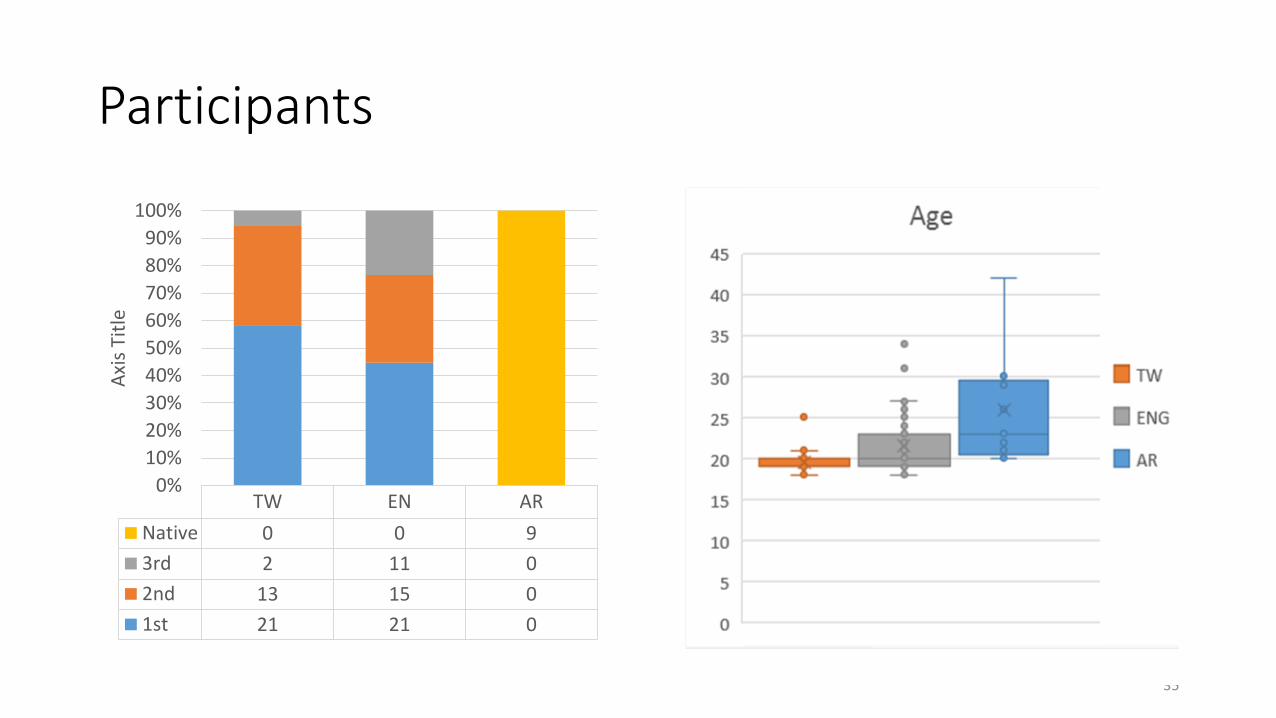
Participants
• The English-speaking group:- University Students studying Modern Standard Arabic
- Private research university on the East Coast in the U.S.
• The Chinese-speaking group:- University Students majoring in Arabic language Modern Standard Arabic
- Public research university in Taiwan
• The control group:- Students from U of M and the Michigan Language Center
34
Participants
35
TW EN AR
Native 0 0 9
3rd 2 11 0
2nd 13 15 0
1st 21 21 0
0%
10%
20%
30%
40%
50%
60%
70%
80%
90%
100%
Axi
s Ti
tle
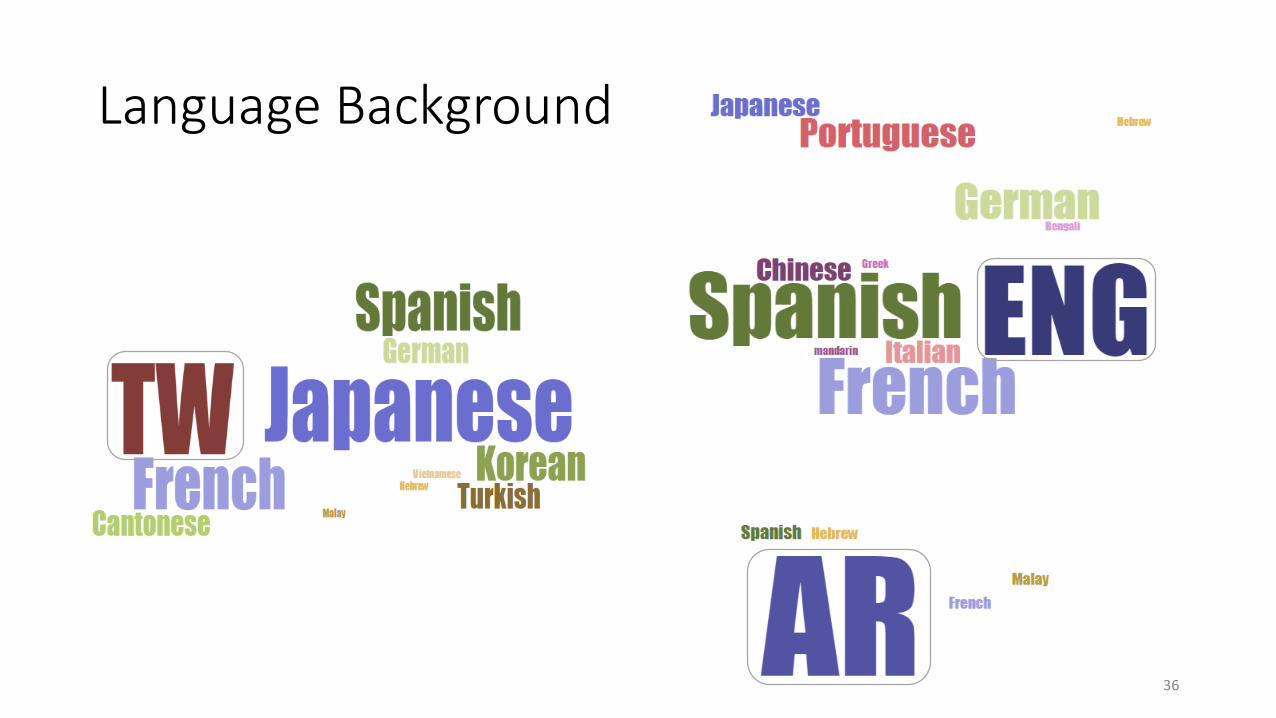
Language Background
36
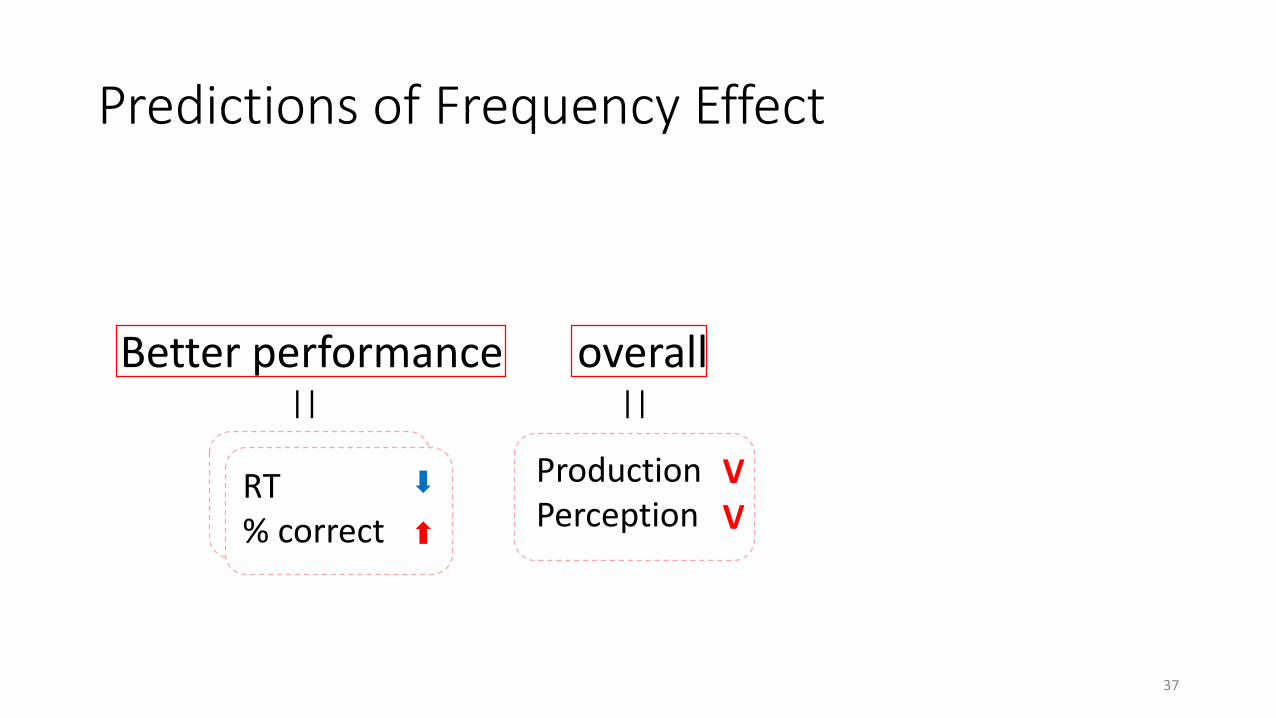
Predictions of Frequency Effect
Better performance overall|| ||
Fluency Accuracy
Production Perception
VV
37
RT % correct
Results: Perception Experiment
38
Stress Identification
39
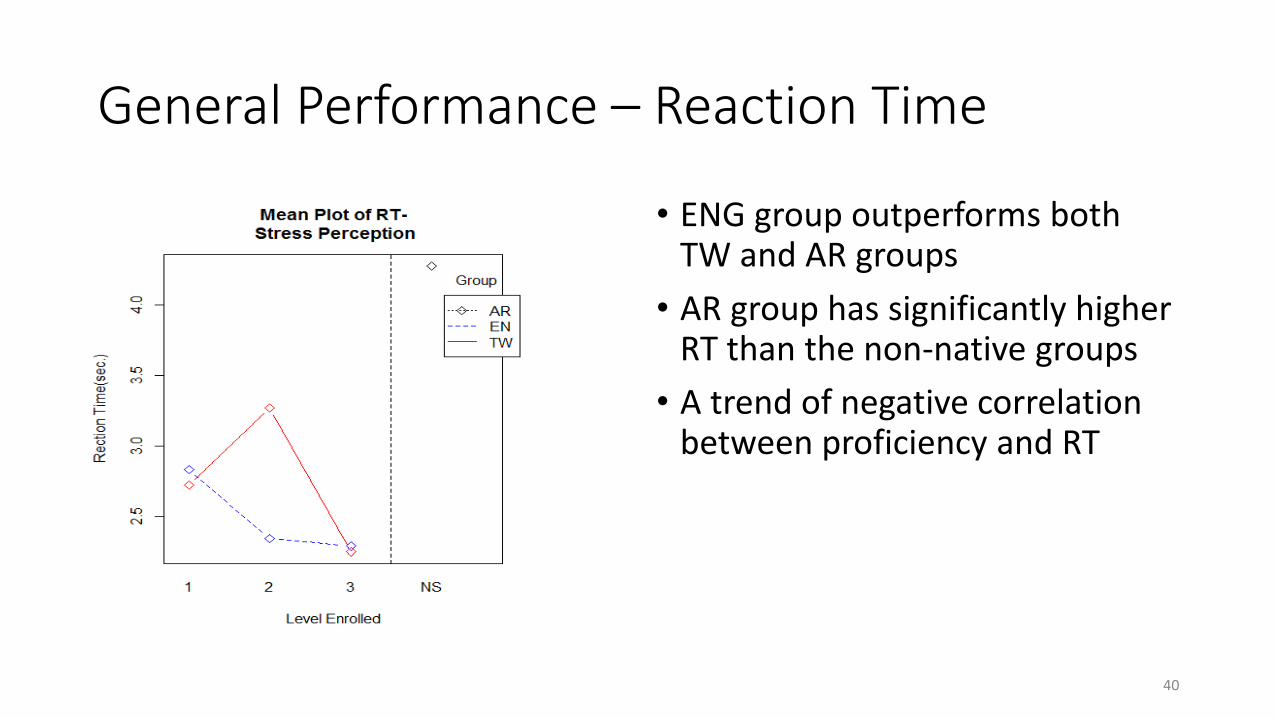
General Performance – Reaction Time
• ENG group outperforms both TW and AR groups
• AR group has significantly higher RT than the non-native groups
• A trend of negative correlation between proficiency and RT
40
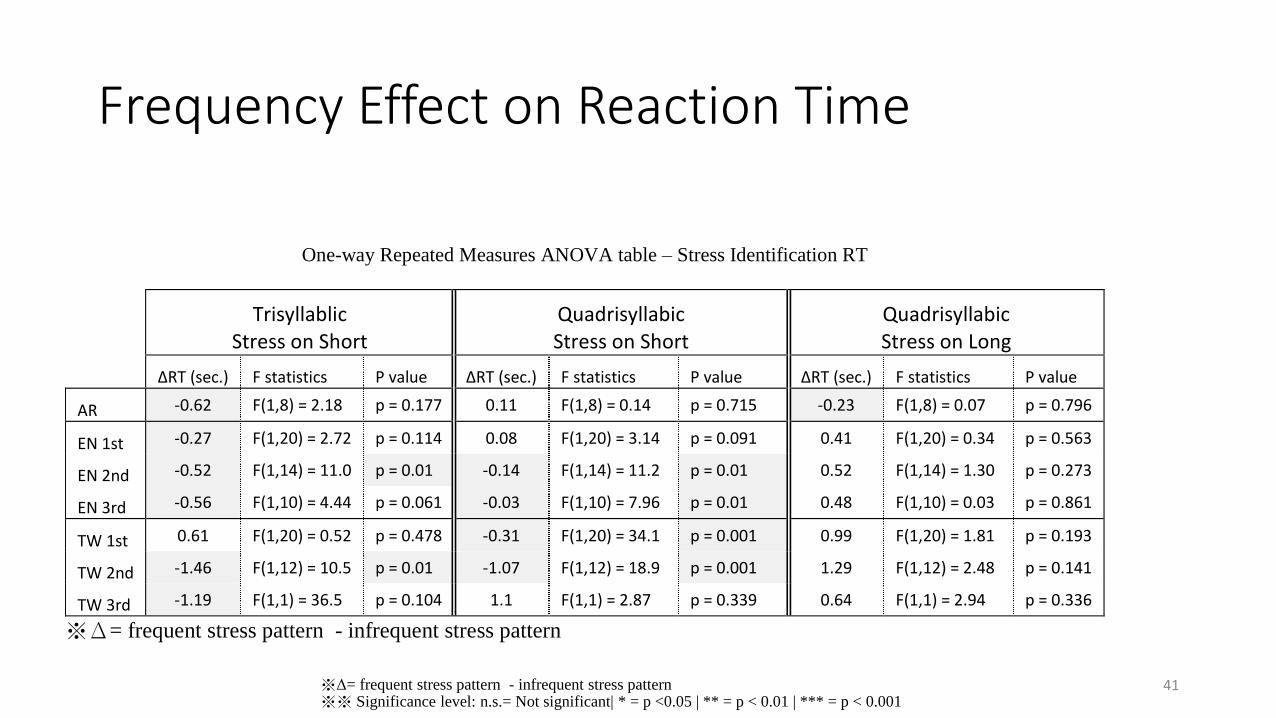
Frequency Effect on Reaction Time
41※Δ= frequent stress pattern - infrequent stress pattern ※※ Significance level: n.s.= Not significant| * = p <0.05 | ** = p < 0.01 | *** = p < 0.001
One-way Repeated Measures ANOVA table – Stress Identification RT
Trisyllablic Stress on Short
Quadrisyllabic Stress on Short
Quadrisyllabic Stress on Long
ΔRT (sec.) F statistics P value ΔRT (sec.) F statistics P value ΔRT (sec.) F statistics P value
AR -0.62 F(1,8) = 2.18 p = 0.177 0.11 F(1,8) = 0.14 p = 0.715 -0.23 F(1,8) = 0.07 p = 0.796
EN 1st -0.27 F(1,20) = 2.72 p = 0.114 0.08 F(1,20) = 3.14 p = 0.091 0.41 F(1,20) = 0.34 p = 0.563
EN 2nd -0.52 F(1,14) = 11.0 p = 0.01 -0.14 F(1,14) = 11.2 p = 0.01 0.52 F(1,14) = 1.30 p = 0.273
EN 3rd -0.56 F(1,10) = 4.44 p = 0.061 -0.03 F(1,10) = 7.96 p = 0.01 0.48 F(1,10) = 0.03 p = 0.861
TW 1st 0.61 F(1,20) = 0.52 p = 0.478 -0.31 F(1,20) = 34.1 p = 0.001 0.99 F(1,20) = 1.81 p = 0.193
TW 2nd -1.46 F(1,12) = 10.5 p = 0.01 -1.07 F(1,12) = 18.9 p = 0.001 1.29 F(1,12) = 2.48 p = 0.141
TW 3rd -1.19 F(1,1) = 36.5 p = 0.104 1.1 F(1,1) = 2.87 p = 0.339 0.64 F(1,1) = 2.94 p = 0.336
※Δ= frequent stress pattern - infrequent stress pattern
General Performance – Correction Rate
• ENG group outperforms both TW and AR groups
• A trend of negative correlation between proficiency and Correction Rate
• Surprisingly, the AR group is significantly less accurate than the othergroups
42
Frequency Effect on Correction Rate
43
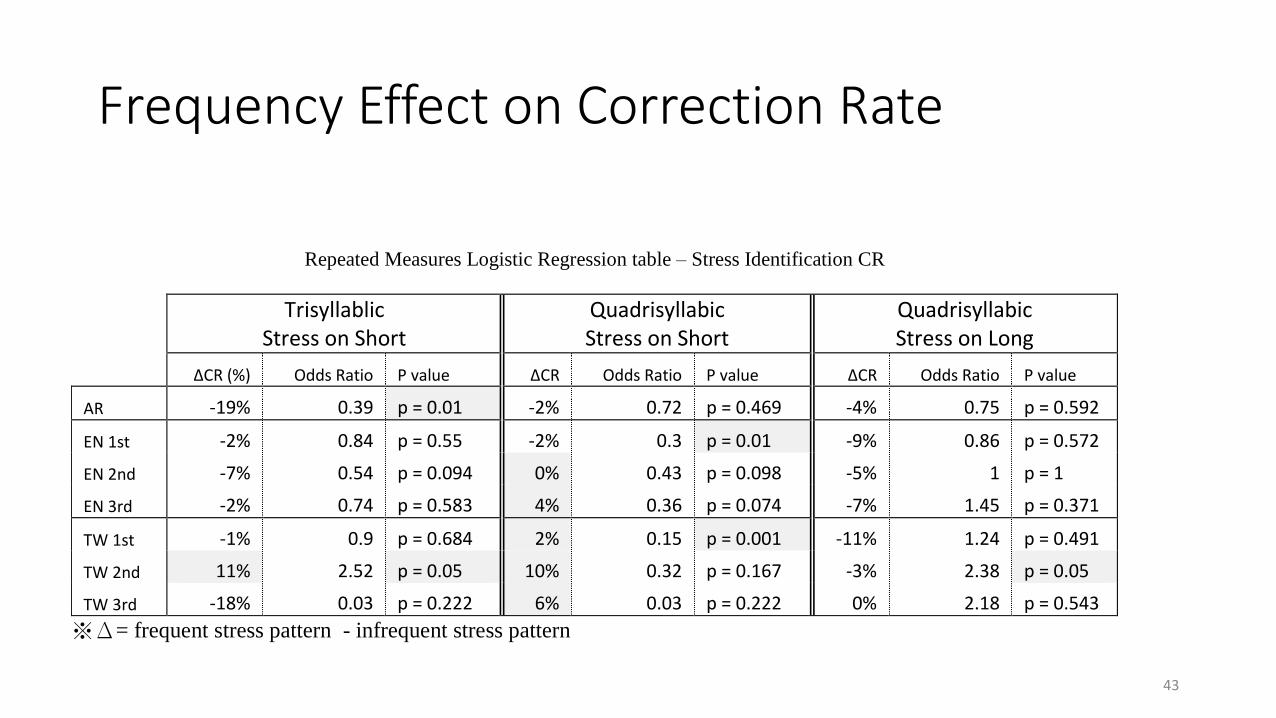
Repeated Measures Logistic Regression table – Stress Identification CR
Trisyllablic
Stress on Short Quadrisyllabic Stress on Short
Quadrisyllabic Stress on Long
ΔCR (%) Odds Ratio P value ΔCR Odds Ratio P value ΔCR Odds Ratio P value
AR -19% 0.39 p = 0.01 -2% 0.72 p = 0.469 -4% 0.75 p = 0.592
EN 1st -2% 0.84 p = 0.55 -2% 0.3 p = 0.01 -9% 0.86 p = 0.572
EN 2nd -7% 0.54 p = 0.094 0% 0.43 p = 0.098 -5% 1 p = 1
EN 3rd -2% 0.74 p = 0.583 4% 0.36 p = 0.074 -7% 1.45 p = 0.371
TW 1st -1% 0.9 p = 0.684 2% 0.15 p = 0.001 -11% 1.24 p = 0.491
TW 2nd 11% 2.52 p = 0.05 10% 0.32 p = 0.167 -3% 2.38 p = 0.05
TW 3rd -18% 0.03 p = 0.222 6% 0.03 p = 0.222 0% 2.18 p = 0.543
※Δ= frequent stress pattern - infrequent stress pattern
Lexical Decision
44
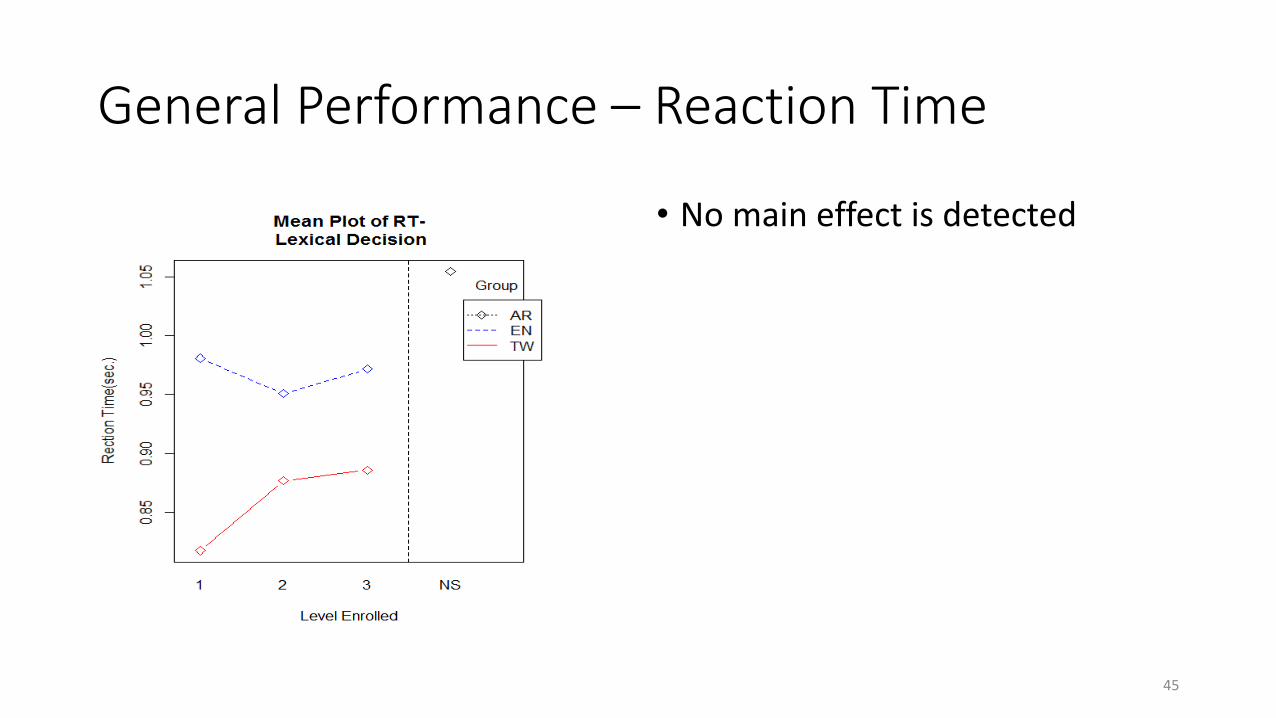
General Performance – Reaction Time
• No main effect is detected
45
Frequency Effect on Reaction Time
46
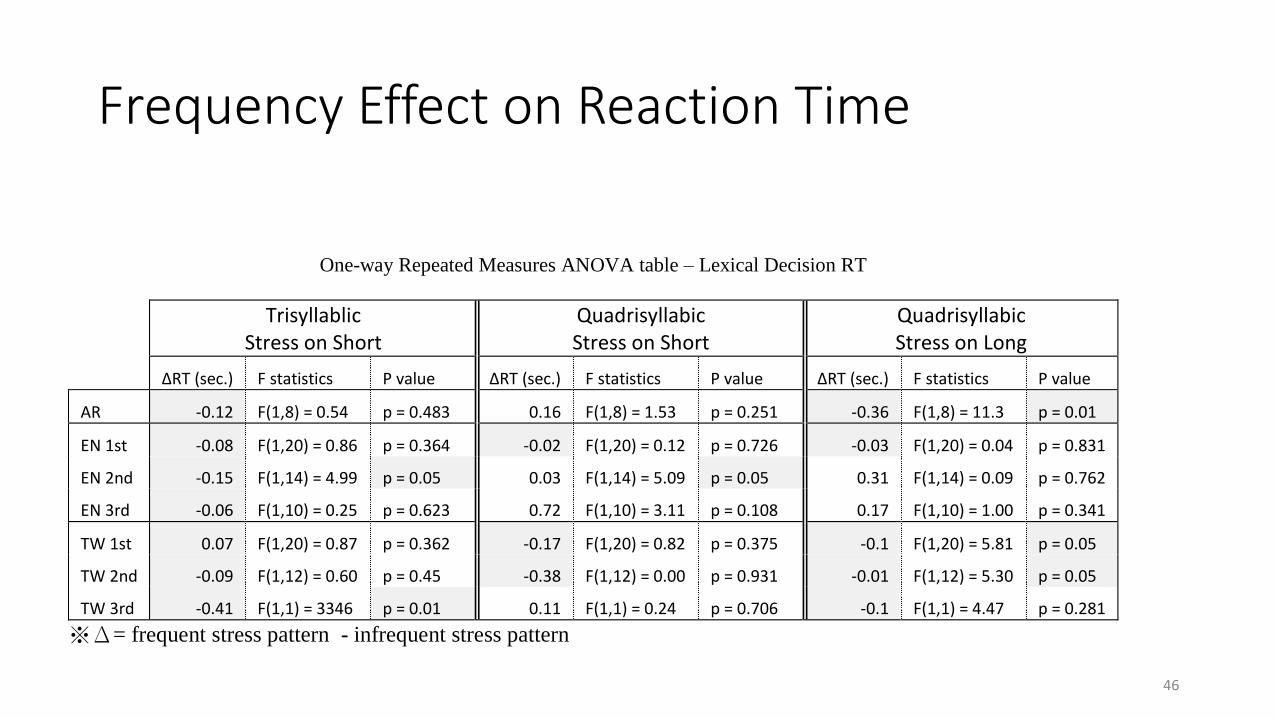
One-way Repeated Measures ANOVA table – Lexical Decision RT
Trisyllablic Stress on Short
Quadrisyllabic Stress on Short
Quadrisyllabic Stress on Long
ΔRT (sec.) F statistics P value ΔRT (sec.) F statistics P value ΔRT (sec.) F statistics P value
AR -0.12 F(1,8) = 0.54 p = 0.483 0.16 F(1,8) = 1.53 p = 0.251 -0.36 F(1,8) = 11.3 p = 0.01
EN 1st -0.08 F(1,20) = 0.86 p = 0.364 -0.02 F(1,20) = 0.12 p = 0.726 -0.03 F(1,20) = 0.04 p = 0.831
EN 2nd -0.15 F(1,14) = 4.99 p = 0.05 0.03 F(1,14) = 5.09 p = 0.05 0.31 F(1,14) = 0.09 p = 0.762
EN 3rd -0.06 F(1,10) = 0.25 p = 0.623 0.72 F(1,10) = 3.11 p = 0.108 0.17 F(1,10) = 1.00 p = 0.341
TW 1st 0.07 F(1,20) = 0.87 p = 0.362 -0.17 F(1,20) = 0.82 p = 0.375 -0.1 F(1,20) = 5.81 p = 0.05
TW 2nd -0.09 F(1,12) = 0.60 p = 0.45 -0.38 F(1,12) = 0.00 p = 0.931 -0.01 F(1,12) = 5.30 p = 0.05
TW 3rd -0.41 F(1,1) = 3346 p = 0.01 0.11 F(1,1) = 0.24 p = 0.706 -0.1 F(1,1) = 4.47 p = 0.281
※Δ= frequent stress pattern - infrequent stress pattern
General Performance – Correction Rate
• The native group is significantly more accurate than the non-native groups
47
Frequency Effect on Correction Rate
48
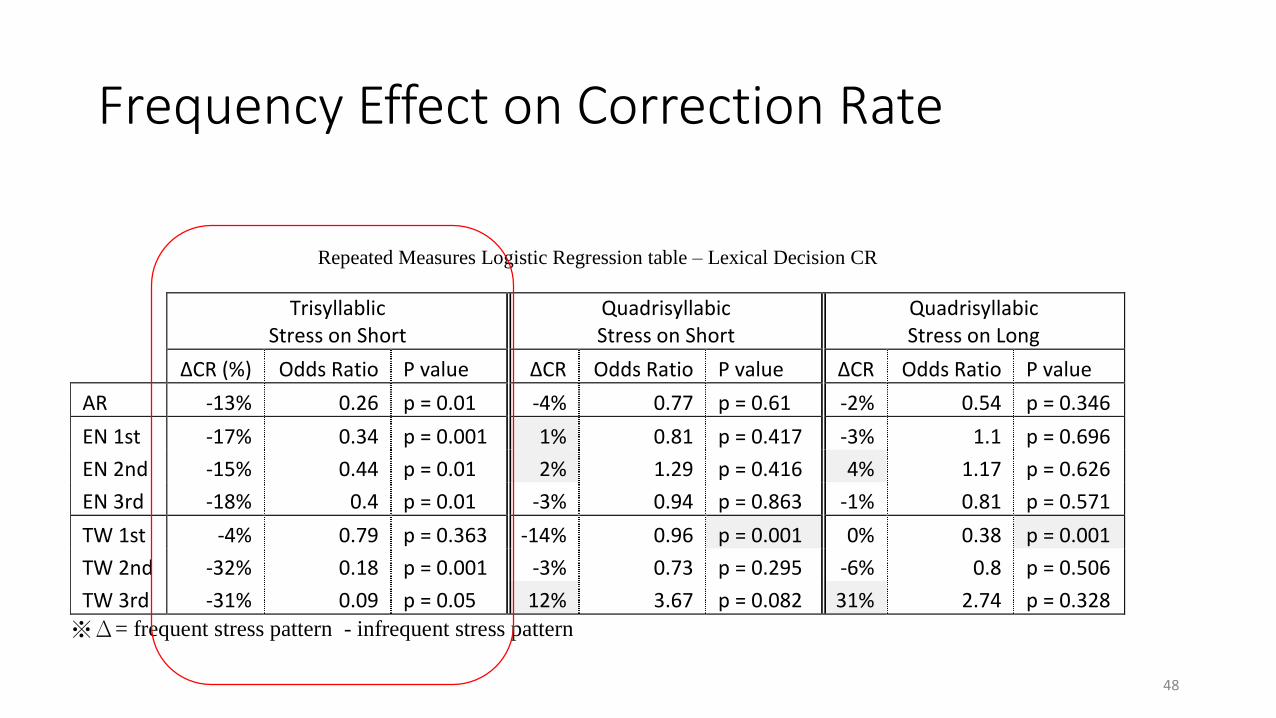
Repeated Measures Logistic Regression table – Lexical Decision CR
Trisyllablic
Stress on Short Quadrisyllabic Stress on Short
Quadrisyllabic Stress on Long
ΔCR (%) Odds Ratio P value ΔCR Odds Ratio P value ΔCR Odds Ratio P value
AR -13% 0.26 p = 0.01 -4% 0.77 p = 0.61 -2% 0.54 p = 0.346
EN 1st -17% 0.34 p = 0.001 1% 0.81 p = 0.417 -3% 1.1 p = 0.696
EN 2nd -15% 0.44 p = 0.01 2% 1.29 p = 0.416 4% 1.17 p = 0.626
EN 3rd -18% 0.4 p = 0.01 -3% 0.94 p = 0.863 -1% 0.81 p = 0.571
TW 1st -4% 0.79 p = 0.363 -14% 0.96 p = 0.001 0% 0.38 p = 0.001
TW 2nd -32% 0.18 p = 0.001 -3% 0.73 p = 0.295 -6% 0.8 p = 0.506
TW 3rd -31% 0.09 p = 0.05 12% 3.67 p = 0.082 31% 2.74 p = 0.328
※Δ= frequent stress pattern - infrequent stress pattern
Results: Production Experiment
49
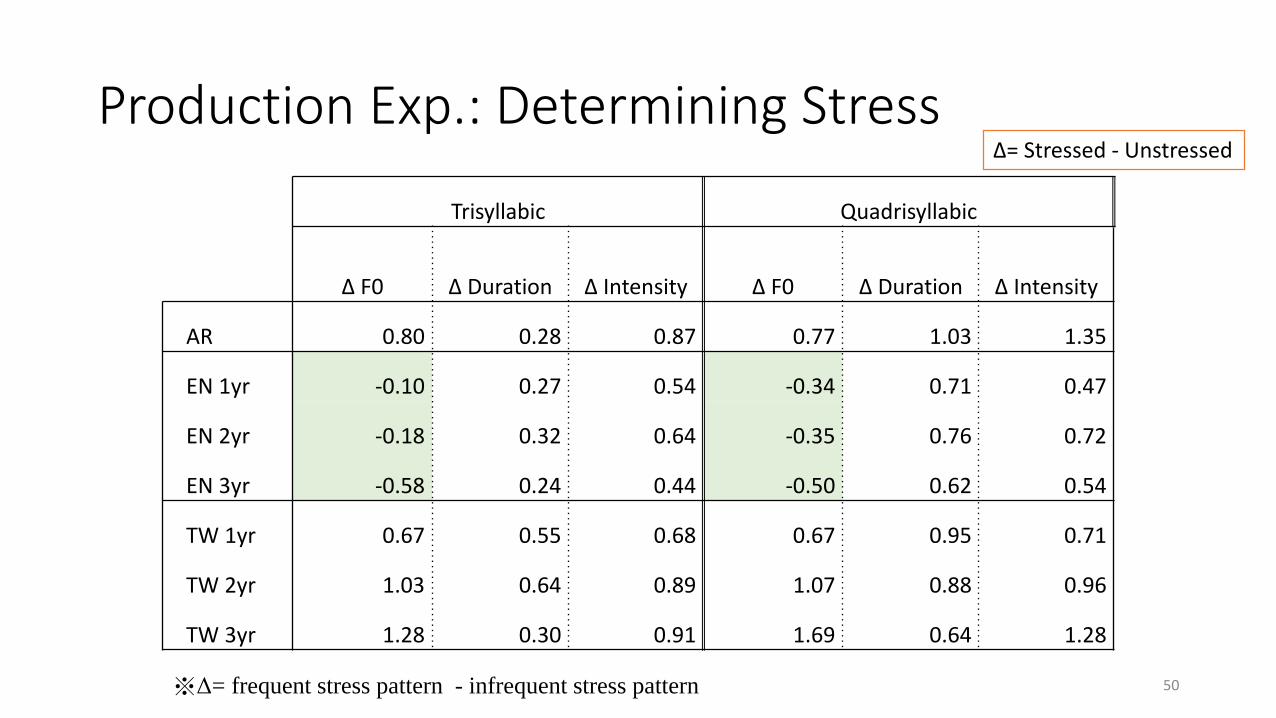
Production Exp.: Determining Stress
50
Δ= Stressed - Unstressed
Trisyllabic Quadrisyllabic
Δ F0 Δ Duration Δ Intensity Δ F0 Δ Duration Δ Intensity
AR 0.80 0.28 0.87 0.77 1.03 1.35
EN 1yr -0.10 0.27 0.54 -0.34 0.71 0.47
EN 2yr -0.18 0.32 0.64 -0.35 0.76 0.72
EN 3yr -0.58 0.24 0.44 -0.50 0.62 0.54
TW 1yr 0.67 0.55 0.68 0.67 0.95 0.71
TW 2yr 1.03 0.64 0.89 1.07 0.88 0.96
TW 3yr 1.28 0.30 0.91 1.69 0.64 1.28
※Δ= frequent stress pattern - infrequent stress pattern
Production Exp.: Determining Stress (ctn’d)
51
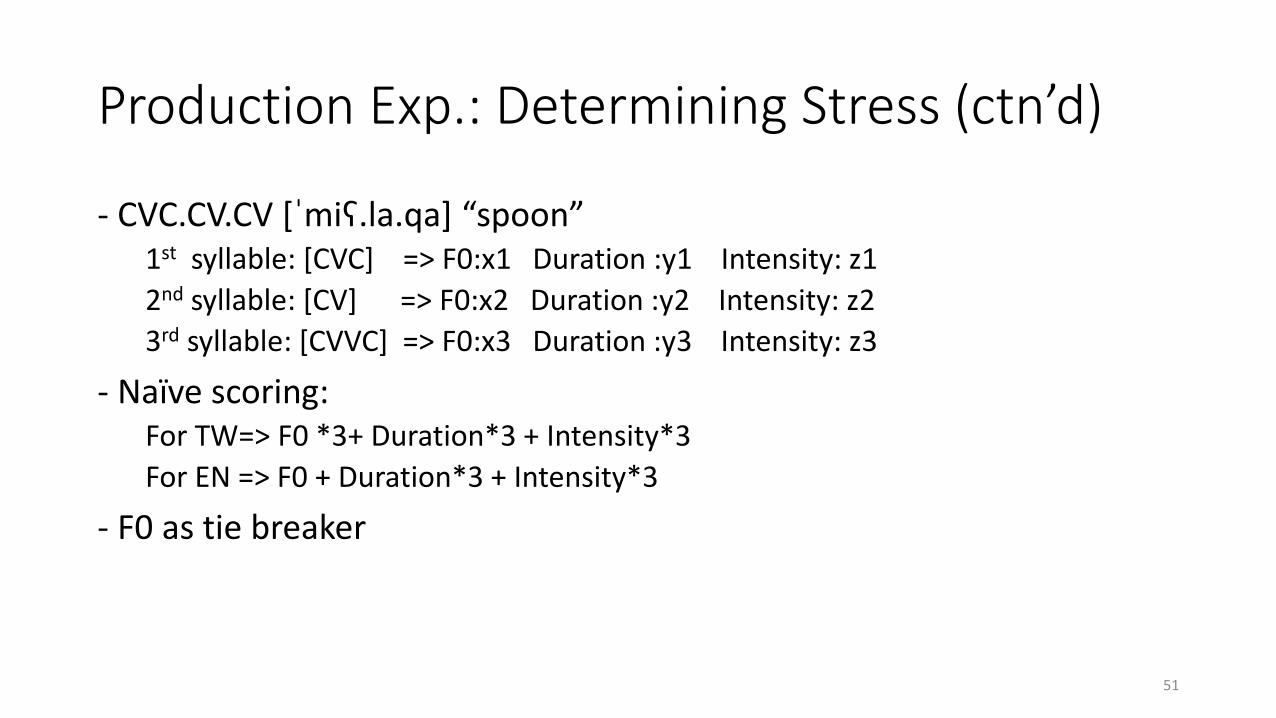
- CVC.CV.CV [ˈmiʕ.la.qa] “spoon”1st syllable: [CVC] => F0:x1 Duration :y1 Intensity: z1
2nd syllable: [CV] => F0:x2 Duration :y2 Intensity: z2
3rd syllable: [CVVC] => F0:x3 Duration :y3 Intensity: z3
- Naïve scoring: For TW=> F0 *3+ Duration*3 + Intensity*3
For EN => F0 + Duration*3 + Intensity*3
- F0 as tie breaker
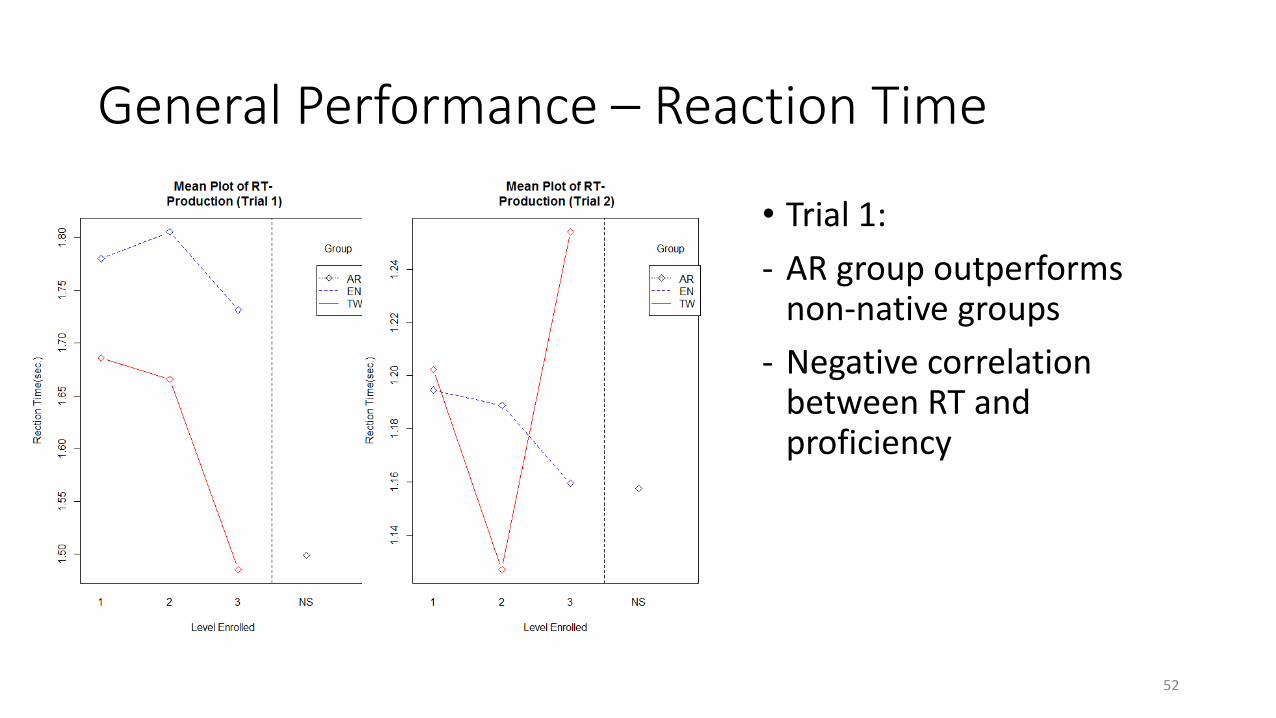
General Performance – Reaction Time
• Trial 1:
- AR group outperforms non-native groups
- Negative correlation between RT and proficiency
52
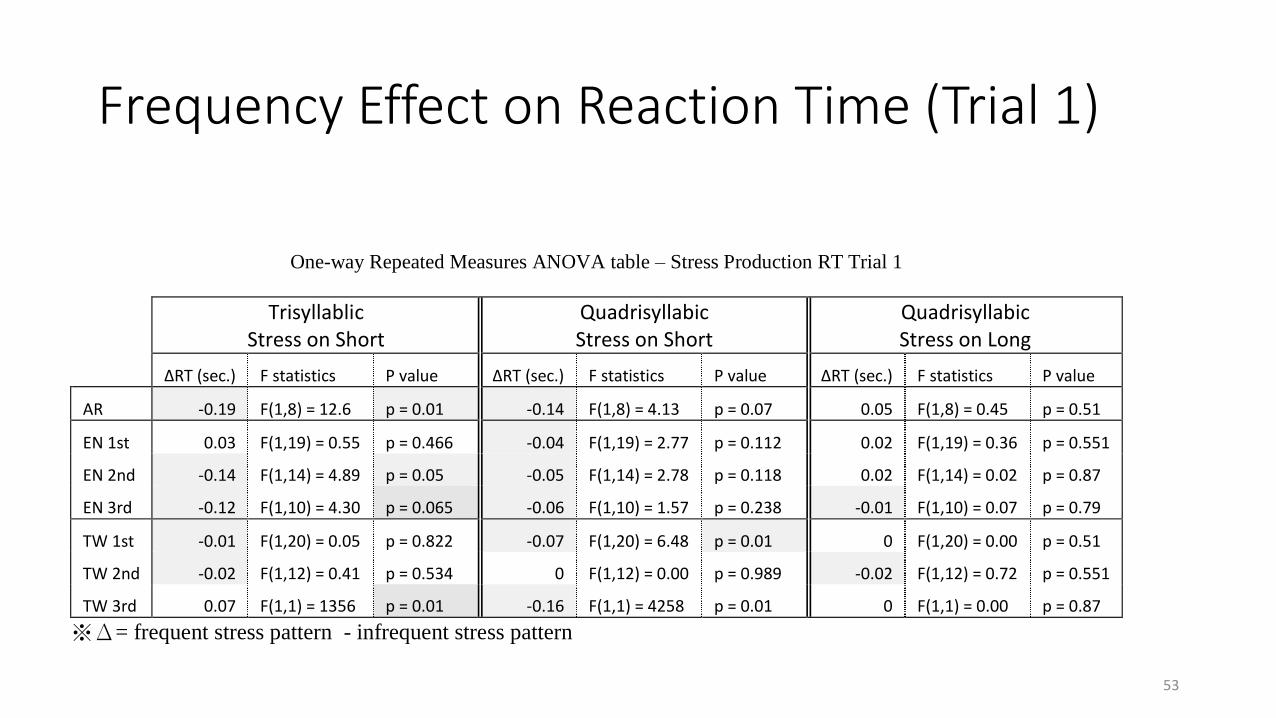
Frequency Effect on Reaction Time (Trial 1)
53
One-way Repeated Measures ANOVA table – Stress Production RT Trial 1
Trisyllablic Stress on Short
Quadrisyllabic Stress on Short
Quadrisyllabic Stress on Long
ΔRT (sec.) F statistics P value ΔRT (sec.) F statistics P value ΔRT (sec.) F statistics P value
AR -0.19 F(1,8) = 12.6 p = 0.01 -0.14 F(1,8) = 4.13 p = 0.07 0.05 F(1,8) = 0.45 p = 0.51
EN 1st 0.03 F(1,19) = 0.55 p = 0.466 -0.04 F(1,19) = 2.77 p = 0.112 0.02 F(1,19) = 0.36 p = 0.551
EN 2nd -0.14 F(1,14) = 4.89 p = 0.05 -0.05 F(1,14) = 2.78 p = 0.118 0.02 F(1,14) = 0.02 p = 0.87
EN 3rd -0.12 F(1,10) = 4.30 p = 0.065 -0.06 F(1,10) = 1.57 p = 0.238 -0.01 F(1,10) = 0.07 p = 0.79
TW 1st -0.01 F(1,20) = 0.05 p = 0.822 -0.07 F(1,20) = 6.48 p = 0.01 0 F(1,20) = 0.00 p = 0.51
TW 2nd -0.02 F(1,12) = 0.41 p = 0.534 0 F(1,12) = 0.00 p = 0.989 -0.02 F(1,12) = 0.72 p = 0.551
TW 3rd 0.07 F(1,1) = 1356 p = 0.01 -0.16 F(1,1) = 4258 p = 0.01 0 F(1,1) = 0.00 p = 0.87
※Δ= frequent stress pattern - infrequent stress pattern
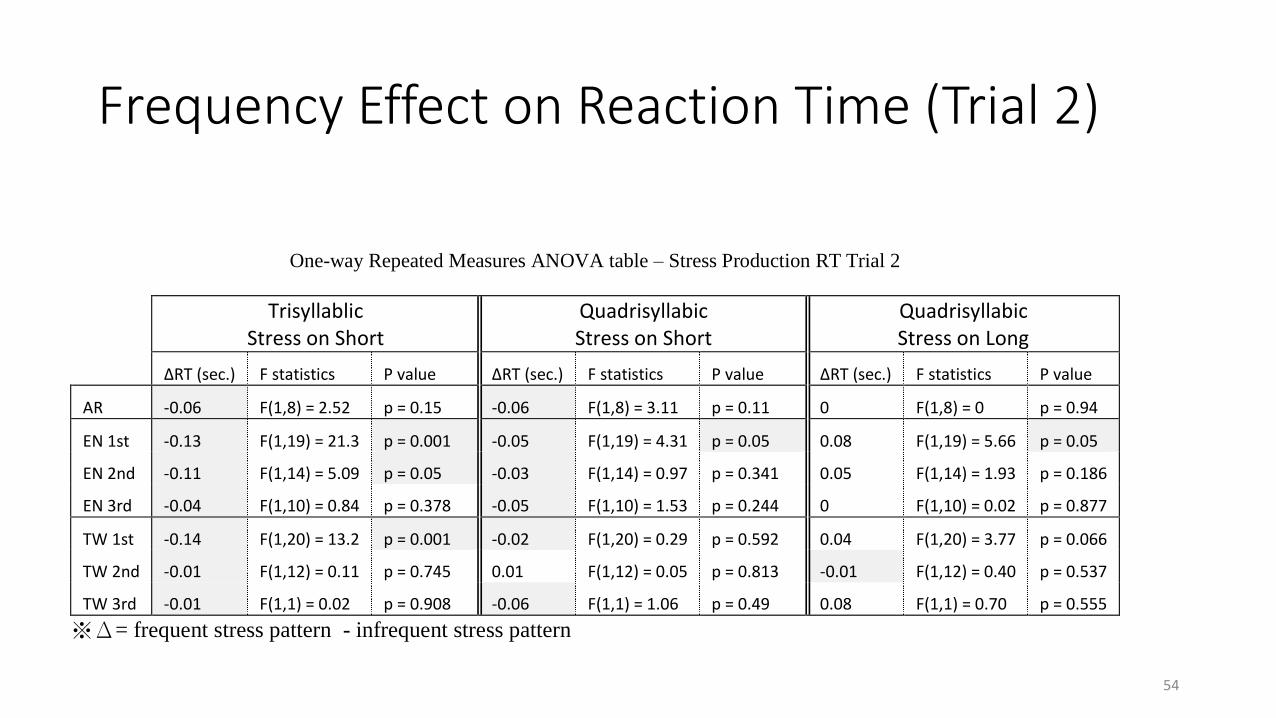
Frequency Effect on Reaction Time (Trial 2)
54
One-way Repeated Measures ANOVA table – Stress Production RT Trial 2
Trisyllablic Stress on Short
Quadrisyllabic Stress on Short
Quadrisyllabic Stress on Long
ΔRT (sec.) F statistics P value ΔRT (sec.) F statistics P value ΔRT (sec.) F statistics P value
AR -0.06 F(1,8) = 2.52 p = 0.15 -0.06 F(1,8) = 3.11 p = 0.11 0 F(1,8) = 0 p = 0.94
EN 1st -0.13 F(1,19) = 21.3 p = 0.001 -0.05 F(1,19) = 4.31 p = 0.05 0.08 F(1,19) = 5.66 p = 0.05
EN 2nd -0.11 F(1,14) = 5.09 p = 0.05 -0.03 F(1,14) = 0.97 p = 0.341 0.05 F(1,14) = 1.93 p = 0.186
EN 3rd -0.04 F(1,10) = 0.84 p = 0.378 -0.05 F(1,10) = 1.53 p = 0.244 0 F(1,10) = 0.02 p = 0.877
TW 1st -0.14 F(1,20) = 13.2 p = 0.001 -0.02 F(1,20) = 0.29 p = 0.592 0.04 F(1,20) = 3.77 p = 0.066
TW 2nd -0.01 F(1,12) = 0.11 p = 0.745 0.01 F(1,12) = 0.05 p = 0.813 -0.01 F(1,12) = 0.40 p = 0.537
TW 3rd -0.01 F(1,1) = 0.02 p = 0.908 -0.06 F(1,1) = 1.06 p = 0.49 0.08 F(1,1) = 0.70 p = 0.555
※Δ= frequent stress pattern - infrequent stress pattern
General Performance – Correction Rate
• The TW group is significantly more accurate than the ENG groups
• A positive correlation is found between proficiency and accuracy rate
• True for both trial
55
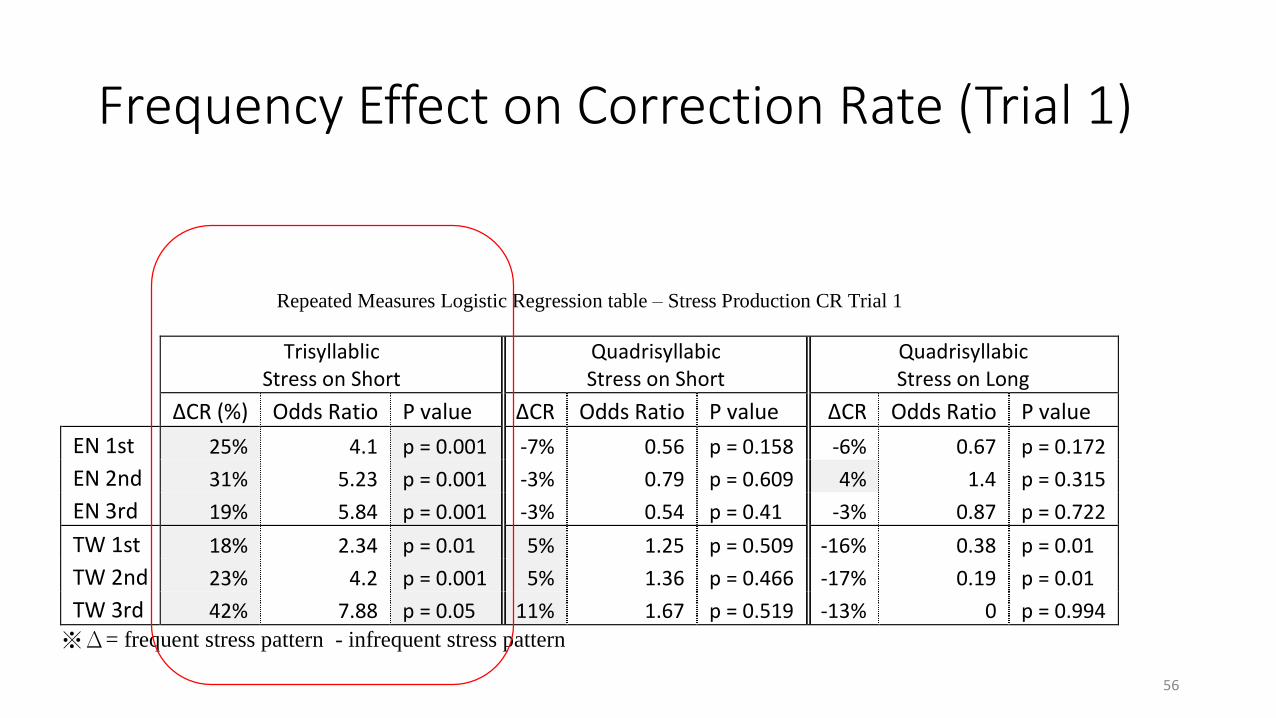
Frequency Effect on Correction Rate (Trial 1)
56
Repeated Measures Logistic Regression table – Stress Production CR Trial 1
Trisyllablic
Stress on Short Quadrisyllabic Stress on Short
Quadrisyllabic Stress on Long
ΔCR (%) Odds Ratio P value ΔCR Odds Ratio P value ΔCR Odds Ratio P value
EN 1st 25% 4.1 p = 0.001 -7% 0.56 p = 0.158 -6% 0.67 p = 0.172
EN 2nd 31% 5.23 p = 0.001 -3% 0.79 p = 0.609 4% 1.4 p = 0.315
EN 3rd 19% 5.84 p = 0.001 -3% 0.54 p = 0.41 -3% 0.87 p = 0.722
TW 1st 18% 2.34 p = 0.01 5% 1.25 p = 0.509 -16% 0.38 p = 0.01
TW 2nd 23% 4.2 p = 0.001 5% 1.36 p = 0.466 -17% 0.19 p = 0.01
TW 3rd 42% 7.88 p = 0.05 11% 1.67 p = 0.519 -13% 0 p = 0.994
※Δ= frequent stress pattern - infrequent stress pattern
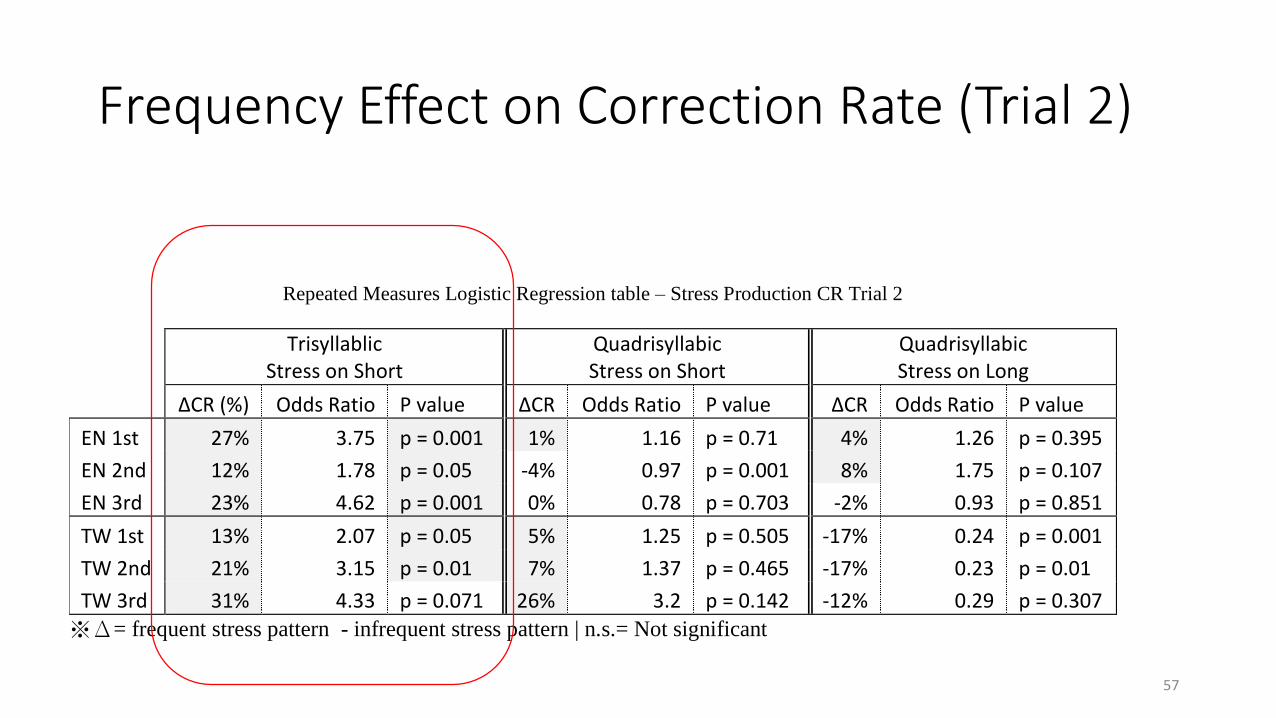
Frequency Effect on Correction Rate (Trial 2)
57
Repeated Measures Logistic Regression table – Stress Production CR Trial 2
Trisyllablic
Stress on Short Quadrisyllabic Stress on Short
Quadrisyllabic Stress on Long
ΔCR (%) Odds Ratio P value ΔCR Odds Ratio P value ΔCR Odds Ratio P value
EN 1st 27% 3.75 p = 0.001 1% 1.16 p = 0.71 4% 1.26 p = 0.395
EN 2nd 12% 1.78 p = 0.05 -4% 0.97 p = 0.001 8% 1.75 p = 0.107
EN 3rd 23% 4.62 p = 0.001 0% 0.78 p = 0.703 -2% 0.93 p = 0.851
TW 1st 13% 2.07 p = 0.05 5% 1.25 p = 0.505 -17% 0.24 p = 0.001
TW 2nd 21% 3.15 p = 0.01 7% 1.37 p = 0.465 -17% 0.23 p = 0.01
TW 3rd 31% 4.33 p = 0.071 26% 3.2 p = 0.142 -12% 0.29 p = 0.307
※Δ= frequent stress pattern - infrequent stress pattern | n.s.= Not significant
Summary – General Performance
• Some significant differences are characterized by the participants’ native languages and proficiency.
• Although the native group outperforms the non-native groups in some of the tasks (production RT, lexical decision), the AR group surprisingly performs worse than the non-native groups in stress identification task
• A positive correlation between performance and proficiency is found.
58
Summary – Frequency Effect
• Frequency effect at play given a specific syllabic contexts (at its prominence when the stressed syllable has a short vowel).
• Frequency is found to generally improve accuracy and reaction time, except for lexical decision.
• Frequency effect seems to have the effect of making a nonsense word sound real.
59
Limitations
• Lack of inflectional morphology in the data source
• Frugal binary categorization of frequency levels
• Less than ideal number of participants in 3rd year group
• Lack of involvement from other frequency cues, e.g., segmental cues
60

Thank you for your attention
Questions?
61