the pep boys – manny, moe & jack automotive … pep boys – manny, moe & jack automotive...
TRANSCRIPT

The Pep Boys – Manny, Moe & JackAutomotive Solutions Provider of Choice
July 2012

2
This presentation includes “forward-looking statements” within the meaning of Section 27A of the Securities Act and Section 21E of the Exchange Act. All statements contained herein other than statements of historical fact are “forward-looking statements” for purposes of these provisions. In some cases, forward-looking statements can be identified by the use of terminology such as “may”, “will”, “expects”, “plans”, “anticipates”, “estimates”, “potential” or “continue”, or the negative thereof or other comparable terminology. We have based these forward-looking statements on our current expectations and projections about future events. Although we believe that our assumptions made in connection with the forward-looking statements are reasonable, we cannot assure investors that our assumptions and expectations will prove to have been correct. Actual results could differ materially from our forward-looking statements. We undertake no obligation to publicly update or revise any forward-looking statements, whether as a result of new information, future events or otherwise.
Safe Harbor Statement

3
The Pep Boys – Manny, Moe & Jack
Founders of the Automotive Aftermarket
• Trusted since 1921
• Philadelphia – based
740 Locations (as of 6/30/12)
• 562 Supercenters (19-20k sf)
– 10 New Prototypes (13-14k sf)
• 171 Service & Tire Centers (5-6k sf)
• 7 Retail Stores
35 States and Puerto Rico
$2.1 Billion Revenues (1)
• 51% Service– 57% Maintenance & Repair
– 43% Tires & Related Services
• 38% Retail– 39% Appearance, Performance & Complementary
– 61% Light Maintenance & Parts
• 11% Commercial(1) Trailing 4 Quarters through Q1-2012

4
Pep Boys Vision: Automotive Solutions Provider of Ch oice for the Value Oriented Customer
Pep Boys Strategy: Earn the TRUST of our Customers every day through:� Preferred employer in the automotive aftermarket� TRUST behaviors
Lead with our Service business and grow through Ser vice & Tire Centers� Does Everything. For Less.� Market share leader in a fragmented market
Establish a differentiated Retail experience by lev eraging our Automotive Superstore � Broadest range of maintenance, performance and appe arance products
and accessories� Highest level of replacement parts coverage� Leading installer of automotive after-market produc ts
Leverage our Automotive Superstore to provide the m ost complete offering for our Commercial customers � One call solution for parts, tires, equipment, and accessories
The Pep BoysVision and Strategy

5
The Pep BoysEarn The Trust Of Our Customers Every Day
Preferred Employer in the automotive aftermarket
� Selecting the right people
� Training, development, and certification
� Equipped for success
� Performance-based compensation
TRUST behaviors
� Be friendly
� Do it right
� Show compassion
� Keep promises
TRUST measurements
� Customer retention
� On-line reputation

6
The Pep BoysLead With Service
Provides parts for Service“We install what we sell”
Market leader in appearance and performance products and accessories
Speed Shops for automotive enthusiasts
Competitive pricingSuperhubs serve neighboring stores with
same-day parts availability
Delivers to Service & Tire Centers
“One Call” for parts, tires,equipment and accessories
Leverages parts inventory to support competitive assortment and pricing
RETAIL COMMERCIAL
SERVICE
Full service: tires, maintenance, undercar and und erhood
Value leader as a result of our parts pricing advan tage:“We buy direct from the manufacturers and
pass the savings onto our customers”
Service & Tire Centers:Convenient for customers
Local “my mechanic”
Support Service
Automotive Superstore
Support Parts

7
The Pep BoysLead With Service
Service($179 billion) (1)
Industry Characteristics
Source: 2013 Digital Aftermarket Factbook.(1) Includes tire sales.
� Service is 4x larger than DIY
� Service is expected to grow slightly faster than DIY
� Service is highly fragmented (268,000 Service establishments in the US)
� DIY had been declining prior to 2007, but has benefited from the economic slowdown
� Consumers continue to shift to Service
• Cars more complex
• Lifestyle changes
• Aging of baby boomers
� Service consolidation continues
• Evolving technologies
• Increasingly capital-intensive
• High barrier to entry for new players
Do It Yourself($44 billion)
2011 Sales = $223 billion
DIY20%
DIFM & Tires80%
Sears
Pep BoysFirestoneJiffy LubeTBCMidasGoodyearAAMCOMonroMeineke
Carquest
AutozoneAdvanceO'Reilly
Pep Boys
NAPA
Independents, Regionals
64%
Dealerships30%
Other59%

8
Full service provider
More than 7000 service bays
National scale
Parts sourced directly from manufacturers
Savings passed onto customers
Tires Alignments
Oil changes Brakes
Ride control HVAC
Starting and charging Tune-ups
Engine performance Fuel systems
Maintenance products and services
Engine and transmission R&R
Computer module flashing
The Pep BoysLead With Service

9
The Pep BoysGrow Through Service & Tire Centers
• Customer friendly: local “my mechanic”
• Higher financial return: leverage existing assets
• Existing facility: 4 to 8 bays
• Full service: tires, maintenance, undercar, underhood
• Stock high velocity assortment
• Retail that targets our service customer, when space permits
• Convenient to where customers live and work
– 3 to 5 mile trade area
• Higher median household income
• 5 to 15 minutes from supporting Supercenter
• Build-to-suits starting in 2013
Model
Locations
Markets
• Individual sites in biggest Pep Boys markets
• Small chains in other Pep Boys markets
• Consider chains in new markets opportunistically
10
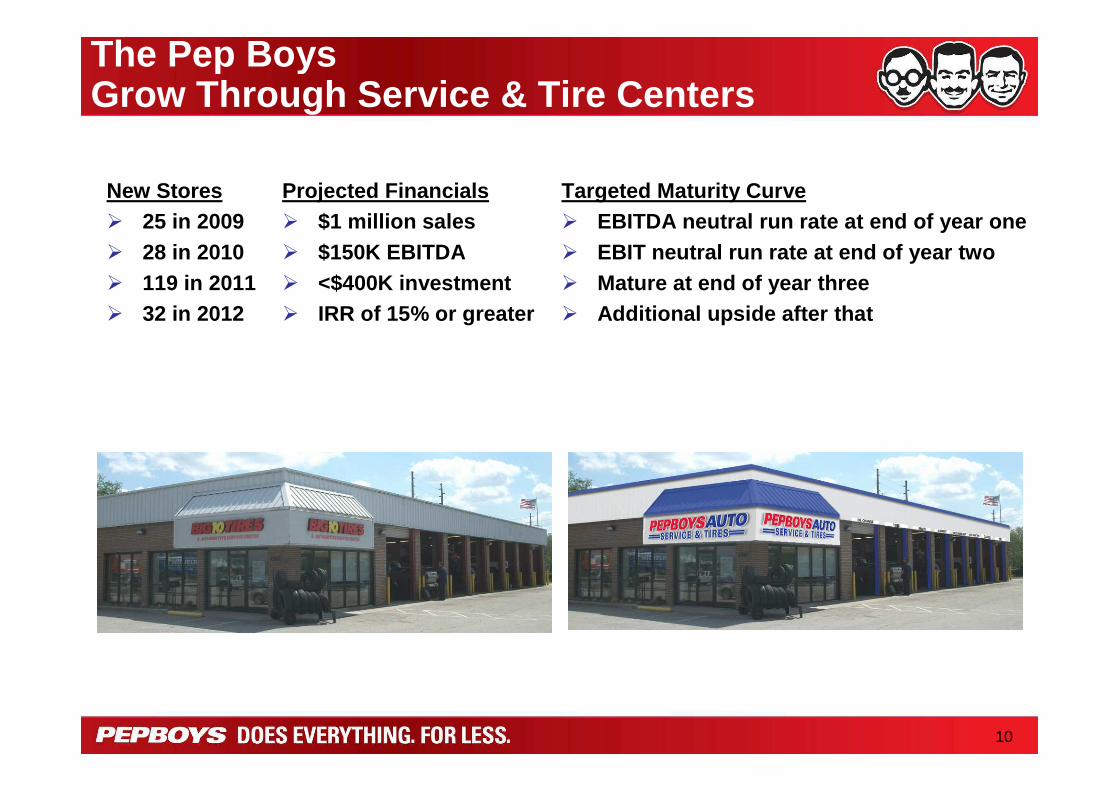
The Pep Boys Grow Through Service & Tire Centers
New Stores� 25 in 2009� 28 in 2010� 119 in 2011� 32 in 2012
Projected Financials� $1 million sales� $150K EBITDA � <$400K investment� IRR of 15% or greater
Targeted Maturity Curve� EBITDA neutral run rate at end of year one� EBIT neutral run rate at end of year two� Mature at end of year three� Additional upside after that

11
Pep Boys Supercenters
Florida Tire Locations
NewService & Tire Centers
The Pep BoysGrowth Leads to Market Density – Orlando / Daytona Marke t
Big 10 Locations

12
Pep Boys Supercenters
NewService & Tire Centers
The Pep BoysAtlanta Market
Big 10 Locations

13
Pep Boys Supercenters
NewService & Tire Centers
The Pep BoysLos Angeles Market

14
Pep Boys Supercenters
NewService & Tire Centers
The Pep BoysPhiladelphia Market
New Supercenters

15
Pep Boys Supercenters
NewService & Tire Centers
The Pep BoysChicago Market
New Supercenters

16
The Pep BoysService & Tire Center Sales Continue to Build
Sales at both organic and acquisition Service & Tire Centers continue to mature
Organic Service & Tire Centers
1
11
18
4143
52
60
65
0
5000
10000
15000
20000
25000
30000
1 6 11 16 21 26 31 36 41 46 51 56 61 66 71 76 81 86 91 96 101
106
111
116
121
126
131
136
141
146
151
156
161
166
Weeks of Operation (beginning with first full month)
Ave
rage
Wee
kly
Sal
es
0
10
20
30
40
50
60
70
# Lo
catio
ns in
Ope
ratio
n
Acquisition Service & Tire Centers
$14.0
$18.1
$12.2
$25.4
$15.6 *
$19.6 *
$12.2 *
$27.7 $27.8 *
$0
$5,000
$10,000
$15,000
$20,000
$25,000
$30,000
Florida Tire Davco Big 10 My Mechanic
Ave
rage
Wee
kly
Sal
es P
er S
tore
Year 1 Year 2 Year 3
* Represents year-to-date sales since acquisition anniversary date
17
Automotive Superstore means more than just a parts store
Starts with parts (knowledgeable people, parts availability, competitive pricing)
We are the market leader in appearance and performance products and accessories
Wash and wax dominanceInterior accessoriesExterior accessoriesPerformance / speed shopsAutomotive electronicsLight maintenanceFluidsParts, especially late model coverageTools for DIY customers
The Pep Boys Automotive Superstore

18
The Pep Boys New Supercenter PrototypeCustomer Perception Benefits� Showcases service center� Dominant parts presentation� Easy to navigate� Customer lounge
Customer Service Benefits� One customer advisor team� Greeted at the entrance� Performance based pay
Financial Benefits� 13-14,000 square feet versus
19-20,000 square feet� Consolidated payroll model� Lower operating cost
New Store Plans� Hubs for Service & Tire Center
growth� Relocation opportunities� Will open 8 in FY 2012

19
The Pep BoysNew Supercenter Prototype

20
The Pep BoysSpeed Shop� Remodel existing Supercenters to
accommodate Speed Shops
• 20 open in California, New York, Florida, Pennsylvania, Maryland, New Jersey, Nevada, Arizona, and Texas
• Targeting a total of 100.
� Attracts Automotive Enthusiasts
• Muscle car; import tuner; sport truck, Jeep, diesel
� Highlights our competitive point of differentiation
• Staffed with dedicated enthusiasts
• Sales and installation of our products
� Creates destination store in key markets
• Expands 3-5 mile trade area
• Draws car shows and other enthusiast activities
• Serves surrounding stores

21
The Pep Boys Distribution Network
Indianapolis Distribution
Center
RegionalDistribution
Centers
SuperhubLocations
Supercenter & Retail
Locations
Service & Tire Centers
# Locations
1
4• San Bernardino, CA• McDonough, GA• Mesquite, TX• Chester, NY
• Plainfield, IN
44 Servicing 410 stores
569
171
# SKUs
~100,000
~45,000
~40,000
~23,000
~3,000
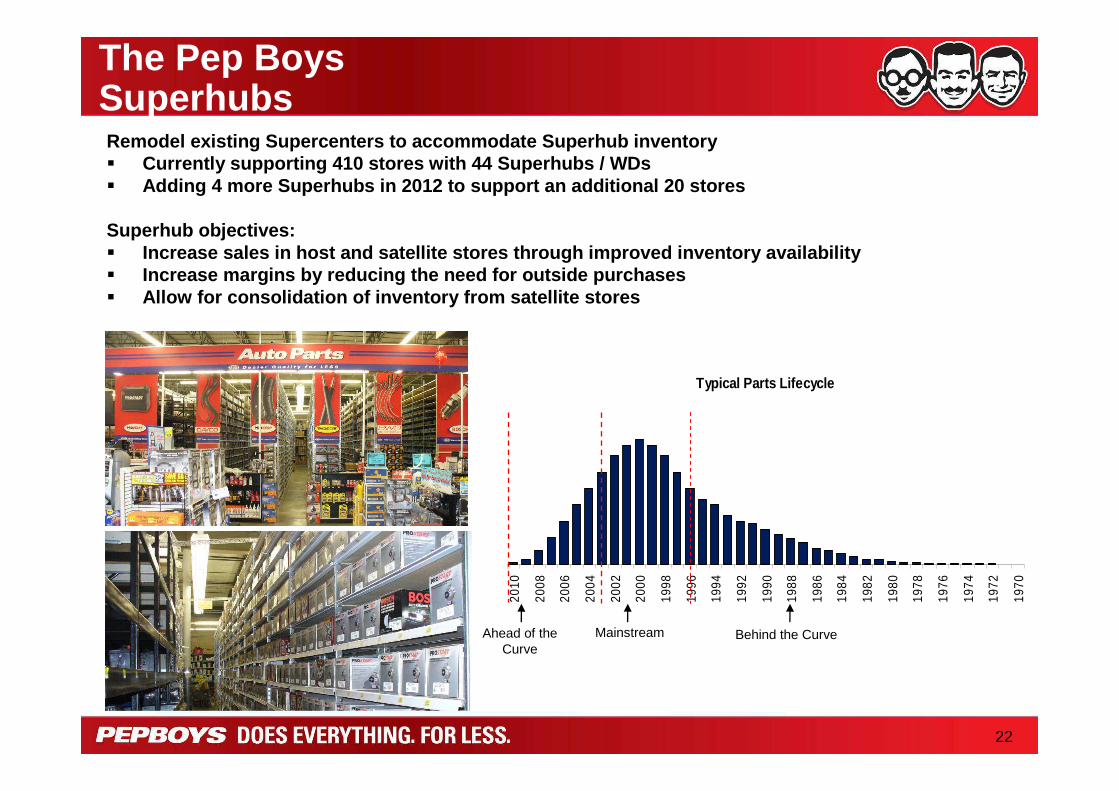
22
The Pep Boys SuperhubsRemodel existing Supercenters to accommodate Superh ub inventory� Currently supporting 410 stores with 44 Superhubs / WDs� Adding 4 more Superhubs in 2012 to support an addit ional 20 stores
Superhub objectives:� Increase sales in host and satellite stores through improved inventory availability� Increase margins by reducing the need for outside p urchases� Allow for consolidation of inventory from satellite stores
Typical Parts Lifecycle
2010
2008
2006
2004
2002
2000
1998
1996
1994
1992
1990
1988
1986
1984
1982
1980
1978
1976
1974
1972
1970
Ahead of the Curve
Mainstream Behind the Curve

23
The Pep Boyse-SERVE … Appointment Scheduling

24
The Pep Boyse-SERVE … TreadSmart

25
The Pep Boyse-SERVE… Buy Online Pick Up in Store (rolled out in Q2 2 012)
Excellent web experience- Discover
- Research - Purchase
My Home
Pick up in Store
Installed on My Car
Online Service
Selection
Parts and Accessories
Tires and Installation
IndianapolisDC
Shopping Experience
Payment and Shipping Fulfillment
Store
• Ship to Home planned Q4 2012
26
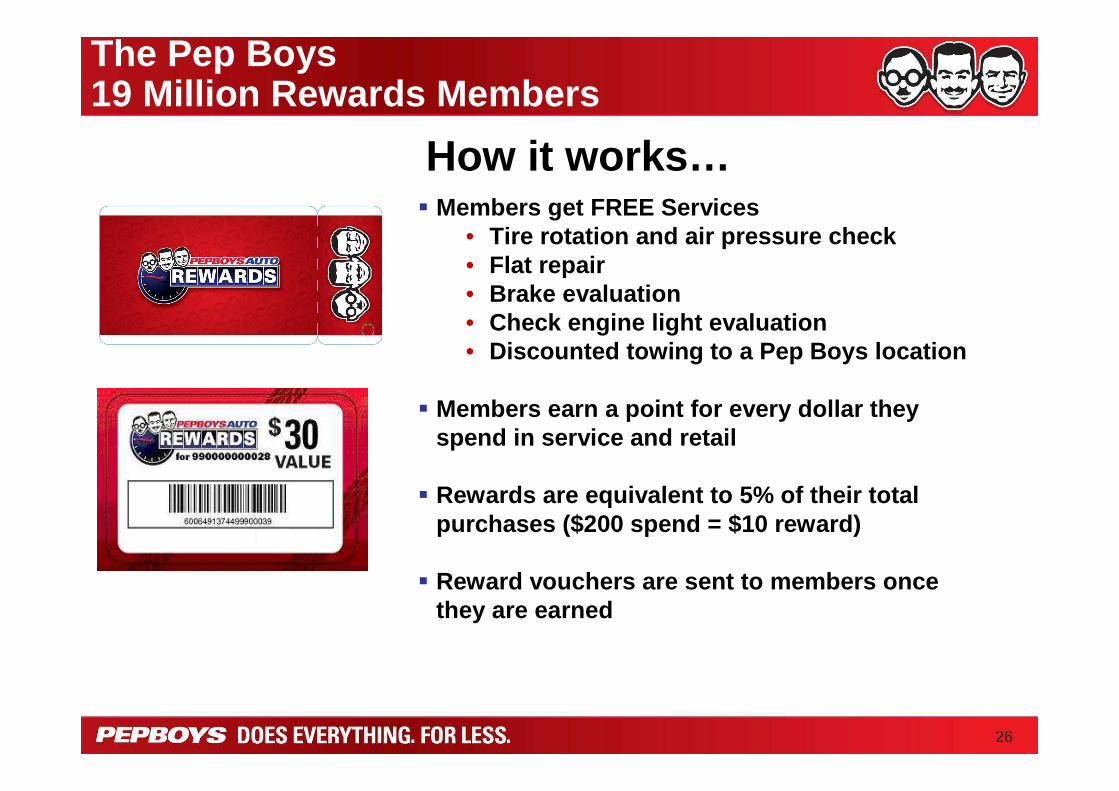
The Pep Boys19 Million Rewards Members
How it works …� Members get FREE Services
• Tire rotation and air pressure check• Flat repair• Brake evaluation• Check engine light evaluation• Discounted towing to a Pep Boys location
� Members earn a point for every dollar they spend in service and retail
� Rewards are equivalent to 5% of their total purchases ($200 spend = $10 reward)
� Reward vouchers are sent to members once they are earned

27
The Pep BoysImproving Financial Performance
Notes : •Results adjusted to exclude certain one time non-re curring charges and gains.•After-Tax ROIC = EBIT * (1-0.39 tax rate) / (Averag e Debt + Average Equity – Average Cash)•Earnings Per Share is Diluted EPS•See next slide for unadjusted financial metrics and list of one-time non-recurring charges and gains.
Total Revenue (Billions)
$2.21 $2.24 $2.14$1.93 $1.91 $1.99 $2.06
FY-2005 FY-2006 FY-2007 FY-2008 FY-2009 FY-2010 FY-2011
Operating Margin(target: mid-single-digit)
0.9%0.4%
3.1%3.8%
-0.6% -0.8%
3.3%
FY-2005 FY-2006 FY-2007 FY-2008 FY-2009 FY-2010 FY-2011
Earnings Per Share
($0.13)
($0.46)($0.66)
$0.38$0.60
$0.49
($0.69)
FY-2005 FY-2006 FY-2007 FY-2008 FY-2009 FY-2010 FY-2011
After-Tax ROIC(target: high-single-digit)
1.8%
5.0%6.8% 5.9%
-1.1%
0.7%-0.4%
FY-2005 FY-2006 FY-2007 FY-2008 FY-2009 FY-2010 FY-2011

28
The Pep BoysUnadjusted Financial Metrics
List of one-time non-recurring charges and gains :2005: Includes a $4.2 million pre-tax asset impairment charge.2006: Includes a pre-tax gain of $8.968 million from d isposition of assets.2007: Includes an aggregate pre-tax charge of $10.963 million related to the closure of 31 stores ($7.199 million cost of sales and $3.764 million discontinued operations). Includes a pre-tax inven tory impairment charge of $32.803 million (cost of sales) for the discontinuance of certain product offerings. Also includes a pre-tax gain of $15.151 million from disposition of assets.2008: Includes an aggregate pre-tax charge of $5.353 mi llion ($3.427 million cost of sales and $1.926 mill ion discontinued operations) for asset impairment. Includes a pre-tax gain from debt reti rement of $3.46 million partially offset by a $1.17 2 million pre-tax charge for deferred financing costs. Also includes a pre-tax gain of $9.716 milli on from disposition of assets.2009: Includes a pre-tax charge of $3.11 million ($2.88 4 million cost of sales and $0.226 million disconti nued operations) for asset impairment. Includes a pre-tax gain from debt retirement of $6. 248 million. In addition, includes a net pre-tax g ain of $1.213 million from disposition of assets.2010: Includes a pretax benefit of $5.9 million due to the reduction in reserve for excess inventory which reduced merchandise cost of sales and an aggregate pretax charge of $1.0 million for asset i mpairment ($0.8 million was charged to merchandise cost of sales and $0.2 million was charged to service cost of sales). Also includes a pre-tax ga in of $2.467 million from disposition of assets.2011: Includes an aggregate pre-tax charge of $1.6 mill ion for asset impairment ($0.6 million was charged to merchandise cost of sales and $1.0 million was charged to service cost of sales). Also includes a tax benefit of $3.6 million due to rele ase of valuation allowances on state net operating loss carry forwards and credits.
Total Revenue (Billions)
$2.21 $2.24 $2.14$1.93 $1.91 $1.99 $2.06
FY-2005 FY-2006 FY-2007 FY-2008 FY-2009 FY-2010 FY-2011
Operating Margin
1.3%
-0.8%
3.0%
4.2%
3.2%
-0.5%-0.6%
FY-2005 FY-2006 FY-2007 FY-2008 FY-2009 FY-2010 FY-2011
Earnings Per Share
($0.05)
($0.79)($0.58)
$0.44$0.69
$0.54
($0.69)
FY-2005 FY-2006 FY-2007 FY-2008 FY-2009 FY-2010 FY-2011
After-Tax ROIC
2.3%4.8%
7.4%
-0.4%
-1.1% -0.8%
5.8%
FY-2005 FY-2006 FY-2007 FY-2008 FY-2009 FY-2010 FY-2011

29
The Pep Boys Macro -environment
� Primary external drivers for Pep Boys are:
• Miles driven for tires, maintenance and repairs
• GDP for discretionary purchases
� Other factors include:• Gas prices• Age of vehicles• Car sales (new and used)• Shift to smaller / lighter
vehicles• New technologies
� Our plans assume that the macro-environment continues to stabilize
Notes :US Real GDP in billions of chained 2005 dollars (tr ailing 4 quarters expressed at annual rates).Vehicle Miles Traveled in billions trailing 4 quart ers (all roads and streets).Q1 data estimated based on run rate thru January 20 12Source: US Bureau of Economic Analysis
US Department of Transportation (Federal Highway Ad ministration)
Source: Bureau of Transportation Statistics, U.S. Department of Transportation
2,700
2,800
2,900
3,000
3,100
200
0_Q
1
200
0_Q
2
200
0_Q
32
000
_Q4
20
01_Q
1
20
01_Q
2
200
1_Q
3
200
1_Q
4
200
2_Q
1
200
2_Q
2
200
2_Q
32
002
_Q4
20
03_Q
1
20
03_Q
2
200
3_Q
3
200
3_Q
4
200
4_Q
1
200
4_Q
22
004
_Q3
20
04_Q
4
20
05_Q
1
20
05_Q
2
20
05_Q
3
200
5_Q
4
200
6_Q
1
200
6_Q
22
006
_Q3
20
06_Q
4
20
07_Q
1
20
07_Q
2
20
07_Q
3
200
7_Q
4
200
8_Q
12
008
_Q2
20
08_Q
3
20
08_Q
4
20
09_Q
1
20
09_Q
2
200
9_Q
3
200
9_Q
4
201
0_Q
12
010
_Q2
20
10_Q
3
20
10_Q
4
20
11_Q
1
201
1_Q
2
201
1_Q
3
201
1_Q
4
201
2_Q
1
Veh
icle
Mile
s T
rave
led
(An
nua
l - T
raili
ng
4 Q
uar
ters
)
10,000
11,000
12,000
13,000
14,000
GD
P
VMT (Billions) GDP (Billions)
Year # Units (millions)2011 12.72010 11.62009 10.62008 13.52007 16.5
2001 - 2006 17.2
New Car Sales
30
The Pep BoysImproving Financial Performance� Low single digit comparable store sales growth
� 4% - 5% service bay growth per annum
� Gross margins are still an opportunity• Recover lost tire margins• Gross margin leaks• Cost of goods sold• Pricing and mix
� Sales growth leverages expense base• Productivity and cost reductions• Safety and claims reductions• Outlier management• “One Team” store structure
� Execution • Customer experience• Selling excellence

31
The Pep BoysSolid Financial Position� Financial flexibility
• $155m cash (as of July 2012)• $295m debt at favorable rates
• ½ due 2013; ½ due 2014 • Currently evaluating refinancing alternatives
� Dry powder• 232 owned stores
• Appraised value $670m – 1Q 2011• Net book value $449m – 4Q 2011• Net tax value $331m – 4Q 2011
• 162 ground leased stores• 346 leased stores• 4 owned distribution centers• 1 leased distribution center• 2 owned office buildings
� Sales growth leverages asset base• Investing in new parts while improving inventory pr oductivity• Expanding vendor financing programs to improve paya bles leverage• Maintenance capital expenditures of $40 million per year

32
The Pep Boys Investment Story� We have turned
around the company
� We still have opportunity for improvement in our base business
� We have a solid foundation for growth for years to come