the pennsylvania state university phase transformations
TRANSCRIPT

The Pennsylvania State University
The Graduate School
Department of Materials Science and Engineering
PHASE TRANSFORMATIONS DURING CONTINUOUS HEATING AND COOLING
IN A TI-AL-RU ALLOY
A Dissertation in
Materials Science and Engineering
by
Supphachan Rajsiri
2012 Supphachan Rajsiri
Submitted in Partial Fulfillment of the Requirements
for the Degree of
Doctor of Philosophy
May 2012

The dissertation of Supphachan Rajsiri was reviewed and approved* by the following:
Earle R. Ryba Associate Professor of Metallurgy Dissertation Advisor Chair of Committee
Paul R. Howell Professor of Metallurgy
Todd A. Palmer Assistant Professor of Materials Science and Engineering
Michael T. Lanagan Professor of Engineering Science and Mechanics
Gary L. Messing Distinguished Professor of Ceramic Science and Engineering Head of the Department of Materials Science and Engineering
*Signatures are on file in the Graduate School

iii
ABSTRACT
The phase transformations in a Ti-Al-Ru alloy were studied by performing high-temperature X-ray diffractions using synchrotron radiation. A Ti-32.4 at% Al-4.1 at% Ru alloy was used; it undergoes various phase transformations. Specimens were prepared by arc-melting. The alloy was β-homogenized at 1300 oC and ice-water quenched. Powdered specimens with particle size ≤45 µm were prepared, and packed in a quartz capillary. The X-ray measurements were performed during the step-wise heating and cooling between room temperature and 1220 oC. A single β phase with relatively small amounts of α2, G and α phases were initially present in the sample. Decomposition of the as-quenched β phase to the equilibrium phases was investigated as well as the phase relationships among the major phases (β, α2 and G). At an average heating rate of 5.3 oC/min, most of the β phase decomposed to form the α2 and G phases, possibly through eutectoid reaction taking place between 687 oC-709 oC. The γ phase formed at approximately 917 oC. A reverse eutectoid reaction for the formation of β phase was observed between 1018 oC and 1220 oC, but was incomplete due to two possible reasons: suspected low diffusion rates in the α2 and G phases, and the presence of a relatively large amount of dissolved oxygen, which increases the stability of the α2 phase. β-ordering could not be detected due to the overlap of the β’ (001) reflection, the most intense superlattice reflection for the β’ phase, and the Ti5Si3 (020) diffraction peaks. During cooling from 1220 oC to room temperature at an average heating rate of 4.8 oC/min, the β phase partially decomposed to α2 and G phases, but no significant amount of transformation was observed. The (Ti,Al)Ru phase was observed on the X-ray patterns recorded at 1068 oC through 36 oC. The overall reaction rates of the as-quenched Ti-32.4 at% Al-4.1 at% Ru alloy were sluggish. Mathematical expressions for the relationships between lattice parameters and alloy compositions were proposed for the G, β, and α2 phases. It was suspected that the presence of Ru affects the stability of the β phase. A slight change in Ru content was also detected in the α2 and G phases during the phase reactions. Simulated step-wise heating and cooling microstructure contained plate-like α2 phase and the G-phase matrix as the product of the β decomposition between 683 oC and 709 oC. Small α2 particles were observed nearby the interface between the plate-like α2 phase and the G phase matrix as a result of the β decomposition during cooling from 1220 oC. Fundamental information for the processing of an alloy similar to this Ti-Al-Ru alloy is proposed: a deformation processing of single β phase alloys should be done below 680 oC, and any thermal processing above 680 oC should be avoided due to the presence of the brittle G phase.

iv
TABLES OF CONTENTS
LIST OF FIGURES.............................................................................................................. vi LIST OF TABLES ................................................................................................................ x ACKNOWLEDGEMENTS ................................................................................................ xii Chapter 1 Introduction ....................................................................................................... 1
1.1 Background ........................................................................................................... 1 1.2 Objective of this research...................................................................................... 4
Chapter 2 Literature Review.............................................................................................. 6 2.1 Chapter overview .................................................................................................. 6 2.2 Basic phase transformation of Ti and β-Ti alloys ................................................. 6 2.3 Beta-stabilization................................................................................................... 9 2.4 Basic processing of β-Ti alloys ........................................................................... 14 2.5 Phase transformation during cooling from β-phase field.................................... 17
2.5.1 Equilibrium cooling..................................................................................... 17 2.5.1.1 β Decomposition in the α+β phase field................................................. 19 2.5.1.2 β-Eutectoid decomposition...................................................................... 19
2.5.2 Non-equilibrium cooling ............................................................................. 20 2.5.2.1 Widmanstätten structure formation......................................................... 21 2.5.2.2 β-Eutectoid decomposition under non-equilibrium cooling ................... 22 2.5.2.3 Martensitic transformation ...................................................................... 23 2.5.2.4 Athermal ω phase.................................................................................... 25 2.5.2.5 Ordering of the β phase........................................................................... 26
2.6 Phase transformation during reheating metastable β alloys................................ 28 2.6.1 Decomposition of β to α phase ................................................................... 29
2.6.1.1 Isothermal ω phase.................................................................................. 29 2.6.1.2 Phase separation ...................................................................................... 30
2.6.2 Direct nucleation of α from β phase ........................................................... 30 2.6.3 Intermetallic compound formation.............................................................. 31
2.7 Phase transformation in β-Ti with Ti3Al composition ........................................ 32 2.8 Previous studies in Ti-Al-Ru alloys .................................................................... 42
Chapter 3 Experimentation .............................................................................................. 59 3.1 Chapter overview ................................................................................................ 59 3.2 Alloy selection..................................................................................................... 59 3.3 Alloy preparation................................................................................................. 60 3.4 Heat treatment ..................................................................................................... 60 3.5 Microstructure observation and analysis............................................................. 61 3.6 Composition analysis on as-quenched specimens............................................... 61 3.7 High-temperature synchrotron x-ray diffraction ................................................. 62
3.7.1 Instrumentation............................................................................................ 62 3.7.1.1 High-temperature furnace........................................................................ 65 3.7.1.2 Temperature calibration using MgO ....................................................... 65 3.7.1.3 Position sensing detector (PSD).............................................................. 66

v
3.7.2 Specimen preparation for high-temperature x-ray diffraction .................... 69 3.8 X-ray diffraction data analysis ............................................................................ 74
3.8.1 Peak location ............................................................................................... 74 3.8.2 Phase identification in diffractometer patterns............................................ 74 3.8.3 Peak area ..................................................................................................... 75 3.8.4 Lattice parameter refinement ...................................................................... 76
3.9 Difficulties in the experiment.............................................................................. 76 Chapter 4 Results and Discussion.................................................................................... 78
4.1 Chapter overview ................................................................................................ 78 4.2 Microstructure of as-quenched samples.............................................................. 78 4.3 Nature of the XRD patterns................................................................................. 80
4.3.1 General features of diffraction pattern ........................................................ 81 4.3.1.1 Peak broadening ...................................................................................... 81 4.3.1.2 Peak shape versus particle statistics ........................................................ 82 4.3.1.3 Fragmented and asymmetric peak shapes ............................................... 83
4.4 Additional features of the x-ray patterns............................................................. 84 4.4.1 Quartz .......................................................................................................... 84 4.4.2 Specimen/quartz reaction layer ................................................................... 86
4.5 Modeling of lattice parameter for β, α2 and G phases ........................................ 87 4.6 Phase transformation studies on as-quenched samples ....................................... 98
4.6.1 Analysis of phase transitions from the x-ray diffraction patterns ............... 98 4.6.2 Summary on the phase transformations .................................................... 141 4.6.3 New information for industrial applications ............................................. 142
Chapter 5 Summary ....................................................................................................... 144 Chapter 6 Suggested Future Work................................................................................. 147
6.1 Decomposition rate of as-quenched β phase..................................................... 147 6.2 Phase transformation studies on as-quenched samples ..................................... 148
REFERENCES.................................................................................................................. 150

vi
LIST OF FIGURES
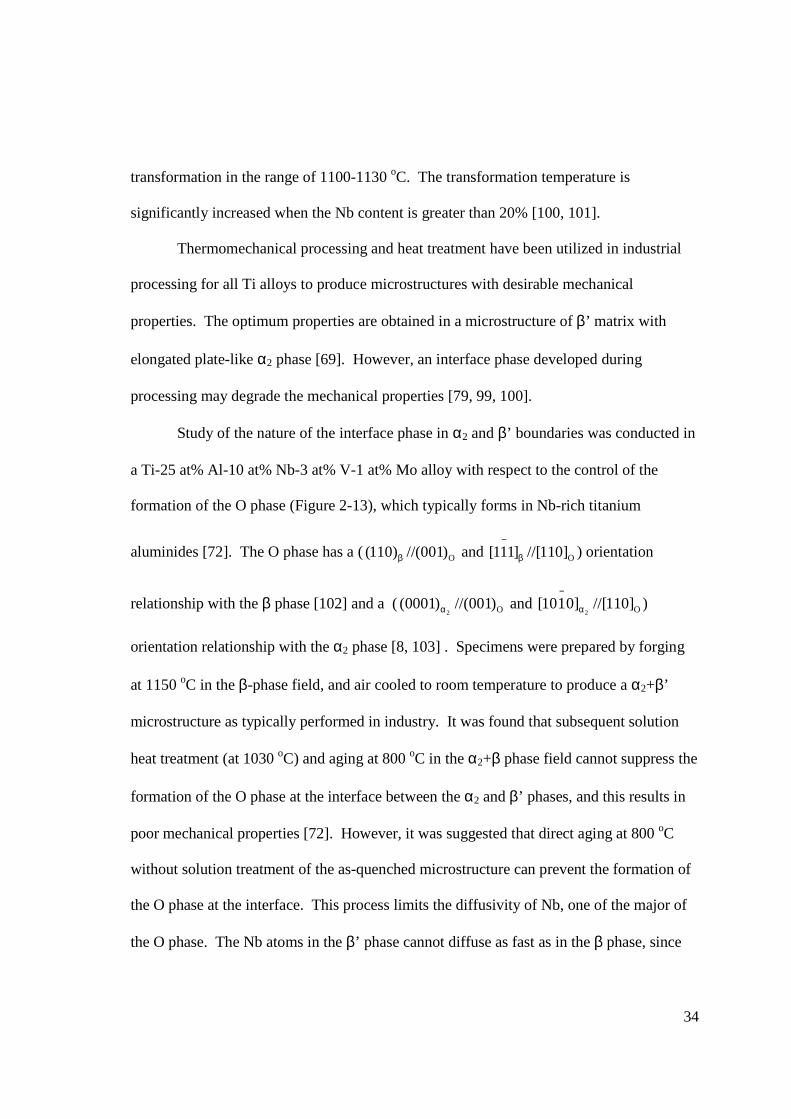
Figure 2-1 Crystal structures for Ti: (a) α (A3) structure and (b) β (B2) structure [38]...... 7 Figure 2-2 Example of a pseudo binary Ti phase diagram adapted from [2]....................... 9 Figure 2-3 Ti and its possible alloying elements according to the atomic size effect [40] 11 Figure 2-4 Relationship between elastic shear modulus and electron/atom ratio for binary A2 Ti alloys [48] ................................................................................................................. 14 Figure 2-5 Microstructure of α+β lamellae in Ti-6 at% Al-4 at% V slowly cooled from β-phase field [7]...................................................................................................................... 16 Figure 2-6 Classification of binary diagrams for Ti alloys [9]........................................... 18 Figure 2-7 Widmanstätten structure formed in Ti-6 at% Al-4 at%V cooled at 15 oC/s [57]............................................................................................................................................. 22 Figure 2-8 Schematic binary phase diagram containing a eutectoid reaction (adapted from [52]) Equilibrium phase boundaries (A-A’, B-B’, E-E’) are extended. Metastable phase boundaries are extended using dashed lines........................................................................ 23 Figure 2-9 Schematic drawing of the crystallographic relationship among the relevant phases in a β to ω transformation [60] ................................................................................ 26 Figure 2-10 The most recent Ti-Al binary diagram, adapted from [62] ............................ 27 Figure 2-11 DSC heating traces for a Ti-32.6 at% Al alloy [62] .......................................28 Figure 2-12 Crystal structure of α2 phase with DO19 structure [8]. Dark atoms are Ti and white atoms are Al............................................................................................................... 33 Figure 2-13 Crystal structure of the O phase (A2BC) [8]. Dark atoms are Nb, grey atoms are Ti, and white atoms are Al. ........................................................................................... 35 Figure 2-14 Optical micrographs of (a) a Ti-25Al-11Nb alloy exhibiting primary α2 (P) and secondary Widmanstätten α2 + (β/B2)t (S) microconstituents and (b) a Ti-26 at% Al-10 at% Nb-3 at% V-1 at% Mo alloy exhibiting Widmanstätten α2 + (β/B2)t (S) and grain boundary α2 (GB) microconstituents [69]........................................................................... 38 Figure 2-15 Optical micrographs of a Ti-25 at% Al-11 at% Nb alloy cooled at (a) 40 oC/min, (b) 20 oC/min, (c) 10 oC/min and (d) 5 oC/min [69]............................................... 39 Figure 2-16 Optical micrographs of a Ti-26 at% Al-10 at% Nb-3 at% V-1 at% Mo alloy cooled at (a) 40 oC/min, (b) 20 oC/min, (c) 10 oC/min and (d) 5 o/min [69] ....................... 40 Figure 2-17 SEM micrographs of two Ti-22 at% Al-11 at% Nb-4 at% Mo microstructures developed from β solution treatment (1050 oC/ 1 hr/ water quench) followed by two different aging treatments: (a) 900 oC for 10 hr and (b) 950 oC for 17 hr [73]. .................. 41 Figure 2-18 Phases observed in a Ti-22 at% Al-11 at% Nb-4 at% Mo alloy aged at various temperatures and times [73]. ............................................................................................... 42 Figure 2-19 α+β/β phase boundaries for various binary Ti alloys [26]............................. 43 Figure 2-20 Proposed Ti-Ru diagram [27] Note the suspected eutectoid reaction at ∼200 oC......................................................................................................................................... 44 Figure 2-21 SEM micrograph showing the α2+β microstructure in a Ti-18 at% Al-5 at% Ru specimen aged at 950 oC for 4 days and quenched [27]. ............................................... 46 Figure 2-22 TEM micrograph (a) and SADP (b) of single phase β' (B2) Ti-18 at% Al-5 at% Ru specimen quenched from 1250 oC [28]. No scale for the diffraction pattern was

vii
given. The scale bar shown on the SADP was estimated from the lattice parameter and the lattice spacing of β (200) measured on the micrograph. ..................................................... 49 Figure 2-23 (a) TEM micrograph of the α2+β microstructure in a Ti-37 at% Al-1 at% Ru alloy quenched from 1100 oC, and (b) SADP from an ordered β grain [28]. No scale for the diffraction pattern was given. The scale bar shown on the SADP was estimated from the lattice parameter and the lattice spacing of β (001) measured on the micrograph........ 51 Figure 2-24 Dark field micrograph of a Ti-23 at% Al-5 at% Ru specimen quenched from 1100 oC[28] ......................................................................................................................... 52 Figure 2-25 Ti-Al-Ru ternary phase diagram [37] based on the experimental observations of Khataee et al. [27]: (a) 770 oC isothermal section, (b) 950 oC isothermal section, (c) 1050 oC isothermal section, (d) 1100 oC isothermal section, (e) 1250 oC isothermal section.............................................................................................................................................. 54 Figure 2-26 The most recent Ti-Al-Ru ternary phase diagram reported by Grytsiv et al. [37]: (a) 800 oC isothermal section, (b) 950 oC isothermal section, (c) 1100 oC isothermal section, and (d) 1250 oC isothermal section........................................................................ 55 Figure 2-27 Crystal structure of the G phase with a composition of Ti-45.1 at% Al-23.3 at% Ru [108]: M1, M2, M3, M4, M5 and M6 designated the atomic sites for Ru, 0.796Al+0.204Ti, Ru, Ti, Al and 0.591Al+0.409Ti, respectively ...................................... 56 Figure 2-28 TEM of Ti-37 at% Al-1 at% Ru specimen containing G-phase particles in γ matrix after aged at 770 oC for 7 days and quenched [13] .................................................. 57 Figure 3-1 Beam optics for beamline X14A at NSLS ....................................................... 63 Figure 3-2 Instrumental setup on beamline X14A showing the Huber diffractometer inside the experiment hutch. a) looking toward the incident beam; b) looking down the incident beam. ................................................................................................................................... 64 Figure 3-3 Calibration curve for the temperature measurement ........................................ 66 Figure 3-4 Test of the integrity of a sealed capillary after holding at various temperatures............................................................................................................................................. 71 Figure 3-5 (a) Specimen and holder, and (b) setting of sample holder inside the furnace on the diffractometer ................................................................................................................ 73 Figure 4-1 Microstructure of the center region of QH324; the etchant, 1 vol%HF-10 vol%HNO3 in water, was unable to reveal any grain boundaries in this single β-phase region. No α2 is present...................................................................................................... 79 Figure 4-2 Microstructure of the rim of QH324: α2 and β phases. Etchant: 1 vol%HF-10 vol%HNO3 in water ............................................................................................................ 80 Figure 4-3 X-ray patterns taken on an unfilled quartz capillary at 51 oC prior to heating and at 35 oC after cooling from 1220 oC ............................................................................. 85 Figure 4-4 X-ray diffraction pattern of the alloy QH324 recorded at 36 oC during cooling. Peak positions of the titanium silicides are indicated. ........................................................ 87 Figure 4-5 X-ray diffraction patterns for the alloy QH324 recorded during heating between 55 oC and 587 oC................................................................................................... 99 Figure 4-6 Lattice parameter (a) of the β phase vs. temperature during heating of the QH324 alloy. The positions of the (011) reflection were used to calculate the lattice parameter. An estimated lattice parameter based on linear thermal expansion using the

viii
coefficient of 1.20x10⁻⁵ oC-1 [123] was also fit to the data and is shown as a straight line............................................................................................................................................ 100 Figure 4-7 X-ray diffraction patterns for the alloy QH324 recorded during the β decomposition to α2 and G phases between 683 oC and 709 oC. ...................................... 102 Figure 4-8 Theoretical patterns for the (a) β, (b) α2, and (c) G phases............................ 105 Figure 4-9 Estimated weight% vs. temperature for the major phases (β, α2, and G) present during heating of the alloy QH324.................................................................................... 107 Figure 4-10 X-ray diffraction patterns for the alloy QH324 recorded during heating between 709 oC and 1220 oC............................................................................................. 108 Figure 4-11 Lattice parameter (a) of the α2 phase vs. temperature during heating of the QH324 alloy. The positions of the (021) and (002) reflections were used to calculate the lattice parameter. The straight line shows the change in the lattice parameter based on a linear thermal expansion coefficient of 1.16x10⁻⁵ oC-1 [131]............................................ 110 Figure 4-12 Lattice parameter (c) of the α2 phase vs. temperature during heating of the QH324 alloy. The positions of the (021) and (002) reflections were used to calculate the lattice parameter. The straight line shows the change in the lattice parameter based on a linear thermal expansion coefficient of 1.08x10⁻⁵ oC-1 [131]............................................ 111 Figure 4-13 Lattice parameter (a) of the G phase vs. temperature during heating of the QH324 alloy. The positions of the (044) reflection were used to calculate the lattice parameter. .......................................................................................................................... 112 Figure 4-14 X-ray diffraction patterns for the alloy QH324 recorded during cooling between 1220 oC and 1018 oC........................................................................................... 113 Figure 4-15 X-ray diffraction patterns for the alloy QH324 recorded during cooling between 917 oC and 36 oC................................................................................................. 114 Figure 4-16 Estimated weight% vs. temperature for the major phases (β, α2, and G) present during cooling of the alloy QH324....................................................................... 115 Figure 4-17 Lattice parameter (a) of the (Ti,Al)Ru phase vs. temperature during cooling of the QH324 alloy. The positions of the (021) reflection were used to calculate the lattice parameter. .......................................................................................................................... 117 Figure 4-18 Lattice parameter (a) of the α2 phase vs. temperature during cooling of the QH324 alloy. The positions of the (021) and (002) reflections were used to calculate the lattice parameter. The straight line shows the change in the lattice parameter based on a linear thermal expansion coefficient of 1.16x10⁻⁵ oC-1 [131]............................................ 118 Figure 4-19 Lattice parameter (c) of the α2 phase vs. temperature during cooling of the QH324 alloy. The positions of the (021) and (002) reflections were used to calculate the lattice parameter. The straight line shows the change in the lattice parameter based on a linear thermal expansion coefficient of 1.08x10⁻⁵ oC-1 [131]............................................ 119 Figure 4-20 Lattice parameter (a) of the G phase vs. temperature during cooling of the QH324 alloy. The positions of the (044) reflection were used to calculate the lattice parameter. .......................................................................................................................... 120 Figure 4-21 Lattice parameter (a) of the β phase vs. temperature during cooling of the QH324 alloy. The positions of the (011) reflection were used to calculate the lattice parameter. The straight line shows the change in the lattice parameter based on a linear thermal expansion coefficient of 1.20x10⁻⁵ oC-1 [123]. ..................................................... 121

ix
Figure 4-22 Lattice parameter (a) of the α phase vs. temperature during cooling of the QH324 alloy. The positions of the (010) and (012) reflections were used to calculate the lattice parameter. The straight line shows the change in the lattice parameter based on a linear thermal expansion coefficient of 1.0x10⁻⁵ oC-1 [123].............................................. 122 Figure 4-23 Lattice parameter (c) of the α phase vs. temperature during cooling of the QH324 alloy. The positions of the (010), (012) reflections were used to calculate the lattice parameter. The straight line shows the change in the lattice parameter based on a linear thermal expansion coefficient of 9.6x10⁻⁶ oC-1 [123].............................................. 123 Figure 4-24 Lattice parameter (c) of the γ phase vs. temperature during cooling of the QH324 alloy. The positions of the (002) reflection were used to calculate the lattice parameter. The straight line shows the change in the lattice parameter based on a linear thermal expansion coefficient of 1.04x10⁻⁵ oC-1 [126]. ..................................................... 124 Figure 4-25 Microstructure of the as-simulated treatment of QH324: α2 and G phases. Two metallographic sections were recorded perpendicular to one another (xy plane and xz plane). Etchant: 1 vol%HF-10 vol%HNO3 in water ........................................................ 135 Figure 4-26 Series of schematic drawings summarizing the proposed development of microstructure according to the interpretation of high-temperature XRD and step-wise simulated heating and cooling........................................................................................... 136 Figure 4-27 Microstructure of the as-simulated treatment of QH324: α2 and G phases. Metallographic section was recorded perpendicular xy plane as indicated in Figure 4-25. Etchant: 1 vol%HF-10 vol%HNO3 in water ..................................................................... 138 Figure 4-28 Microstructure of the as-simulated treatment of QH324: α2 and G phases. Metallographic section was recorded on xz plane. There are six orientations of the α2 plates, in which the sixth orientation is approximately perpendicular to the metallurgical section. Etchant: 1 vol%HF-10 vol%HNO3 in water....................................................... 140

x
LIST OF TABLES
Table 2-1 Compositions at the α’/α” boundary in some binary Ti systems [60] .............. 24 Table 2-2 Phases present in various Ti-Al-Nb alloys at various temperatures. (β transus temperatures for each alloy are also given) [70] ................................................................. 36 Table 2-3 Summary of microstructural observations after quenching and homogenization at specific temperatures and holding times [28].................................................................. 45 Table 3-1 Summary of scan time for x-ray diffraction measurements during step-wise heating and cooling between room temperature and 1220 oC............................................. 68 Table 4-1 Summary of terms for GaveS calculation based on Moreen et al.’s approach [118]
............................................................................................................................................. 89 Table 4-2 Summary of terms for aveSβ calculation based on Moreen et al.’s approach [118]
............................................................................................................................................. 90 Table 4-3 Summary of terms for 2
aveSα calculation based on Moreen et al.’s approach [118]
............................................................................................................................................. 91 Table 4-4 Summary of the estimated alloy compositions for the G phase from the lattice parameters and average interatomic distance obtained from high-temperature x-ray diffraction analysis .............................................................................................................. 94 Table 4-5 Summary of the estimated alloy compositions for the β phase from the lattice parameters and average interatomic distance obtained from high-temperature x-ray diffraction analysis .............................................................................................................. 95 Table 4-6 Summary of the estimated alloy compositions for the α2 phase from the lattice parameters and average interatomic distance obtained from high-temperature x-ray diffraction analysis .............................................................................................................. 96 Table 4-7 List of reaction times for eutectoid reactions observed in various alloy systems........................................................................................................................................... 102 Table 4-8 Comparison of the coefficients of thermal expansion calculated from the experimental data during cooling and the literature values.............................................. 125 Table 4-9 Arrhenius parameters for Ti, Al and Ru diffusion in various phases in the Ti-Al alloy system....................................................................................................................... 127 Table 4-10 Estimated diffusion lengths for Ti in β phase for diffusion times between 683 oC to 1220 oC, and the cumulative diffusion distances over heating from 683 oC to various temperatures between 683 oC and 1220 oC ....................................................................... 129 Table 4-11 Estimated diffusion lengths for Al in β phase for diffusion times between 683 oC to 1220 oC, and the cumulative diffusion distances over heating from 683 oC to various temperatures between 683 oC and 1220 oC ....................................................................... 130 Table 4-12 Estimated diffusion lengths for Ti in α2 phase for diffusion times between 683 oC to 1220 oC, and the cumulative diffusion distances over heating from 683 oC to various temperatures between 683 oC and 1220 oC ....................................................................... 131 Table 4-13 Estimated diffusion lengths for Al in α2 phase for diffusion times between 683 oC to 1220 oC, and the cumulative diffusion distances over heating from 683 oC to various temperatures between 683 oC and 1220 oC ....................................................................... 132

xi
Table 4-14 Summary of angle between each pair of plate-like α2 particle observed on QH324 ............................................................................................................................... 140

xii
ACKNOWLEDGEMENTS
The author would like to acknowledge Dr. Earle Ryba, his thesis advisor, for the help, support and guidance, and his Ph.D. committee members, Dr. Paul Howell, Dr. Todd Palmer, and Dr. Michael Lanagan for their suggestions through the course of the Ph.D. work. In addition, this thesis cannot be completed without the supports as listed as followed: Dr. Christopher Muhlstein and Dr. Arthur Motta for their suggestions at the beginning of the experiment, Michael Schmidt of Carpenter Technology Corporation for the supply of Ti, Mat Cooper of Honeywell International Inc for his help on electrochemical polishing, William Smith Jr. of Pratt &Whitney Rocketdyne for his suggestions on specimen preparation for metallography, Mark Angelone of Material Characterization Laboratory, The Pennsylvania State University, for his help on SEM and EDS work, Nichole Wondering of Material Characterization Laboratory, The Pennsylvania State University, for her help on XRD work, Dr. Thomas Watkins and Dr. Jianming Bai of the High Temperature Material Laboratory at Oak Ridge National Laboratory for their help and guidance through the high-temperature synchrotron x-ray experiment at the National Synchrotron Light Source, Brookhaven National Laboratory, the late Douglas Smith of EMS glass shop for his glasswork, Russ Rogers of the Chemistry glass shop for his glass work, Keith Hill and Mark Burton of Carpenter Technology Corporation for the EPMA work, Dr. Susan Mohney for her suggestion on the diffusion problem, the technical support team of the Materials Science and Engineering Department, The Pennsylvania State University, for their technical support in the department facilities, the Royal Thai Government for the sponsorship for the author’s Ph.D. study during 2002-2006, the Materials Science and Engineering Department, The Pennsylvania State University, University Park, for teaching assistantships during 2007-2008, and sponsorship of the trips to the Brookhaven National Laboratory, and my family members and friends in US and Thailand for keeping the author going.

Chapter 1 Introduction
1.1 Background
Titanium-based superalloys have been utilized as structural materials for various
high temperature applications [1]. Titanium (Ti) was discovered in 1790, and successfully
purified in the early 1900s [2]. It then became one of the candidates for industrial practice
over the last 60 years especially in aerospace applications [1-6]. Ti and Ti alloys exhibit
some outstanding physical and chemical properties. For example, pure Ti is used primarily
in applications which require corrosion resistance and high ductility at relatively low
strength [7, 8].
Pure Ti exhibits an allotropic transformation with increasing temperature in solid
state. Ti can form in one of two solid phases, α-Ti and β-Ti, which are the low and high-
temperature phases, respectively. The transition occurs when the temperature of Ti is
increased beyond the 882.5 oC β-transus temperature [9, 10].
In Ti alloys, the addition of an element changes the transition temperature. There are
two types of alloying elements, α-stabilizer and β-stabilizers. α-stabilizers are generally
non-transition metals, while β-stabilizers are generally transition metals [11]. Titanium
alloys are categorized into α-Ti alloys, α-β-Ti alloys, and β-Ti alloys. Each type is
produced by controlling the relative amount of α- and/or β- stabilizer.
When α-stabilizers are added, the alloy is called an α-Ti alloy. α-Ti alloys exhibit
slightly less corrosion resistance, but improved strength compared with the pure α-Ti. In
general, α-Ti alloys have moderate strength, good toughness, medium formability, and are

2
weldable [11, 12]. They can be also used at temperatures up to ∼580 oC [13] where
degradation of metallurgical stability and mechanical properties results in the loss of
strength. They cannot be heat treated to improve mechanical properties, unless some
relative amount of β- and α-stabilizers are added to produce α-β-Ti alloys, which have
properties intermediate between α-Ti and β-Ti alloys.
When a sufficient amount of β-stabilizers is added to Ti, a β-Ti alloy is produced.
The β-Ti alloy does not transform martensitically upon quenching to room temperature;
instead, a metastable β-Ti phase results. Some heavily stabilized β-Ti alloys can be
deformed at low temperatures [7]. Most of β-Ti alloys also have solubility limit. When a
significant amount of alloying elements is added, the β-Ti alloys tend to precipitate out of
the alpha phase, and other equilibrium phases [2]. Thus, metastable β-Ti alloys are heat
treatable to very high strengths usually by solution treatment plus quenching and aging.
Proper control of heat treatment contributes to a wide range of strength-to-weight ratios.
Cold deformation can also be performed on as-quenched β-Ti alloys prior to aging. In
addition, these alloys also offer improved corrosion and fatigue resistance compared to α-
Ti alloys [4, 5, 14, 15]. A wide range of properties can be developed through advanced
understanding of the nature of this alloy. However, the high-temperature applications of
these alloys are very limited because of their poor creep resistance [13].
Titanium-aluminum (Ti-Al) alloys constitute the major class of Ti alloys. It was first
discovered that the addition of Al would help improve strength, through solid solution
strengthening [16] and oxidation resistance at high temperatures [2]. Since Al is one of the
most outstanding “light” metals. Al additions contribute to improvement on strength-to-

3
weight ratio for Ti. The study of the Ti-Al system has been extended to the application of
various intermetallic compounds, e.g., α2 (Ti3Al) and γ (TiAl) [17]. These compounds
offer the attractive properties of enhanced creep and oxidation resistance up to ∼900 oC.
Ti-Al alloys are thus a possible alternative to conventional dense Ni-base superalloys,
where higher operating temperatures and weight savings are required [1]. These features
could lead to extensive use of Ti alloys in aerospace applications. However, the
application of these compounds is restricted because of their brittle nature at room
temperature [2, 5-7].
The development of Ti-Al alloys for both low and high temperatures requires small
dispersions of the β phase in the titanium aluminides [13]. Various β stabilizers, e.g.,
molybdenum (Mo), niobium (Nb), and vanadium (V), have been used to form the β phase.
The presence of β phase reduces slip length, and improves the low-temperature ductility of
the Ti-Al alloys. Some platinum group metals, e.g., palladium (Pd) and ruthenium (Ru),
have also been considered as an alternatives [18, 19], since they have extensive solid
solubilities in the β phase, and they have been added in Ti to improve low and high
temperatures corrosion resistance in aqueous environments [6, 20-25]. Ru is a strong β-
stabilizer [26], and it is an attractive alloying element because of its relatively low cost as
long as very small amounts are used [18, 19].
The Ti-Al-Ru system was extensively studied by Khataee et al. [3, 13, 27, 28]. It
was reported that significant metallurgical stability in some Ti-Al-Ru alloys containing
various type of β+α2 (Ti3Al) microstructures is maintained up to 870 oC [27]. However,
the details of the interaction of phases and transformation reactions up on heating and

4
cooling between room temperature and high temperatures were not explored.
Understanding how the relevant phases are formed and correlated would help further
development in the design and processing for these alloys.
In this study, in-situ measurements using x-ray diffraction were used to monitor
phase transformations upon heating and cooling. This technique has been successfully
employed to study phase transformation in various Ti systems [29-36]. A very intense
monochromatic x-ray source must be used so x-ray patterns taken during the phase
transformations at various temperatures can be quickly measured. High-temperature x-ray
diffraction using synchrotron radiation was performed on a Ti-32.4 at% Al-4.1 at% Ru
alloy to study the phase relations during heating and/or cooling between room temperature
and 1220 oC.
1.2 Objective of this research
This study involves an exploration of the phase transformations of the β phase in Ti-
Al-Ru alloy. A Ti-32.4 at% Al-4.1 at% Ru alloy was used, because it was expected to
transform to a series of phases, i.e., α2+G phases at 800 oC and 900 oC, α2+β phases at
1100 oC, and β phase at 1250 oC according to the most recent Ti-Al-Ru phase diagram
[37]. Typically, the heat treatment of β-Ti alloys is performed in three steps: solution
treatment in the β-phase field, followed by quenching to retain the metastable β phase, and
subsequent aging to produce a second-phase precipitate [8]. Relatively large deformations
of the metastable β phase may also be performed prior to aging [7]. Thus, an
understanding of how the metastable β phase transforms upon continuous heating and
cooling is needed so that a proper design for a heat treatment and deformation procedure

5
can be developed. In this study, the phase reactions were examined during step-wise
heating and cooling between room temperature and 1220 oC using high-temperature x-ray
diffraction (HTXRD) measurements. Decomposition of the β phase of the alloy in the as-
quenched state to the various equilibrium phases was investigated, as well as the phase
relationships among the major phases (β, α2 and G). This knowledge will provide
fundamental information on the processing and heat treatment of alloys similar to this Ti-
Al-Ru alloy.

Chapter 2 Literature Review
2.1 Chapter overview
This chapter provides a fundamental background on the phase transformations related to
the current research. The fundamental information concerns basic phase relations in Ti and β-
Ti alloys, the β-stabilizing mechanism, and basic processing of β-Ti alloys. Comprehensive
information on phase transformations during heating and cooling between room temperature
and β-phase field is provided along with a focus on the phase relation between β and α2
phases in Ti-Al systems. Previous investigations of phase transformations in the Ti-Al-Ru
systems are also reviewed.
2.2 Basic phase transformation of Ti and ββββ-Ti alloys
Ti exhibits polymorphism. Pure α-Ti, at room temperature, is hexagonal close-packed
(hcp), and, when heated to the β transus (882.5 oC) [9, 10], transforms to a body-centered cubic
(bcc) A2 structure, the β phase (see Figure 2-1).

7
Figure 2-1 Crystal structures for Ti: (a) αααα (A3) structure and (b) ββββ (B2) structure [38]
There are two types of alloying elements for Ti [11]. α-stabilizers, e.g., Al, C, O,
and N, tend to stabilize the α phase, and raise the β transus to higher temperatures. On the
other hand, β-stabilizers, e.g., Mo, Cr, Nb, Ta, and V, extend the β-phase field to lower
temperatures.
The overall stability of beta alloys is specified using an Mo equivalent equation.
This equation contains terms for a collection of all alloying elements that are typically
added to Ti regardless of the type of phase they are stabilizing. A β-stabilizing element
has a positive constant, since it contributes to the β formation. On the other hand, an α-
stabilizer has a negative constant, since it does not facilitate the formation of the β phase.
In addition, the constant for each element is the ratio of the βc (critical minimum level of
β-stabilizer to form metastable β) for Mo divided by the βc for the specified element. An
(a) (b)

8
example of molybdenum equivalent (Mo Eq.) equation for Ti is shown in Equation 2-1[5].
A minimum Mo Eq. of 10.0 is required to stabilize the β phase up on quenching.
Mo Eq. = 1.0 (wt% Mo) + 0.67 (wt% V) + 0.44 (wt% W) …
+ 0.28 (wt% Nb) + 0.22 (wt% Ta) + 2.9 (wt% Fe) …
+ 1.6 (wt% Cr) - 1.0 (wt% Al)
Equation 2-1
Additionally, the formation of a β-Ti alloy at room temperature can be predicted
using the pseudo binary phase diagram in Figure 2-2. It indicates the presence of α and/or
β phases when adding a certain amount of β-stabilizer at various temperatures. The
diagram also explains the resultant phases as cooling under equilibrium and non-
equilibrium (the Ms (martensite start) dash line). Under equilibrium conditions, there are
two possible phases formed, α, α+β, and β formed, depending on the amount of β-
stabilizer present. Two critical β-stabilizer contents, βc and βs (the minimum level of β-
stabilizer to form stable β), are considered. When the β-stabilizer content is between βc
and βs, the diagram suggests that the metastable β phase can be formed if cooling is fast
enough so that the α+β transition is suppressed. If the alloy is, however, reheated, the
equilibrium phase, i.e., α phase, will be precipitated from the β phase. This allows the as-
quenched metastable β alloy to be strengthened through control of the formation of the α
phase. On the other hand, a stable β alloy can be produced regardless of cooling rate when
the amount of β-stabilizer added is greater than βs. Such a stable β alloy cannot be
precipitation hardened.

9
Figure 2-2 Example of a pseudo binary Ti phase diagram adapted from [2]
2.3 Beta-stabilization
A simplified thermodynamics approach can be used to explain the transition from the
low-temperature α phase to the high-temperature β phase, when it is heated through the β-
transus temperature. Vibrational entropy is used to understand the correlation between the
crystal structures [11, 39, 40]. For pure Ti, the β-Ti phase exhibits an A2 structure,
composed of somewhat loosely-packed of Ti atoms (Figure 2-1). On the other hand, the α-
ββββc ββββs

10
Ti phase exhibits a close-packed A3 structure (Figure 2-1). During heating, the A3
structure can only accommodate the vibrational entropy, introduced as a result of atomic
vibration, of the α-Ti phase until the temperature reaches the β-transus. When Ti is further
heated, the transition from α-Ti (A3) to β-Ti (A2) is required to provide more volume to
accommodate the increase in vibrational entropy, and reduce the overall free energy of the
crystal.
In Ti alloys, the phase stabilization is explained on the basis of atomic size,
electronic factors [11, 39, 40], and elastic shear modulus [41-43].
For the atomic size effect, a summary for the possible candidates for Ti alloying
element is depicted in Figure 2-3 [40]. The diagram was constructed based on
substitutional and interstitial solid solutions. The criterion for the formation of
substitutional solid solutions was proposed by Hume-Rothery [44], where ± 15% misfit or
diameter ratios of 0.85-1.15 to that of Ti are required. Hagg [45] further suggested that an
interstitial element can form a solid solution if the diameter ratios are less than 0.59 to that
of Ti. The range for substitutional alloys in Figure 2-3 [40] was corrected from the well-
established information on binary Ti alloys to ± 20% misfit, or diameter ratios of 0.8-1.2 to
that of Ti. This diagram depicts the primary requirement for an element to form a solid
solution with Ti.

11
Figure 2-3 Ti and its possible alloying elements according to the atomic size effect [40]
Electronic configuration of candidate alloying elements is also considered with
respect to the possibility of alloying. A free Ti atom has an outer electron configuration of
(3d)2 (4s)2. This suggests that there are two unpaired 3d electrons and two 4s valence
electrons. The unpaired electrons contribute to the exchange-force coupling, while the
valence electrons form metallic bonds. It is thermodynamically favorable for two elements
with similar electronic configuration to form a solid solution [40]. An extensive solid
Ru

12
solution is expected to form when the candidate alloying element, e.g., Zr, Hf, V, Nb, Ta,
Cr, Mo, and W, has the same electronic configuration. The more common candidates
containing one or more pairs of paired ‘d’ electrons, e.g., Mn, Fe, Co, Ni, Pd, and Pt, can
also form limited solubility with Ti.
The structure of an alloy can be predicted by the number of valence electrons per
atom (e/a ratio), which is also called electron concentration. This concept was developed
by H. Jones [46]. An alloy will exhibit a structure which can accommodate its valence
electrons while minimizing the free energy. Therefore, valence electrons from all
constituents with respect to their composition are used in the prediction. The e/a ratio for a
Ti alloy is calculated using Equation 2-2 [11]. The sum of the s and d valence electrons is
used to calculate the e/a ratio for each component.
1
4=
= + ∆∑n
i ii
e ex ( )
a a
Equation 2-2
where
ix = atomic fraction of the ith solute
i
e( )a
∆ = difference between e/a for the alloying element and that for Ti
A screening model is introduced to explain the stabilization of the A2 structure on
the basis of the electronic configuration. A high conduction or high electron concentration,
which contributes to the screening of ion cores, is expected to favor a symmetrical
structure. Since the A2 structure exhibits a higher symmetry than the hcp structure, β-Ti is

13
electronically more favorable than the α-Ti phase, which is confirmed by the
transformation from hcp to bcc when the e/a ratio increases from 4 to 6 in transition metals
[11]. Thus, the β-Ti structure can be stabilized by alloying with a transition metal,
especially when a transition metal has a group number greater than that of Ti. Criteria for
the β-stabilization have been proposed [47]: (i) more effective stabilization is obtained as
the atomic number of the transition metal is farther from Ti in the periodic table; and (ii)
retention of β phase when quenching from high temperature requires an e/a ratio of at least
4.2.
β stability in Ti has also been studied using an elastic shear modulus developed as a
result of the phase transformation [41-43]. The elastic shear modulus correlates with the
resistance to the deformation induced by martensitic transformation at constant volume
[48]. It was assumed that the greater the elastic shear modulus, the stronger the β
stabilizing effect. The elastic shear modulus (C’) (Equation 2-3) is plotted versus the e/a
ratio for various alloys in Figure 2-4 [11, 48]. A maximum e/a ratio of ∼6 is achieved for
transition metals located to the far right of the group-IV elements. On the other hand, the
minimum e/a ratio of ∼4.1 at the point where C’ vanishes, corresponding to the
compositional threshold for martensitic transformation. These results are in reasonable
agreement with those obtained using the screening model [47].
11 12C CC' ( )
2
−= Equation 2-3
where

14
11C = elastic stiffness on the (001) plane along the [100] direction
12C = elastic stiffness on the (001) plane along the [010] direction
Figure 2-4 Relationship between elastic shear modulus and electron/atom ratio for binary A2 Ti
alloys [48]
2.4 Basic processing of ββββ-Ti alloys
Thermomechanical processes are utilized to improve the mechanical properties of
metastable β-Ti alloys [4]. Good control of the processes of precipitation of the additional
phases strengthens the alloy. Processing of β-Ti alloys comprises two main operations: hot
working and heat treatment [8]. Morphology, size and distribution of the precipitates, e.g.,
the α phase and intermetallic compounds, determine the mechanical properties of the alloy,
especially in large cross sections.

15
Selection of forming temperature depends on alloy types. Since precipitation of the
α phase in a β matrix strengthens the alloys, deforming them requires greater flow stresses
[8]. As a result, deformation processes are preferentially performed in the β-phase field to
reduce applied loads. Alloys containing a large amount of β-stabilizer have relatively low
β-transus temperatures. Thus, hot deformation in the β-phase range is facilitated.
However, for alloys containing only small amounts of β-stabilizer, hot working,
necessarily in the α+β phase range, is more difficult.
Heat treatment of β-Ti alloys is typically conducted in three steps consisting of
solution treatment followed by quenching and subsequent aging [7, 8]. Choice of solution
treatment temperatures also controls microstructure features. If the treatment is performed
above the β-transus temperature, coarse β grains are developed; on the other hand, solution
treatment below the β-transus temperature leads to the precipitation of α phase. It is noted
that selection of heat treatment temperature determines the rate of α precipitation, which
dictates the volume fraction of the α phase.
Various microstructure features are manipulated by proper selection of processing
parameters. Typically, needle-like α phase preferentially precipitates on the β grain
boundaries as a continuous layer (Figure 2-5), which is undesirable. The morphology of
the α phase can be altered to globular shape through the application of hot deformation [7,
8]. For small samples, quenching from the β-phase range can fully retain the β phase, and
avoid the formation of the α phase on grain boundaries. This condition does not apply to
large cross sections, since more thermal energy must be transferred out of the material, and
the cooling rate is not fast enough to suppress the β transformation. Subsequent

16
deformation processing is thus required to break up the grain boundary layers of the α
phase. Selection of deformation temperature and the amount of deformation control the β
grain size through recrystallization.
Figure 2-5 Microstructure of αααα+ββββ lamellae in Ti-6 at% Al-4 at% V slowly cooled from ββββ-phase field
[7]
Precipitation during aging is typically carried out between 500 oC to 600 oC [7].
Optimization of the strengthening effect depends on the volume fraction and size of the
precipitates which are controlled by aging temperature and time. Homogeneous
distribution of precipitates is also desirable for good mechanical properties. Application of
cold work provides an opportunity to introduce structural defects, preferred sites for α
precipitation, by which a homogeneous distribution of α phase can be obtained.

17
2.5 Phase transformation during cooling from ββββ-phase field
Characterization of metastable β-Ti alloys requires basic information about all
possible phase transformations during cooling from β-phase field. This section provides
details of the β transformation during equilibrium and non-equilibrium conditions.
2.5.1 Equilibrium cooling
Phase transformations under equilibrium cooling are governed by diffusion
mechanisms. The β phase transformed to stable phase (s), through nucleation and growth.
For pure Ti, the high-temperature β phase transforms to the low-temperature α
phase. The crystallographic orientation relationship between the cubic β and the
hexagonal α phases is given by the Burgers relationship [49], (110) //(0001)β α and
[111] //[1120]− −
β α [50]. Based on this relationship, the β phase can transform to 12 hexagonal
variants. Therefore, the α phase can be observed in 12 different orientations with respect
to the β phase. This relationship is closely obeyed for the transformation in both
equilibrium and non-equilibrium cooling.
In a binary Ti system, phase transformations are classified into three groups [51].
The first group consists of α-β-isomorphous systems, where the β stabilizer is completely
soluble in both α and β phases (e.g. Ti–Zr, Ti–Hf). The second group consists of the β-
isomorphous systems, where the β-stabilizer is completely soluble in the β phase and has
limited solubility in the α-phase (e.g. Ti–V, Ti–Mo). The third group, β-eutectoid systems,
includes alloy systems in which the β-stabilizer has a limited solubility in the β-phase. As

18
a result, the β phase decomposes into the α phase and a TimXn intermetallic phase on
cooling. Depending on the kinetics of the β-phase decomposition, this group is further
sub-categorized into active or rapid (e.g. Ti–Cu, Ti–Ni) and sluggish (e.g. Ti–Cr, Ti–Mn)
eutectoid systems. Equilibrium diagrams illustrating these classifications are shown in
Figure 2-6 [9].
Figure 2-6 Classification of binary diagrams for Ti alloys adapted from [9]

19
2.5.1.1 ββββ Decomposition in the αααα+ββββ phase field
Upon cooling β-Ti into the α+β phase field, the α phase is nucleated preferentially
along the β grain boundaries, leading to the formation of an α layer. As the transformation
proceeds, small α plates are continuously nucleated and grow on the previously formed α
layer and/or the β boundary. Various sets of the multilayer α plates, called an α colony,
are formed. However, the individual plates in each colony may be separated by
untransformed parent β phase, forming α+β lamellae. The members of each α colony
have the Burgers orientation relationship with respect to the parent β phase. All the
colonies grow toward the center of a β phase grain until they meet, and the colony’s size is
proportional to the cooling time.
The situation in which the metastable β phase decomposes to α and β phase can be
found in either binary β isomorphous alloys, or multi-component Ti alloys. Figure 2-5
shows the α+β lamellae microstructure in a Ti-6 at% Al-4 at% V alloy slowly cooled from
the β phase [7].
2.5.1.2 ββββ-Eutectoid decomposition
There are two microstructure types that form from eutectoid decomposition [52,
53]. The pearlite (lamellar) type exhibits co-operative growth of the constituent phases.
This decomposition mode operates under equilibrium transformation for a β-eutectoid
system. As a result, the nucleation rate of intermetallic compounds at α/β boundaries is
high. On the other hand, the bainite (non-lamellar) decomposition mode proceeds by non-
cooperative growth. The principal barrier for the pearlite mode is the unavailability of the

20
areas of disordered interphase boundaries between the parent and the proeutectoid phases
to act as a nucleation site for intermetallic compound formation. This prohibits the co-
operative growth of the pearlitic structure.
β-eutectoid decomposition has been studied in various systems. Studies of the Ti-
Cr system [54-56] suggests that the bainite mode operates in hypo-eutectoid alloys, while
the lamellar mode occurs in hyper-eutectoid alloys. The lamellar mode is also observed at
near-eutectoid compositions in the Ti-Cu system [53]. The transformation of the β phase
through a eutectoid reaction suppressed during cooling can be activated during reheating.
This is the situation when the eutectoid reaction is sluggish. However, a rapid decrease in
temperature cannot suppress an active β eutectoid system since its reaction rate is very
high [40]. The room-temperature microstructure of an active system is finely lamellar due
to the combined effect of the high nucleation rate and sluggish diffusion. Subsequent
reheating contributes to the coarsening of the lamellar structure to decrease surface energy.
An active β eutectoid system can be characterized as a system with: 1) a high eutectoid
temperature, 2) a low eutectoid composition, and 3) the associated intermetallic phases
containing a high concentration of the major element.
2.5.2 Non-equilibrium cooling
Non-equilibrium cooling is one of the important steps in the heat treatment of β-Ti
alloys. There are five possible schemes as follows. Cooling slightly faster than
equilibrium conditions results in the formation of Widmanstätten and eutectoid structures,
which develop through diffusion. On the other hand, quenching at relatively high cooling
rates promotes the formation of two competing phases, martensite and the athermal ω

21
phase. These phases are formed through athermal displacive transformations. In addition,
the metastable β phase retained at room temperature may become ordered. Details for
each scheme are discussed in the following sections.
2.5.2.1 Widmanstätten structure formation
A Widmanstätten structure develops under an increased cooling rate from the
equilibrium condition during the β phase decomposition in the α+β phase field [7]. This
structure develops because of the insufficient cooling time for an α colony to completely
nucleate and grow in a β grain. The transformation sequence is as follows. First, new α
colonies nucleate on colonies initially formed on the β grain boundaries. The further
development of α colonies, however, differs from the equilibrium condition. The alloy
needs to reduce the elastic strain developed on the crystal by selectively nucleating the new
α plates at a point on the broad face of an existing α plate. The α plate also tends to grow
approximately perpendicular to the associated α plate. This microstructure is also called
basket weave, and is observed in alloys with relatively high concentrations of a β stabilizer
which exhibits a slow diffusion rate [7]. Figure 2-7 shows an example of a Widmanstätten
microstructure [52].

22
Figure 2-7 Widmanstätten structure formed in Ti-6 at% Al-4 at% V cooled at 15 oC/s [57]
2.5.2.2 ββββ-Eutectoid decomposition under non-equilibrium cooling
The eutectoid reaction can be demonstrated using a simple binary Ti-β-stabilizing
element system (Figure 2-8) [52]. The decomposition is shown as m nTi Xβ → α + , where
m nTi X is an intermetallic compound and X is β-stabilizing element. For cooling under
non-equilibrium conditions, nucleation of both the α and TimXn phases is possible if the
alloy was quenched and held in the shaded area at temperatures lower than the extrapolated
lines for α+β/β and the β/β+γ phase field. These two phases are cooperatively nucleated
one after another to form a colony. Several colonies can be formed and further grow in a
grain, and the transformation is completed when they have all grown to cover the prior β
grain.

23
Figure 2-8 Schematic binary phase diagram containing a eutectoid reaction (adapted from [52])
Equilibrium phase boundaries (A-A’, B-B’, E-E’) are extended. Metastable phase boundaries are
extended using dashed lines.
2.5.2.3 Martensitic transformation
Martensitic transformation is induced by the development of shear as a result of a
sudden change in temperature. It propagates at approximately the speed of sound in a
material. The martensitic phase exhibits plate or disk shapes for most Ti alloys. The shear
system can be explained in terms of the β phase (cubic system) as [111] (112)−
β β and
[111] (101)−
β β or in terms of the martensitic phase (α’: hexagonal system) as
' '[2113] (2112)− − −
α α and ' '[2113] (1011)− − −
α α [58]. Martensite can be formed in two

24
morphologies, massive martensite, sometimes called lath or packet martensite, and acicular
martensite [59].
Massive martensite is only observed in pure Ti, very dilute alloys, and alloys with a
high-temperature range for martensitic transformation [7]. The microstructure of massive
martensite contains a number of large irregular regions with an approximate size of 50-100
µm. The microstructural feature consists of various packets of relatively parallel α plates
or laths of thicknesses 0.5 to 1 µm. The relative orientation follows the same variant of the
Burgers relationship.
Acicular martensite forms in alloys with higher solute content [59], in which the
martensitic transformation temperature is lower. It contains a mixture of α plates having
different variant of the Burger relationship.
The hexagonal structure of martensite is unstable if the Ti alloy contains a large
amount of solute, developing distortions in the structure. As a result, it transforms to
orthorhombic [59]. Examples of compositions at the α’/α” boundary are listed in Table
2-1 [60].
Table 2-1 Compositions at the α’/α” boundary in some binary Ti systems [60]
α’/α” boundary V Nb Ta Mo W Wt% At%
9.4 8.9
10.5 5.7
26.5 8.7
4 2
8 2.2

25
2.5.2.4 Athermal ωωωω phase
Formation of athermal ω phases is a competing transformation with that of
martensite [7]. There is a narrow range of composition above the Ms temperature in which
the initial β phase is transformed to the athermal ω phase. This phase typically appears as
very fine precipitates (2-4 µm) with uniform dispersion. It is formed as a result of shear
displacement developed on (222) planes along the <111> direction in the β phase. The
crystal structure is dependent on the amount of β stabilizer.
The athermal ω phase exhibits trigonal symmetry in heavily β-stabilized alloys, and
hexagonal (not close-packed) symmetry in solute-lean alloys. The relationship among β
and the two athermal ω phases is shown in Figure 2-9 [60].

26
Figure 2-9 Schematic drawing of the crystallographic relationship among the relevant phases in a ββββ to
ωωωω transformation [60]
2.5.2.5 Ordering of the ββββ phase
Ordering of the β phase in Ti-Al alloys was recently predicted using thermodynamic
analysis. The Bragg-Williams-Gorsky (BWG) model [61] was used to predict the most
stable atomic configurations of Ti-Al solid solutions [62] based on the optimization of the
interchange energies between nearest and next-nearest neighbors [63]. From the

27
calculations, an ordered region (designated as β'-Ti phase field) was proposed to exist in
the high temperature disordered β (A2)-Ti phase field at the composition range of ~30-
40% Al (see Figure 2-10) [62]. The predicted ordered-phase field was proposed to be in
good agreement with the phase boundary extrapolation based on the well-defined ternary
ordered β (B2) phase in Ti-Al-X (X = Cr, Fe) ternary systems.
60 804020 60 80
600
800
1000
1200
1400
1600
1670
1450,49.71465,54.9
1445,651416,71.9
1387,78.6
1166,31 1114
1170
810
735
655
950995
TiAl 3 (h)
TiAl 3 (l)
1215
Ti3Al (αααα2)
(αααα-Ti)
(ββββ-Ti)
(ββββ’-Ti)
TiAl ( γγγγ)
Ti Al1000
Ti 1
-xA
l 1+x
Ti 6
Al 1
1T
iAl 2
Ti 3
Al 5
Tem
pera
ture
(o
C)
at %
Figure 2-10 The most recent Ti-Al binary diagram, adapted from [62]
The predicted ordered-β phase field in the Ti-Al system was claimed to be
experimentally confirmed by differential scanning calorimetric (DSC) measurements on

28
Ti-32.6 at% Al and Ti-35 at% Al alloys [62]. A rather small endothermic energy,
suspected to represent the energy involving β-ordering, was measured, for example, on a
Ti-32.6 at% Al alloy at ~1268 oC (see Figure 2-11). However, the energy measured is
extremely small, and the position of the endothermic peak does not match the location of
the order/disorder (β'/β) phase boundary shown in the calculated Ti-Al equilibrium
diagram. Since Al is an α-stabilizer and the retention of the high-temperature β phase in
Ti-Al alloys at room-temperature is difficult, an in-situ technique is required. A high-
temperature characterization technique, such as high-temperature x-ray diffraction (XRD)
analysis, may be a good option to investigate this possible β ordering,
Figure 2-11 DSC heating traces for a Ti-32.6 at% Al alloy [62]
2.6 Phase transformation during reheating metastable ββββ alloys
Metastable β phase retained from high temperature can be further transformed when
subjected to subsequent aging above room temperature. Decomposition of the β to the α
phase can occur via a direct or indirect process. Indirect decomposition requires the

29
formation of intermediate phases according to alloy composition and aging temperature.
Another possible scheme, the formation of an intermetallic compound, is also discussed
below.
2.6.1 Decomposition of ββββ to αααα phase
The difficulty for direct decomposition of β (cubic) to α (hexagonal) is due to the
difference in their crystal structures. The α phase must form heterogeneously on crystal
defects, such as, dislocations, or on interfaces between the β and the intermediate phases so
that the whole of the constituent atoms can be readily reconfigured. There are two typical
intermediate phases in β-Ti alloys, the isothermal ω phase and the product phase of β-
phase separation [53].
2.6.1.1 Isothermal ωωωω phase
The isothermal ω phase is formed when an alloy containing an intermediate
concentration of β stabilizer is aged between room temperature and approximately 550 oC
[64]. This phase has the same structure as the athermal ω phase, however, the isothermal
ω phase is formed by a diffusion-based transformation. The similarity of the atomic
configurations of the β and athermal ω phases, as mentioned previously, contributes to the
rapid transformation of β to the isothermal ω phase. Thus, decomposition of β via
precipitation of the isothermal ω phase is the most probable, providing that the alloy
composition is favorable. The isothermal ω phase is coherently precipitated on the β
matrix and exhibits relatively small grain sizes at very high particle density.

30
The stability of the ω phase was studied with respect to the addition of ternary
elements. It was shown that the addition of Al (an α-stabilizer) facilitates the direct
formation of α phase in parallel with the precipitation of ω phase [52]. The α phase
formed later grows and consumes the β+ω phases. This is consistent with the fact that Al
is an α stabilizer and limits the stability of both ω and β phases.
2.6.1.2 Phase separation
Metastable β alloy can be decomposed to two compositions, β1 and β2, during
heating between 200-500 oC depending on alloy composition [59]. In general, the β2 phase
homogeneously nucleates as a coherent phase in the β1 phase, and it contains less solute
than the β1 phase. The β2 phase later acts as nucleation sites for the α phase. Therefore,
the distribution of β2 phase controls how the α phase disperses in the β1 matrix. In a
ternary β alloy containing an α stabilizer, e.g., Al, the transformation rate of β2 to α is very
rapid compared to Ti containing only a β stabilizer [59]. This prevents the observation and
characterization of the β1+β2 microstructure.
2.6.2 Direct nucleation of αααα from ββββ phase
The α phase can be directly nucleated from β phase when rapid heating rates are
utilized to age metastable β phase above the stable temperature for ω and β phases [59].
Two possible α morphologies can be observed in this mode.
Widmanstätten α phase forms as plates or needles where the long axis is oriented
parallel to {110}β. Each plate or needle exhibits a single variant of the Burgers orientation

31
relation. This morphology of the α phase can be found in binary β alloys with lean β
stabilizer contents and alloys with a significant amount of Al, e.g., Ti-6 at% Al-4 at% V.
On the other hand, the α phase can form as small particles. This is observed in
alloys with high concentrations of β stabilizers and little or no Al, e.g., Ti-8 at% Mo-8 at%
V-2 at% Fe-3 at% Al or Ti-18 at% Mo [65, 66]. Clustering of the small particles can
appear as lenticular region. Prolonged aging can result in coarsening and agglomeration of
these small particles.
Direct nucleation of α from the β phase generally develops a microstructure with
coarse features of α phase, resulting in non-uniform distribution. As a result, the alloy
from this transformation exhibits low tensile ductility. This property can be improved
through the introduction of substantial deformation prior to aging so that the crystal defects
act as nucleation sites for the α phase, and a uniform distribution of the α phase can be
achieved.
2.6.3 Intermetallic compound formation
Formation of intermetallic compounds as precipitates in a metastable β phase is
possible when working on some binary and ternary alloys. For binary β-eutectoid alloys,
an intermetallic compound in the form of a TimXn phase can be observed in hypereutectoid
alloys as mentioned in β-eutectoid decomposition. This compound can also form in
ternary alloys containing both β isomorphous and β eutectoid alloy elements. Examples
for ternary alloys are Ti-V-Si [67] and Ti-Mo-Si [53]. The β isomorphous element (V or
Mo), is used to stabilize the β phase and β eutectoid, while Si contributes to form

32
intermetallic compounds such as (Ti,V)5Si3 or MoSi3. As some amount of the β stabilizer
diffuses out from the β matrix to form the compound, the β phase is depleted of the β
stabilizer. Thus, formation of an intermetallic compound reduces the stability of the β
phase.
2.7 Phase transformation in ββββ-Ti with Ti3Al composition
This group of alloys is based on titanium containing a β stabilizer and Al, an α
stabilizer, at composition range where the Ti3Al α2 phase is stable. These alloys are
developed with the goal to produce a light Ti alloy that can maintain high strength for high
temperature applications. The α2 phase and other titanium aluminides have been under
development since 1953 [68]. However, these alloys exhibit low ductility at room
temperature, so that cold deformation is very limited. The β phase is introduced into these
alloys to improve low temperature ductility by refining slip distance, and to arrest the
growth of micro cracks [7].
There are two major phases concerned, β and α2. The β phase is formed as the
accommodation of β stabilizers, while the α2 phase is an intermetallic compound formed at
∼20-36 at% Al in Ti-Al alloys as depicted in Figure 2-10 [62]. Figure 2-12 [8] shows
crystal structure of the α2 phase. Additional intermetallic compounds can be also formed
in this group of alloys according to thermodynamics.

33
Figure 2-12 Crystal structure of αααα2 phase with DO19 structure [8]. Dark atoms are Ti and white
atoms are Al.
An extensive investigation of the phase transformation in Ti3Al base alloys has
been conducted. Various β stabilizing elements (Nb, V, Mo, Ta, Cr, Fe) were added to
enhance the ductility and toughness of the brittle binary Ti3Al intermetallic [69-98]. The
present review concentrates on the phase transformation related between β and α2, whereas
most of the studies have been devoted to Ti-Al-Nb alloys.
The effects of niobium (Nb) on stabilizing the β phase have been studied [7, 8, 52].
During cooling of a Ti3Al-Nb alloy, the disordered β phase undergoes a transition to an
ordered β’ structure. The order-disorder transition temperature is dependent upon the Al
and Nb contents [98-101]. Alloys containing 11-15% Nb exhibit an order/disorder
34
transformation in the range of 1100-1130 oC. The transformation temperature is
significantly increased when the Nb content is greater than 20% [100, 101].
Thermomechanical processing and heat treatment have been utilized in industrial
processing for all Ti alloys to produce microstructures with desirable mechanical
properties. The optimum properties are obtained in a microstructure of β’ matrix with
elongated plate-like α2 phase [69]. However, an interface phase developed during
processing may degrade the mechanical properties [79, 99, 100].
Study of the nature of the interface phase in α2 and β’ boundaries was conducted in
a Ti-25 at% Al-10 at% Nb-3 at% V-1 at% Mo alloy with respect to the control of the
formation of the O phase (Figure 2-13), which typically forms in Nb-rich titanium
aluminides [72]. The O phase has a ( O(110) //(001)β and O[111] //[110]−
β ) orientation
relationship with the β phase [102] and a (2 O(0001) //(001)α and
2 O[1010] //[110]−
α )
orientation relationship with the α2 phase [8, 103] . Specimens were prepared by forging
at 1150 oC in the β-phase field, and air cooled to room temperature to produce a α2+β’
microstructure as typically performed in industry. It was found that subsequent solution
heat treatment (at 1030 oC) and aging at 800 oC in the α2+β phase field cannot suppress the
formation of the O phase at the interface between the α2 and β’ phases, and this results in
poor mechanical properties [72]. However, it was suggested that direct aging at 800 oC
without solution treatment of the as-quenched microstructure can prevent the formation of
the O phase at the interface. This process limits the diffusivity of Nb, one of the major of
the O phase. The Nb atoms in the β’ phase cannot diffuse as fast as in the β phase, since

35
they need to retain the atomic configuration for ordering. Additionally, aging at low
temperature retards Nb movement.
Figure 2-13 Crystal structure of the O phase (A2BC) [8]. Dark atoms are Nb, grey atoms are Ti,
and white atoms are Al.
Long and Rack [69] reported that, during heating , at temperature below 850 oC,
three phases, α2 +β+ O were observed in Ti-25at%Al-11%Nb. Upon increasing the
temperature between 900 oC and 1150 oC, the O phase disappears, and only two phases
(α2+ β) remain. At 1200 oC and above, only the β phase was found. The β transus
temperature is approximately 1120 oC [69]. A similar study on a Ti-25%Al-10%Nb-3%V-
1%Mo alloy annealed at 900-1200 oC followed by quenching to room temperature [86]
also reports approximately the same temperature for the β transus (1100 oC).
An isothermal transformation path was proposed to explain the transition from the
β’ ( Pm3m−
) to α2 ( 6P / mmc) phase in Ti-24 at% Al-11 at%Nb at temperatures above the
critical temperature of approximately 500 oC [104]. First, the β’ phase displacively
transforms to another cubic phase with Pmma structure by altering stacking sequence

36
along {110} planes. Then, chemical ordering of the Al and Ti atoms sequentially takes
place to form the partially ordered orthorhombic (Cmcm) phases, O” and O’ respectively.
The α2 phase is finally achieved through chemical decomposition, in which the O phase,
fully ordered orthorhombic (Cmcm) phase, may be also present as another product phase
depending on the composition of the intermediate orthorhombic phases. The O’ phase is
kinetically stabilized at temperatures below 500 oC, since the kinetics of O’ to α2
transformation is sluggish.
Addition of Nb, Mo and V (β stabilizers) influences the lower bound of the α-β
two-phase region. Among these three elements, it seems that Mo acts as the strongest β
stabilizer [86]. Table 2-2 lists the phases observed at different temperatures in Ti-Al-Nb
base alloys [70] along with their β transus temperatures.
Table 2-2 Phases present in various Ti-Al-Nb alloys at various temperatures. (β transus
temperatures for each alloy are also given) [70]
Alloy 900 oC 980 oC 1020 oC 1060 oC 1100 oC β transus (oC) Ti- 24 at% Al-11 at% Nb α2+β’ α2+β’ α2+β’ α2+β α2+β 1120-1130 Ti- 25 at% Al-15 at% Nb α2+O+β’ α2+O+β’ α2+β’ α2+β α2+β 1110-1120 Ti- 27 at% Al-17 at% Nb O+β’ O+β’ α2+β’ α2+β α2+β 1130-1140 Ti- 25 at% Al-14 at% Nb-1 at% Mo α2+O+β’ α2+O+β’ α2+β’ α2+β α2+β 1150-1160 Ti- 24 at% Al-20 at% Nb O+β’ O+β’ α2+O+β’ α2+β α2+β 1100-1110
The effect of oxygen on the β transus temperatures has been studied in α2-β based
alloys. Oxygen was introduced by adding rutile (TiO2) into the alloy. A significant shift
(~17.2 oC/ 100 ppm oxygen) in the transus temperature was observed up to 1000 ppm

37
oxygen, while only a small shift (~3.5 oC/ 100 ppm oxygen) is estimated to occur in the
range above 1000 ppm oxygen. A similar effect of oxygen was also observed in Ti-6 at%
Al-4 at% V (α/β titanium) [71] and found ~2 oC/ 100 ppm oxygen. Oxygen is not only a
strong α stabilizer, but also a strong α2 stabilizer, and this information can be used to
support the selection of temperature for alloy processing in β-phase field.
The microstructure of titanium aluminide alloys is dependent on the alloy addition
and processing parameters. For example, Ti-25 at% Al-11 at% Nb and Ti-25 at% Al-10
at% Nb-3 at% V-1 at% Mo alloys were heat treated at 1260 oC in the β phase field and
held for 8 hr, followed by forging and air cooled [69]. The resulting microstructure of the
Ti-25at%Al-11%Nb alloy contained primary α2 colonies in a Widmanstätten α2+β’ matrix,
with no apparent grain boundary α2 phase (Figure 2-14 (a)). On the other hand, the
microstructure of the Ti-26 at% Al-10 at% Nb-3 at% V-1 at% Mo alloy was composed of a
α2 +β’ Widmanstätten structure together with grain boundary α2 phase (Figure 2-14 (b)).
Furthermore, it was reported that the phase morphology is dependent on the cooling rate.
Coarsening of the α2 phase was obtained upon decreasing the cooling rate; the
microstructure development from fine α2+β’ to a scattered formation of α2 and
predominantly coarsened α2 alloys are shown in Figure 2-15 and Figure 2-16 for Ti-25 at%
Al-11 at% Nb and Ti-26 at% Al-10 at% Nb-3 at% V-1 at% Mo alloys, respectively [69].

38
Figure 2-14 Optical micrographs of (a) a Ti-25Al-11Nb alloy exhibiting primary αααα2 (P) and
secondary Widmanstätten αααα2 + (ββββ/B2)t (S) microconstituents and (b) a Ti-26 at% Al-10 at% Nb-3
at% V-1 at% Mo alloy exhibiting Widmanstätten αααα2 + (ββββ/B2)t (S) and grain boundary αααα2 (GB)
microconstituents [69]

39
Figure 2-15 Optical micrographs of a Ti-25 at% Al-11 at% Nb alloy cooled at (a) 40 oC/min, (b) 20
oC/min, (c) 10 oC/min and (d) 5 oC/min [69]

40
Figure 2-16 Optical micrographs of a Ti-26 at% Al-10 at% Nb-3 at% V-1 at% Mo alloy cooled at (a)
40 oC/min, (b) 20 oC/min, (c) 10 oC/min and (d) 5 o/min [69]
α2 and O phases can get hardener when Mo is added to Ti-Al-Nb alloys [73]. An
improvement of approximately 50 Vickers hardness was found for a Ti-22 at% Al-11 at%
Nb-4 at% Mo alloy compared to that for a Ti-22 at% Al-27 at% Nb alloy with equivalent
heat treatment histories. Figure 2-17 shows the microstructures of the Ti-22 at% Al-11
at% Nb-4 at% Mo alloy after solution treatment in the β-phase field and subsequent aging

41
at two different conditions [73] . The higher aging temperature and the greater holding
time contribute to more coarsening in the microstructure. It was speculated that this type
of microstructure is a product of spinodal decomposition, described as periodic
compositional fluctuations in the crystal structure [73]. However, their reason is unclear.
Figure 2-17 SEM micrographs of two Ti-22 at% Al-11 at% Nb-4 at% Mo microstructures developed
from ββββ solution treatment (1050 oC/ 1 hr/ water quench) followed by two different aging treatments:
(a) 900 oC for 10 hr and (b) 950 oC for 17 hr [73].
The solution treated (1050 oC) Ti-22 at% Al-11 at% Nb-4 at% Mo alloy was also
aged between 630 oC and 980 oC for various times [73]. The results are summarized in
Figure 2-18, where up to approximately 100-hr aging time was used at temperatures below
900 oC. It was concluded that the α2, β and O phases are the equilibrium phases at
temperatures below 780 oC, while only the α2 and β phases are stable at 850 oC to 980 oC.

42
Figure 2-18 Phases observed in a Ti-22 at% Al-11 at% Nb-4 at% Mo alloy aged at various
temperatures and times [73].
2.8 Previous studies in Ti-Al-Ru alloys
In an investigation of 21 β-Ti stabilizing elements [26], Os, Ir, and Ru were found
to provide a significantly stronger stabilizing effect than the other elements studied. At the
equivalent alloy contents in the other 18 systems, Ti martensite formation results instead of
β stabilization. Retention of the β phase requires, in most instances, significantly greater
stabilizer content (see Figure 2-19). A strong β stabilizer leads to a decrease in the β
transus temperature at lower alloy contents. For example, the β phase is thought to
stabilize down to ~200 oC at the eutectoid composition of ~17 at% Ru, as shown in the Ti-
Ru binary diagram in Figure 2-20 [27, 105]. Additionally, Ru is attractive because its
density (12.3 g/cm3) is much lower than that of Os (22.61 g/cm3) and Ir (22.65 g/cm3).

43
Figure 2-19 αααα+ββββ/ββββ phase boundaries for various binary Ti alloys [26]

44
Ti Ru
400
800
1200
1600
2000
2400
Tem
pera
ture
(o
C)
L
ββββ
αααα+ββββ
Ru
TiRu
at %
Figure 2-20 Proposed Ti-Ru diagram [27] Note the suspected eutectoid reaction at ∼∼∼∼200 oC
The effect of Ru on the metastability of the β phase in the Ti-Al-Ru system was
extensively studied by Khataee et al. [3, 13, 27, 28]. While Ru is a strong β stabilizer, the
effect of an α stabilizer, like Al, is also important in the formation of microstructures. The
specimens were initially homogenized at 1250 oC for 1 day, and water-quenched to room
temperature. The authors also characterized a series of the alloys homogenized at various
temperatures, and again water-quenched to room temperature. The phases observed in
alloys homogenized at 1250 oC, 1100 oC, 1050 oC, 950 oC, and 770 oC are summarized in
Table 2-3.

45
Table 2-3 Summary of microstructural observations after quenching and
homogenization at specific temperatures and holding times [28]
Phases present after homogenization and quenching Alloy compositions
(at %) 1250 oC/
1 day
1100 oC/
1 day
1050 oC/
1 day
950 oC/
4 days
770 oC/
7 days
Ti-17Al-1Ru α’ α’ α+β α2+β α+α2+β
Ti-18Al-2Ru α” α” - α2+β α+α2+β
Ti-18Al-5Ru β β α2+β α2+β α2+β
Ti-24Al-1Ru α2’ α+β - - α2+β
Ti-23Al-5Ru β α2+β - α2+β α2+(Ti,Al)Ru
Ti-37Al-1Ru α’ α2+β - α2+γ+G α2+γ+G
Ti-37Al-5Ru β β+γ+G - α2+γ+G α2+γ+G
Khataee et al. found that the β phase is largely retained at room temperature in Ru-
containing, high Al alloys, and fully retained in low Al alloys. For example, at 5 at% Ru,
the β phase was fully retained in 18 at% Al and 23 at% Al alloys quenched from 1250 oC
(see Table 2-3) [28].
Microstructure characterization was also conducted on as-quenched alloys
according to the heat treatment listed in Table 2-3 [28]. Two types of microstructure
resulted.
- The Ti-17 at% Al-1 at% Ru and Ti-18 at% Al-2 at% Ru alloys, in which
martensitic transformation was not suppressed in the first treatment, transformed to
an α, α2, β structure after aging at 770 oC for 7 days. The α and α2 phases
exhibited a plate-like morphology, similar to the original martensite structure.

46
- On the other hand, the alloys which successfully retained a fully β-phase
microstructure in the first treatment, showed various equiaxed structures after
aging. For example, Ti-18 at% Al-5 at% Ru (aged at 770 oC for 7 days, and aged at
950 oC for 4 days (Figure 2-21 ) and Ti-23 at% Al-5 at% Ru (aged at 1100 oC for 1
day and at 950 oC for 4 days) alloys exhibited duplex equiaxed α2+β structure. The
α2 phase precipitated within the β grains and on the β grain boundaries.
Additionally, a Ti-23 at% Al-5 at% Ru alloy aged at 770 oC for 7 day showed a
fine duplex equiaxed α2+(Ti,Al)Ru structure, while a Ti-37 at% Al-5 at% Ru alloy
aged at 950 oC for 4 days and 770 oC for 7 days precipitated as an equiaxed
α2+γ+G structure.
Figure 2-21 SEM micrograph showing the αααα2+ββββ microstructure in a Ti-18 at% Al-5 at% Ru
specimen aged at 950 oC for 4 days and quenched [27].
αααα2
ββββ

47
Ordering of the β phase in Ti-Al-Ru alloys was also observed in Khataee et al.'s
experiments [3, 13, 27, 28]. For alloys with 18-37 at% Al and 1-5 at% Ru quenched from
the range of 1250 oC-1050 oC to room temperature, some degree of β ordering was
detected. The evidence observed in the as-quenched Ti-Al-Ru alloys lead to the suspicion
that Ru may not only expand the metastability of β phase to room temperature, but also
participate in the order/disorder transformation. However, there is no experimental
evidence that the β phase is ordered at high temperatures. All evidence of ordering is
obtained from the characterization of as-quenched microstructures. It is unclear whether
ordering of the β phase occurred during holding at some high temperatures or during
quenching to room temperature.
Their experimental observations on as-quenched microstructures suggest that β-
ordering can occur in one, two, and three phase alloys at particular compositions and
quenching temperatures (1250 oC-1050 oC):
1) Single phase alloys: selected area diffraction patterns (SADPs) on single phase β
alloys containing Ti-18 at% Al-5 at% Ru, quenched from 1250 oC, exhibit
superlattice reflections which indicated ordering (see Figure 2-22). Diffuse scattering
along <110> was also observed. The patterns were interpreted as arising from an
ordered CsCl-type (B2) structure, similar to that found in previous studies of the Ti-
Al-Nb, Ti-Al-Mo, Ti-Al-Cr and Ti-Al-Fe systems [106]. The streaking in the
patterns suggests the tendency toward short range order. This may be due to the fact
that, for one-day holding times, the higher homogenizing temperatures (e.g., 1250
oC) may lead to greater Ru diffusion and result in more Ru partitioning in the β phase

48
which then may result in a greater chance for ordering. Moreover, Khataee et. al.
[28] suggested that the very weak extra reflections observed along the streaking at
½<110> were due to “increased β stability and pretransformation effects”.
Alternatively, the presence of these diffuse maxima at ½<110> has been extensively
studied in various Ti alloy systems (e.g., Ti-Fe, Ti-W, Ti-V, Ti-Nb, and Ti-Al-Nb)
[64, 98, 107]. It has been established that the diffuse maxima are due to the
formation of a coherent transformation product of the β phase. Khataee et al.,
however, did not find any evidence for the presence of such precipitate phases.
However, the observation of ordering in the as-quenched microstructure of single β
phase alloys conflicts with a claim elsewhere [27] that the as-quenched single phase
β alloys quenched from 1100 oC are disordered. Further work is required to clarify
this discrepancy in the Khataee et al. papers [27] and [28].

49
Figure 2-22 TEM micrograph (a) and SADP (b) of single phase ββββ' (B2) Ti-18 at% Al-5 at% Ru
specimen quenched from 1250 oC [28]. No scale for the diffraction pattern was given. The scale bar
shown on the SADP was estimated from the lattice parameter and the lattice spacing of ββββ (200)
measured on the micrograph.
39 nm-1
200
110
(b)
(a)

50
2) Two-phase alloys: upon quenching from 1100 oC, the β phase shows evidence of
ordering in the two-phase alloys Ti-23 at% Al-5 at% Ru (α2+β), Ti-37 at% Al-1 at%
Ru (α2+β), and Ti-24 at% Al-1 at% Ru (α+β) [28]. Figure 2-23 shows an SADP
taken from a β' grain in the α2+β’ microstructure in the Ti-37 at% Al-1 at% Ru alloy
quenched from 1100 oC. The SADP of the β’ phase shows strong evidence for the
B2 structure. In contrast to Figure 2-22, the uninterpreted very weak spots were not
observed. A dark field (DF) micrograph using a superlattice reflection to locate the
rest of ordered β grains in the microstructure was not taken.
3) Three-phase alloys: evidence for β-ordering was also found in a three-phase
β+γ+G Ti-37 at% Al-5 at% Ru alloy quenched from 1100 oC [28]. The intermetallic
compounds, α2, γ, and G, may have formed to accommodate the ordering by
consuming extra atoms that did not contribute to the formation of the B2 structure.
Evidence of short-range ordering can be found in the DF micrograph of Ti-23 at%
Al-5 at% Ru quenched from 1100 oC (see Figure 2-24). The bright regions are ordered β
domains. It was claimed that the dark regions were antiphase boundaries, but they are
probably disordered-β phase regions. The presence of extensive, but fine ordered domains,
suggests that the ordering is short-range.

51
Figure 2-23 (a) TEM micrograph of the αααα2+ββββ microstructure in a Ti-37 at% Al-1 at% Ru alloy
quenched from 1100 oC, and (b) SADP from an ordered ββββ grain [28]. No scale for the diffraction
pattern was given. The scale bar shown on the SADP was estimated from the lattice parameter and
the lattice spacing of ββββ (001) measured on the micrograph.
39 nm-1
52
Figure 2-24 Dark field micrograph of a Ti-23 at% Al-5 at% Ru specimen quenched from 1100
oC[28]
There was no evidence of β-ordering in alloys quenched from temperatures below
1050 oC, even though the phase content of the as-quenched microstructures (α2+β), was
similar to that of the alloys quenched from 1100 oC-1250 oC. It was known that Ru is a
strong β-stabilizer and the phase diagrams (Figure 2-25 and Figure 2-26) show that up to
22.5 at% Ru can dissolve in the β phase at 1100 oC-1250 oC. In addition, the atomic radius
of Ru (1.34 Ả) is relatively comparable to those of Ti (1.43 Ả) and Al (1.44 Ả). It is
possible that the Ru atoms may incorporate with Ti and Al atoms to form an atomic
configuration that appears as an ordered form of the β phase. As a result, it is suspected
that significant partitioning of Ru to the β phase at 1050 oC-1250 oC leads to β-ordering.

53
The explanation on this is unclear since knowledge on the preference of atomic
configuration in Ti-Al-Ru system is lacking. However, it is likely that this type of atomic
configuration can be extended to low temperatures.
Superlattice reflections were not detected in the powder diffraction patterns. There
are three possible reasons: 1) there were no superlattice reflections, 2) the superlattice
reflection intensities were too weak to observe, and 3) the superlattice reflections were
buried in the diffuse scattering. The diffuse streaking in the SADPs suggested that the
ordering is short-range.
EDS analysis showed that Ru was detected in the Ti-Al-Ru alloys in the β-phase
region, regardless of its structure, ordered or disordered. This suggests that the β phase is
stabilized by Ru partitioning.
Figure 2-25 [37] shows the Ti-Al-Ru isothermal sections based on the experimental
observations of Khataee et al. Grytsiv et al. (2003) [37] presented an "updated" version of
the Ti-Al-Ru equilibrium diagram (Figure 2-26).

54
Figure 2-25 Ti-Al-Ru ternary phase diagram [37] based on the experimental observations of Khataee et al. [27]: (a)
770 oC isothermal section, (b) 950 oC isothermal section, (c) 1050 oC isothermal section, (d) 1100 oC isothermal
section, (e) 1250 oC isothermal section.
(a)
(b)
(c)
(d)
(e)

55
(a) 800o C
(b) 950o C
(c) 1100o C
(d) 1250o C
Figure 2-26 The most recent Ti-Al-Ru ternary phase diagram reported by Grytsiv et al. [37]: (a) 800
oC isothermal section, (b) 950 oC isothermal section, (c) 1100 oC isothermal section, and (d) 1250 oC
isothermal section

56
Some changes in the ternary intermetallic compounds which occur in this system
have recently been observed. The existence of the G phase, which exhibits an
Fm3m−
structure (see Figure 2-27 [108]) was confirmed, and consequently re-designated as
τ1. A new Ti-Al-Ru phase, τ2, with the L12 crystal structure, was found with a composition
of Ti-46 at% Al-22 at% Ru.
G phase was reported to be a brittle phase. Very small ellipsoidal particles in a
matrix of equiaxed γ were observed in a Ti-37 at% Al-1 at% Ru alloy (Figure 2-28), while
large particles of the G phase were found in a Ti-37 at% Al-5 at% Ru alloy [13]. Large G-
phase particles cause severe embrittlement [13].
Figure 2-27 Crystal structure of the G phase with a composition of Ti-45.1 at% Al-23.3 at% Ru
[108]: M1, M2, M3, M4, M5 and M6 designated the atomic sites for Ru, 0.796Al+0.204Ti, Ru, Ti, Al
and 0.591Al+0.409Ti, respectively

57
Figure 2-28 TEM of Ti-37 at% Al-1 at% Ru specimen containing G-phase particles in γ matrix after
aged at 770 oC for 7 days and quenched [13]
The Ti-Al-Ru diagram proposed by Khataee et al. [27] was updated in Grytsiv et
al.’s extensive work [37] on the crystallographic information for the τ1 and τ2 phases,
together with all the information related to the Ti-Al-Ru system available in the literature
up to 2002. The order-disorder (β/β') boundary in the β-phase field of the Ti-Al-Ru
diagram was given based on the observations of Khataee et al. [3, 13, 27, 28].
Upon reviewing the work of Khataee et al. and others, a number of questions arise.
All of the previous work was performed on as-quenched specimens that were subjected to
different heat treatment schedules. The stable phases for an alloy were studied at various
temperatures. However, the details on the interaction of phases and transformation
reactions upon heating and cooling between room temperature and high temperatures have
not been explored. Understanding how the relevant phases are formed and correlated

58
would help further development on material design and processing for these alloys. To
study this, an in-situ measurement, e.g., x-ray diffraction, may be used to monitor phase
transformations upon heating and cooling between room temperature and 1250 oC.
Another question is: does ordering occur in the single β phase, or is an other phase required
to consume the atoms that do not contribute to β ordering?
Additionally, for the development of β ordering, it is unclear whether the
transformation begins at a high temperature during holding, or during quenching to room
temperature. To answer this question, in-situ measurements using x-ray diffraction may be
required.
Khataee et al. [28] were unable to detect superlattice reflections in their x-ray
diffraction patterns, while strong evidence of ordering was observed in their SADPs.
Electrons have a stronger interaction with materials than x-rays and are diffracted under
the influence of both positively charged nuclei and the surrounding electrons, in terms of
their electrostatic potential. X-rays interact only with electrons. As a result, x-ray analysis
frequently provides information with fewer details compared to electron diffraction
studies.
However, Khataee et al.’s experiment [3, 13, 27, 28] were conducted under
equilibrium conditions for prolonged solution treatment times prior to quenching. While
the information obtained can be used to construct or validate phase diagrams for this
system, industrial applications also require kinetics information. This can be used to
design process parameters, e.g., heating and cooling rates. An in-situ measurement during
phase transformation is thus necessary in order to serve industrial needs.

Chapter 3 Experimentation
3.1 Chapter overview
This chapter concerns the experimental study of phase transformation in Ti-Al-Ru
system based on the most recent phase diagram [37]. Part of the previous studies by
Khataee et al. [3, 13, 27, 28] were re-examined using high-temperature synchrotron x-ray
diffraction as the major characterization technique. Details of the experimental setup and
specimen preparation are discussed. The crystallographic analysis of the x-ray diffraction
data is explained. In addition, a list of the difficulties encountered in the experimental
measurements is given.
3.2 Alloy selection
An analysis of the composition Ti-34 at% Al-4.5 at% Ru was used in this study to
investigate
- The nature of the decomposition reactions of the as-quenched β phase
when the alloys are heated back to the β-phase field
- The nature of the decomposition reactions of the alloy upon cooling from
β-phase field, and possibly determining if β ordering exists.
60
3.3 Alloy preparation
A Ti-Al-Ru alloy was produced by arc-melting a mixtures of 99.7% purity small Ti
blocks, 1” lengths of 99.999% purity Al wire, and coarse 99.95% purity sponge Ru powder
wrapped in commercial purity Al foil with 98.5% purity [109], under an argon atmosphere
in a copper mold. The Ru was placed at the bottom of the mold, the Al rods next, and the
Ti blocks on top. The system was repeatedly evacuated to less 30 ksi, and purged with
ultra-high purity argon (99.999 % purity). A Ti getter was melted first to remove as much
residual oxygen as possible. Care was taken to minimize material loss by keeping the
melting times short. After cooling, the specimen was then flipped, and remelted. This was
repeated two more times. Sample weights were measured before and after melting
processes to ascertain the extent of elemental evaporation (Al) or loss during melting (less
than 1%).
3.4 Heat treatment
For homogenization, the arc-melted alloy was sectioned, wrapped in tungsten foil,
and sealed in quartz capsules under vacuum. A specimen was equilibrated at 1300 oC, and
then ice-water quenched. The specimen surface was ground to eliminate surface
contamination. Energy dispersive spectroscopy (EDS) was performed on the specimen to
assure that there was no tungsten or silicon contamination.

61
3.5 Microstructure observation and analysis
Optical and scanning electron microscopy techniques were utilized to observe the
microstructures. The specimens were cross-sectioned and prepared using standard
metallographic procedures. The etchant used was 1 vol%HF-10 vol%HNO3 in water.
3.6 Composition analysis on as-quenched specimens
A preliminary compositional analysis was performed on a homogenized and as-
quenched alloy using EDS. The only metallic elements detected were Ti, Al, and Ru. The
composition of the β phase in the homogenized and as-quenched alloy was characterized
using electron probe microanalysis (EPMA). Compositions were measured in regions of
the sample from which x-ray diffraction specimens were to be prepared. Two EPMA
scans were performed along lines perpendicular to one another. 200 data were collected
using the minimum spot size available (<1 µm) at 5-µm intervals with probe conditions: 15
kV beam energy, 40 nAmp beam current, and 20 sec dwell time for each scan. The
compositions for the 5 elements were essentially the same at each point in the scan; the
average values are:
Ti = 54.5±0.9 at% Al = 32.4±0.3 at% Ru = 4.1±0.3 at%
O = 8.9±0.8 at% Si = 0.02±0.01 at%
Thirteen macroscopic EDS measurements were also performed. The compositions
measured in 100-µm square blocks at intervals of 800 µm varied by only approximately 1
part in 400. These results from the EPMA and EDS measurements strongly suggest that
the alloy appears to be homogeneous.
62
Based upon the analyses, the Ti-34 at% Al-4.5 at% Ru alloy were redesignated Ti-
32.4 at% Al-4.1 at% Ru. This composition places the alloy in the β-phase field above
1100 oC.
3.7 High-temperature synchrotron x-ray diffraction
Synchrotron x-ray measurements were performed using transmission Debye-Scherrer
geometry on specimens packed and sealed in quartz capillaries. The experiments were
carried out at beamline X14A of the National Synchrotron Light Source (NSLS), Upton,
NY. X14A is operated by the High Temperature Materials Laboratory User Program of
Oak Ridge National Laboratory, Oak Ridge, TN.
3.7.1 Instrumentation
The optical system for the beamline is shown in Figure 3-1. On X14A, x-ray
photons are first reflected from a platinum-coated flat single crystal silicon mirror to
optimize the x-ray intensity by reducing angular divergence of the beam. A wavelength of
0.731427 Ả was selected through the utilization of a horizontally focusing double crystal
(111) silicon monochromator. The first crystal in the monochromator is water-cooled and
flat, and the second is conically bent. For each diffraction scan, the monochromator was
adjusted to optimize the beam intensity. Two ionization gauges continuously measured the
incident beam intensity.
The beam divergence was less than 0.02o in the vertical direction, and 0.35o in the
horizontal direction. A Huber six-circle diffractometer, fitted with a linear position sensing
detector (PSD), was used. Two slits controlled the beam size (1.5 mm horizontal and 1

63
mm vertical) at the position of the specimen, which was placed inside a furnace mounted
on the diffractometer. Figure 3-2 (a) and Figure 3-2 (b) show images of the
instrumentation setup inside the experiment hutch from two points of view.
Figure 3-1 Beam optics for beamline X14A at NSLS
2θ
Flat Monochromator
Conical Monochromator Mirror
Specimen
PSD
Experiment Hutch
Incident x-ray
photons
Diffracted x-rays
Slit 1 Slit 2
Ionization Gauge 1
Ionization Gauge 2
Conditioned beam

64
Figure 3-2 Instrumental setup on beamline X14A showing the Huber diffractometer inside the
experiment hutch. a) looking toward the incident beam; b) looking down the incident beam.
PSD
Furnace
a)
PSD
Furnace
Incident x-rays
b)

65
3.7.1.1 High-temperature furnace
A specially designed cylindrical furnace [110] was mounted on the diffractometer.
A maximum operating temperature of approximately 1500 oC could be achieved in this
furnace using a Pt/Pt-10%Rh wire heater. The heating element was wound on an Al2O3
tube with a BeO tube inside. The furnace was designed so that the thermal gradient at the
specimen was quite small. A stainless steel sleeve housed the tubes and facilitated
mounting and position adjustment. The incident x-ray beam entered the furnace heating
element through a 3-mm-diameter hole, and the scattered x-rays exited through a 3-mm-
wide slot which limited the observable two-theta range to 0o-90o.
3.7.1.2 Temperature calibration using MgO
Because the thermocouple and the capillary specimen were approximately 2 cm
apart, MgO, whose thermal expansion has been characterized from room temperature to
above 1300 oC, was used as a standard to obtain a temperature calibration curve.
Toulukian et al. [111] represented the change in strain with respect to temperature (Tε ) by
a third order polynomial function (Equation 3-1). The errors associated with the values
calculated from this equation were ± 0.03. To calibrate the thermocouple system, a series
of x-ray diffraction measurements were performed on MgO over the temperature range of
33.5 oC to 1300 oC. The lattice parameters for MgO at each temperature were calculated
from the positions of ten reflections using the program UNITCELL [112]. From these
values, strains were calculated, with 20 oC as the basis temperature; the corrected
temperatures were then obtained from Equation 3-1, and the final temperature calibration
curve was constructed (Figure 3-3)

66
311273 10834.210581.210040.1326.0 TTTT−−− ×−×+×+−=ε Equation 3-1
0 200 400 600 800 1000 1200 1400
0
200
400
600
800
1000
1200
1400
Cor
rect
ed te
mpe
ratu
re (
o C)
Measured temperature (o C)
TCorrected
= 3(1) + 0.993(2) TMeasured
Figure 3-3 Calibration curve for the temperature measurement
3.7.1.3 Position sensing detector (PSD)
A position sensing detector (PSD) as shown in Figure 3-2 a) and b) was utilized for
the in-situ high-temperature measurements to speed up the data acquisition. The PSD
received data at a rate of up to1500 counts/sec in each channel, with a 0.1 microsecond
dead time. Data were taken at every 0.005o 2θ. The detector collected intensity data over
a 3.2o 2θ span, which results in a data acquisition speed quite suitable for x-ray

67
measurements during phase transitions on a high intensity source. The acceptance distance
along the direction parallel to the two-theta axis was 10 mm.
A scan is defined by start point, end point, number of steps, and count time per step.
Scans were begun at 1.6o below the start point, and finished at 1.6o beyond the end point,
with step-scan measurements every 3.2o. An overlapping of 1.6o takes place at each step.
A computer program processes the acquired data to give the total counts at two-theta
intervals of interest.
The scan time for each temperature upon the step-wise heating and cooling between
room temperature and 1220 oC is summarized in Table 3-1. Additional scans (scan time 2)
were performed only between 1220 oC-1068 oC to investigate the possible presence of a
(001) β’ superlattice reflection. Generally, it was estimated that the specimen was heated
at an average heating rate of 5.3 oC/min and an average cooling rate of 4.8 oC/min.

68
Table 3-1 Summary of scan time for x-ray diffraction measurements during step-wise heating and
cooling between room temperature and 1220 oC
Temperature (oC) Transition time to current temperature (min) Scan time 1 (min) Scan time 2 (min)
55 N/A 11 N/A 102 12 11 N/A 206 11 11 N/A 358 9 11 N/A 510 8 11 N/A 587 3 11 N/A 625 4 11 N/A 683 3 11 N/A 709 4 11 N/A 917 13 11 N/A 1018 10 11 N/A 1068 4 5 N/A 1119 6 5 N/A 1170 5 5 N/A 1220 5 5 6 1170 16 5 6 1119 16 5 6 1068 18 5 6 1018 9 5 N/A 917 8 5 N/A 815 8 5 N/A 612 13 5 N/A 409 17 5 N/A 206 24 5 N/A 36 57 0 N/A

69
3.7.2 Specimen preparation for high-temperature x-r ay diffraction
The size of the capillaries used to contain the specimens was chosen by considering
the linear absorption coefficient (µ*), which was calculated for the alloys using the
elemental mass attenuation coefficients for MoKα radiation (λ=0.70926 Ả) [113], since it
has a wavelength close to that for the synchrotron radiation used (λ=0.731427 Ả).
Assuming a density of 4.5 g/cm3, the linear attenuation coefficients for fully-dense Ti-32.4
at% Al-4.1 at% Ru were 87.26 cm-1. The packing density of powders in a capillary can
vary between 20% and 50% [114]; to estimate the linear absorption coefficient for loosely-
packed specimens, a 35% packing density was assumed. Finally, a rule of thumb [114] is
the linear attenuation coefficient x capillary diameter should be <1. From this, the
maximum capillary diameter was estimated to be 0.33 mm for Ti-32.4 at% Al-4.1 at% Ru.
Thus, a 0.3-mm diameter quartz glass capillary, commercially available, seemed to be
suitable. Since the quartz capillary also absorbs some of the x-rays, capillaries with a 0.01
µm wall-thickness were chosen for the measurements. These capillaries were extremely
fragile and difficult to handle.
The alloys were very ductile and had to be reduced to a powder using a 200-grit
diamond hand file. Before filing, the surfaces of the samples were extensively ground to
remove the regions that contained extensive amounts of a second phase. The collected
powders were finally screened using a 325-mesh (≤45 µm) copper screen. Some peak
broadening due to mechanical deformation was expected on the diffraction patterns at
lower temperatures.

70
Ti and its alloys are very sensitive to oxidation, especially at high temperatures, and
attempts were made to eliminate oxygen from the powdered specimens. Capillaries were
filled with the alloy powders, evacuated to 2x10⁻⁷ Torr, and sealed to prevent any further
oxygen contamination. An oxyacetylene flame was briefly passed over the capillary at the
beginning of evacuation to facilitate degassing.
Quartz glass capillaries were selected since quartz exhibits a high melting point
(~1650 oC). Quartz maintains its integrity up to 1300 oC, which covers the temperature
ranges used in the high-temperature diffraction measurements. A preliminary test was
carried out to confirm this. Figure 3-4 shows an image of a sealed capillary containing Ti-
34 at% Al-2.5 at% Ru powder after holding at 1100 oC for 7 and 15 min and 1300 oC for
12 min. No slump was observed, and the capillary successfully maintained its integrity
through the heating cycle. Because of the possible reaction between the quartz capillary
and the specimen powder, the high-temperature x-ray measurements were performed in as
short a time as possible.

71
1100o
1300o
25o/min
25o/minT (o C)
Time
Room temperature
20 min
Specimen
Thermocouple
1300o C
Figure 3-4 Test of the integrity of a sealed capillary after holding at various temperatures

72
Because the quartz capillaries were extremely fragile, they were inserted, with
much difficulty, into a quartz specimen holder (Figure 3-5 (a)) specially designed to
protect them and allow them to be mounted in the furnace. The specimen holder was
inserted into a collar which was, in turn, mounted on the furnace sample holder (Figure 3-5
(b)).
The specimen holder was positioned with respect to the incoming beam and the
detector. As shown in Figure 3-5 (a), two windows were fabricated around the sample area
on the quartz rod. These windows were made wide enough so that the incoming beam hits
the specimen, and the outgoing beam can be detected over the 0o-90o 2θ range. A
preliminary scan was performed prior to a measurement series to assure that the specimen
holder was correctly positioned. With this setup, however, the specimen could not be
rotated during the diffractometer scan.

73
Collar
Sample holder
Sealed quartz
capillary
Figure 3-5 (a) Specimen and holder, and (b) setting of sample holder inside the furnace on the
diffractometer
Sample holder
Furnace

74
3.8 X-ray diffraction data analysis
Synchrotron radiation diffraction patterns were taken over various heating and
cooling cycles. The analysis of the resulting patterns for peak location, peak identification,
peak area and lattice parameter refinement of the phases observed are explained in this
section.
3.8.1 Peak location
The positions of the reflections were determined by locating the centroid using a
routine in the program WinPLOTR [115] wherever possible. If a peak was fragmented
and/or overlapped with other peaks, the position of the reflection was determined visually.
An error for the observed 2θ values was estimated by performing measurements on five
types of peaks. Five centroid measurements were made on each of three large and three
small symmetric peaks. In addition, five visual measurements of the location of each of
three large fragmented peaks, three small fragmented peaks, and three overlapped peaks
were made. The maximum error observed in these 75 measurements was 0.0044o 2θ; this
value was taken as the error for all peak locations.
3.8.2 Phase identification in diffractometer patter ns
The phases present in the alloy microstructures were identified on the basis of
previous results of Khataee et al. [28]. Because of the x-ray diffraction specimen design
and the very high measurement temperatures, reflections can be also observed in the
diffractometer patterns from substances other than those associated with the Ti-Al-Ru alloy
system. These include:

75
diamond – from the diamond file
quartz – scattering from the quartz capillary
silicides – from reaction of the alloy with the quartz
oxides – from reaction of the alloy with residual oxygen in the capillary
The reflections in the experimental diffraction patterns were identified by matching
the interplanar spacings with those in the powder patterns in the International Centre for
Diffraction Data (ICDD) Powder Diffraction File (PDF).
3.8.3 Peak area
Two approaches were utilized to determine the areas under the peaks. If a peak
was not overlapped, the area was determined by integration using a routine in the
WinPLOTR [115]. An error for the observed peak area was estimated by performing
measurements on four types of peaks. The areas of three large and three small symmetric
peaks and three large and three small fragmented peaks were each measured five times.
The maximum error for these 60 measurements was ±21. This value was used as the error
for these four peak types. For overlapped peaks, the area could only be estimated by
superimposing a triangle with a height equivalent to that of the peak over the region where
the peak appeared to be and calculating its area. Ten measurements of each of three
overlapped peaks were measured. The maximum error of ±122 was observed; this value
was used as the error for this type of peak.

76
3.8.4 Lattice parameter refinement
Using peaks from the G phase and the program UNITCELL [112], zero shifts for
most of the diffractometer patterns were calculated at various temperatures. The peak
positions of the G phase were chosen to calculate zero-shift correction because it is cubic,
with a moderately large lattice parameter, and was present in most of the diffraction
patterns. For some patterns, the G phase was not observed, and the average of the
available zero shift values for all of the alloys was used. The zero shift values were in the
range 0.0483-0.0992o 2θ, similar to those obtained for the MgO standard (0.0747-0.1056o
2θ). All peak positions were zero-shift corrected.
3.9 Difficulties in the experiment
Various possible and actual difficulties were encountered in the measurement and
analysis of the diffraction patterns, and were considered during all steps of the analyses:
- Particle statistics problem (large particle size and stationary specimen)
- Scattering and crystalline reflection from the quartz capillary
- Reaction between the specimen and the quartz produced various silicide phases.
- Silicide phases formed at the inner wall of the quartz capsule introduced a false
doubling of the silicide diffraction peaks.
- Broad peaks and the presence of up to ten phases frequently resulted in extensive
overlap of reflections.
- Phase transitions were sluggish resulting in compositional segregation. The alloy
particles transformed under non-equilibrium conditions, resulting in the presence of
unexpected phases.

77
- Some phases were present in very small amounts making the identification very
difficult.
- Specimen inhomogeneity resulted in the formation of fragmented and frequently
strangely-shaped reflection profiles.
- The interpretation of the x-ray diffraction patterns was not an easy task.
Considerable care was taken to insure that the phases in the diffraction patterns were
properly identified.

Chapter 4 Results and Discussion
4.1 Chapter overview
This chapter provides a summary of the microstructural observations on the as-
quenched Ti-32.4 at% Al-4.1 at% Ru specimen, designated QH324, the nature of the
observed XRD patterns, and what they revealed about the phase transformations that
occurred in these alloys upon heating and cooling.
4.2 Microstructure of as-quenched samples
Three distinct microstructural regions were observed in QH324: an inner region
with no microstructural features, a single phase rim, and an intermediate two-phase region.
The inner region (Figure 4-1) contains single β phase. The two-phase rim was ∼100 µm-
thick case of the α2 and β phase at the specimen’s edge (Figure 4-2). This rim was
probably formed as a result of insufficiently high quenching rate. The β phase is less
stable and transforms to α2 phase. The intermediate two-phase region containing a mixture
of α2 and β phases is shown in Figure 4-2. This layer has non-uniform thickness of ~150-
200 µm.

79
Figure 4-1 Microstructure of the center region of QH324; the etchant, 1 vol%HF-10 vol%HNO3 in
water, was unable to reveal any grain boundaries in this single ββββ-phase region. No αααα2 is present.
ββββ
100 µµµµm

80
Figure 4-2 Microstructure of the rim of QH324: αααα2 and ββββ phases. Etchant: 1 vol%HF-10 vol%HNO3
in water
4.3 Nature of the XRD patterns
Synchrotron XRD patterns obtained in this experiment contain several features that
were different from what is usually observed in a typical XRD pattern. These were due to
the nature of specimen and the nature of the experimental conditions. Features of the
ββββ
αααα2
200 µµµµm
Crack

81
pattern were grouped into two categories, general features and additional features, which
are discussed in details as follows.
4.3.1 General features of diffraction pattern
General features of x-ray pattern concern the features that were developed due to
the nature of specimen and the nature of experimental condition. Powdered alloys used in
this experiment were prepared using a filing operation, which contributes to the peak
broadening. In this section, the general features of the pattern are discussed with respect to
the observation of peak broadening for the as-prepared powdered specimens, as well as
some uncommon peak shapes due to particle statistics and the inhomogeneity of the
specimen developed during the course of the x-ray measurements.
4.3.1.1 Peak broadening
Peak broadening was induced in the crystals of the Ti-Al-Ru specimen as a result
of shearing action from the diamond file during powder preparation. This broadening was
reduced as the crystal distortions were recovered during the course of the high-temperature
measurements.
Moreover, peak broadening was also observed when a depletion of alloying
elements developed around a phase undergoing a diffusion controlled transition. Atomic
diffusion led to the interchange of atomic positions according to a concentration gradient
formed across interface of the relevant phases. This also contributed to the gradual shift in
peak position for a specific crystallographic plane. As a result, peaks became broadened.

82
4.3.1.2 Peak shape versus particle statistics
Specimen preparation technique and the experimental setup for an x-ray diffraction
experiment determine the quality of the diffraction pattern in terms of particle statistics. In
general, a quality x-ray measurement provides a diffraction pattern consisting of a series of
reasonable symmetric peaks with a high peak to background intensity ratio. To achieve
this, as great a number of particles as possible is required so that their crystallographic
orientations are random.
In this study, transmission x-ray diffraction was utilized for the high-temperature
measurement. Powdered specimens were packed in capillary tubes which were later
evacuated and sealed. It was necessary to prepare the powdered specimen to the smallest
size possible. However, the particle size depends upon the technique used to produce the
powdered specimen, which, in turn, is determined in part by the strength of the specimen
material. Filing was selected as the powder production technique for the Ti-Al-Ru
specimens. Powdered specimens with particle size smaller than 45 µm were successfully
produced. However, it has been suggested that particle diameters smaller than 10 µm are
required in order to obtain good particle statistics [116]. The considerably larger particle
size used was thus a problem. Another possible solution mentioned previously was to use
as large a diameter of capillary as possible in order to maximize number of scattering
particles. However, the optimum capillary diameter of 0.3 mm was dictated by the linear
absorption of the specimen material.
To evaluate the effect of specimen preparation on the particle statistics of the
specimens, the number of alloy particles packed in one of the quartz capillaries used in an

83
x-ray measurement were counted within the ~2 mm probe distance of the incident x-ray
under an optical microscope. It was estimated that about 1500 particles with a diameter of
less than 45 µm were present in this portion of the 0.3-mm diameter capillary. Equation
4-1 [116], however, suggests that an x-ray must contain at least 52,900 particles in order to
reduce the standard error (σ) to less than 1%, and achieve a good particle statistics. This
condition was not met in the current experiments.
Consequently, the relative intensities of the reflections observed in the patterns in
this work are not expected to agree with those reported in the Powder Diffraction File
(PDF) [117]; in fact, some reflections may not even appear in the experimental patterns. A
standard error of 2.6% in number of particles was estimated on the basis of the current
specimen preparation technique. One way to improve the randomness of the specimen is
to spin the sample around the capillary axis while recording the pattern so that additional
crystallographic orientations of the particles can be achieved. Unfortunately, sample
rotation was not possible in this experiment.
n
n=σ Equation 4-1
where n = number of particles
4.3.1.3 Fragmented and asymmetric peak shapes
High temperature patterns were taken during phase transformations. An ongoing
phase transition normally involves transport phenomena. Atomic diffusion is one of the

84
major mechanisms. If this is the case, the progress of the transition is a function of time.
A relevant phase gradually adjusts its composition to minimize total energy of the system.
The change in composition of a phase affects the lattice parameters, interplanar spacings,
and reflection positions. Fragmented peak shapes also made identification and the
determination of peak locations difficult. As a result, the lattice parameter and the thermal
expansion calculations gave rise to some errors discussed later in this chapter.
4.4 Additional features of the x-ray patterns
Additional features in the XRD pattern arose from the incidental materials or phases
that were not connected with the purpose of this study. One possible contamination was
diamond from file particles abraded into the specimen during powder preparation.
However, no diamond reflections were observed in the XRD pattern. No Ti-Al-
Ru/diamond and/or quartz/diamond reaction products were detected in any of the x-ray
powder patterns. Thus, this section focuses on the additional features that were produced
due to the presence of the quartz capillary and the Ti-Al-Ru/quartz reaction layer formed
upon holding at high temperatures.
4.4.1 Quartz
Quartz was the capillary material used to contain the specimens during the high-
temperature x-ray measurements. Glassy quartz is amorphous in nature and its
diffractometer pattern is expected to consist predominantly of amorphous scattering, with
some sharp crystalline reflections. Figure 4-3 shows the x-ray patterns taken on an unfilled
quartz capillary at 51 oC prior to heating, and at 35 oC after cooling from 1220 oC. The

85
amorphous scattering in all of the diffraction patterns for the alloy taken during the heating
and cooling cycles is identical, and the same as that in the unfilled quartz patterns.
Crystalline quartz peaks were observed in some of the patterns for the alloy. These
crystalline peaks were enhanced after the heating and cooling.
Figure 4-3 X-ray patterns taken on an unfilled quartz capillary at 51 oC prior to heating and at 35
oC after cooling from 1220 oC
T=51 oC
T=35 oC
(010)
(011)
(110)
(020)
(112)
(121) (023)

86
4.4.2 Specimen/quartz reaction layer
The Ti-Al-Ru material in contact with the interior wall of the quartz capillary
reacted at high temperatures to form titanium silicides. Reflections observed in the
diffraction patterns taken at high-temperature indicated that several titanium silicides, i.e.,
Ti5Si3 Ti5Si4 and TiSi, form. The Ti5Si3 phase was the first silicide phase observed on the
x-ray pattern taken at 917 oC during heating, since this phase required the least amount of
Si from quartz. As the specimen/quartz reaction continued during the high temperature
measurements, more Si reacted with Ti. The Ti5Si4 and TiSi phases were later observed in
the x-ray patterns taken at 1022 oC on heating and at 1175 oC on cooling. The intensities
of these reflections increased slightly as the x-ray measurements preceded at high
temperatures, indicating a gradually increasing amount of the silicides during the course of
the measurements. The Ti5Si3 phase was identified as the most prominent silicide phase
present at room temperature after cooling (Figure 4-4). Thus, a portion of the specimen in
contact with the interior wall of the quartz capillary reacted to form silicide phases, but
their low reflection intensities indicate that the majority of the specimen was unreacted.
Phase identification of the XRD patterns was carried out with awareness of this silicide
phase contamination.

87
(Ti,Al)Ru
G
αααα 2
αααα 2
αααα 2
ββββG
Gαααα
(112)
Ti5Si3
TiSi
Ti5Si4
Figure 4-4 X-ray diffraction pattern of the alloy QH324 recorded at 36 oC during cooling. Peak
positions of the titanium silicides are indicated.
4.5 Modeling of lattice parameter for ββββ, αααα2 and G phases
A mathematical model was used to study the correlation between the lattice
parameters and the alloy composition with respect to temperature. Moreen et al. [118]
proposed a relationship based on the hypothesis that the lattice parameter of a solid
solution i correlated to the average of all the interatomic distances. They demonstrated that
this approach yields results in good agreement with the experimental data for various alloy
systems with both limited and complete solubility [118-121].
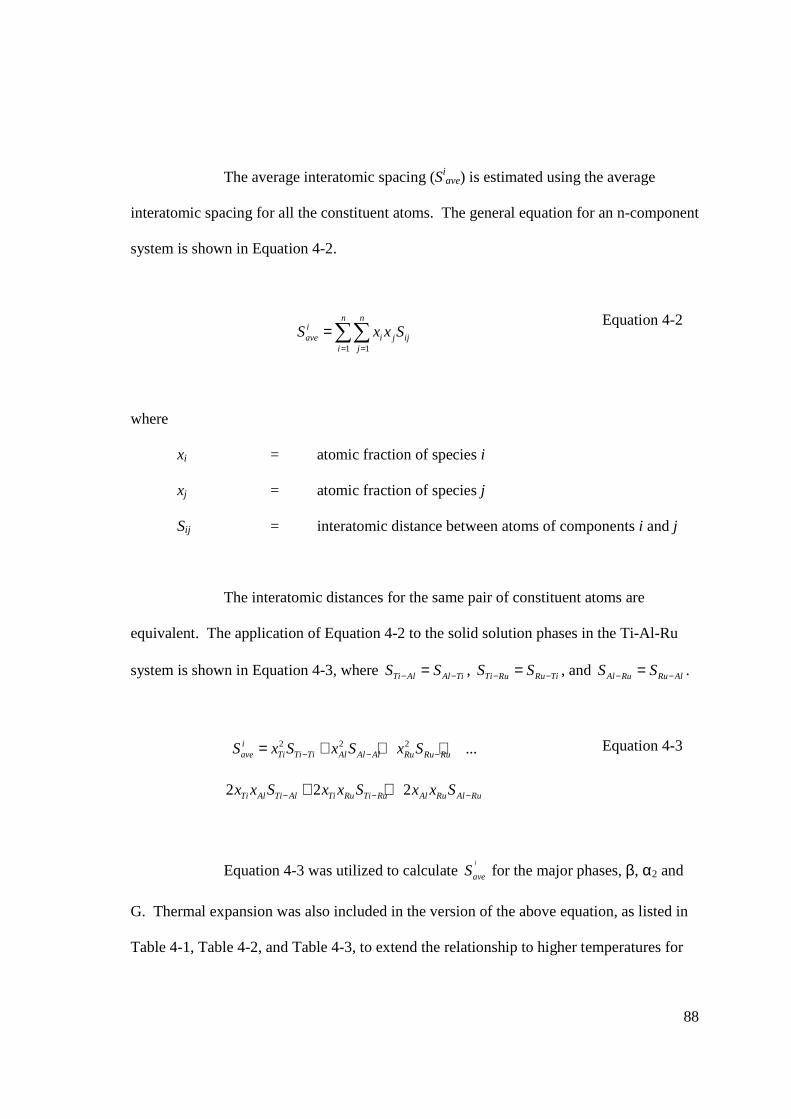
88
The average interatomic spacing (Siave) is estimated using the average
interatomic spacing for all the constituent atoms. The general equation for an n-component
system is shown in Equation 4-2.
1 1
n niave i j ij
i j
S x x S= =
=∑∑ Equation 4-2
where
xi = atomic fraction of species i
xj = atomic fraction of species j
Sij = interatomic distance between atoms of components i and j
The interatomic distances for the same pair of constituent atoms are
equivalent. The application of Equation 4-2 to the solid solution phases in the Ti-Al-Ru
system is shown in Equation 4-3, where Ti Al Al TiS S− −= , Ti Ru Ru TiS S− −= , and Al Ru Ru AlS S− −= .
2 2 2 ...iave Ti Ti Ti Al Al Al Ru Ru RuS x S x S x S− − −= + + +
2 2 2Ti Al Ti Al Ti Ru Ti Ru Al Ru Al Rux x S x x S x x S− − −+ +
Equation 4-3
Equation 4-3 was utilized to calculate i
aveS for the major phases, β, α2 and
G. Thermal expansion was also included in the version of the above equation, as listed in
Table 4-1, Table 4-2, and Table 4-3, to extend the relationship to higher temperatures for

89
the G, β, and α2 phases, respectively. Experimental information from related alloy systems
was used to obtain the coefficients for all the terms. Different co-ordination numbers
(C.N.) in the interatomic distance data had to be taken in account [122]. For example, the
atom in the β phase are in C.N.=8, while those in the α2 phase are in C.N.=12. Thus, any
distance taken from other alloy systems required conversion to the C.N. in β and α2. The
atoms in G phase are all in C.N.=16, and all interatomic distances used were taken from
crystallographic information for this phase [108].
Table 4-1 Summary of terms for GaveS calculation based on Moreen et al.’s approach [118]
Terms Remarks
Distance from Ti-Ti interatomic distance in G [108] and thermal expansion from β-Ti [123]
Distance from Al-Al interatomic distance in G [108] and thermal expansion from Al [124]
Distance from Ru-Ru interatomic distance in G [108] and thermal expansion from Ru [125]
Distance from average of Ti-Al interatomic distances in G [108] and thermal expansion from γ [126]
Distance from average of Ti-Ru interatomic distances in G [108] and thermal expansion estimated as 0.02 divided by TiRu melting point in K [127]
Distance from average of Al-Ru interatomic distances in G [108] and thermal expansion from AlRu [128]
5( ) 3.7790(5) [1.2(5) 10 3.7790(5) ( 25)]−− = + × × × −Ti TiS A T
6( ) 4.3280(5) [7.84(8) 10 4.3280(5) ( 25)]−− = + × × × −Ru RuS A T
5( ) 3.820(5) [1.087(5) 10 3.820(5) ( 25)]−− = + × × × −Ti AlS A T
6( ) 3.2410(5) [8.32(5) 10 3.2410(5) ( 25)]−− = + × × × −Ti RuS A T
6( ) 4.440(5) [7.80(5) 10 4.440(5) ( 25)]−− = + × × × −Al RuS A T
5( ) 3.2710(5) [2.90(5) 10 3.2710(5) ( 25)]−− = + × × × −Al AlS A T

90
Table 4-2 Summary of terms for aveSβ calculation based on Moreen et al.’s approach [118]
Terms Remarks
Distance calculated from β-Ti lattice parameter [129] and thermal expansion taken from β-Ti [123]
Distance calculated from atomic radius of Al using 2 as multiplying factor [108] and thermal expansion from Al [124]. Then, distance calculated from C.N. 12 to C.N. 8 [122].
Distance calculated from average distance between first and second nearest neighbors of Ru [125] and thermal expansion estimated from average thermal expansion along a and c axes of Ru [125]. Then, distance calculated from C.N. 12 to C.N. 8 [122].
Distance calculated from average distance between first and second Ti-Al nearest neighbors of α2 [130] and thermal expansion estimated from average thermal expansion along a and c axes of α2 [131]. Then, distance calculated from C.N. 12 to C.N. 8 [122].
Distance from Ti-Ru interatomic distance in TiRu [132] and thermal expansion estimated as 0.02 divided by TiRu melting point in K [127]
Distance from Al-Ru interatomic distance in AlRu [133] and thermal expansion from AlRu [128]
53( ) (3.283(5) [1.2(5) 10 3.283(5) ( 25)])
2−
− = + × × × −Ti TiS A T
6100( ) ( ) (1.96164(5) [7.84(8) 10 1.96164(5) ( 25)])
103−
− = × + × × × −Ru RuS A T
5100( ) ( ) (2.875(5) [1.29(5) 10 2.875(5) ( 25)])
103−
− = × + × × × −Ti AlS A T
6( ) 2.656(5) [8.32(5) 10 2.656(5) ( 25)]−− = + × × × −Ti RuS A T
6( ) 2.591(5) [7.80(5) 10 2.591(5) ( 25)]−− = + × × × −Al RuS A T
5100( ) ( ) (2.864(5) [2.90(5) 10 2.864(5) ( 25)])
103−
− = × + × × × −Al AlS A T

91
Table 4-3 Summary of terms for 2aveSα calculation based on Moreen et al.’s approach [118]
Terms Remarks
Distance from α-Ti lattice parameter [123] and thermal expansion estimated from average thermal expansion along a and c axes of α-Ti [123]
Distance converted from atomic radius of Al using 2 as multiplying factor [108] and thermal expansion taken from Al [124].
Distance calculated from average distance between first and second nearest neighbors of Ru [125] and thermal expansion estimated from average thermal expansion along a and c axes of Ru [125].
Distance calculated from average distance between first and second Ti-Al nearest neighbors of α2 [130] and thermal expansion estimated from average thermal expansion along a and c axes of α2 [131].
Distance from Ti-Ru interatomic distance in TiRu [132] and thermal expansion estimated as 0.02 divided by TiRu melting point in K [127]. Then, distance calculated from C.N. 12 to C.N. 8 [122].
Distance from Al-Ru interatomic distance in AlRu [133] and thermal expansion from AlRu [128]. Then, distance calculated from C.N. 12 to C.N. 8 [122].
6( ) 2.876(5) [9.87(5) 10 2.876(5) ( 25)]−− = + × × × −Ti TiS A T
6( ) 1.96164(5) [7.84(8) 10 1.96164(5) ( 25)]−− = + × × × −Ru RuS A T
5( ) 2.875(5) [1.29(5) 10 2.875(5) ( 25)]−− = + × × × −Ti AlS A T
5( ) 2.864(5) [2.90(5) 10 2.864(5) ( 25)]−− = + × × × −Al AlS A T
6103( ) ( ) (2.656(5) [8.32(5) 10 2.656(5) ( 25)])
100−
− = × + × × × −Ti RuS A T
6103( ) ( ) (2.591(5) [7.80(5) 10 2.591(5) ( 25)])
100−
− = × + × × × −Al RuS A T

92
The equations for the calculation of the interatomic distances (Si) from the
lattice parameters for the G, β, and α2 phases are given in Equation 4-4, Equation 4-5, and
Equation 4-6, respectively. The equations for β and α2 phases were derived from the
geometry of their crystal structures. However, for the G phase, the conversion factor of
3.219 was directly derived from the relationship between the lattice parameter
(composition: Ti-46 at% Al-22 at% Ru, the lattice parameter of 12.2403 Å [37, 108]) at
room temperature and its corresponding average interatomic distance (3.802 Å).
3.219= ×G GS a Equation 4-4
3( )
2= ×S aβ β
Equation 4-5
2 2
2
2 2( ) ( )22 3
= +a c
S α αα
Equation 4-6
A database of interatomic distances was generated according to the
proposed model for a grid of composition values for the G, β, and α2 phases at
composition intervals of 0.02 at%. The lattice parameters measured from the diffraction
patterns for each phase were converted to an interatomic spacing using Equation 4-4,
Equation 4-5, or Equation 4-6. Then the calculated interatomic spacings were matched
with the interatomic distances in the database. The Ti-Al and Ti-Al-Ru phase diagrams
(Figure 2-10 and Figure 2-26) were consulted to get estimated composition ranges. These

93
searches were limited to the composition ranges: G (Al: 36-51 at% Al , Ru: 10-50 at%
Ru), β (Al: 25-40 at% Al , Ru: 0-15 at% Ru), and α2 (Al: 22-39 at% Al , Ru: 0-4.5 at%
Ru). The corresponding alloy composition matched in the database represented the
estimated composition of the phase present in the experimental x-ray pattern. As the
composition resolution of 0.02 at% is quite high, a large number of solutions (967 points,
1482 points, and 1622 points for G, β, and α2 phases, respectively) were obtained. The
results include the maximum, minimum, and mean of the possible compositions. The
estimated compositions from the search/match results for the G, β, and α2 phases are
summarized in Table 4-4, Table 4-5, and Table 4-6, respectively.

94
Table 4-4 Summary of the estimated alloy compositions for the G phase from the lattice
parameters and average interatomic distance obtained from high-temperature x-ray
diffraction analysis
at% Al at% Ru Cycle T (oC) a (Å) G
aveS (Å) Max Min Mean Max Min Mean
Heating 683 12.3514 3.8370 51.00 36.00 43.15 30.36 25.84 27.71 Heating 709 12.3714 3.8432 51.00 36.00 43.23 31.04 26.36 28.28 Heating 917 12.3761 3.8447 51.00 36.00 43.15 30.02 25.38 27.29 Heating 1018 12.3864 3.8479 51.00 36.00 43.18 29.84 25.11 27.07 Heating 1068 12.3889 3.8487 51.00 36.00 43.19 29.64 24.96 26.87 Heating 1119 12.3930 3.8500 51.00 36.00 43.21 29.50 24.00 26.72 Heating 1170 12.3994 3.8519 51.00 36.00 43.20 29.48 24.74 26.67 Heating 1220 12.3997 3.8520 51.00 36.00 43.19 29.18 24.46 26.57 Cooling 1170 12.3884 3.8485 51.00 36.00 43.24 28.98 24.34 26.21 Cooling 1119 12.3724 3.9436 51.00 36.00 43.14 28.58 24.08 25.90 Cooling 1068 12.3658 3.8415 51.00 36.00 43.15 28.60 24.14 25.94 Cooling 1018 12.3559 3.8384 51.00 36.00 43.20 28.48 24.10 25.83 Cooling 917 12.3425 3.8343 51.00 36.00 43.14 28.52 24.22 25.93 Cooling 815 12.3322 3.8311 51.00 36.00 43.16 28.70 24.44 26.14 Cooling 612 12.3006 3.8212 51.00 36.00 43.16 28.58 24.52 26.12 Cooling 409 12.2747 3.8132 51.00 36.00 43.14 28.70 24.80 26.33 Cooling 206 12.2488 3.8052 51.00 36.00 43.14 28.82 25.06 26.53 Cooling 36 12.2302 3.7994 51.00 36.00 43.14 29.06 25.38 26.82

95
Table 4-5 Summary of the estimated alloy compositions for the β phase from the lattice
parameters and average interatomic distance obtained from high-temperature x-ray
diffraction analysis
at% Al at% Ru Cycle T (oC) a (Å) G
aveS (Å) Max Min Mean Max Min Mean
Heating 55 3.2001 2.7713 40.00 25.00 32.56 11.16 8.76 9.93 Heating 102 3.2021 2.7731 40.00 25.00 32.55 11.14 8.78 9.93 Heating 206 3.2029 2.7738 40.00 25.00 32.55 11.72 9.50 10.57 Heating 358 3.2068 2.7772 40.00 25.00 32.55 12.08 10.02 11.01 Heating 510 3.2116 2.7813 40.00 25.00 32.52 12.28 10.40 11.29 Heating 587 3.2120 2.7817 40.00 25.00 32.54 12.72 10.92 11.77 Heating 625 3.2120 2.7817 40.00 25.00 32.52 12.96 11.22 12.04 Heating 683 3.2335 2.8003 40.00 25.00 32.55 9.80 8.02 8.85 Heating 709 3.2412 2.8069 40.00 25.00 32.54 8.66 6.86 7.70 Heating 917 3.2496 2.8142 40.00 25.00 32.53 8.68 7.10 7.83 Heating 1018 3.2451 2.8103 40.00 25.00 32.51 10.14 8.70 9.35 Heating 1068 3.2454 2.8106 40.00 25.00 32.53 10.42 9.04 9.67 Heating 1119 3.2450 2.8102 40.00 25.00 32.52 10.82 9.50 10.10 Heating 1170 3.2424 2.8080 40.00 25.00 32.52 11.58 10.32 10.88 Heating 1220 3.2428 2.8084 40.00 25.00 32.51 11.84 10.62 11.16 Cooling 1170 3.2469 2.8119 40.00 25.00 32.53 9.60 8.30 8.88 Cooling 1119 3.2493 2.8140 40.00 25.00 32.51 10.10 8.76 9.36 Cooling 1068 3.2501 2.8146 40.00 25.00 32.54 9.66 8.26 8.89 Cooling 1018 3.2476 2.8125 40.00 25.00 32.51 9.76 8.30 8.97 Cooling 917 3.2446 2.8099 40.00 25.00 32.53 9.42 7.86 8.59 Cooling 815 3.2387 2.8048 40.00 25.00 32.54 9.82 8.16 8.93 Cooling 612 3.2308 2.7980 40.00 25.00 32.54 9.48 7.60 8.49 Cooling 409 3.2238 2.7919 40.00 25.00 32.55 9.42 7.32 8.32 Cooling 206 3.2192 2.7879 40.00 25.00 32.53 8.74 6.38 7.52 Cooling 36 3.2132 2.7828 40.00 25.00 32.57 8.50 5.94 7.19

96
Table 4-6 Summary of the estimated alloy compositions for the α2 phase from the lattice
parameters and average interatomic distance obtained from high-temperature x-ray diffraction
analysis
at% Al at% Ru Cycle T (oC) a (Å) c (Å) G
aveS (Å) Max Min Mean Max Min Mean
Heating 683 5.8342 4.6775 2.8821 25.94 22.00 23.71 4.50 4.40 4.46 Heating 709 5.8265 4.6887 2.8853 29.54 22.00 25.53 4.00 3.76 3.89 Heating 917 5.8401 4.7010 2.8926 28.40 22.00 25.02 4.00 3.68 3.85 Heating 1018 5.8461 4.7075 2.8962 28.62 22.00 25.18 4.00 3.60 3.81 Heating 1068 5.8495 4.7138 2.8994 33.40 22.00 27.54 4.00 3.22 3.61 Heating 1119 5.8531 4.7222 2.9034 27.78 22.00 24.77 3.00 2.56 2.79 Heating 1170 5.8551 4.7331 2.9081 36.32 22.00 28.95 3.00 1.72 2.35 Heating 1220 5.8639 4.7262 2.9068 27.22 22.00 24.51 3.00 2.56 2.79 Cooling 1170 5.8583 4.7215 2.9040 23.66 22.00 22.73 3.00 2.88 2.95 Cooling 1119 5.8615 4.7182 2.9032 26.90 22.00 24.36 3.00 2.64 2.83 Cooling 1068 5.8553 4.7312 2.9074 41.00 22.00 31.29 2.62 0.92 1.74 Cooling 1018 5.8516 4.7249 2.9042 41.00 22.00 31.30 2.90 1.36 2.10 Cooling 917 5.8406 4.7171 2.8992 39.86 22.00 30.66 3.00 1.84 2.40 Cooling 815 5.8282 4.7110 2.8946 38.02 22.00 29.74 3.00 2.16 2.57 Cooling 612 5.8117 4.7026 2.8885 41.00 22.00 31.34 2.66 1.96 2.30 Cooling 409 5.8067 4.6881 2.8818 41.00 22.00 31.40 2.20 1.92 2.06 Cooling 206 5.7933 4.6745 2.8740 41.00 22.00 31.37 2.24 2.00 2.13 Cooling 36 5.7832 4.6596 2.8662 41.00 22.00 31.40 2.84 2.20 2.54
According to Table 4-4, the proposed model for the G phase was
successfully established. Most of the at% Al matched in the search range are possible Al
contents for the G phase, while only a small range of at% Ru was found. The possible Ru
content lies in the range 23.52-30.36 at%, and the means are in the range 25.12-27.76 at%.
This is consistent with what suggested by the Ti-Al-Ru diagram; the Ru content is fixed,
while a wide range of Al content is possible. The small variation in composition for the

97
Ru content in the G phase suggests that it did not undergo any significant transformation
over the course of the step-wise heating and cooling.
This is consistent with the observation of relatively small amounts of
fragmentation of the intensity profile for the G phase reflections (see Figure 4-10, Figure
4-14 and Figure 4-15), in contrast to the severe peak fragmentation observed in the β and
α2 reflections. It is suggested that the G phase is likely stable compared to the β and/or α2
phases. Alternatively, the β and α2 phases were simply fragmented due to the particle
statistics problem. Thus, further characterization on the thermal stability of the G phase is
recommended to better understand its nature.
From the modeling results for the G phase, a correlation between the lattice
parameter(s) and phase composition was successfully established. On the other hand, the
modeling results for the β phase are likely affected by the wide range of solid solubility.
The calculation for the α2 phases suffers from the deviation from the ideal c/a ratio. As a
result, the conversion from lattice parameter(s) to the average interatomic spacing for β
and α2 phases leads to problems in the determination of the phase compositions.
Even though the modeling of the lattice parameters with respect to
composition only succeeds for the G phase, the results for β and α2 phases can be used to
illustrate the trends in composition changes during the phase transformations, as discussed
in the following section.

98
4.6 Phase transformation studies on as-quenched samples
An extensive discussion on the phase transitions in QH324 based upon the x-ray
patterns taken during the course of the high-temperature x-ray diffraction measurements is
given in this section. In addition, a portion of the QH324 alloy was independently heat
treated according to approximately the same heating and cooling schedule used in the x-ray
measurements in order to understand the x-ray diffraction results on the basis of the final
microstructure. The overall phase transformation path for this alloy is summarized.
4.6.1 Analysis of phase transitions from the x-ray diffraction patterns
A. Details of the analysis
The 55 oC diffraction pattern for the alloy QH324 showed that the β phase
was present, along with small amount of the G, α and α2 phases. No quantitative analysis
was performed, since the intensities of the reflections for the G, α, and α2 phases are
relatively low and only very few reflections are present. Upon heating, little or no
decomposition of the β phase was observed between 55 oC and 587 oC as shown in Figure
4-5 . The β lattice parameter in this temperature range (Figure 4-6) increases slightly at
approximately the same rate as the linear thermal expansion of β-Ti [123].

99
ββββ
αααα2 ααααG ββββ
ββββ
ββββ ββββ ββββ ββββαααα2
55 oC
102 oC
206 oC
358 oC
510 oC
587 oC
Figure 4-5 X-ray diffraction patterns for the alloy QH324 recorded during heating between 55 oC
and 587 oC.

100
3.1900
3.2000
3.2100
3.2200
3.2300
3.2400
3.2500
3.2600
0 200 400 600 800 1000 1200 1400
Temperature ( o C)
Latti
ce p
aram
eter
(a: Ả
)
Figure 4-6 Lattice parameter (a) of the ββββ phase vs. temperature during heating of the QH324 alloy.
The positions of the (011) reflection were used to calculate the lattice parameter. An estimated lattice
parameter based on linear thermal expansion using the coefficient of 1.20x10⁻⁵ oC-1 [123] was also fit to
the data and is shown as a straight line.
Decomposition of the β phase to the α2 and G phases is suspected to
proceed in two steps. Phase separation first occurs as single β phase transforms to β1 (Ru-
rich) and β2 (Ru-lean) regions. This is suggested from the modeling of the β-phase lattice
parameter with respect to alloy composition. Even though the model did not show the best
fit to the experimental data, it is clear that the mean Ru content in the β phase decreases
upon heating from 625 oC to 683 oC during the course of the β decomposition. This also
suggests that the depletion of Ru (Table 4-5) is the key to de-stabilizing the as-quenched β
phase upon heating. The β1 (011) reflection is on the left-side of the β reflection position

101
at a lower 2θ and the β2 (011) reflection is on the right-side at a greater 2θ in the XRD
pattern recorded at 683 oC (Figure 4-7).
Significant decomposition of the β phase to the α2 and G phases was
observed between 683 oC and 709 oC. Figure 4-7 shows the x-ray diffraction patterns
taken during the course of this transformation, in which the overall intensities of the β
phase reflections decreased during heating. The patterns show that the β phase
decomposed to form α2 and G phases upon heating in this temperature range. It is
suspected that the decomposition takes place by a eutectoid reaction. Using the time
information given in Table 3-1, the reaction was completed within approximately 40 min
(2400 sec) over the course of x-ray measurements between 625 oC-709 oC. This is similar
to the eutectoid reactions observed in Cu-12.86 wt% Al (Table 4-7), which require 10-100
min (600-6000 sec) to complete, depending on the reaction temperature. The kinetics of
these reactions is slower than those observed in carbon steels (Table 4-7). This may be due
to the fact that the difference in size of the constituent atoms in the Ti-Al-Ru and Cu-Al
systems is relatively small (<15%), whereas the size of the C atom, the key diffusing
species in carbon steels, is approximately half of that of Fe atom. Thus, the rate of the
interstitutional diffusion of C in steels is much greater than that of the substitutional atom
of the constituents in other systems.

102
Table 4-7 List of reaction times for eutectoid reactions observed in various alloy systems
Alloy system Treatment
history Reaction
Temperature (oC)
Homologous Temperature
(T/Tm)
Reaction time (sec)
Ref.
Eutectoid carbon steel Continuous
heating at 0.5 K/sec
α+Fe3C -> γ 1006-1017 0.69 22 [134]
Eutectoid carbon steel
Isothermal transformation after rapidly
cooled from γ-phase field
γ -> α+Fe3C 943 0.64 175 [135]
Cu-12.86 wt% Al Isothermal aging after quenching
β’ -> γ2+(α+γ2) 300 0.29 6000 [136]
Cu-12.86 wt% Al Isothermal aging after quenching
β’ -> γ2+(α+γ2) 480 0.46 600 [136]
Figure 4-7 X-ray diffraction patterns for the alloy QH324 recorded during the ββββ decomposition to αααα2
and G phases between 683 oC and 709 oC.

103
In order to estimate the weight % (amount) of the major phases present (β,
α2 and G), Rietveld analysis [137] of the experimental diffraction patterns was performed.
The Rietveld technique uses a least squares approach to refine a theoretical
profile with respect to the experimental whole pattern profile. Crystallographic
information, e.g., lattice parameter and space group, along with instrumentation parameters
are required to calculate the unit cell mass and volume, and to generate a simulated pattern
for all phases. Examples of theoretical patterns for the β, α2 and G phases are shown in
Figure 4-8. A scale parameter for each phase as shown in Equation 4-7 is then refined with
respect to the experimental pattern. The error in the weight% value is calculated using
Equation 4-8.

104
i i ii n
i i ii 1
S M Vw 100%
S M V=
= ×∑
Equation 4-7
where wi
S
M
V
n
= weight% of phase i
= scale parameter for phase i
= unit cell mass of phase i
= unit cell volume of phase i
= number of phase present
Exp Sim
Exp
A A%Error 100%
A
−= ×
Equation 4-8
where AExp
ASim
= integrated area under experimental pattern
= integrated area under simulated pattern

105
Figure 4-8 Theoretical patterns for the (a) ββββ, (b) αααα2, and (c) G phases.
(a) β phase with a = 3.2545 Å
(b) α2 phase with a = 5.8772 Å c = 4.7476 Å
(c) G phase with a = 12.4317 Å

106
The experimental patterns could not be directly used in the Rietveld
analysis [137], since they contained fragmented peak shapes. Instead, simulated patterns
were constructed as follows: a) the lattice parameters for each phase were determined, b)
diffraction patterns were then calculated using the program CrystalDiffract [138], c) next,
the peak shapes in the calculated pattern were compared with those in the experimental
pattern and adjusted for the best visual fit by changing the pseudo-Voigt function peak
shape parameters, d) and finally, the intensity scale was adjusted to get the best visual fit to
all of the peaks.
Rietveld analysis [137] was performed for those simulated patterns using
the program JADE9 [139] to obtain estimated weight% values. The results of the analyses
as function of temperature are shown in Figure 4-9.

107
0 200 400 600 800 1000 1200 1400-20
0
20
40
60
80
100
120
Wei
ght%
Temperature (oC)
β G α
2
Figure 4-9 Estimated weight% vs. temperature for the major phases (ββββ, αααα2, and G) present during
heating of the alloy QH324
No substantial change on the amount of G phase was observed (Figure 4-9
and Figure 4-10) during while the β decomposition upon heating from 709 oC through
1018 oC as Ru depletion in β phase is suspected (Table 4-5). This, in conjunction with the
slight increase in the amount of the α2 phase (Figure 4-9 and Figure 4-10), suggests that
the formation of the α2 phase as a product of β decomposition. In addition, the progress of
the β decomposition in this temperature range also leads to the deviation of the β and α2
lattice parameters (Figure 4-6, and Figure 4-11 and Figure 4-12, respectively) from the
values calculated by thermal expansion effect solely.

108
Gαααα2
ββββ
αααα2G
αααα2
1220 oC
1170 oC1119 oC
1068 oC
1018 oC
709 oC
917 oC
Figure 4-10 X-ray diffraction patterns for the alloy QH324 recorded during heating between 709 oC
and 1220 oC.
On heating from 1018 oC to 1220 oC, the alloy starts to form single β phase
again (Figure 4-10). α2 and β phases were the two major phases observed at 1220 oC,
while the G phase appeared as a minor phase. Isothermal sections at 1100 oC and 1250 oC
suggest that this alloy should almost reach the β-phase field in this range. However, it was
reported that a shift in β-transus temperature of 172 oC occurred when 1000 ppm of
oxygen (an α-stabilizer) was present in Ti-Al-Nb alloy [71]. It also possible that oxygen
acts as an α2-stabilizer, since the crystal structure of the α and α2 phases are so closely
related. The α2 phase, however, contains greater amount of Al content than α phase. Thus,
the large amount of oxygen (∼9 at% or 90,000 ppm by atom) measured in QH324 at room

109
temperature can cause a significant shift in the β-transus temperature. This would prevent
the material from transforming to the β phase at 1250 oC.
The estimated increase in the weight% of β phase present between 1018 oC
and 1220 oC was used to predict the shift in the β-transus temperature. A linear function
Equation 4-9 was interpolated with R2 = 0.93 from the amount of β phase during the
increase in weight% between 1018 oC and 1220 oC (Figure 4-9). This function was then
used to determine that QH324 reaches the β-phase field at 1729 oC. The QH324 alloy is
expected to transform to the β phase at approximately 1250 oC [27], but 9 at% oxygen
would shift the β-transus temperature by 479 oC.
% 0.14(2) [ ] 142(25)β = −owt T C Equation 4-9
The approximately linear increase in the lattice parameters for the β, α2 and
G phases upon heating from 1018 oC to 1220 oC, as shown in Figure 4-6 and Figure 4-11-
Figure 4-13 suggests that no significant transformation was observed in this temperature
range. This is consistent with little or no significant change in composition of the α2 and G
phases (Table 4-6 and Table 4-4, respectively), while a slight increase in the Ru
composition was observed for the β phase. This suggests that Ru atoms may migrate to the
β phase to stabilize its A2 structure.

110
5.780
5.800
5.820
5.840
5.860
5.880
0 200 400 600 800 1000 1200 1400
Temperature ( o C)
Latti
ce p
aram
eter
(a: Ả
)
Figure 4-11 Lattice parameter (a) of the αααα2 phase vs. temperature during heating of the QH324 alloy.
The positions of the (021) and (002) reflections were used to calculate the lattice parameter. The
straight line shows the change in the lattice parameter based on a linear thermal expansion coefficient
of 1.16x10⁻⁵ oC-1 [131].

111
4.6800
4.7000
4.7200
4.7400
4.7600
4.7800
0 200 400 600 800 1000 1200 1400
Temperature ( o C)
Latti
ce p
aram
eter
(c: Ả
)
Figure 4-12 Lattice parameter (c) of the αααα2 phase vs. temperature during heating of the QH324 alloy.
The positions of the (021) and (002) reflections were used to calculate the lattice parameter. The
straight line shows the change in the lattice parameter based on a linear thermal expansion coefficient
of 1.08x10⁻⁵ oC-1 [131].

112
12.355
12.365
12.375
12.385
12.395
12.405
0 200 400 600 800 1000 1200 1400
Temperature (T: o C)
Latti
ce p
aram
eter
(a: Ả
)
Figure 4-13 Lattice parameter (a) of the G phase vs. temperature during heating of the QH324 alloy.
The positions of the (044) reflection were used to calculate the lattice parameter.
All the major phases (β, α2, and G) present during heating were retained on
cooling (Figure 4-14 and Figure 4-15). No significant changes in the amounts of these
phases were observed during cooling from 1220 oC to 1170 oC, except that the amount of
the β phase decreased considerably. Figure 4-16 shows the plot of the estimated weight%
of the major phases as a function of temperature, calculated from a series of diffraction
patterns recorded during cooling to room temperature. A significant drop in the weight%
of the β phase was coincident with an increase in the weight% of the G phase at
approximately 1170 oC (Figure 4-16). The β phase then became a minor phase along with
the α and the γ phases, while the G phase became a major phase along with α2. The
(Ti,Al)Ru phase was observed on the x-ray patterns recorded from 1068 oC to 36 oC
(Figure 4-15). This situation persisted at room temperature. This indicated that no further

113
significant transition was observed after 1170 oC, consistent with no significant changes in
composition of the G, β, and α2 phases (Table 4-4, Table 4-5, and Table 4-6, respectively).
αααα2
ββββ
G
αααα2
αααα2 G
1220 oC
1170 oC
1119 oC
1068 oC
1018 oC
Figure 4-14 X-ray diffraction patterns for the alloy QH324 recorded during cooling between 1220 oC
and 1018 oC.

114
G
G
αααα ββββ
(Ti,Al)Ru
αααα2
αααα2
G
αααα2αααα2
917 oC815 oC
612 oC409 oC
204 oC36 oC
Figure 4-15 X-ray diffraction patterns for the alloy QH324 recorded during cooling between 917 oC
and 36 oC.

115
0 200 400 600 800 1000 1200 1400
05
101520253035404550556065707580859095
Wei
ght%
Temperature (oC)
β G α
2
Figure 4-16 Estimated weight% vs. temperature for the major phases (ββββ, αααα2, and G) present during
cooling of the alloy QH324
If the β phase orders at high temperatures, its crystal structure changes from
the A2 (“bcc”) structure to one which approaches the primitive cubic B2 (CsCl) structure.
The ordered (or partially ordered) phase thus exhibits supelattice reflections. The most
intense superlattice reflection is β’(001). Unfortunately, the 2θ position of this reflection,
at the x-ray wavelength used, matched that of the Ti5Si3 (020) reflection. The peculiar
peak shape of the Ti5Si3 (020) reflection confirmed that the peak did not arise from the
ordered β structure. The silicide phases formed only along the inner wall of the quartz
capsule, thereby spreading the diffracted beam by approximately 0.05o at this two-theta
range. As a result, the Ti5Si3 (020) reflection appeared as two peaks connected at the
midpoint. Thus, no evidence was available in this study to verify the existence of β-
ordering.

116
A plot of lattice parameter of the cubic compound (Ti,Al)Ru calculated
from the (110) reflection, vs. temperature (Figure 4-17) shows slight changes on the slope
on cooling to 36 oC. This suggests that the (Ti,Al)Ru phase may undergo small
compositional changes by a diffusion process during cooling, but it did not contribute to
any significant phase transformation during cooling.
Figure 4-18 to Figure 4-24 show no discontinuities in the plot of the lattice
parameter as a function of temperature for the α2, G, β, α, and γ phases, respectively. It is
concluded that no transformation occurred in the QH324 alloy during cooling from 1170
oC, consistent with the observation of no discontinuity in the plot of weight% of α2, G, and
β phases as a function of temperature (Figure 4-16). It also indicates that the deviation of
the β and α2 lattice parameters (Figure 4-6, and Figure 4-11 and Figure 4-12, respectively)
from the values calculated from thermal expansion solely was possibly due to the progress
of the β decomposition as suggested by the change in the Al and Ru contents in β and α2
phases (Table 4-5 and Table 4-6, respectively).

117
3.0100
3.0200
3.0300
3.0400
3.0500
3.0600
3.0700
3.0800
0 200 400 600 800 1000 1200
Temperature ( o C)
Latti
ce p
aram
eter
(a: Ả
)
Figure 4-17 Lattice parameter (a) of the (Ti,Al)Ru phase vs. temperature during cooling of the QH324
alloy. The positions of the (021) reflection were used to calculate the lattice parameter.

118
5.760
5.780
5.800
5.820
5.840
5.860
5.880
0 200 400 600 800 1000 1200 1400
Temperature ( o C)
Latti
ce p
aram
eter
(a: Ả
)
Figure 4-18 Lattice parameter (a) of the αααα2 phase vs. temperature during cooling of the QH324 alloy.
The positions of the (021) and (002) reflections were used to calculate the lattice parameter. The
straight line shows the change in the lattice parameter based on a linear thermal expansion coefficient
of 1.16x10⁻⁵ oC-1 [131].

119
4.6600
4.6800
4.7000
4.7200
4.7400
4.7600
0 200 400 600 800 1000 1200 1400
Temperature ( o C)
Latti
ce p
aram
eter
(c: Ả
)
Figure 4-19 Lattice parameter (c) of the αααα2 phase vs. temperature during cooling of the QH324 alloy.
The positions of the (021) and (002) reflections were used to calculate the lattice parameter. The
straight line shows the change in the lattice parameter based on a linear thermal expansion coefficient
of 1.08x10⁻⁵ oC-1 [131].

120
12.200
12.240
12.280
12.320
12.360
12.400
0 200 400 600 800 1000 1200 1400
Temperature ( o C)
Latti
ce p
aram
eter
(a: Ả
)
Figure 4-20 Lattice parameter (a) of the G phase vs. temperature during cooling of the QH324 alloy.
The positions of the (044) reflection were used to calculate the lattice parameter.

121
3.2050
3.2150
3.2250
3.2350
3.2450
3.2550
0 200 400 600 800 1000 1200 1400
Temperature ( o C)
Latti
ce p
aram
eter
(a: Ả
)
Figure 4-21 Lattice parameter (a) of the ββββ phase vs. temperature during cooling of the QH324 alloy.
The positions of the (011) reflection were used to calculate the lattice parameter. The straight line
shows the change in the lattice parameter based on a linear thermal expansion coefficient of 1.20x10⁻⁵
oC-1 [123].

122
3.0300
3.0400
3.0500
3.0600
3.0700
3.0800
0 200 400 600 800 1000 1200 1400
Temperature ( o C)
Latti
ce p
aram
eter
(a: Ả
)
Figure 4-22 Lattice parameter (a) of the αααα phase vs. temperature during cooling of the QH324 alloy.
The positions of the (010) and (012) reflections were used to calculate the lattice parameter. The
straight line shows the change in the lattice parameter based on a linear thermal expansion coefficient
of 1.0x10⁻⁵ oC-1 [123].

123
4.5600
4.5800
4.6000
4.6200
4.6400
4.6600
0 200 400 600 800 1000 1200 1400
Temperature ( o C)
Latti
ce p
aram
eter
(c: Ả
)
Figure 4-23 Lattice parameter (c) of the αααα phase vs. temperature during cooling of the QH324 alloy.
The positions of the (010), (012) reflections were used to calculate the lattice parameter. The straight
line shows the change in the lattice parameter based on a linear thermal expansion coefficient of
9.6x10⁻⁶ oC-1 [123].

124
4.0400
4.0600
4.0800
4.1000
4.1200
0 200 400 600 800 1000 1200 1400
Temperature ( o C)
Latti
ce p
aram
eter
(c: Ả
)
Figure 4-24 Lattice parameter (c) of the γγγγ phase vs. temperature during cooling of the QH324 alloy.
The positions of the (002) reflection were used to calculate the lattice parameter. The straight line
shows the change in the lattice parameter based on a linear thermal expansion coefficient of 1.04x10⁻⁵
oC-1 [126].
Deviation of the calculated lattice parameters from the thermal expansion
curve was possibly due to the effect of inhomogeneity. The presence of six phases through
the cooling cycle in the measurement confirms that the specimen was also under a non-
equilibrium condition developed in the specimen during heating that persisted throughout
the cooling. This suggests that the reaction rate of phase transformation in the QH324
alloy was sluggish.
Coefficients of linear thermal expansion were derived from the
experimental data during cooling as shown in Table 4-8. They are compared with the
value listed in the literature for the relevant phases. The values obtained from the results
are smaller than those in the literature (Table 4-8) for the β and α2 phases. The lattice

125
parameter for α and γ phase are located in the range of the values listed in the literature
(Table 4-8). It is suspected that the deviation of the lattice parameters is possibly due to
the insufficient number of scattering particles and/or inhomogeneity. Further study was
then performed to understand the correlation between the lattice parameters and alloy
composition.
Table 4-8 Comparison of the coefficients of thermal expansion calculated from the experimental
data during cooling and the literature values
This experiment Literature Temperature ( oC)
used Temperature ( oC)
used Phase Lattice
parameter Max. Min.
Coefficient of thermal
expansion ( oC-1)x10-5
Max. Min.
Coefficient of thermal expansion (oC-1)x10-5
Ref.
1050 900 1.38 [140] β a 1068 917 9.81 1070 900 1.20 [123]
a 612 36 1.14 617 37 1.16 [141] α2 c 612 36 0.81 617 37 1.08 [141] 600 0 1.00 [123]
a 612 36 1.26 700 25 1.34 [142] 600 0 0.96 [123]
α c 612 36 1.02
700 25 1.07 [142] 1050 20 1.11 [126]
a N/A N/A N/A 1000 400 1.40 [143] 1050 20 1.04 [126]
γ c 1068 36 1.20
1000 400 1.30 [143]

126
Diffusion in the Ti-Al system provides some basic information for the study
of diffusion in the ternary alloys. For solid solutions, it was found (Table 4-9) that the
diffusion coefficients for Ti and Al are on the order of 10-3 m2/s for α-Ti and 10-4 m2/s for
β phase. Ti and Al diffuse about the same rate in both α and β phases. On the other hand,
Ti diffuses at four orders of magnitude more slowly than Al in the α2 and γ phases (Table
4-9), while the diffusivities of Al in the α2 and γ phases are much faster than both Ti and
Al in the α phase and β phases. This means that the Ti diffusion is the rate determining
step for a transition between intermetallic phases, while Al diffusion is likely the rate
determining step for any transformation concerned α and/or β phases. It is also suspected
that any Ti-Al reaction in the β phase could be sluggish, since the Al diffusivity is the least
in the β phase.

127
Table 4-9 Arrhenius parameters for Ti, Al and Ru diffusion in various phases in the Ti-Al alloy
system
Diffuser Matrix Do (m2/s) Q (eV) T (oC) Tm/T Method Ref.
Ti α-Ti 1.35x10⁻³ 3.14 604-863 2.76-1.93 R* [144]
Ti β-Ti 3.53x10⁻⁴ 3.40 903-1614 1.85-1.03 R* [145]
Ti α2 2.24x10⁻⁵ 2.99 851-1097 1.96-1.52 R* [146]
Ti γ 1.43x10⁻⁶ 2.59 903-1422 1.85-1.17 R* [147]
Al α-Ti 6.60x10⁻³ 3.41 662-863 2.52-1.93 SIMS# [144]
Al β-Ti 1.94x10⁻⁴ 3.36 917-1614 1.82-1.03 SIMS# [148]
Al α2 2.32x10⁻¹ 4.08 903-1043 1.85-1.60 DM++ [146]
Al γ 2.11x10⁻² 3.71 903-1290 1.85-1.30 DM+ [147]
Where R* = Radiotracer serial sectioning
SIMS# = Secondary ion mass spectrometry DM+ = Calculated from the Darken-Manning equation
Diffusion lengths for the major phases (β and α2 phases) are estimated
using the available information from the Ti-Al system because no diffusion information is
available for either the Ti-Ru or Ti-Al-Ru systems. Ru self diffusion (∼10-19 m2/sec for
this temperature range [149]) requires a minimum holding time of 64 years according to
Arrhenius equation (Equation 4-10). Diffusion information for Ru in Al is available, but
the temperature range of interest here exceeds the Al melting point. Thus, Ru diffusion in
Al was not considered.

128
exp( )= −oB
QD D
k T
Equation 4-10
Diffusion lengths for Ti and Al in β-Ti were calculated using a non-
Arrhenius relationship. Al has a lower diffusivity than Ti in the β phase, since diffusion of
Ti and Al in β phase is substitutional through a vacancy mechanism, and Al has a slightly
repulsive force with the vacancy [150]. This makes the diffusivity of Al in this phase
slower in comparison to the diffusivity of Ti. In addition, both Ti and Al diffusion in β-Ti
exhibit a non-Arrhenius temperature dependence (Equation 4-11) [151] where a factor is
added to the Arrhenius (Equation 4-10) to account for a phonon softening effect [151].
The diffusion lengths were calculated using the parameters listed in Table 4-9. The α
parameter is 1335 eV for the self diffusion of Ti in β-Ti [145], and 1266 eV for the
diffusion of Al in β-Ti [148], and the Boltzmann constant (kB) is 8.617x10⁻⁵ eV/K.
2exp( )exp( )= −o
B B
QD D
k T k T
α
Equation 4-11
For the α2 phase, diffusion lengths for Ti and Al were calculated using the
Arrhenius relationship (Equation 4-10) and the parameters listed in Table 4-9 .
At temperature range between 683 oC and 1220 oC, the x-ray diffraction
analysis indicates incomplete decomposition of the β to α2 and β phases at temperatures
between 683 oC and 709 oC, and a tendency for the α2 and β phase to transform back to the
single β phase upon further heating to 1220 oC. A diffusion time was estimated using the

129
sum, the scan and transition times from the previous temperature provided in Table 3-1.
The diffusion lengths resulting from the diffusion time and the cumulative distance upon
heating from 683 oC to 1220 oC are given in Table 4-10-Table 4-13 for the diffusion of Ti
in the β phase, Al in the β phase, Ti in the α2 phase, and Al in the α2 phase, respectively.
Table 4-10 Estimated diffusion lengths for Ti in β phase for diffusion times between 683
oC to 1220 oC, and the cumulative diffusion distances over heating from 683 oC to
various temperatures between 683 oC and 1220 oC
Temperature (oC)
Al diffusivity (m2/sec)
Diffusion time (min)
Diffusion length (µm)
Cumulative diffusion distance (µm)
683 9.69x10⁻¹⁵ 14 0.4 0.4
709 1.19x10⁻¹⁴ 15 0.4 0.8
917 7.90x10⁻¹⁴ 24 1.4 2.2
1018 2.05x10⁻¹³ 21 2.1 4.2
1068 3.26x10⁻¹³ 9 1.7 6.0
1119 5.14x10⁻¹³ 11 2.4 8.3
1170 8.01x10⁻¹³ 10 2.8 11.2
1220 1.23x10⁻¹² 16 4.4 15.6

130
Table 4-11 Estimated diffusion lengths for Al in β phase for diffusion times between 683
oC to 1220 oC, and the cumulative diffusion distances over heating from 683 oC to
various temperatures between 683 oC and 1220 oC
Temperature (oC)
Ti diffusivity (m2/sec)
Diffusion time (min)
Diffusion length (µm)
Cumulative diffusion distance (µm)
683 3.60x10⁻¹⁵ 14 0.2 0.2
709 4.57x10⁻¹⁵ 15 0.3 0.5
917 3.64x10⁻¹⁴ 24 0.9 1.4
1018 9.97x10⁻¹⁴ 21 1.4 2.9
1068 1.62x10⁻¹³ 9 1.2 4.1
1119 2.61x10⁻¹³ 11 1.7 5.8
1170 4.13x10⁻¹³ 10 2.0 7.8
1220 6.45x10⁻¹³ 16 3.2 11.0

131
Table 4-12 Estimated diffusion lengths for Ti in α2 phase for diffusion times between
683 oC to 1220 oC, and the cumulative diffusion distances over heating from 683 oC to
various temperatures between 683 oC and 1220 oC
Temperature (oC)
Al diffusivity (m2/sec)
Diffusion time (min)
Diffusion length (µm)
Cumulative diffusion distance (µm)
683 3.90x10⁻²¹ 14 2.3x10⁻⁴ 2.3x10⁻⁴
709 1.01x10⁻²⁰ 15 3.9x10⁻⁴ 6.2x10⁻⁴
917 4.81x10⁻¹⁸ 24 1.1x10⁻² 1.1x10⁻²
1018 4.75x10⁻¹⁷ 21 3.2x10⁻² 4.3x10⁻²
1068 1.31x10⁻¹⁶ 9 3.4x10⁻² 7.7x10⁻²
1119 3.36x10⁻¹⁶ 11 6.1x10⁻² 1.4x10⁻²
1170 8.05x10⁻¹⁶ 10 9.0x10⁻² 2.3x10⁻²
1220 1.82x10⁻¹⁵ 16 1.7x10⁻² 4.0x10⁻²

132
Table 4-13 Estimated diffusion lengths for Al in α2 phase for diffusion times between
683 oC to 1220 oC, and the cumulative diffusion distances over heating from 683 oC to
various temperatures between 683 oC and 1220 oC
Temperature (oC)
Ti diffusivity (m2/sec)
Diffusion time (min)
Diffusion length (µm)
Cumulative diffusion distance (µm)
683 7.27x10⁻²³ 14 3.2x10-05 3.2x10-05
709 2.67x10⁻²² 15 6.3x10-05 9.5x10-05
917 1.20x10⁻¹⁸ 24 5.4x10-03 5.5x10-03
1018 2.73x10⁻¹⁷ 21 2.4x10-02 2.9x10-02
1068 1.09x10⁻¹⁶ 9 3.1x10-02 6.1x10-02
1119 3.94x10⁻¹⁶ 11 6.6x10-02 1.3x10-01
1170 1.30x10⁻¹⁵ 10 1.1x10-01 2.4x10-01
1220 3.95x10⁻¹⁵ 16 2.5x10-01 4.9x10-01
The incomplete decomposition of the β phase between 683 oC and 709 oC
was studied using the cumulative diffusion distances at 709 oC. Diffusion in the β phase is
considered, since the migration of constituents throughout the 45-µm particles is required
in order for the particles to completely decompose to α2 and G phase. However, the
diffusion distance of Ti and Al in β-Ti shows that Ti and Al are able to diffuse only over a
range of 0.5-0.8 µm. This is a significantly different from the required distance. Thus, the
limited migration of at least Ti and Al prevented complete β decomposition.

133
The diffusion problem concerned the transformation of α2 and G phases to
β phase as further heating toward 1220 oC was studied using the diffusion information in
the temperature range of 683 oC to 1220 oC. The diffusion of constituents within α2 and G
phases is required to facilitate the transformation. However, the cumulative diffusion
distance within α2 phase after it was formed is very small (4x10⁻² µm-4.9x10⁻¹ µm) when
compared with the required 27-µm diffusion distance estimated using the weight% (60%)
of the α2 phase in the 45-µm particle heated to 1220 oC. Thus, slow diffusion in α2 phase
is considered as one of the possible restriction even though the diffusion in G phase is not
studied. This also provides a suggestion to the observation of fragmented peak shape of
the α2 phase. Thus, diffusion of constituents in α2 and possible G phase plays a part to
restrict the formation of single β phase along with the oxygen effect on the stability of the
α2 phase.
The reaction rates which took place in the QH324 alloy were sluggish.
While there is no diffusion information available for Ru in Ti or in the Ti-Al-Ru system, a
diffusion study in Ni-Re-Ru alloys at 1000 oC and 1100 oC suggested relatively slow
diffusion of Ru [152]. Characterization on diffusion couples of Ni/Ni-13.4 at% Ru and Ni-
13.4 at% Ru/Ni- 13.4 at% Ru-24.6 at% Re indicates the presence of 24.6 at% Re slightly
reduces the Ru diffusion by a factor of ∼1.5 and ∼2.0 at 1000 oC and 1100 oC, respectively.
The interdiffusion coefficient of Ru was reported in order of 10-17-10-16 m2/sec. Thus, it
was suspected that the slow diffusion of Ru may also cause the inhomogeneity and
sluggish reaction in Ti-Al-Ru alloy.

134
B. Microstructure of the QH324 alloy subjected to step-wise heating and cooling
A small portion of the QH324 alloy was heated and cooled according to the
same schedule as that for the specimen used in the high-temperature x-ray measurements,
to develop the room temperature microstructure. Two metallographic sections were
prepared perpendicular to one another, as shown in Figure 4-25. This provides the
evidence to suggest that the previous reverse transformation of α2 and G to β phases take
place along the α2/G interface. Then, the transformation from β to α2 and G phases takes
place during cooling between 1220-1170 oC led to the formation of the small α2 phase
nearby the α2/G interface. A series of schematic drawings is summarized this proposed
development of the microstructure as a result of the step-wise simulated heating and
cooling as shown in Figure 4-26.

135
Figure 4-25 Microstructure of the as-simulated treatment of QH324: αααα2 and G phases. Two
metallographic sections were recorded perpendicular to one another (xy plane and xz plane). Etchant:
1 vol%HF-10 vol%HNO 3 in water

136
Figure 4-26 Series of schematic drawings summarizing the proposed development of microstructure
according to the interpretation of high-temperature XRD and step-wise simulated heating and
cooling.
The plate-like white particles are the α2 phase and the dark matrix is the G
phase. This microstructure was used to speculate on the origin of the microstructure using
the information from high-temperature diffraction. From the x-ray diffraction data, the β
phase decomposes to form α2 and G phases at the temperature range between 683 oC and
709 oC during heating (Figure 4-7). In addition, small α2 particles were observed next to
the interface between the plate-like α2 phase and G phase matrix. It is suspected that these
small α2-phase particles formed during cooling from the peak temperature (1220 oC). It is
also suspected that the β phase reforms along the interface between the plate-like α2 phase
T=1220-1170 oC: Transformation: ββββ →→→→ αααα2 + G
G
αααα2
T = 683 oC: Transformation: ββββ →→→→ αααα2 + G αααα2
G
ββββ
T = 1018-1220 oC: Reverse transformation: αααα2 + G →→→→ ββββ
G
αααα2
ββββ

137
and the G phase matrix during heating to 1220 oC where the amount of β phase increases
the sample (Figure 4-9). The formation of the small α2 particles was likely due to the β
decomposition during cooling from 1220 oC, similar to the β decomposition on heating
between 683 oC and 709 oC.
A proposed development of the microstructure is provided according to the
interpretation of the x-ray diffraction and the microstructure analysis from the simulated
step-wise heat treatment. The transformation begins at approximately 683 oC where the as-
quenched β phase transforms to α2 and β phases. The G phase is transformed from the β1
(Ru-rich) phase as a result of phase separation, and appears as the matrix of the
microstructure observed after the step-wise heating and cooling cycles. In addition, the α2
phase is transformed from the β2 (Ru-lean) phase as a result of the phase separation, and
present as the plate-like particle. When the alloy was heated to the temperature range of
1018 oC-1220 oC, the analysis on phase fraction of the relevant phases (Figure 4-9) shows
that the fractions of α2 and G phases decrease with respect to that of β phase. This can be
related to the microstructural development as the reverse transformation from α2 and G
phase to β phase is in progress during that temperature range. When the alloy was cooled
from 1220 oC, another reaction concerned the β to α2 and G phases is resumed as the
significant drop of the β phase fraction with respect to the α2 and G phase fractions (Figure
4-16). This can be related to the formation of the small α2 particles observed next to the
plate-like particles (Figure 4-27).

138
Figure 4-27 Microstructure of the as-simulated treatment of QH324: αααα2 and G phases.
Metallographic section was recorded perpendicular xy plane as indicated in Figure 4-25. Etchant: 1
vol%HF-10 vol%HNO 3 in water
The orientation relationship between the as-quenched β phase and plate-like
α2 phase was studied. The α2/G microstructure, the product of the β decomposition, was
characterized, since it provides a suggestion as to how the α2 phase is oriented with respect
to its parent β phase. The α2/G microstructure on the XZ plane (Figure 4-25) was used,
since it shows various orientations among the α2 plates. The six orientations between pairs
of them, as shown in Figure 4-28 are listed in Table 4-14. The sixth orientation, which is
not identified in Figure 4-28, is along the axes approximately perpendicular to the
20 µµµµm

139
metallurgical section. It appears that the β-α2 orientation relationship is close to
2(110) //(0001)β α and
2[111] //[1120]
− −
β α , similar to the Burger relationship for the β and α
phases [49]. This relationship produces the orientation among the α2 plates as 60 o, 90 o,
and 120 o. They may be also oriented parallel (180 o) with respect to one another, if
growing in same direction. The difference between the observed and expected values is
dependent on how the metallurgical section was prepared. Thus, this suggests that the
specimen was sectioned on a plane that was off from the proposed orientation relationship.
The accurate orientation relationship may be further characterized by preparing an electron
transparent slice from the α2 plates oriented in various directions, and then characterizing
them using electron diffraction.
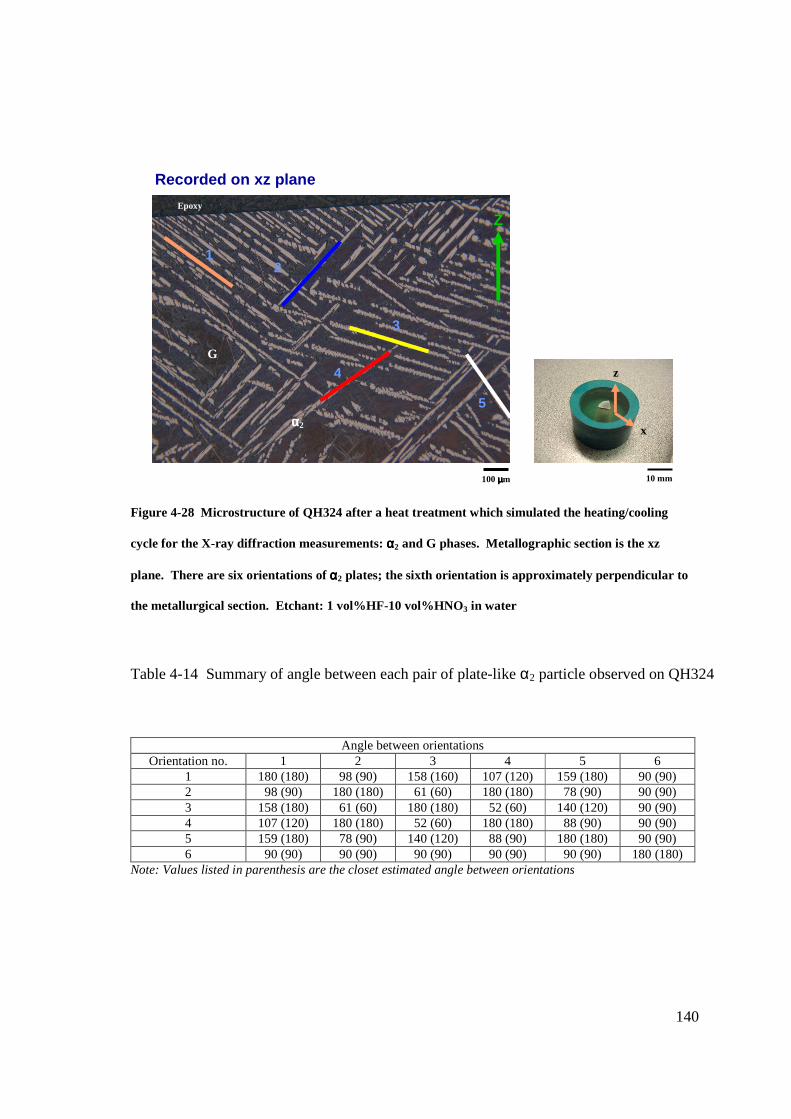
140
Figure 4-28 Microstructure of QH324 after a heat treatment which simulated the heating/cooling
cycle for the X-ray diffraction measurements: αααα2 and G phases. Metallographic section is the xz
plane. There are six orientations of αααα2 plates; the sixth orientation is approximately perpendicular to
the metallurgical section. Etchant: 1 vol%HF-10 vol%HNO 3 in water
Table 4-14 Summary of angle between each pair of plate-like α2 particle observed on QH324
Angle between orientations Orientation no. 1 2 3 4 5 6
1 180 (180) 98 (90) 158 (160) 107 (120) 159 (180) 90 (90) 2 98 (90) 180 (180) 61 (60) 180 (180) 78 (90) 90 (90) 3 158 (180) 61 (60) 180 (180) 52 (60) 140 (120) 90 (90) 4 107 (120) 180 (180) 52 (60) 180 (180) 88 (90) 90 (90) 5 159 (180) 78 (90) 140 (120) 88 (90) 180 (180) 90 (90) 6 90 (90) 90 (90) 90 (90) 90 (90) 90 (90) 180 (180)
Note: Values listed in parenthesis are the closet estimated angle between orientations
140
Recorded o n xz plane
x
z
10 mm
Epoxy
Z
100 µµµµm
1 2
3
4
5 αααα2
G

141
4.6.2 Summary on the phase transformations
Metastable β phase in the QH324 alloy was retained to room temperature using an
ice-water quench. X-ray diffraction analysis showed that the as-quenched QH324 alloy
contained the G phase and barely detectable amounts of the α and α2 phases. A high-
temperature x-ray diffraction study was performed during the average heating and cooling
rates of 5.3 oC/min and 4.8 oC/min, respectively.
After heating, most of the β phase in the QH324 alloy decomposes to form the α2
and G phases between 687 oC-709 oC. The reaction proceeds in two steps including β-
phase separation to β1 (Ru-rich) and β2 (Ru-lean) phases. Then, eutectoid reaction took
place to produce G (possibly from β1 phase) and α2 (possibly from β2 phase) phases.
However, some β phase remained untransformed. It was suspected that the insufficient
diffusion caused the incomplete β decomposition. Additional gradual decomposition of
the β phase was observed upon further heating. The γ phase formed at approximately 917
oC. The amount of the β phase increased when heating between 1018 oC and 1220 oC.
However, incomplete formation of the β phase was observed due to the two possible
reasons: the insufficient diffusion rate is suspected for the α2 and G phases, and the
presence of the great content of oxygen increases on the stability of the α2 phase. β-
Ordering was unable to be characterized due to the overlapping between the β’(001), the
most intense superlattice for β’ phase, and the Ti5Si3 (020) reflections.
During cooling from 1220 oC to room temperature, very little transformation was
observed. Fragmentation of the α2 phase reflections indicated compositional
inhomogeneity, and was attributed to the short times for diffusion. The G phase reflections

142
exhibited very little fragmentation. This suggests that it was less affected by diffusion.
Alternatively, the fragmentation may also introduce from the particle statistics problem due
to insufficient number of scatterers for each phase.
Mathematical expressions for the relationship between the lattice parameter of the
G, β, and α2 phases and its composition were developed. It was suspected that the
presence of Ru affects the stability of β phase. Depletion of Ru was observed during the β
decomposition between 683 oC-709 oC and during cooling from 1220 oC to 1170 oC.
Additionally, the Ru content of the G phase was changed only slightly during the course of
the experiment. This suggests that the G phase does not undergo significant
transformation after it was formed. Relatively small amount of (Ti,Al)Ru phase was
observed on the x-ray patterns recorded from 1068 oC down to 36 oC.
The reaction rates which took place in the QH324 alloy were sluggish. While there
is no diffusion information available for Ru in Ti or in the Ti-Al-Ru system, it was
suspected that the slow diffusion of Ru may also cause the inhomogeneity and sluggish
reaction in this alloy.
4.6.3 New information for industrial applications
Two results from this study are considered important for further development of the
Ti-Al-Ru alloys for industrial applications. First, the decomposition of the as-quenched β
phase between 683 oC and 709 oC suggests that the mechanical processing of single β
phase alloys with compositions close to that of QH324 alloy should be done below about
680 oC. Second, a large amount of the brittle G phase was also observed in the QH324
alloy as a stable phase along with the α2 phase throughout the step-wise heating and

143
cooling. Thus, any mechanical process performed above 680 oC is subject to severe
embrittlement. Khataee et al. [13] suggested that the reduction of the Ru content can
decrease the amount of G phase in a Ti-Al-Ru alloy containing 37 at% Al. Additionally,
the amount of G phase can be reduced in Ti-Al alloy containing 4 at% Ru by decreasing
the Al content [153].

Chapter 5 Summary
This chapter provides a summary on the information evaluated from the
experimental results with respect to the objectives of this study. Additional information
observed during the experimentation is also given.
1. During step-wise heating at an average heating rate of 5.3 oC/min, the
Ti-32.4 at% Al-4.1 at% Ru alloy retained its as-quenched microstructure up to ∼580 oC.
Decomposition of the β phase to form the α2 and G phases began at ∼625 oC. Trace
amounts of the γ phase were observed at ∼917 oC. The β phase tends to reform on heating
from 1018 oC to 1220 oC. No significant phase changes were observed during subsequent
cooling to room temperature at an average rate of 4.8 oC/min. The (Ti,Al)Ru phase was
formed in small amounts at ∼1068 oC.
2. A portion of the alloy which was subjected to a heating and cooling
cycle which simulated that of the X-ray diffraction measurements exhibits a microstructure
that contains the plate-like α2 phase and the G-phase matrix. The X-ray diffraction data
show that the β phase decomposes to form the α2 and G phases between 683 oC and 709 oC
possibly due to a eutectoid reaction during heating. It is suspected that the β
decomposition proceed with phase separation to Ru-rich and Ru-lean β phases. Then, the
significant β transformation is operated by eutectoid reaction. In addition, small α2
particles were observed next to the interface between the plate-like α2 phase and the G
phase matrix. The formation of the small α2 particles was likely due to the β

145
decomposition during cooling from 1220 oC, similar to the β decomposition on heating
between 683 oC and 709 oC.
3. Decomposition of the as-quenched β phase between 683 oC and 709 oC
suggests that the deformation processing of single β phase alloys with compositions close
to the Ti-32.4 at% Al-4.1 at% Ru alloy should be done below about 680 oC. The brittle G
phase was observed in the Ti-32.4 at% Al-4.1 at% Ru alloy as a stable phase along with
the α2 through the step-wise heating and cooling. Thus, any thermal processing above 680
oC should be avoided.
4. Decomposition of the as-quenched β phase occurred under non-
equilibrium conditions. A total of six phases occurred in the material as identified from
the diffraction patterns. It was suspected that this was due to the compositional
inhomogeneity which developed during thermal cycling as a result of insufficient
diffusion. In addition, the presence of a large amount of oxygen in the sample also caused
a change in the phase relations in the alloy.
5. The existence of β ordering in the Ti-Al-Ru system could not be verified
or negated due to the formation of a Ti5Si3 phase as a result of specimen/quartz interaction.
The (002) reflection of the Ti5Si3 phase was located at nearly the same two-theta value as
that for the possible β’ (100) superlattice reflection, the most intense superlattice reflection.
In addition, the presence of Ti5Si3 on the cavity wall of the capillary made the Ti5Si3 (002)
reflection appear as two peaks, which further prevented identification of the β’ (100)
reflection. A proposed solution for this problem is discussed in the suggested future work.

146
6. Any calculation, e.g., lattice parameters, thermal expansion, using peak
position yielded an error. The possible particle statistics problem due to insufficient
number of scatterers and/or inhomogeneity which developed within the sample, caused the
peak shapes of the relevant phases to become asymmetric and fragmented. This gave rise
to errors in the determination of peak positions; peak positions frequently had to be
determined visually.
7. Contaminating phases were grouped into three categories. First,
diamond from the diamond file used for powder preparation. Second, the quartz capillary
contributed to the diffuse scattering at low 2θ angles and some crystalline scattering.
Third, the specimen/quartz reaction led to the formation of various titanium silicide phases,
i.e., Ti5Si3, Ti5Si4, and TiSi.
8. Titanium silicide phases were observed to form at approximately 917 oC.
The Ti5Si3 phase probably formed first as it requires less Si. The Ti5Si4 and TiSi phases
were then formed. The reaction appeared to take place along the interior cavity wall of the
capillary.

Chapter 6 Suggested Future Work
It is recommended that the future work in this study should be a study of the nature
of the decomposition of the as-quenched β phase observed in the 600-800 oC temperature
range, and also use of a more suitable characterization technique to verify the existence of
β-ordering without the interference from any environmental contamination. It is suggested
to continue using scattering experiments since these techniques allow in-situ
characterization of the phase transformations.
6.1 Decomposition rate of as-quenched ββββ phase
X-ray diffraction experiments can continue conduct on the homogenized and
quenched Ti-32.4 at% Al-4.1 at% Ru should be continued, in which the two experimental
parameters, transformation temperature and heating rate, should be further studied. A
typical heating rate will be first determined so that the experimental results can be later
interpreted with respect to industrial applications. Heating rates used in industry will be
used to heat samples to various temperatures of interest between 600-800 oC. Then,
synchrotron x-ray diffraction data can be recorded every few seconds until the β phase
completely transforms to α2 and G phases. An area detector with a very high acquisition
rate should be used.
The expected outcome of this study is an understanding of the transformation at
selected industrial heating rates. This will provide basic information for the industrial heat
treatment parameters, i.e., heating rate, treatment temperature, and holding time.

148
6.2 Phase transformation studies on as-quenched samples
High-temperature neutron diffraction is considered to be a suitable characterization
technique to accomplish the goals of the future study as explained below.
1. The low intensity profile problem for superlattice reflections is resolved
by a neutron scattering experiment. For a B2 phase, the intensities of the fundamental
reflections are proportional to the sum of the scattering powers of the constituent atoms,
while the intensities of the superlattice reflections are proportional to the difference of the
atomic scattering power of the constituent atoms. The intensities for superlattice
reflections of the β’ phase in Ti-Al-Ru, if it exists, are low for X-ray scattering. On the
other hand, the atomic scattering power for neutrons is generated from the interaction of
neutrons with the atomic nuclei. Thus, the scattering power varies from isotope to isotope
of the atom, and is not linearly dependent on atomic number. Moreover, a neutron
spallation source allows the switching of element isotopes to tune up the scattering power
of a reflection. The diffracted intensity for superlattice reflection of the β’ phase can be
maximized.
2. Neutron scattering on larger, bulk samples eliminates the surface
contamination problem. The possibility for surface contamination is reduced when the
scattering is performed on bulk instead of powdered samples, since the surface to volume
ratio is decreased. In addition, neutron scattering with a spallation source allows a
selective measurement on the interaction volume at a desired depth from specimen’s
surface. As a result, the mass of alloy underneath the specimen surface, which is free from
interaction with the environment, is used to scatter neutrons. The interaction of the

149
specimen with a quartz container, and/or oxygen residuals would not seriously interfere the
diffraction measurements even at high temperatures.
Therefore, neutron scattering is suggested as a future characterization technique to
study β ordering in Ti-Al-Ru alloys.

REFERENCES
1. Boyer, R.R., An overview on the use of titanium in the aerospace industry. Materials Science and Engineering, 1996. 213A: p. 103-114.
2. Donachie, M.J., Titanium: A technical guide. 2000, Materials Park, Ohio: ASM International.
3. Khataee, A., Flower, H.M., and West, D.R.F., New Titanium-Aluminum-X alloys for aerospace applications. Journal of Materials Engineering, 1988. 10: p. 37-44.
4. Ankem, S., and Greene, C.A., Recent developments in microstructure/property relationships of beta titanium alloys. Materials Science and Engineering A, 1999. 263: p. 127-131.
5. Bania, P.J., Beta titanium alloys and their role in the titanium industry. JOM, 1994: p. 16-19.
6. Lingen, E.v.d., and Sandenbergh, R.F., The cathodic modification behavior of ruthenium additions to titanium in hydrochloric acid. Corrosion Science, 2001. 43: p. 577-590.
7. Lutjering, G., and Williams, J.C., Titanium 2nd edition. Engineering Materials and Processes, ed. B. Derby. 2007, New York: Springer.
8. Leyens, C., and Peters, M., Titanium and Titanium Alloys (Fundamentals and Applications). 2003, Wein Heim: WILEY-VCH Verlag GmbH & Co.
9. Molchanova, E.K., Phase Diagrams of Titanium Alloys Israel Program for Scientific Translations. 1965, Jerusalem.
10. Zwicker, U., Titan und Titanlegierungen. 1974: Springer-Verlag. 11. Collings, E.W., The Physical Metallurgy of Titanium Alloys. ASM Series in Metal
Processing, ed. H.L. Gegel. 1984, Metals Park, OH: American Society for Metals. 12. Wood, R.A., Titanium Alloys Handbook. Metals and Ceramics Information Center.
1972, Battelle, OH. 13. Khataee, A., Flower, H.M., and West, D.R.F., The alloying of titanium aluminides
with ruthenium. Platinum Metals Review, 1989. 33: p. 106-113. 14. Weiss, I., and Semiatin, S.L., Thermomechanical processing of beta titanium
alloys-an overview. Materials Science and Engineering A, 1998. 243: p. 46-65. 15. Eylon, D., Vassel, A., Combres, Y., Boyer, R.R., Bania, P.J., Schutz, R.W., Issues
in the development of beta titanium alloys. JOM, 1994: p. 14-15. 16. Flower, H.M., and Christodoulou, J., Phase equilibria and transformations in
titanium aluminides. Materials Science and Technology, 1999. 15(1): p. 45-52. 17. Lipsitt, H.A. Titanium aluminide-an overview. in Materials Research Society
Symposia Proceedings. 1985. Boston, MA: Materials Research Society. 18. Kim, S., and Smith, G.D.W., AP-FIM investigation on gamma-based titanium
aluminides. Materials Science and Engineering A, 1997. 239-240: p. 229-234. 19. Kim, S., Nguyen-Manh, D., Smith, G.D.W., Pettifor, D.G., Site preference of Ru
and Pd additions to gamma-based TiAl intermetallics. Philosophical Magazine A, 2000. 80(11): p. 2489-2508.
20. Liu, Q., and Nash, P., The effect of ruthenium addition on the microstructure and mechanical properties of TiAl alloys. Intermetallics, 2011. 19: p. 1282-1290.

151
21. Tomashov, N.D., Altovsky, R.M., and Chernova, G.P., Passivity and corrosion resistance of titanium and its alloys. Journal of Electrochemical Society, 1961. 108: p. 113-119.
22. Linger, E.V.D., and Steyn, H.D.V. The potential of ruthenium as an alloying element in titanium. in Proceedings of the 1994 International Conference on Titanium Products and Applications. 1994.
23. Sedriks, A.J., Corrosion resistance of titanium-ruthenium alloys. Corrosion, 1975. 31(2): p. 60-65.
24. Schutz, R., Ruthenium enhanced titanium alloys. Platinum Metals Review, 1996. 40(2): p. 54-61.
25. Grytsiv, A., Rogl, P., Schmidt, H., Influence of 2 at.% ruthenium addition on the oxidation of γ-TiAl at 900o C in air. Oxidation of Metals, 2004. 62(1/2): p. 15-27.
26. Dobromyslov, A.V., and Elkin, V.A., Martensitic transformation and metastable β-phase in binary titanium alloys with d-metals of 4-6 periods. Scripta Materialia, 2001. 44: p. 905-910.
27. Khataee, A., Flower, H.M., and West, D.R.F., Constitution of Ti-Al-Ru system. Materials Science and Technology, 1989. 5: p. 632-643.
28. Khataee, A., Flower, H.M., and West, D.R.F., Solid state phase transformations in Ti-Al-Ru system. Materials Science and Technology, 1989. 5: p. 873-881.
29. Shull, R.D., and Cline, J.P., High-temperature x-ray diffractometry of Ti-Al alloys. High Temperature Science, 1990. 26: p. 95-117.
30. Elmer, J.W., Wong, J., Froba, M., Waide, P.A., Larson, E.M., Analysis of heat-affected zone phase transformations using in situ spatially resolved x-ray diffraction with synchrotron radiation. Metallurgical and Materials Transactions A, 1996. 27(3): p. 775-783.
31. Malinov, S., Sha, W., Guo, Z., Tang, C.C., Long, A.E., Synchrotron x-ray diffraction study of the phase transformation in titanium alloys. Materials Characterization, 2002. 48(4): p. 279-295.
32. Novoselova, T., Malinov, S., Sha, W., and Zhecheva, A., High-temperature synchrotron x-ray diffraction study of phases in a gamma TiAl alloy. Materials Science and Engineering A, 2004. 371: p. 103-112.
33. Elmer, J.W., Palmer, T.A., Babu, S.S., Specht, E.D., In situ observations of lattice expansion and transformation rates of alpha and beta phases in Ti-6Al-4V. Materials Science and Engineering A, 2005. 391(1-2): p. 104-113.
34. Liss, K.-D., Bartels, A., Clemens, H., Bystrzanowski, S., Stark, A., Buslaps, T., Schimansky, F.-P., Gerling, R., Schreyer, A., A study of recrystallization and phase transformations in intermetallic titanium aluminides by in-situ high-energy x-ray diffraction. Materials Science Forum, 2007. 539-543(Pt. 2): p. 1519-1524.
35. Yeoh, L.A., Liss, K.-D., Bartels, A., Chladil, H., Avdeev, M., Clemens, H., Gerling, R., Buslaps, T., In situ high-energy x-ray diffraction and quantitative phase analysis in the alpha+gamma phase field of titanium aluminides. Scripta Materialia, 2007. 57(12): p. 1145-1148.
36. Liss, K.-D., Whitfield, R.E., Zu, W., Buslaps, T., Yeoh, L.A., Wu, X., Zhang, D., Xia, K. , In situ synchrotron high-energy x-ray diffraction analysis on phase

152
transformation in Ti-Al alloys processed by equal-channel angular pressing. Journal of Synchrotron Radiation, 2009. 16(6): p. 825-834.
37. Grytsiv, A., Rogl, P., Schmidt, H., and Giester, G., Constitution of the ternary system Al-Ru-Ti {Aluminum-Ruthenium-Titanium}. Journal of Phase Equilibria, 2003. 24: p. 511-527.
38. Liscic, B., Tensi, H.M., Canale, L.C.F., Totten, G.E., Quenching theory and technology of quenching. 2010, Boca Raton, Fl: CRC Press.
39. McQuilian, M.K., Phase transformations in titanium and its alloys. Metallurgical Reviews, 1963. 8: p. 41-104.
40. Jaffee, R.I., The physical metallurgy of titanium alloys. Progress in Metal Physics, 1958. 7: p. 65-163.
41. Zener, C., Elasticity and Anelasticity of Metals. 1948: University of Chicago Press. 42. Fisher, E.S., Dever, D., Relation of the C' elastic modulus to stability of b.c.c.
transition metals. Acta Metallurgica, 1970. 18: p. 265-269. 43. Fisher, E.S., A review of solute effects on the elastic moduli of beta-titanium and
titanium-chromium alloys. Physics of solid solution strengthening, ed. E.W. Collings, Gegel, H.L. 1975: Plenum Press. 199-225.
44. Hume-Rothery, W., The structure of metals and alloys. 1950, London: Institute of Metals.
45. Hagg, G., Z. Phys. Chem. B., 1929. 6: p. 221. 46. Smallman, R.E., Hume-Rothery, W., Haworth, C.W., The structure of metals and
alloys. 1988, London: The Institute of Metals. 47. Ageev, N.V., Petrova, L.A. The theoretical basis of the development of the high-
strength metastable β-alloys of titanium. in The Science Technology and Application of Titanium. 1970. London.
48. Collings, E.W., Gegel, H.L., A physical basis for solid-solution strengthening and phase stability in alloys of titanium. Scripta Metallurgica, 1973. 7: p. 437-444.
49. Burgers, W.G., Physica, 1934. 1: p. 561. 50. Newkirk, J.B., Geisler, A.H., Acta Metallurgica, 1953: p. 370. 51. Margolin, H., Nielsen, J.P., Titanium metallurgy. Modern Materials, Advances in
Development and Application, ed. H.H. Hausner. Vol. 2. 1960: Academic Press. 52. Banerjee, S., Mukhopadhyay, P., Phase transformations Examples from titanium
and zirconium alloys. 2007, Oxford: Pergamon. 53. Williams, J.C., Precipitation in titanium-base alloys, in Precipitation Processes in
Solids, K.C. Russell, Aaronson, H.I., Editor. 1978, The Metallurgical Society of AIME. p. 191-221.
54. Aaronson, H.I., Triplett, W.B., Andes, G.M., Trans AIME, 1957. 209: p. 1227. 55. Williams, J.C., Polonis, D.H., Taggart, R., Science, Technology and Application of
Titanium. 1971, London: Pergamon Press. 56. Franti, G.W., Aaronson, H.I., Williams, J.C., A survey of eutectoid decomposition
in ten Ti-X systems. Metallurgical Transactions A, 1978. 9: p. 1641-1649. 57. Ahmed, T., and Rack, H.J., Phase transformations during cooling in α + β
titanium alloys. Materials Science and Engineering A, 1998. 243: p. 206-211. 58. Otte, H.M., The Science, Technology ad Application of Titanium. 1970, Oxford:
Pergamon Press.

153
59. Williams, J.C. Critical review: Kinetics and phase transformations. in Titanium Science and Technology. 1973. Massachusetts: Plenum Press.
60. Collings, E.W., Materials Properties Handbook: Titanium Alloys. 1994: ASM Materials Park.
61. Bragg, W.L., and Williams, E.J., Effect of thermal agitation on atomic arrangement in alloys. Proceedings of the Royal Society London, 1934. 145A: p. 699-730.
62. Ohnuma, I., Fujita, Y., Mitsui, H., Ishikawa, K., Kainuma, R., and Ishida, K., Phase equilibria in the Ti-Al binary system. Acta Materialia, 2000. 48: p. 3113-3123.
63. Inden, G., Ordering and segregation reactions in b.c.c. binary alloys. Acta Metallurgica, 1974. 22: p. 945-951.
64. Hickman, B.S., Precipitation of omega phase in titanium-vanadium alloys. Journal of the Institute of Metals, 1968. 96(1968): p. 330-337.
65. Rhodes, C.G., Williams, J.C. Alpha phase precipitation in Ti-Mo-Al alloys. in 5th Spring Meeting of the Metallurgical Society of AIME. 1973. Philadelphia, PA: Metallurgical Society of AIME.
66. Rhodes, C.G., Williams, J.C., The precipitation of a-phase in metastable b-phase Ti alloys. Metallurgical Transactions A, 1975. 6: p. 2103-2114.
67. Plichta, M.R., Williams, J.C., Aaronson, H.I., Metallurgical Transactions a, 1977. 8: p. 1885.
68. McAndrew, J.B., Kessler, H.D., Trans AIME, 1956. 206: p. 1348. 69. Long, M., Rack, H.J., Phase stability during continuous heating/cooling of Ti3Al-
(Nb,V,Mo) titanium aluminide alloys. Materials Science and Technology, 1995. 11: p. 150-158.
70. Sagar, P.K., Effect of alloying elements and microstructure on the processing parameters of α2 aluminide alloys. Materials Science and Engineering A, 2006. 434: p. 259-268.
71. Szaruga, A., Saqib, M., Omlor, R., Lipsitt, H.A., The effect of oxygen on the beta transus temperature of an alpha2-beta titanium aluminide base alloy. Scripta Metallurgica et Materialia, 1992. 26: p. 787-790.
72. Huang, C., Dean, T.A., Loretto, M.H., Interface phase in α2 and B2 boundaries in Ti-25Al-10Nb-3V-1Mo alloy. Materials Science and Technology, 1995. 11(143-149).
73. Tang, F., Emura, S., Hagiwara,, M., Modulated microstructure in Ti-22Al-11Nb-4Mo alloy. Scripta Materialia, 1999. 40: p. 471-476.
74. Long, M., Effect of environmentally promoted surface stabilization of α2 in Ti3Al-alumindes during high temperature evaluation. Materials Science and Engineering A, 1995. 199: p. L7-L9.
75. Yang, K.L., Huang, J.C., Wang, Y.N., Phase transformation in the β phase of super α2 Ti3Al base alloys during static annealing and superplastic deformation at 700-1000 oC. Acta Materialia, 2003. 51: p. 2577-2594.
76. Kimura, M., Hashimoto, K., Morikawa, H., Study on phase stability in Ti-Al-X systems at high temperatures. Materials Science and Engineering A, 1992. 152: p. 54-59.

154
77. Peters, J.A., and Bassi, C., Isothermal transformation in a β-stabilised Ti3Al intermetallics. Scripta Metallurgica et Materialia, 1990. 24: p. 915-920.
78. Schuh, C., and Dunand, D.C., Transformation superplasticity of super α2 titanium aluminide. Acta Materialia, 1998. 46: p. 5663-5675.
79. Fu, H.C., Huang, J.C., Wang, T.D., Bampton, C.C., Evolution of microstructure and superplastic deformation mechanism in super α2 Ti3Al base alloys. Acta Materialia, 1998. 42: p. 465-479.
80. Dimcic, B., Cvijovic, I., Jovanovic, M.T., Bozic, D., Mechanical and fracture behavior of powder metallurgy processed Ti3Al-based alloys. Journal of Materials Science, 2006. 41: p. 4307-4313.
81. Suwas, S., and Ray, R.K., Evolution of texture in the β (B2) phase of a two phase titanium aluminide intermetallic alloy Ti-24Al-11Nb. Metallurgical and Materials Transactions A, 2000. 31: p. 2339-2350.
82. Martin, P.L., Lipsitt, H.A., Nuhfer, N.T., Williams, J.C., The effects of alloying on the microstructure and properties of Ti3Al and TiAl, in Titanium '80, science and technology: proceedings of the Fourth International Conference on Titanium. 1980: Kyoto, Japan. p. 1245-1254.
83. Haddad, J., Zevin, L., Eliezer, D., Phase relation in titanium-aluminide alloy-an X-ray study. Journal of Materials Science, 1994. 29: p. 373-375.
84. Hsiung, L.M., Cai, W., Wadley, H.N.G, Microstructure and phase evolution in rapidly-solidified Ti-24Al-11Nb. Materials Science and Engineering A, 1992. 152: p. 295-303.
85. Aswath, P.B., Goolsby, R.D., Graham, L.W., Microstructural stability and mechanisms of fatigue and creep crack growth in Ti-24Al-11Nb. Journal of Materials Science, 1997. 32: p. 2191-2206.
86. Liauo, C.S., Fu, H.C., Hsiao, I.C., Huang, J.C., On the β-transus and order/disorder transition temperature in superplastic super α2 Ti3Al base alloy. Materials Science and Engineering A, 1999. 271: p. 275-285.
87. Djanarthany, S., Servant, C., Penelle, R., Influence of an increasing content of molybdenum on phase transformations of Ti-Al-Mo aluminides-relation with mechanical properties. Materials Science and Engineering A, 1992. 152: p. 48-53.
88. Demakov, S.L., Stepanov, L.S., Popov, A.A., Phase transformations in an α2 titanium superalloy: I. Effects of the quenching temperature and time at quenching temperature on the phase composition and structure of the alloy. The Physics of Metals and Metallography, 1998. 86: p. 497-502.
89. Ren, X., Hagiwara, M., Displacive precursor phenomena in Ti-22Al-27Nb intermetallic compound prior to diffusional transformation. Acta Materialia, 2001. 49: p. 3971-3980.
90. Peng, J., Li, S., Mao, Y., Sun, X., Phase transformation and microstructures in Ti-Al-Nb-Ta system. Materials Letters, 2002. 53: p. 57-62.
91. Tiancong, J., Bin, W., Dunxu, Z., Huiping, M., Zengyoung, Z., Microstructure and tensile properties of a Ti3Al-Nb-Mo-V alloy. Materials Science and Engineering A, 1992. 152: p. 317-321.

155
92. Hamajima, T., Lutjering, G., Weissmann, S., Importance of slip mode for dispersion-hardened β-titanium alloys. Metallurgical Transactions, 1973. 4: p. 847-856.
93. Flower, H.M., Christodoulou, J., Phase equilibria and transformations in titanium aluminides. Materials Science and Technology, 1999. 15: p. 45-52.
94. Kainuma, R., Ohnuma, I., Ishikawa, K., Ishida, K., Stability of B2 ordered phase in the Ti-rich portion of Ti-Al-Cr and Ti-Al-Fe ternary systems. Intermetallics, 2000. 8: p. 868-875.
95. Gaisin, R., Imayev, V., Imayev, R., Fecht, H.J., A preliminary study on precipitation hardening of Ti-38.5-4Fe and Ti-38.5Al-4Fe-5Nb-0.2B intermetallic alloys via heat treatment. Intermetallics, 2010. 18: p. 2238-2243.
96. Yu, R., He, L.L., Ye, H.Q., Guo, J.T., Lupinc, V., On the orientation relationship between α2 precipitates and the B2 phase in a Ti-47at%Al-2at%W-0.5at%Si alloy. Philosophical Magazine Letters, 2001. 81: p. 71-76.
97. Ramachandran, M., Mantha, D., Williams, C., Reddy, R.G., Oxidation and diffusion in Ti-Al-(Mo, Nb) intermetallics. Metallurgical and Materials Transactions A, 2011. 42: p. 202-210.
98. Strychor, R., Williams, J.C., and Soffa, W.A., Phase transformations and modulated microstructures in Ti-Al-Nb alloys. Metallurgical Transactions A, 1988. 19: p. 225-234.
99. Rhodes, C.G., Order/disorder temperature of the BCC phase in Ti-21Al-26Nb. Scripta Materialia, 1998. 38: p. 681-685.
100. Vasudevan, V.K., Yang, J., Woodfield, A.P., On the β to B2 ordering temperature in a Ti-22Al-26Nb orthorhombic titanium aluminide. Scripta Materialia, 1996. 35: p. 1033-1039.
101. Muraleedharan, K., Gogia, A.K., Nandy, T.K., Banerjee, D., Lele, S., Transformation in a Ti-24Al-15Nb alloy. I. Phase equilibria and microstructure. Metallurgical Transactions A, 1992. 23: p. 401-415.
102. Bendersky, L.A., Boettinger, W.J., Roytburd, A., Coherent precipitates in the b.c.c./orthorhombic two-phase field of the Ti-Al-Nb system. Acta Metallurgica et Materialia, 1991. 39: p. 1959-1969.
103. Banerjee, D., Gogia, A.K., Nandi, T.K., Joshi, V.A., A new ordered orthorhombic phase in a Ti3Al-Nb alloy. Acta Metallurgica, 1988. 36: p. 871-882.
104. Hsiung, L.M., Wadley, H.N.G. Phase evolution and transformation path of B2 -> α2 in rapidly-solidified Ti-24Al-11Nb. in Mechanical properties and phase transformations of multi-phase intermetallic alloys. 1995: The Minerals, Metals and Materials Society.
105. Murray, J.L., Binary Alloy Phase Diagrams. Second Edition ed, ed. T.B. Massalski. Vol. 3. 1990, Materials Park, Ohio: Materials Information Society.
106. Raevskaya, M.V., and Sokolovskaya, E.M., Physical chemistry of ruthenium and its alloys. 1979, Moscow, Russia: Moscow University Press.
107. Strychor, R., Williams, J.C. Phase transformations in Ti-Al-Nb alloys. in Proceedings of an International Conference on Solid to Solid Phase Transformations. 1982. Pittsburgh, PA, USA.

156
108. Grytsiv, A., Rogl, P., Schmidt, H., Giester, G., Hundegger, P., Wiesinger, G., Pomjakushin, V., Formation and crystal chemistry of cubic ternary phase with filled Th6Mn23-type and AuCu3-type in the system Ti-MVIII-Al. Intermetallics, 2004. 12: p. 563-577.
109. Kitchens, R. Reynolds wrap foil. [cited 2011 June 29, 2011]; Available from: http://www.reynoldspkg.com/reynoldskitchens/en/faq_detail.asp?info_page_id=743&prod_id=1789&cat_id=1337.
110. Margulies, L., Kramer, M.J., McCallum, R.W., Kycia, S., Haeffner, D.R., Lang, J.C., and Goldman, A.I., New high temperature furnace for structure refinement by powder diffraction in controlled atmosphere using synchrotron radiation. Review of Scientific Instruments, 1999. 70: p. 3554-3561.
111. Touloukian, Y.S., Kirby, R.K., Taylor, R.E., and Lee, T.Y.R., Thermal Expansion-Nonmetallic Solids. Thermophysical Properties of Matter. Vol. 13. 1977, New York, New York: Plenum Publishing.
112. Holland, T.J.B., and Redfern, S.A.T, Unit cell refinement from powder diffraction data: the use of regression diagnostics. Mineralogical Magazine, 1997. 61: p. 65-77.
113. Cullity, B.D., Elements of X-Ray Diffraction 2nd ed. 1978, Reading, Massachusetts: Addison-Wesley Publishing Company, Inc.
114. McCusker, L.B., Von Dreele, R.B., Cox, D.E., Louer, D., and Scardi, P., Rietveld refinement guidelines. Journal of Applied Crystallography, 1999. 32: p. 36-50.
115. Roisnel, T., and Rodriguez-Carvajal, J. WinPLOTR: a Windows tool for powder diffraction patterns analysis Materials Science Forum. in Proceedings of the Seventh European Powder Diffraction Conference (EPDIC 7). 2000.
116. Smith, D.K., Particle statistics and whole-pattern methods in quantitative x-ray powder analysis. Powder Diffraction, 2001. 16: p. 186-191.
117. Faber, J.a.F., T., The Powder Diffraction File: present and future. Acta Crystallographica B, 2002. 58: p. 325-332.
118. Moreen, H.A., Taggart, R., Polonis, D.H., A model for the prediction of lattice parameters of solid solutions. Metallurgical Transactions, 1971. 2: p. 265-268.
119. Jones, H., On the prediction of lattice parameter vs. concentration for solid solutions extended by rapid quenching from melt. Scripta Metallurgica, 1983. 17: p. 97-100.
120. Hartley, C.S., Single crystal elastic moduli of disordered cubic alloys. Acta Materialia, 2003. 51: p. 1373-1391.
121. Davies, C.K.L., Nash, P., Stevens, R.N., Precipitation in Ni-Co-Al alloys Part I continuous precipitation. Journal of Materials Science, 1980. 15: p. 1521-1532.
122. Pearson, W.B., The crystal chemistry and physics of metals and alloys. 1972, New York: John Wiley and Sons, Inc.
123. Spreadborough, J., Christian, J.W., The measurement of the lattice expansions and Debye temperatures of titanium and silver by x-ray methods. Proceedings of the Physical Society of London, 1959. 74: p. 609-615.
124. Wilson, A.J.C., The thermal expansion of aluminum: Further experiments. Proceedings of the Physical Society of London, 1942. 54: p. 487-491.

157
125. Owen, E.A., Roberts, E.W., The crystal parameters of osmium and ruthenium at different temperatures. Zeitschrift Fur Kristallographie, 1937. 96: p. 497-498.
126. He, Y., Schwarz, R.B., Darling, T., Hundley, M., Whang, S.H., and Wang, Z.M., Elastic constants and thermal expansion of single crystal γ-TiAl from 300 to 750 K. Materials Science and Engineering A, 1997. 239-240: p. 157-163.
127. Taylor, R.E., Thermal expansion of solids. CINDAS Data Series on Material Properties Volume I-4, ed. C.Y. Ho. 1998, Materials Park, OH: ASM International.
128. Tryon, B., Pollock, T.M., Gigliotti, M.F.X., Hemker, K., Thermal expansion behavior of ruthenium aluminides. Scripta Materialia, 2004. 50: p. 845-848.
129. Levinger, B.W., Lattice parameter of beta titanium at room temperature. Transactions of the American Institute of Mining and Metallurgical Engineers, 1953. 162: p. 195.
130. Penaloza, V.A., and Houska, C.R., Refinements on the x-ray intensities from Ti3-
2Al. An. Congr. Nac. Metal., 1983: p. A55. 131. Gehlen, P.C., The lattice parameters of ordered Ti3Al between 100 and 989 K.
Metallurgical Transactions, 1971. 2: p. 1249-1251. 132. Raub, E., and Roschel, E., Die Legierungen des Rutheniums mit Titan und
Zirkonium. Zeitschrift Fur Metallkunde, 1963. 54: p. 455-462. 133. Fleischer, R., Substitutional solutes in AlRu-I. Effects of solute on moduli, lattice
parameters and vacancy production. Intermetallics, 1993. 13: p. 5-21. 134. Caballero, F.G., Capdevila, C., Andres, C.G.D., Influence of scale parameters of
pearlite on the kinetics of anisothermal pearlite-to-austenite transformation in a eutectoid steel. Scripta Materialia, 2000. 42: p. 1159-1165.
135. Offerman, S.E., Wilderen, L.J.G.W. van, Dijk, N.H. van, Sietsma, J., Rekveldt, M.Th., Zwang, S. van der, In-situ study of pearlite nucleation and growth during isothermal austenite decomposition in nearly eutectoid steel. Acta Materialia, 2003. 51: p. 3927-3938.
136. Arruda, G.J., Adorno, A.T., Magnani, R., Beatrice, C.R.S., Kinetics of eutectoid decomposition in Cu-Al and Cu-Al-Ag alloys. Materials Letters, 1997. 32: p. 79-84.
137. Rietveld, H.M., A profile refinement method for nuclear and magnetic structures. Journal of Applied Crystallography, 1969. 2: p. 65-71.
138. Palmer, D., Palmer, S, CrystalDiffract. 2011. 139. Inc, M.D., JADE Version 9. 2011. 140. Senkov, O.N., Chakoumakos, B.C., Jonas, J.J., and Froes, F.H., Effect of
temperature and hydrogen concentration on the lattice parameter of beta-titanium. Materials Research Bulletin, 2001. 36: p. 1431-1440.
141. Gehlen, P.C., Metallurgical Transactions, 1979. 2. 142. Berry, R.L.P., and Raynor, G.V., A Note on the lattice spacings of titanium at
elevated temperatures. Research, 1953. 6: p. 21s-23s. 143. Zupan, M., and Hemker, K.J., High temperature microsample tensile testing of γ-
TiAl. Materials Science and Engineering A, 2001. 319-320: p. 810-814. 144. Koppers, M., and Herzig, C., Intrinsic self-diffusion and substitutional Al diffusion
in α-Ti. Acta Materialia, 1997. 45: p. 4181-4191. 145. Kohler, U., and Herzig, C., On the Anomalous self-diffusion in b.c.c. titanium.
Physica Status Solidi (B), 1987. 144: p. 243-251.

158
146. Rusing, J., and Herzig, C., Concentration and temperature dependence of titanium self-diffusion and interdiffusion in the intermetallic phase Ti3Al. Intermetallics, 1996. 4: p. 647-657.
147. Herzig, C., Przeorski, T., and Mishin, Y., Self-diffusion in γ-TiAl: an experimental study and atomistic calculations. Intermetallics, 1998. 7: p. 389-404.
148. Koppers, M., Friesel, M., and Herzig, C, to be published. 149. Dyment, F., Balart, S., Lugo, C., Perez, R.A., Lalla, N.D., and Iribarren, M.J., Ru
self-diffusion and Ru diffusion in Al. Defect and Diffusion Forum, 2005. 237-240: p. 402-407.
150. Mishin, Y., and Herzig, C., Diffusion in the Ti-Al system. Acta Materialia, 2000. 48: p. 589-623.
151. Kohler, U., and Herzig, C., On the correlation between self-diffusion and the low-frequency LA 2/3<111> phonon mode in b.c.c. metals. Philosophical Magazine A, 1988. 58: p. 769-786.
152. Hobbs, R.A., Karunaratne, M.S.A., Tin, S., Reed, R.C., Rae, C.M.F., Uphill diffusion in ternary Ni-Re-Ru alloys at 1000 and 1100 oC. Materials Science and Engineering A, 2007. 460-461: p. 587-594.
153. Rajsiri, S., Ryba, E.R., Unpublished research in Ti-Al-Ru alloys.

VITA
Supphachan Rajsiri
Education: a. High School - Mathayom Suksa 6, 1993
Non-Formal Education, Thailand - Mathayom Suksa 5, 1994
Suankularb Vittayalai School, Thailand b. Undergraduate Study - Bachelor of Engineering in Industrial Engineering, 1998
Mahidol University, Thailand c. Graduate Studies - Master degree program in Metallurgical Engineering (non-degree), 1998-2000 Chulalongkorn University, Thailand - Master degree program in Mechanical Engineering (non-degree), 2000 University of Miami, Coral Gables, FL - Master of Science in Materials Science and Engineering, 2002 University of Central Florida, Orlando, FL Professional Experience: - Internship, Summer 1997 Technical Department, Sammitr AutoPart Company Limited, Thailand - Teaching Assistant for Physical Metallurgy Laboratory I (2109301), 2000
Chulalongkorn University, Thailand - Teaching Assistant for Metallurgy Laboratory I (MATSE 471), 2007-2008
The Pennsylvania State University, University Park, PA - Teaching Assistant for Metallurgy Laboratory II (MATSE 472), 2007-2008
The Pennsylvania State University, University Park, PA - Lecturer in Department of Industrial Engineering, 2009-Present Mahidol University, Thailand Honors and Awards: - The Royal Thai Government Scholarship for M.S.-Ph.D. study, 1998-2006 - Honorable Mention in Physical Microscopy and Surface Science Analysis for Poster Presentation "Effects of Focused Ion Beam Prepared Surfaces", March 2002
The Fifth Annual Joint Meeting of the Florida Chapter of the American Vacuum Society and the Florida Society for Microscopy