the pediatric stroke outcome measurestroke.ahajournals.org/content/strokeaha/43/6/1602.full.pdf ·...
TRANSCRIPT
The Pediatric Stroke Outcome MeasureA Validation and Reliability Study
Lisa Kitchen, MSc; Robyn Westmacott, PhD; Sharon Friefeld, PhD; Daune MacGregor, MD;Rosalind Curtis, MD; Anita Allen, RN; Ivanna Yau, RN; Rand Askalan, MD;
Mahendranath Moharir, MBBS; Trish Domi, MA; Gabrielle deVeber, MD
Background and Purpose—The Pediatric Stroke Outcome Measure (PSOM) is an objective, disease-specific outcomemeasure containing 115 test items suitable for newborn to adult ages. The PSOM measures neurological deficit andfunction across 5 subscales: right sensorimotor, left sensorimotor, language production, language comprehension, andcognitive/behavior yielding a final 10-point deficit score. The goal of this study was to examine PSOM construct validityin measuring neurological outcome in pediatric stroke survivors and interrater reliability (IRR) for both prospective andretrospective scoring.
Methods—For construct validity, PSOM subscale scores were correlated with scores on standardized neuropsychologicalmeasures matched by functional domain. We assessed IRR by comparing same-day “live” PSOM scores from 2independent raters in 10 children (prospective IRR) and by comparing PSOM scores estimated from medical dictationsacross 5 raters in another 10 children (retrospective IRR).
Results—We analyzed PSOM scores from 203 children with ischemic stroke. PSOM subscales show good construct validity(��0.2–0.4; P�0.05). PSOM subscale scores of normal/abnormal demonstrate strong agreement for domain-matchedneuropsychology scores (alternative chance-corrected statistic�0.4–0.8). IRR was excellent with the 2 prospective raters’scores in almost perfect agreement (intraclass correlation coefficient, 0.93; 95% CI, 0.76–0.98). Retrospective IRRdemonstrated strong agreement with an intraclass correlation coefficient of 0.77 (95% CI, 0.56–0.92).
Conclusions—The PSOM is a valid and reliable outcome measure for pediatric stroke. It is useful for retrospective scoringfrom health records and prospective serial longitudinal outcome assessments and is ideally suited for prospective clinicaltrials in pediatric stroke. (Stroke. 2012;43:1602-1608.)
Key Words: outcome measures � pediatric stroke � PSOM � validation study
Stroke during childhood is an increasingly recognizedcause of significant long-term morbidity that creates a
substantial burden of illness per affected individual.1 Child-hood stroke incidence is 5 to 8 per 100 000 children annuallywith approximately 50% ischemic including arterial ischemicstroke (AIS) or cerebral sinovenous thrombosis (CSVT).2,3
Neonatal incidence is higher at 1 in 3000 to 5000 livebirths.4,5 Resultant neurological deficits are reported in50% to 90% of children and include motor, language,and cognitive deficits.1,6 –10 Outcomes research and clinicaltrials require a feasible, valid, and reliable outcome mea-sure in pediatric stroke.
Outcome measures developed for diffuse cerebral pediatricdisorders including cerebral palsy, HIV, adrenoleukodystro-phy, and head trauma1 may be insensitive to the focal and
sometimes mild deficits that result from pediatric stroke. TheRankin Scale, Barthel Index, and other adult stroke scales11
are not applicable to young children due to their reliance onself-reporting and independence in activities of daily living.Finally, across the adult years, expected performance issimilar in contrast to children in whom abilities changeconsiderably with maturation from infancy to teenage years.
The Pediatric Stroke Outcome Measure (PSOM) is anobjective disease-specific measure of neurological recoveryafter childhood stroke. The PSOM was developed and imple-mented from 1994 in a prospective outcome study in ourinstitutional Children’s Stroke Clinic in Toronto, Canada.1,12
Currently, the PSOM is also in use in the InternationalPediatric Stroke Study13 and multiple other pediatric strokestudies.8,14,15
Received October 3, 2011; accepted February 10, 2012.From the Children’s Stroke Program (L.K., R.W., D.M., R.C., A.A., I.Y., R.A., M.M., T.D., G.d.V.), the Department of Psychology (R.W.), and the
Division of Neurology (D.M., A.A., I.Y., R.A., M.M., G.d.V.), The Hospital for Sick Children, Toronto, Canada; and the Department of OccupationalScience and Occupational Therapy (S.F.) and the Faculty of Medicine (S.F., D.M., I.Y., R.A., M.M., G.d.V.), University of Toronto, Toronto, Canada.
The online-only Data Supplement is available with this article at http://stroke.ahajournals.org/lookup/suppl/doi:10.1161/STROKEAHA.111.639583/-/DC1.
Correspondence to Robyn Westmacott, PhD, Department of Psychology, Hospital for Sick Children, 555 University Avenue, Toronto, Ontario, CanadaM5G 1X8. E-mail [email protected]
© 2012 American Heart Association, Inc.
Stroke is available at http://stroke.ahajournals.org DOI: 10.1161/STROKEAHA.111.639583
1602
by guest on June 4, 2018http://stroke.ahajournals.org/
Dow
nloaded from
by guest on June 4, 2018http://stroke.ahajournals.org/
Dow
nloaded from
by guest on June 4, 2018http://stroke.ahajournals.org/
Dow
nloaded from
by guest on June 4, 2018http://stroke.ahajournals.org/
Dow
nloaded from
by guest on June 4, 2018http://stroke.ahajournals.org/
Dow
nloaded from
by guest on June 4, 2018http://stroke.ahajournals.org/
Dow
nloaded from

In the current study we sought to analyze the validity andreliability of the PSOM.
MethodsSubject SelectionBeginning in 1994, children diagnosed with acute AIS or CSVT atthe Hospital for Sick Children, Toronto, Canada, were prospectivelyenrolled in a longitudinal pediatric stroke outcome study. Childrenwith outcome assessments completed before May 31, 2010, wereincluded in the current PSOM validation study. Subjects includedchildren aged newborn to 18 years. Parental consent and child assent(when appropriate) were obtained for all study subjects.
Stroke CriteriaThe diagnosis of AIS and CSVT met previously published clinicaland radiographic criteria.1 AIS required a sudden-onset focal neuro-logical deficit1 (for infants �6 months age, seizures or lethargy wassufficient) and corroborating corresponding neuroimaging evidenceof focal infarction conforming to an established cerebral arteryterritory. Children with delayed diagnosis of perinatal AIS pres-enting with pathological hand dominance/hemiparesis �1 year agewere also included. For CSVT, the diagnosis required seizures,lethargy or focal neurological deficits, and radiographic demonstra-tion of cerebral vein or sinus occlusion either with or withoutparenchymal bleeding or infarction.
Pediatric Stroke Outcome MeasureThe PSOM was developed, piloted, and refined by 3 pediatricneurologists in the Children’s Stroke Clinic (G.d.V., D.M., R.C.). Itwas adapted, with permission, from a neurological outcome scaledeveloped by Dr Isabel Rapin and a pediatric stroke adjudicationquestionnaire.16–18 The PSOM represents a structured, classical,pediatric neurological examination containing 115 test items encom-passing cognition, language, cranial nerve, motor, sensory, cerebel-lar, and gait functions. Test items are organized sequentially acrossdevelopment from early infancy to teenage years with a scoringoption of “not age-appropriate” for each item. For infants �2 years,primitive reflexes and developmental examination items are in-cluded. Completion time for examination and scoring averages 20minutes.
On completion of the PSOM examination, the neurologist scoresa Summary of Impressions containing 5 subscales: right sensorimo-tor, left sensorimotor (each with subcategories), language produc-tion, language comprehension, and cognitive/behavioral. Subscalescoring is 0 (no deficit), 0.5 (mild deficit, normal function), 1(moderate deficit, decreased function), or 2 (severe deficit, missingfunction). The PSOM total score is the sum of the 5 subscale scoresand ranges from 0 (no deficit) to 10 (maximum deficit).
Children were serially examined with the PSOM in the Children’sStroke Clinic concurrent with clinically indicated visits at 3 to 6months and 12 months poststroke and thereafter at 2- to 5-yearintervals to 18 years of age. Serial and parallel standardizedneuropsychological and quality-of-life outcomes were also obtainedwithin the main outcome study.19–23
Children with a neuropsychological assessment and a PSOMcompleted within a specified intertest time interval were included inthe current study. The required maximum intertest interval variedover time from the acute stroke to account for the shifting rate ofneurological changes over time. Maximum intertest time intervalswere: for �6 months poststroke, 1-month intertest interval; 6 to 12months poststroke, 6-month interval; 1 to 4 years poststroke, 1-yearinterval; and �4 years poststroke, 2-year interval. The PSOM/neuropsychological test pair most remote from the acute stroke wasselected.
Construct ValidityTo assess construct validity, PSOM subscale scores were comparedwith standardized neuropsychological measures matched to eachsubscale based on functional domain/content relevance. These
domain-matched combinations were defined a priori (Table 1).Descriptions of the neuropsychological measures are in the online-only Data Supplement Appendix I. Correlation of PSOM subscalescores with scores from the corresponding neuropsychological mea-sures was analyzed using Spearman correlation. The predictive valueof PSOM was assessed using linear regression (neuropsycholog-ical standardized test scores as the dependent variable and PSOMsubscale scores as the independent variable). Using the linearregression model, we defined misclassification rate as percentageof observed values that are not within the predicted values 95%CI. We used PSOM subscale raw scores (4 levels) and standard-ized used measures scores for correlation and prediction analyses.For agreement analysis, we used an alternative chance-correctedstatistical test with PSOM subscale scores dichotomized tonormal (PSOM�0) and abnormal (PSOM �0) and neuropsycho-logical standardized test scores dichotomized as normal andabnormal (defined as �1 SD below the mean). Correlation oragreement was defined as poor for coefficient �0.25, fair tomoderate for coefficient �0.25 but �0.75, and excellent forcoefficient �0.75.
For validation of retrospective PSOM scoring from medicalrecords, we compared PSOM subscale scores obtained by “live”in-clinic PSOM examination on 10 children with PSOM subscalescores generated by 5 raters from medical dictations on the samechildren (Spearman correlation). The abstracters included 3 staffpediatric neurologists, a senior pediatric neurology resident, and anallied health professional member of the stroke team (PhD inOccupational Therapy). Raters had varying levels of experience withthe PSOM ranging from 15 years (Stroke Clinic Medical Director) tono prior experience (neurology resident visiting Stroke Clinic). Foreach patient, the dictation notes from stroke clinic visits werephotocopied, edited to remove identifying patient information, andthen photocopied again. These copies were then distributed to the 5raters who estimated scores for the 5 PSOM subscales.
Interrater ReliabilityWe assessed interrater reliability (IRR) in 2 ways. First, as previ-ously published,1 10 children underwent same-day in-clinic PSOMexaminations by 2 neurologists (G.d.V. and R.C.) blinded to eachother’s ratings (prospective IRR). Second, we assessed IRR ofPSOM scores abstracted from medical dictations on another 10children by 5 independent raters (retrospective IRR; same 10children used for validation of retrospective scoring).
For both methods of reliability testing, PSOM scores wereanalyzed as raw scores (4 levels for subscales and 0–10 for PSOMtotal scores). Intraclass correlation coefficient (ICC) using 2-wayrandom effects model and absolute agreement definition was used toestimate scoring agreement for PSOM ordinal data (subscale scoringfrom 0 to 2). Interrater agreement definitions were for poor ICC�0.0to 0.2, fair ICC�0.3 to 0.4, moderate ICC�0.5 to 0.6, strongICC�0.7 to 0.8, and almost perfect ICC �0.8.
Statistical AnalysisStatistical packages used were SPSS Version 20 (SPSS Science,Chicago, IL) and SAS Version 9.3 (SAS Institute, Cary, NC).
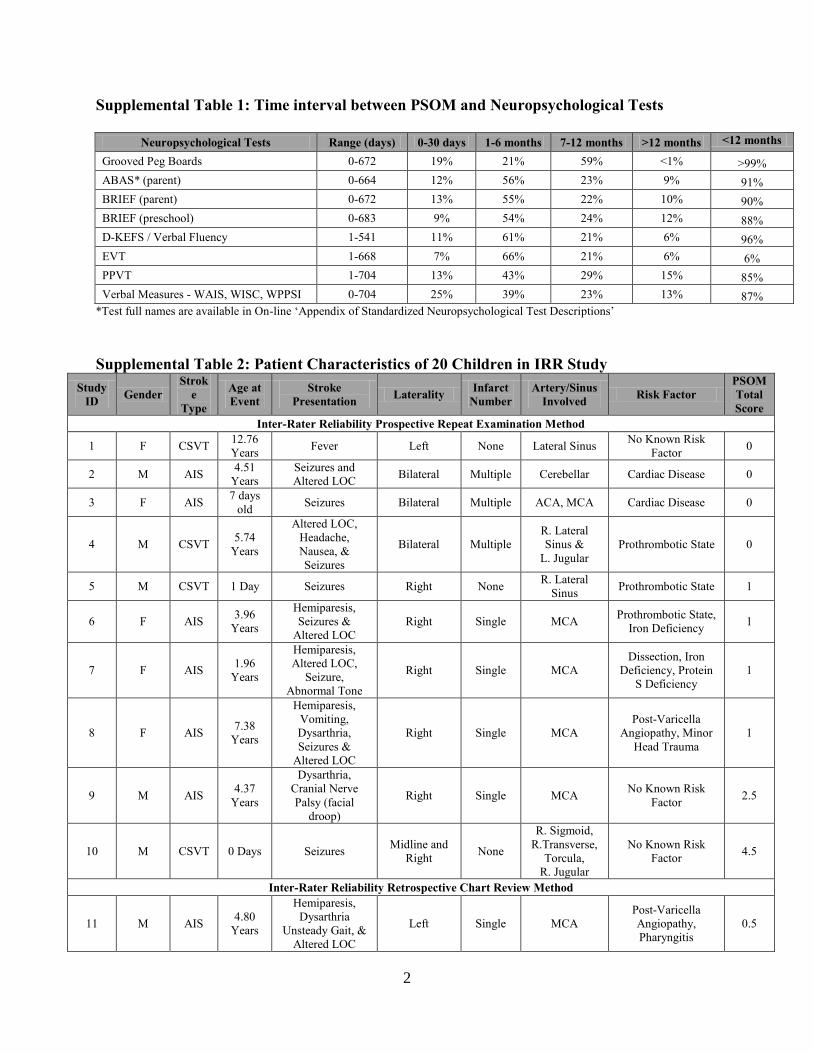
ResultsThe study sample consisted of 203 children including 156(76.8%) with AIS and 47 (23.2%) with CSVT (Table 2). Ageat stroke ranged from newborn to teenage years. There were49 (24%) neonates (including presumed perinatal ischemicstroke) and 124 (61.1%) males. Mean interval between strokeand PSOM was 4.5 years (range, 0–13.8 years). Intervalsfrom PSOM testing to neuropsychological tests were within 6months in 40% of subjects and within 12 months in 85%(details in online-only Data Supplement Table I). PSOM totalscores over time for the study sample are presented in Figure1. PSOM total scores tended to cluster at the lower end of the
Kitchen et al Validation of the Pediatric Stroke Outcome Measure 1603
by guest on June 4, 2018http://stroke.ahajournals.org/
Dow
nloaded from
0 to 10 range with approximately one third scoring 0 of 10and another approximately 20% scoring 0.5. The remainderhad moderate to severe deficits with scores ranging from of 1to 7. Fewer than 2% scored �5.
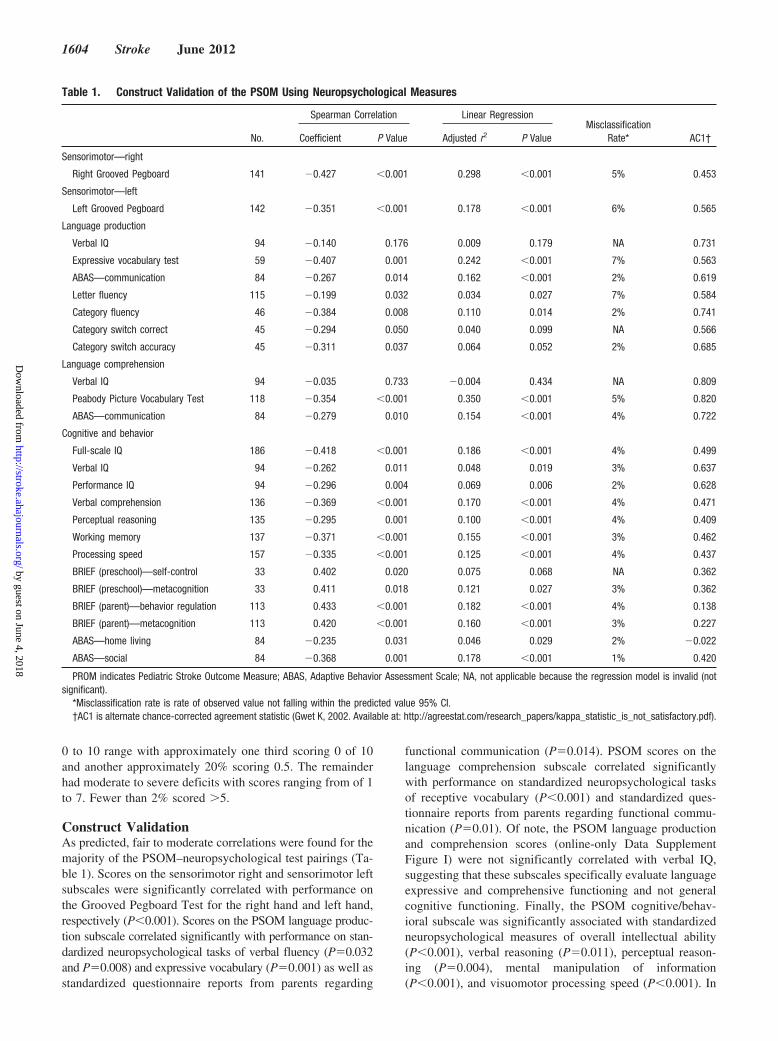
Construct ValidationAs predicted, fair to moderate correlations were found for themajority of the PSOM–neuropsychological test pairings (Ta-ble 1). Scores on the sensorimotor right and sensorimotor leftsubscales were significantly correlated with performance onthe Grooved Pegboard Test for the right hand and left hand,respectively (P�0.001). Scores on the PSOM language produc-tion subscale correlated significantly with performance on stan-dardized neuropsychological tasks of verbal fluency (P�0.032and P�0.008) and expressive vocabulary (P�0.001) as well asstandardized questionnaire reports from parents regarding
functional communication (P�0.014). PSOM scores on thelanguage comprehension subscale correlated significantlywith performance on standardized neuropsychological tasksof receptive vocabulary (P�0.001) and standardized ques-tionnaire reports from parents regarding functional commu-nication (P�0.01). Of note, the PSOM language productionand comprehension scores (online-only Data SupplementFigure I) were not significantly correlated with verbal IQ,suggesting that these subscales specifically evaluate languageexpressive and comprehensive functioning and not generalcognitive functioning. Finally, the PSOM cognitive/behav-ioral subscale was significantly associated with standardizedneuropsychological measures of overall intellectual ability(P�0.001), verbal reasoning (P�0.011), perceptual reason-ing (P�0.004), mental manipulation of information(P�0.001), and visuomotor processing speed (P�0.001). In
Table 1. Construct Validation of the PSOM Using Neuropsychological Measures
No.
Spearman Correlation Linear RegressionMisclassification
Rate* AC1†Coefficient P Value Adjusted r2 P Value
Sensorimotor—right
Right Grooved Pegboard 141 �0.427 �0.001 0.298 �0.001 5% 0.453
Sensorimotor—left
Left Grooved Pegboard 142 �0.351 �0.001 0.178 �0.001 6% 0.565
Language production
Verbal IQ 94 �0.140 0.176 0.009 0.179 NA 0.731
Expressive vocabulary test 59 �0.407 0.001 0.242 �0.001 7% 0.563
ABAS—communication 84 �0.267 0.014 0.162 �0.001 2% 0.619
Letter fluency 115 �0.199 0.032 0.034 0.027 7% 0.584
Category fluency 46 �0.384 0.008 0.110 0.014 2% 0.741
Category switch correct 45 �0.294 0.050 0.040 0.099 NA 0.566
Category switch accuracy 45 �0.311 0.037 0.064 0.052 2% 0.685
Language comprehension
Verbal IQ 94 �0.035 0.733 �0.004 0.434 NA 0.809
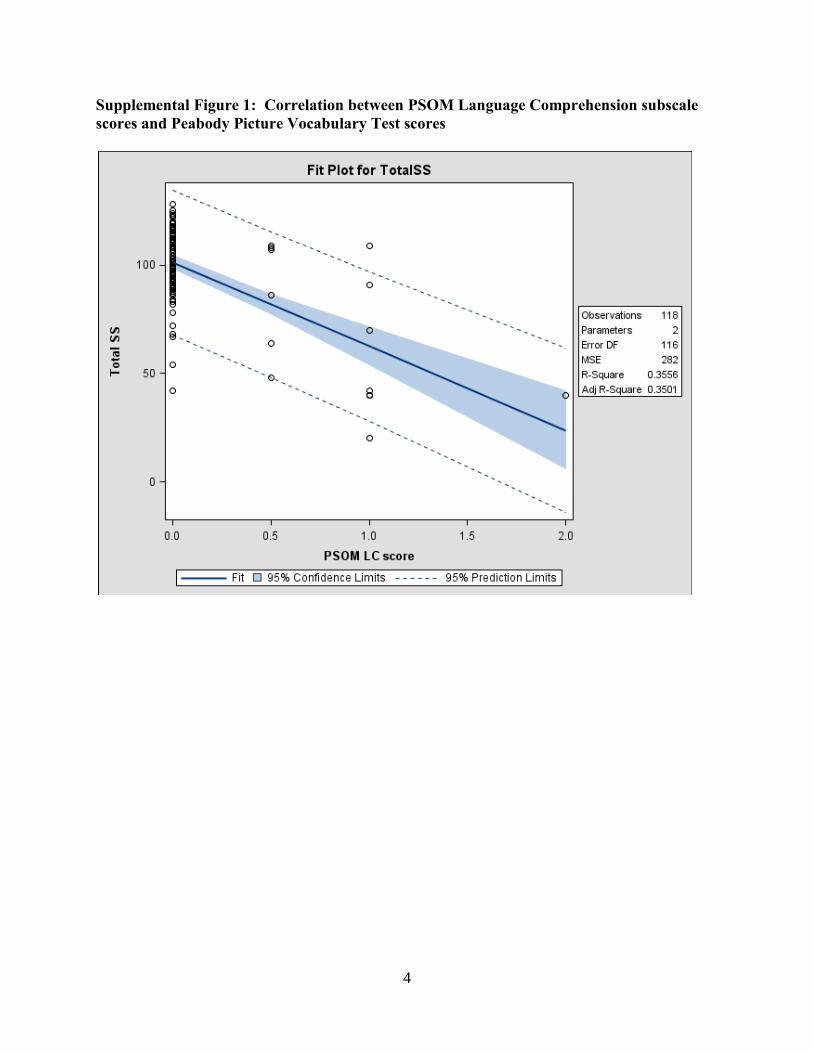
Peabody Picture Vocabulary Test 118 �0.354 �0.001 0.350 �0.001 5% 0.820
ABAS—communication 84 �0.279 0.010 0.154 �0.001 4% 0.722
Cognitive and behavior
Full-scale IQ 186 �0.418 �0.001 0.186 �0.001 4% 0.499
Verbal IQ 94 �0.262 0.011 0.048 0.019 3% 0.637
Performance IQ 94 �0.296 0.004 0.069 0.006 2% 0.628
Verbal comprehension 136 �0.369 �0.001 0.170 �0.001 4% 0.471
Perceptual reasoning 135 �0.295 0.001 0.100 �0.001 4% 0.409
Working memory 137 �0.371 �0.001 0.155 �0.001 3% 0.462
Processing speed 157 �0.335 �0.001 0.125 �0.001 4% 0.437
BRIEF (preschool)—self-control 33 0.402 0.020 0.075 0.068 NA 0.362
BRIEF (preschool)—metacognition 33 0.411 0.018 0.121 0.027 3% 0.362
BRIEF (parent)—behavior regulation 113 0.433 �0.001 0.182 �0.001 4% 0.138
BRIEF (parent)—metacognition 113 0.420 �0.001 0.160 �0.001 3% 0.227
ABAS—home living 84 �0.235 0.031 0.046 0.029 2% �0.022
ABAS—social 84 �0.368 0.001 0.178 �0.001 1% 0.420
PROM indicates Pediatric Stroke Outcome Measure; ABAS, Adaptive Behavior Assessment Scale; NA, not applicable because the regression model is invalid (notsignificant).
*Misclassification rate is rate of observed value not falling within the predicted value 95% CI.†AC1 is alternate chance-corrected agreement statistic (Gwet K, 2002. Available at: http://agreestat.com/research_papers/kappa_statistic_is_not_satisfactory.pdf).
1604 Stroke June 2012
by guest on June 4, 2018http://stroke.ahajournals.org/
Dow
nloaded from

addition, the cognitive–behavioral subscale was significantlyassociated with standardized parent questionnaire reportsregarding overall executive function (P�0.001), behaviorregulation (P�0.001), social skills (P�0.001), and functionalindependence at home (P�0.031). The relationship betweenPSOM language comprehension and the Peabody PictureVocabulary Test is presented in online-only Data SupplementFigure I. Because of the large number of correlations calcu-lated, we have included only this 1 as an example. For themajority of the correlations (21 of 25), the linear regressionmodel was statistically significant (Table 1). Misclassifica-tion rates were also low (range, 1%–7%), further supportingthe predictive validity of the PSOM subscales.
There was moderate agreement between normal/abnormalPSOM subscale scores with scores on corresponding domain-
matched neuropsychological measures (Table 1). For eachcorresponding pair, the percent of overall agreement rangedfrom 49% to 86% with the 2 language and 2 sensorimotorsubscales showing stronger agreement with neuropsycholog-ical measures (alternative chance-corrected�0.45–0.82) thanthe cognitive–behavioral subscale (alternative chance-cor-rected�0.42–0.63 for overall executive function and socialskills in comparison to alternative chance-corrected��0.02to 0.36 for behavior regulation and functional independenceat home). This finding is consistent with the broad range ofdifficulties and symptoms that could result in a designation ofabnormal on the cognitive–behavioral subscale.
Validation of Retrospective PSOM ScoringPSOM scoring abstracted from medical dictations was validcompared with same-day live PSOM scoring for right senso-rimotor (��0.86, P�0.002), left sensorimotor (��0.84,P�0.005), language production (��0.76, P�0.011), andcognitive and behavioral (��0.86, P�0.002) subscales. Cor-relations for language comprehension failed to reachsignificance.
IRR AnalysisThe IRR analyses included 20 children (10 for prospectiveand another 10 for retrospective IRR) with age at strokeranging from newborn to age 13 years, deficit severitiesranging from normal (PSOM total score 0) to “severe deficit”(total PSOM �0), and including AIS and CSVT stroke types(details in online-only Data Supplement Table II).
Prospective IRR was excellent with the 2 raters’ prospec-tive total scores in almost perfect agreement (ICC�0.93; 95%CI, 0.76–0.98; Table 3).
0 0.5 1 1.5 2 2.5 3 3.5 4 4.5 5 5.5 6 6.5 >7
0-12 Months 34.9% 18.0% 20.8% 4.6% 8.5% 5.3% 4.2% 1.4% 0.4% 1.1% 0.7% 0.0% 0.0% 0.0% 0.4%
13-60 Months 35.5% 20.7% 16.5% 5.5% 8.8% 3.7% 2.4% 0.7% 2.2% 0.9% 1.8% 0.2% 0.4% 0.2% 0.4%
>60 Months 24.2% 26.2% 15.1% 6.7% 6.7% 4.8% 6.0% 2.8% 2.8% 2.4% 0.8% 0.4% 0.4% 0.8% 0.0%
0.0%
5.0%
10.0%
15.0%
20.0%
25.0%
30.0%
35.0%
40.0%
% o
f Pa�
ents
Neurological Outcome (PSOM Scores) Over Time*
Figure 1. Pediatric Stroke Outcome Measure (PSOM) scores over follow-up in 203 children with AIS or CSVT. AIS indicates arterialischemic stroke; CSVT, cerebral sinovenous thrombosis.
Table 2. Clinical Features of 203 Children With Ischemic Stroke
Characteristics No. of Children(%)
Stroke type
Arterial ischemic stroke 156 (76.8)
Cerebral sinovenous thrombosis 47 (23.2)
Sex
Male 124 (38.9)
Female 79 (61.1)
Age at stroke
Neonate, �1 mo of age 49 (24.1)
Nonneonate, �1 mo of age 154 (75.9)
Mean age at stroke, y 4.7 (range, 0–17.3)
Mean interval from stroke to PSOM, y 4.5 (range, 0–13.8)
PSOM indicates Pediatric Stroke Outcome Measure.
Kitchen et al Validation of the Pediatric Stroke Outcome Measure 1605
by guest on June 4, 2018http://stroke.ahajournals.org/
Dow
nloaded from

Retrospective IRR of PSOMs abstracted from medicaldictations was also strong with an ICC of 0.77 (95% CI,0.56–0.92) for total PSOM score. Figure 2 shows the PSOMscore distribution by rater. There is strong agreement amongthe 5 raters in the following functional domains: rightsensorimotor (ICC�0.78; 95% CI, 0.57–0.93), left sensori-motor (ICC�0.79; 95% CI, 0.55–0.94), language production(ICC�0.73; 95% CI, 0.50–0.91), and cognitive and behav-ioral (ICC�0.96; 95% CI, 0.90–0.99) subscales. Poor agree-ment is observed for language comprehension withICC�0.19 (95% CI, �0.06 to 0.67; Table 4).
DiscussionThe current study demonstrates, in a large cohort of childrenwith pediatric stroke, that the PSOM is both valid andreliable. These findings are important because the PSOM isthe only disease-specific measure of neurological outcomefor pediatric stroke and is currently in use in multiple researchstudies of this population.1,8,13,15
Our construct validity analyses confirm that the PSOMsubscale scores demonstrate relevant functional impairments
in cognition/behavior, sensorimotor, and language abilities.The PSOM cognitive–behavioral subscale significantly cor-related with standardized neuropsychological measures ofoverall intellectual ability, verbal and perceptual reasoning,and parental behavior/cognitive questionnaires.
Fair to moderate correlations between PSOM and neuro-psychological scores were expected, because these 2 mea-sures evaluate outcome in different ways. Specifically, ourresults indicate that PSOM is an effective screening tool forsignificant sensorimotor, language, and cognitive–behavioraldeficits resulting from pediatric stroke. In contrast, neuropsy-chological assessment taps into the same domains as thoseevaluated on the PSOM but in a much more detailed andobjective manner such that more subtle weaknesses can bedetected. Full standardized neuropsychological assessmentsrequire significant financial and time resources and the use ofthe 20-minute PSOM examination in screening children forcognitive–behavioral deficits is therefore of value. However,a child with a normal PSOM cognitive–behavioral subscalescore could still have subtle weaknesses in cognition, behav-ior, or complex aspects of information processing that are
Table 3. Prospective Interrater Reliability Using PSOM Subscale Scoring: Normal (0), Mild (0.5), Moderate (1), and Severe (2)
Prospective Scoring*: 2 Raters in 10 Patients
Intraclass CorrelationCoefficient
Total PSOMScore (0–10)
SensorimotorRight
SensorimotorLeft
LanguageProduction
LanguageComprehension
Cognitive andBehavior
Cronbach � 0.962 1.000 0.963 0.762 0.780 0.918
ICC single measures 0.934 1.000 0.936 0.640 0.640 0.833
95% CI lower bound 0.758 NA 0.762 0.023 0.092 0.483
95% CI upper bound 0.983 NA 0.984 0.898 0.895 0.955
Percent Normal Scores N�10 N�10 N�10 N�10 N�10 N�10
Rater 1 (PSOM�0) 40% 60% 60% 80% 90% 70%
Rater 2 (PSOM�0) 50% 60% 60% 90% 80% 80%
PSOM indicates Pediatric Stroke Outcome Measure; ICC, intraclass correlation coefficient; NA, not applicable.*Denominator is no. of set of scores compared (a set has 2 scores 1 from each rater).
0%
10%
20%
30%
40%
50%
60%
70%
80%
0 0.5 1 2
PSOM Score Distribu�on: 5 Raters
Rater 1 Rater 2 Rater 3 Rater 4 Rater 5
Figure 2. Retrospective PSOM score distribution by raters. PSOM indicates Pediatric Stroke Outcome Measure.
1606 Stroke June 2012
by guest on June 4, 2018http://stroke.ahajournals.org/
Dow
nloaded from

only detectable on formal neuropsychological assessment. Inaddition, the narrow rating scale of the PSOM (ranging from0 to 2) also contributes to findings of moderate correlations inthis study.
Finally, our article demonstrates that PSOM scores esti-mated from health records closely approximated in-clinicPSOM scores, validating this method of PSOM scoring. Bothin-clinic and chart-abstracted PSOM scoring demonstratedexcellent reliability. These findings support the use of thePSOM for quantifying neurological function from past healthrecords.
Accurate outcome data are essential for informing progno-sis, treatment prioritization, and selecting clinical trial endpoints in pediatric stroke.1 The PSOM evaluates the directimpact of stroke on the child’s neurological function. In focalbrain injury, including stroke, objective neurological outcomemeasures using observation by skilled health professionalsprovide a direct measure of the severity of the brain injury.Treatments that are intended to directly reduce infarct sever-ity, including neuroprotective or acute reperfusion treatments,are most likely to demonstrate their effects with the use ofdirect outcome measures. Indirect measures, including self-report for older children, or parental proxy report for youngerchildren, are more likely to measure a combination of directbrain injury and indirect experiential aspects of the illness.We have previously demonstrated that parental impressionsof a child’s poststroke recovery frequently underestimate andoverestimate that child’s neurological deficits compared witha trained pediatric neurologist.1 This may be caused by theparents’ incorporation of indirect effects into their assessmentof a child’s status. Indirect effects of the illness that areexperienced by the child who experiences a stroke includepain from phlebotomy and other medical procedures, childand parental anxiety regarding the acute loss of function andanticipated future consequences, fear of a recurrent stroke,and, later, the emotional and social consequences of chal-lenges in reintegration of the impaired child. Studies of theseindirect effects of stroke including quality-of-life evaluationsrequire indirect measures, including child-report or parent-
report outcome measures. In quality of life and other studiesof the full impact of stroke, the use of the PSOM canelucidate the contribution of the actual infarct severity to thechild’s quality of life.
LimitationsThere are a number of limitations to the current study. First,not all consecutive children in the stroke clinic consented toneuropsychological testing. However, because this is a vali-dation study, the sample need not be completely representa-tive of the children seen over the study interval. In fact, wedid obtain data on a wide range of ages, stroke types, anddeficit severities in the sample used for this study. Moreover,the results from the neuropsychological tests were normallydistributed, which downplays the concerns regarding referralbias. Another limitation is that the PSOM is likely to bebiased toward motor and sensory impairments as opposed tocognitive, language and behavioral deficits. This could resultfrom the fact that the PSOM is administered by trainedneurologists, and individual test items are more frequentlyfocused on motor and sensory impairments. One area forfuture development might be to expand the cognitive–behav-ioral component of the PSOM to better capture these deficits.Difficulties in behavior, emotions, and peer relationshipsinterfere with everyday life occur in approximately half of allchildren with hemiplegia after stroke.24,25
In conclusion, the current study demonstrates that thePSOM demonstrates strong measurement domains and is avalid and reliable measure of deficit types and neurologicalimpairment after pediatric stroke. The PSOM is ideal for usein both outcomes studies and clinical trials geared to improv-ing outcomes in pediatric stroke.
AcknowledgmentsWe are extremely grateful to the many Pediatric Stroke Fellows fromthe Hospital for Sick Children who have contributed so much to thePSOM database, to our patients, and to our program since 1998. Thankyou to our patients and families for their participation in research. Thankyou to Ann-Marie Pontigon and Jeffrey Templeton for expert statistical
Table 4. Retrospective Interrater Reliability Using PSOM Subscale Scoring: Normal (0), Mild (0.5), Moderate (1), and Severe (2)
Retrospective Scoring*: 5 Raters
Intraclass CorrelationCoefficient
Total PSOMScore (0–10)
SensorimotorRight
SensorimotorLeft
LanguageProduction
LanguageComprehension
Cognitive andBehavior
Cronbach � 0.950 0.951 0.952 0.929 0.532 0.992
ICC single measures 0.774 0.785 0.790 0.738 0.192 0.962
95% CI lower bound 0.561 0.579 0.559 0.502 �0.061 0.901
95% CI upper bound 0.926 0.930 0.945 0.913 0.674 0.991
Percent Normal Scores
Rater 1 (PSOM�0) 4/10 (40%) 7/10 (70%) 4/9 (44%) 6/10 (60%) 9/10 (90%) 7/10 (70%)
Rater 2 (PSOM�0) 4/10 (40%) 7/10 (70%) 4/9 (44%) 6/10 (60%) 7/10 (70%) 6/10 (60%)
Rater 3 (PSOM�0) 2/10 (20%) 9/10 (90%) 3/9 (33%) 4/10 (40%) 8/9 (89%) 7/10 (70%)
Rater 4 (PSOM�0) 4/10 (40%) 9/10 (90%) 4/8 (50%) 7/10 (70%) 7/8 (88%) 5/8 (63%)
Rater 5 (PSOM�0) 3/10 (30%) 8/10 (80%) 5/10 (50%) 6/10 (60%) 9/10 (90%) 7/10 (70%)
PSOM indicates Pediatric Stroke Outcome Measure; ICC, intraclass correlation coefficient.*Denominator is no. of sets of scores compared (a set has 5 scores 1 from each rater).
Kitchen et al Validation of the Pediatric Stroke Outcome Measure 1607
by guest on June 4, 2018http://stroke.ahajournals.org/
Dow
nloaded from
assistance. The PSOM form and instructions are available by e-mailingthe senior author at [email protected].
Sources of FundingSupported by the Auxilium Foundation and The Heart and StrokeFoundation of Ontario.
DisclosuresNone.
References1. deVeber G, MacGregor D, Curtis R, Mayank S. Neurologic outcome in
survivors of childhood arterial ischemic stroke and sinovenousthrombosis. J Child Neurol. 2000;15:316–324.
2. Lynch JK, Hirtz DG, deVeber G, Nelson KB. Report of the NationalInstitute of Neurological Disorders and Stroke workshop on perinatal andchildhood stroke. Pediatrics. 2002;109:116–123.
3. Agrawal N, Johnston SC, Wu YW, Sidney S, Fullerton HJ. Imaging datareveal a higher pediatric stroke incidence than prior US estimates. Stroke.2009;40:3415–3421.
4. Perlman JM, Rollins NK, Evans D. Neonatal stroke: clinical character-istics and cerebral blood flow velocity measurements. Pediatr Neurol.1994;11:281–284.
5. Govaert P, Matthys E, Zecic A, Roelens F, Oostra A, Vanzieleghem B.Perinatal cortical infarction within middle cerebral artery trunks. Arch DisChild Fetal Neonatal Ed. 2000;82:F59–F63.
6. deVeber G, Andrew M, Canadian Pediatric Ischemic Stroke Study Group.Cerebral sinovenous thrombosis in children. N Engl J Med. 2001;345:417–423.
7. Moharir MD, Shroff M, Stephens D, Pontigon AM, Chan A, MacGregorD, et al. Anticoagulants in pediatric cerebral sinovenous thrombosis: asafety and outcome study. Ann Neurol. 2010;67:590–599.
8. Gordon AL, Ganesan V, Towell A, Kirkham FJ. Functional outcomefollowing stroke in children. J Child Neurol. 2002;17:429–434.
9. Goldenberg NA, Bernard TJ, Fullerton HJ, Gordon A, deVeber G. Anti-thrombotic treatments, outcomes, and prognostic factors in acutechildhood-onset arterial ischaemic stroke: a multicentre, observational,cohort study. Lancet Neurol. 2009;8:1120–1127.
10. Galvin J, Hewish S, Rice J, Mackay MT. Functional outcome followingpaediatric stroke. Dev Neurorehabil. 2011;14:67–71.
11. Kwon S, Hartzema AG, Duncan PW, Min-Lai S. Disability measures instroke: relationship among the Barthel Index, the Functional Inde-
pendence Measure, and the modified Rankin Scale. Stroke. 2004;35:918–923.
12. Friefeld S, Yeboah O, Jones JE, deVeber G. Health-related quality of lifeand its relationship to neurological outcome in child survivors of stroke.CNS Spectr. 2004;9:465–475.
13. Golomb MR, Fullerton HJ, Nowak-Gottl U, deVeber G. Male predom-inance in childhood ischemic stroke: findings from the InternationalPediatric Stroke Study. Stroke. 2009;40:52–57.
14. Beslow LA, Licht DJ, Smith SE, Storm PB, Heuer GG, Zimmerman RA,et al. Predictors of outcome in childhood intracerebral hemorrhage: aprospective consecutive cohort study. Stroke. 2010;41:313–318.
15. Lo W, Zamel K, Ponnappa K, Allen A, Chisolm D, Tang M, et al. Thecost of pediatric stroke care and rehabilitation. Stroke. 2008;39:161–165.
16. Rapin I. Historical data. In: Rapin I, ed. Preschool Children With Inad-equate Communication: Developmental Language Disorder, Autism, LowIQ. Clinics in Developmental Medicine, No. 139. I ed. London, UK:MacKeith Press; 1996:58–97.
17. Rapin I. Neurological exam. In: Rapin I, ed. Preschool Children WithInadequate Communication: Developmental Language Disorder, Autism,Low IQ. Clinics in Developmental Medicine, No. 139. I ed. London, UK:MacKeith Press; 1996:98–122.
18. Adams RJ, MvKie VC, Brambilla D, Carl E, Gallagher D, Nichols FT, etal. Stroke prevention trial in sickle cell anemia. Control Clin Trials.1998;19:110–129.
19. McLinden A, Baird AD, Westmacott R, Anderson PE, deVeber G. Earlycognitive outcome after neonatal stroke. J Child Neurol. 2007;22:1111–1116.
20. Hetherington R, Tuff L, Anderson P, Miles B, deVeber G. Short-termintellectual outcome after arterial ischemic stroke and sinovenousthrombosis in childhood and infancy. J Child Neurol. 2005;20:553–559.
21. Friefeld SJ, Westmacott R, MacGregor D, Deveber GA. Predictors ofquality of life in pediatric survivors of arterial ischemic stroke andcerebral sinovenous thrombosis. J Child Neurol. 2011;26:1186–1196.
22. Westmacott R, Askalan R, MacGregor D, Anderson P, deVeber G.Cognitive outcome following unilateral arterial ischaemic stroke in child-hood: effects of age at stroke and lesion location. Dev Med Child Neurol.2010;52:386–393.
23. Westmacott R, MacGregor D, Askalan R, deVeber G. Late emergence ofcognitive deficits after unilateral neonatal stroke. Stroke. 2009;40:2012–2019.
24. Yude C, Goodman R, McConachie H. Peer problems of children withhemiplegia in mainstream primary schools. J Child Psychol Psychiatry.1998;39:533–541.
25. Goodman R. Psychological aspects of hemiplegia. Arch Dis Child. 1997;76:177–178.
1608 Stroke June 2012
by guest on June 4, 2018http://stroke.ahajournals.org/
Dow
nloaded from

Allen, Ivanna Yau, Rand Askalan, Mahendranath Moharir, Trish Domi and Gabrielle deVeberLisa Kitchen, Robyn Westmacott, Sharon Friefeld, Daune MacGregor, Rosalind Curtis, Anita
The Pediatric Stroke Outcome Measure: A Validation and Reliability Study
Print ISSN: 0039-2499. Online ISSN: 1524-4628 Copyright © 2012 American Heart Association, Inc. All rights reserved.
is published by the American Heart Association, 7272 Greenville Avenue, Dallas, TX 75231Stroke doi: 10.1161/STROKEAHA.111.639583
2012;43:1602-1608; originally published online April 3, 2012;Stroke.
http://stroke.ahajournals.org/content/43/6/1602World Wide Web at:
The online version of this article, along with updated information and services, is located on the
http://stroke.ahajournals.org/content/suppl/2012/04/03/STROKEAHA.111.639583.DC1Data Supplement (unedited) at:
http://stroke.ahajournals.org//subscriptions/
is online at: Stroke Information about subscribing to Subscriptions:
http://www.lww.com/reprints Information about reprints can be found online at: Reprints:
document. Permissions and Rights Question and Answer process is available in the
Request Permissions in the middle column of the Web page under Services. Further information about thisOnce the online version of the published article for which permission is being requested is located, click
can be obtained via RightsLink, a service of the Copyright Clearance Center, not the Editorial Office.Strokein Requests for permissions to reproduce figures, tables, or portions of articles originally publishedPermissions:
by guest on June 4, 2018http://stroke.ahajournals.org/
Dow
nloaded from

1
SUPPLEMENTAL MATERIAL
Appendix: Standardized Neuropsychological Test Descriptions
Grooved Pegboard – Evaluates fine-motor speed and dexterity for each hand separately. The
primary measure is speed (time to insert pegs into holes on the pegboard).
Wechsler Intelligence Scale for Children (WISC) – Evaluates intellectual ability in children
age 6-16 yrs. The following index scores were used in this study: Verbal Comprehension/Verbal
IQ, Perceptual Reasoning/Performance IQ, Working Memory, Processing Speed, and Full Scale
IQ. Versions used in this study were: WISC-III and WISC-IV.
Wechsler Preschool and Primary Scale of Intelligence (WPPSI) – Evaluates intellectual
ability in children below 6 years of age. The following index scores were used: Verbal IQ,
Performance IQ, Processing Speed, and Full Scale IQ. Versions used in this study were: WPPSI-
R and WPPSI-III.
Wechsler Adult Intelligence Scale (WAIS) – Evaluates intellectual ability in children aged
older than 16 years. The following index scores were used in this study: Verbal Comprehension,
Perceptual Reasoning, Working Memory, Processing Speed and Full Scale IQ. The 3rd
Edition
was used in this study (WAIS-III).
Peabody Picture Vocabulary Test (PPVT) – Evaluates receptive vocabulary (i.e. words that
the child understands). The test involves selecting pictures that match words spoken by the
examiner.
Expressive Vocabulary Test (EVT) – Evaluates expressive vocabulary test (i.e. words that the
child can use/express). The test involves naming pictures and/or generating synonyms.
Verbal Fluency – Evaluates fluent word retrieval. The test involves quickly generating words
that start with a particular letter of the alphabet.
Adaptive Behaviour Assessment System-2nd
Edition (ABAS-II) – Standardized questionnaire
completed by parents to evaluate various aspects of adaptive behaviour in everyday life. The
subscales used in this study were: Communication (ability to communicate effectively in daily
interactions), Home Living (ability to carry out daily activities at home independently), and
Social (ability to interact socially with others).
Behaviour Rating Inventory of Executive Function (BRIEF) – Standardized questionnaire
completed by parents to evaluate various aspects of executive function in everyday life. The
index scores used were: Behavioural Rating Index (BRI - evaluates skills such as emotional
regulation, inhibitory control, ability to make transitions, etc.) and Metacognitive Index (MI –
evaluates skills such as planning, organization, working memory, monitoring for errors, etc.)
2
Supplemental Table 1: Time interval between PSOM and Neuropsychological Tests
Neuropsychological Tests Range (days) 0-30 days 1-6 months 7-12 months >12 months <12 months
Grooved Peg Boards 0-672 19% 21% 59% <1% >99%
ABAS* (parent) 0-664 12% 56% 23% 9% 91%
BRIEF (parent) 0-672 13% 55% 22% 10% 90%
BRIEF (preschool) 0-683 9% 54% 24% 12% 88%
D-KEFS / Verbal Fluency 1-541 11% 61% 21% 6% 96%
EVT 1-668 7% 66% 21% 6% 6%
PPVT 1-704 13% 43% 29% 15% 85%
Verbal Measures - WAIS, WISC, WPPSI 0-704 25% 39% 23% 13% 87%
*Test full names are available in On-line ‘Appendix of Standardized Neuropsychological Test Descriptions’
Supplemental Table 2: Patient Characteristics of 20 Children in IRR Study
Study
ID Gender
Strok
e
Type
Age at
Event
Stroke
Presentation Laterality
Infarct
Number
Artery/Sinus
Involved Risk Factor
PSOM
Total
Score
Inter-Rater Reliability Prospective Repeat Examination Method
1 F CSVT 12.76
Years Fever Left None Lateral Sinus
No Known Risk
Factor 0
2 M AIS 4.51
Years
Seizures and
Altered LOC Bilateral Multiple Cerebellar Cardiac Disease 0
3 F AIS 7 days
old Seizures Bilateral Multiple ACA, MCA Cardiac Disease 0
4 M CSVT 5.74
Years
Altered LOC,
Headache,
Nausea, &
Seizures
Bilateral Multiple
R. Lateral
Sinus &
L. Jugular
Prothrombotic State 0
5 M CSVT 1 Day Seizures Right None R. Lateral
Sinus Prothrombotic State 1
6 F AIS 3.96
Years
Hemiparesis,
Seizures &
Altered LOC
Right Single MCA Prothrombotic State,
Iron Deficiency 1
7 F AIS 1.96
Years
Hemiparesis,
Altered LOC,
Seizure,
Abnormal Tone
Right Single MCA
Dissection, Iron
Deficiency, Protein
S Deficiency
1
8 F AIS 7.38
Years
Hemiparesis,
Vomiting,
Dysarthria,
Seizures &
Altered LOC
Right Single MCA
Post-Varicella
Angiopathy, Minor
Head Trauma
1
9 M AIS 4.37
Years
Dysarthria,
Cranial Nerve
Palsy (facial
droop)
Right Single MCA No Known Risk
Factor 2.5
10 M CSVT 0 Days Seizures Midline and
Right None
R. Sigmoid,
R.Transverse,
Torcula,
R. Jugular
No Known Risk
Factor 4.5
Inter-Rater Reliability Retrospective Chart Review Method
11 M AIS 4.80
Years
Hemiparesis,
Dysarthria
Unsteady Gait, &
Altered LOC
Left Single MCA
Post-Varicella
Angiopathy,
Pharyngitis
0.5

3
12 F AIS 7 Days Hemiparesis and
Decreased Tone Right Single MCA
Meconium Staining,
Required CPAP at
birth
3.5
13 F AIS/
HIE
0 days
(Birth) Seizures Left Multiple MCA
No Known Risk
Factor 4.5
14 M AIS 2
Months
Hemiparesis,
Increased Tone, &
Seizures
Right Single MCA Cardiac Disease
(Catheterization) 3
15 M AIS 13.48
Years
Hemiparesis,
Bilateral Visual
Deficit, Aphasia,
Altered LOC,
Seizures
Bilateral Multiple PCA, MCA Cardiac Disease,
Migraine 1
16 M AIS 2.88
Years
Hemiparesis and
Focal seizures Right Single MCA Cardiac Disease 0
17 M AIS 3
Months
Headache,
vomiting and
seizures
Bilateral Single MCA Dehydration, Fetal
Alcohol Syndrome 3
18 F AIS 1.01
Years
Hemiparesis,
Altered LOC,
Fever & Seizures
Right Single MCA
Non-specific
Stenosis, Iron
Deficiency
Anaemia, Strep
Pneumonia
0
19 M AIS 9.44
Years
Dysarthria,
Cranial Nerve
Palsies, Decreased
Tone, Confusion,
Hemiplegia
Dysphagia
Left Multiple ICA, MCA
Post-Varicella
Angiopathy,
Tonsillectomy
7
20 F PPIS 0 Days
(birth) Hemiparesis Right Single MCA
Maternal Pre-
eclempsia, Vacuum
Delivery
2
Table Legend: AIS=arterial ischemic stroke; CSVT=cerebral sinovenous thrombosis; PPIS=presumed
perinatal ischemic stroke; R=right; L=left; ICA=internal carotid artery; MCA=middle cerebral artery;
PCA=posterior cerebral artery; HIE=hypoxic ischemic encephalopathy; LOC=level of consciousness;
4
Supplemental Figure 1: Correlation between PSOM Language Comprehension subscale
scores and Peabody Picture Vocabulary Test scores