the parkersburg, ia ef-5 tornado: destruction … parkersburg, ia ef-5 tornado: destruction amidst...
TRANSCRIPT
The Parkersburg, IA EF-5 Tornado: Destruction Amidst the Rain
Sarah A. Monette
University of Wisconsin - Madison Department of Atmospheric and Oceanic Science1225 W. Dayton Street, Madison, WI 53706, USA
AOS 453 Final Case Study
Abstract
On May 25, 2008, at 5:00PM local time, the city of Parkersburg, IA, experienced a tornado which produced peak wind gusts of 92 meters per second, or 205 miles per hour, based on damage assessment of homes and other buildings. (Marshall et al., 2008) Therefore, this tornado was classified as an EF-5, the first one to record a 5 on the Fujita, or Enhanced Fujita, Scale in Iowa since 1976. Unfortunately, 8 people lost their lives in what is now known as the Parkersburg Tornado. The focus of this case study is to investigate the synoptic and mesoscale parameters which combined to produced a supercell capable of generating the EF-5 Parkersburg tornado. Aided by synoptic scale lifting mechanisms including upper level divergence, at both 300 mb and 500 mb, and a surface warm front combined with moisture flux from the mesoscale low level jet, the environment in Parkersburg featured thermodynamic and wind shear instability favorable for the development of a significant tornado. This instability includes a conditionally unstable lapse rate, large ratio of CAPE to CIN, veering wind with height, as well as positive surface relative helicity. In addition to this instability, the intensity of the tornado was further enhanced by interactions with gravity waves just prior to tornadic development. This combination of mesoscale phenomenon allowed an EF-5 tornado to be produced from what storm chasers described as a heavy precipitating supercell, an event rarely seen, which will be discussed with the assistance of a Miller diagram.
Introduction
May 25, 2008, will be a day most Iowans will potentially remember for the rest of their lives. In a state where 85% of the tornadoes recorded between 1980 and 2008 were at the lower end of the Enhanced Fujita Scale (EF0, EF1), the tornado that touched down at 4:48 PM local time on this day would be one for the record books. Around 5:00 PM local time, 22Z, the tornado reached peak intensity around Parkersburg, IA, with estimated winds at 92, meters per second (m/s), 205 miles per hour (mph), based on damage assessment, earning an EF-5 rating (above 200 mph) on the Enhance Fujita Scale. This was the first tornado to record a 5 on the Fujita (or Enhanced Fujita) Scale since a F5 tornado
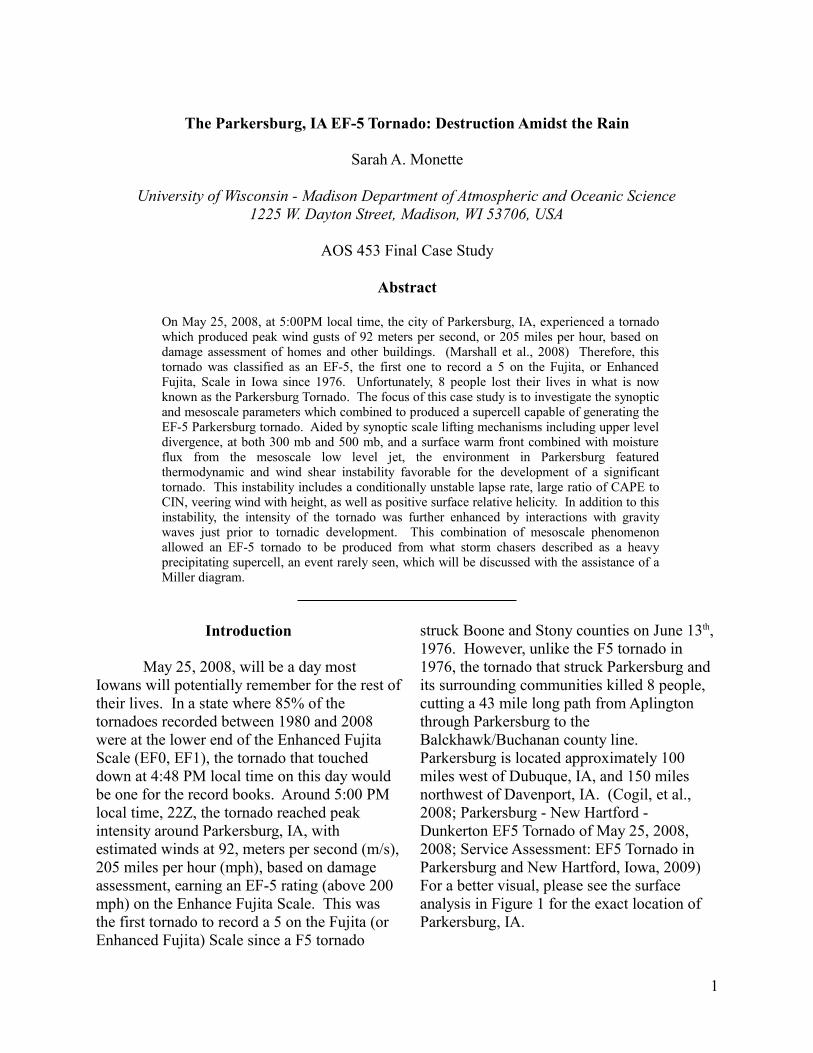
struck Boone and Stony counties on June 13th, 1976. However, unlike the F5 tornado in 1976, the tornado that struck Parkersburg and its surrounding communities killed 8 people, cutting a 43 mile long path from Aplington through Parkersburg to the Balckhawk/Buchanan county line. Parkersburg is located approximately 100 miles west of Dubuque, IA, and 150 miles northwest of Davenport, IA. (Cogil, et al., 2008; Parkersburg - New Hartford - Dunkerton EF5 Tornado of May 25, 2008, 2008; Service Assessment: EF5 Tornado in Parkersburg and New Hartford, Iowa, 2009) For a better visual, please see the surface analysis in Figure 1 for the exact location of Parkersburg, IA.
1
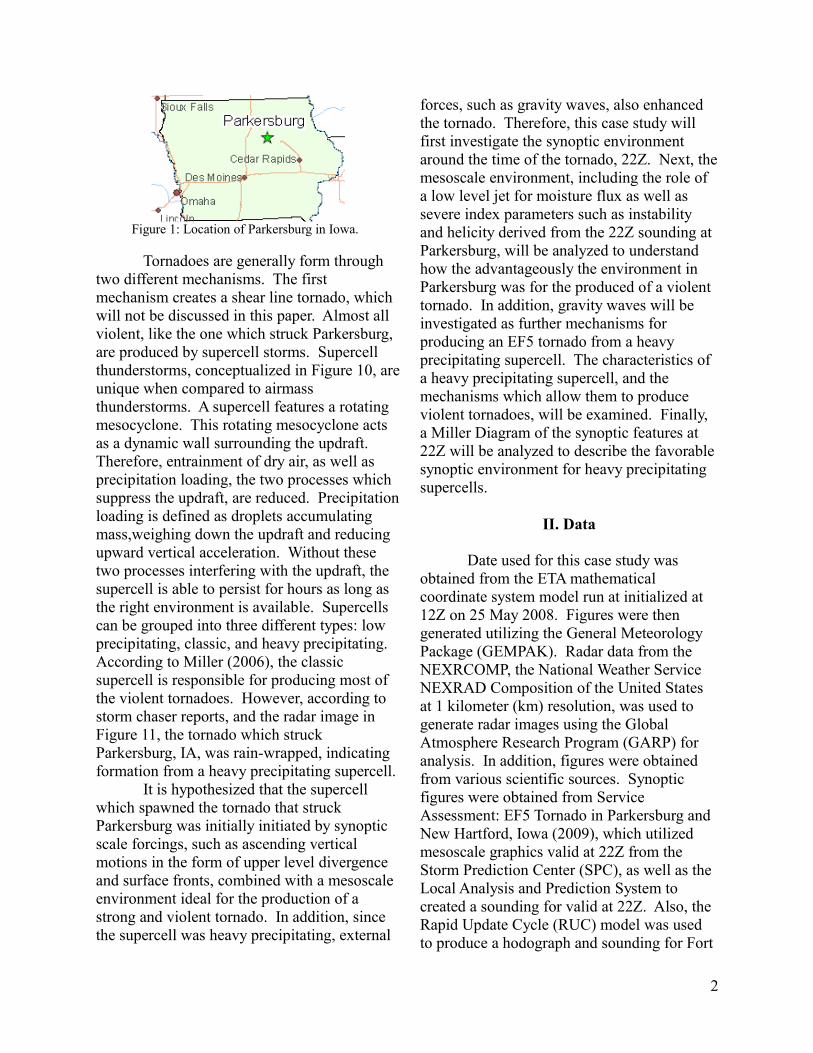
Figure 1: Location of Parkersburg in Iowa.
Tornadoes are generally form through two different mechanisms. The first mechanism creates a shear line tornado, which will not be discussed in this paper. Almost all violent, like the one which struck Parkersburg, are produced by supercell storms. Supercell thunderstorms, conceptualized in Figure 10, are unique when compared to airmass thunderstorms. A supercell features a rotating mesocyclone. This rotating mesocyclone acts as a dynamic wall surrounding the updraft. Therefore, entrainment of dry air, as well as precipitation loading, the two processes which suppress the updraft, are reduced. Precipitation loading is defined as droplets accumulating mass,weighing down the updraft and reducing upward vertical acceleration. Without these two processes interfering with the updraft, the supercell is able to persist for hours as long as the right environment is available. Supercells can be grouped into three different types: low precipitating, classic, and heavy precipitating. According to Miller (2006), the classic supercell is responsible for producing most of the violent tornadoes. However, according to storm chaser reports, and the radar image in Figure 11, the tornado which struck Parkersburg, IA, was rain-wrapped, indicating formation from a heavy precipitating supercell.
It is hypothesized that the supercell which spawned the tornado that struck Parkersburg was initially initiated by synoptic scale forcings, such as ascending vertical motions in the form of upper level divergence and surface fronts, combined with a mesoscale environment ideal for the production of a strong and violent tornado. In addition, since the supercell was heavy precipitating, external
forces, such as gravity waves, also enhanced the tornado. Therefore, this case study will first investigate the synoptic environment around the time of the tornado, 22Z. Next, the mesoscale environment, including the role of a low level jet for moisture flux as well as severe index parameters such as instability and helicity derived from the 22Z sounding at Parkersburg, will be analyzed to understand how the advantageously the environment in Parkersburg was for the produced of a violent tornado. In addition, gravity waves will be investigated as further mechanisms for producing an EF5 tornado from a heavy precipitating supercell. The characteristics of a heavy precipitating supercell, and the mechanisms which allow them to produce violent tornadoes, will be examined. Finally, a Miller Diagram of the synoptic features at 22Z will be analyzed to describe the favorable synoptic environment for heavy precipitating supercells.
II. Data
Date used for this case study was obtained from the ETA mathematical coordinate system model run at initialized at 12Z on 25 May 2008. Figures were then generated utilizing the General Meteorology Package (GEMPAK). Radar data from the NEXRCOMP, the National Weather Service NEXRAD Composition of the United States at 1 kilometer (km) resolution, was used to generate radar images using the Global Atmosphere Research Program (GARP) for analysis. In addition, figures were obtained from various scientific sources. Synoptic figures were obtained from Service Assessment: EF5 Tornado in Parkersburg and New Hartford, Iowa (2009), which utilized mesoscale graphics valid at 22Z from the Storm Prediction Center (SPC), as well as the Local Analysis and Prediction System to created a sounding for valid at 22Z. Also, the Rapid Update Cycle (RUC) model was used to produce a hodograph and sounding for Fort
2
Dodge. Other mesoscale analysis graphics were obtained from Marshall et al (2008).
III. Synoptic Analysis
22Z 25 May 2008In images obtained through the SPC
mesoscale analysis and made available by the Service Assessment: EF5 Tornado in Parkersburg and New Hartford, Iowa (2009), by 22Z on 25 May 2008, when the tornado is reportedly on the ground in Parkersburg, a region of upper level divergence is observed at 300 mb over Iowa, observed in Figure 2a. Collocated with the region of divergence is a jet streak extending northwest with a local maximum of 100 knot winds over South Dakota. According to the Service Assessment: EF5 Tornado in Parkersburg and New Hartford, Iowa (2009), this region of upper level divergence is due to the its location in the right-rear quadrant of the jet streak. However, this appears counterintuitive, since the right-rear quadrant of a jet streak is a region of upper level convergence, as indicated by crossing the k-direction with the acceleration of the wind.
Previously, at 12Z, a jet maximum of 100 knots was located in central Minnesota, with a 90 knot streak extending from South Dakota to Minnesota. Unfortunately, based on the nature of the figure from the Service Assessment: EF5 Tornado in Parkersburg and New Hartford, Iowa (2009), it is unclear whether the jet streak present at 22Z is the same jet streak present at 12Z, or if a new jet streak has formed as the one present at 12Z propagated northeastward. In addition, it is possible that, by re-orientation the jet, the right-rear of the jet is actually the left-entrance region of the jet, which experiences upper level divergence. This region could also experience divergence through other mechanisms, such as curvature, and the jet streak is merely in the vicinity of the upper level divergence. Ten hours earlier, a broad trough was be observed encompassing the western United States, extending from the California/Mexico border
through Minnesota, with a corresponding ridge peaking over Wisconsin. Due to this change in curvature, a region of upper level divergence would be observed, due to the subgeostrophic nature of the winds through the base of a trough and supergeostrophic winds through the peak of a ridge. Therefore, if this trough propagated in the ten hour, Iowa could be located in the region of upper level divergence due to curvature. Whatever the mechanism, it is apparent there is upper level divergence at 300 mb.
Another reason for this divergence is found at 500 mb, Figure 2b. Located over Iowa are embedded shortwave troughs, as determined in the black height contours. These shortwave troughs, with their local maximum in vorticity, would create positive vorticity advection (PVA) into the Parkersburg region in the westerly flow. This PVA also promotes rising motion through upper level divergence, and could also be responsible for the divergence observed at 300 mb. This upper level divergence acts as the dynamical forcing needed to induce rising motion. By the law of conservation of mass, this upper level divergence would induce ascending vertical motion from the surface to replace the evacuated mass.
At 850 mb, moisture can be observed over northwest Iowa, indicated by the high dew point temperatures observed in Figure 2c. These dew point temperatures are approximately 15 °C in the Parkersburg region. In comparison, according to Figure 4, the observed temperature of approximately 16 °C at 850 mb, indicating an atmosphere close to saturation. These dew point temperatures are also indicative of strong moisture transport, resulting from the south-southwest winds at this level. This wind direction could be the result of the surface pressure systems. During the early morning of 25 May 2008, at 12Z, the surface low pressure, now located in Minnesota as seen in Figure 2d, was located in North Dakota.. In addition, there was a region of high pressure over the eastern United
3
States. Therefore, the conjunction of the cyclonic winds around the surface low pressure and anti-cyclonic winds around the surface high pressure would produce south-southwesterly winds in the Parkersburg area. These winds fluxed the observed moisture in the region, and will be further discussed in the mesoscale analysis of the low level jet.
This moisture flux is of importance in the context of lifted air parcels. As an air parcel is lifted, it cools at the dry adiabatic lapse rate until saturation is achieved. Then the parcel cools at the moist adiabatic lapse rate, which is less steep (6.5 °C/km) than the dry adiabatic lapse rate (9.8 °C/km). The air parcel accelerate upward if the environmental lapse rate is steeper than 6.5 °C/km. However, an air parcel needs the dynamical forcing to induce
rising motion. In addition to the forcings for upward motion at 300 mb and 500 mb, Figure 2d indicates the presence of a surface warm front. Approaching warm air, depicted by the warm front, would be forced to rise over the colder and more dense air. The coincidence of this warm from with the tornado can bee see in Figure 10c. Therefore, the synoptic environment, with is dynamical forcings for ascent throughout the atmosphere, would enable parcels to reach saturation closer to the surface due to the moisture, and then rise at a less steep moist adiabatic lapse rate, also seen in the Figure 4 sounding. This ascending vertical motion, with enough energy, could produce a cloud, and the supercell which produced Parkersburg, IA, tornado is labeled with “P” in the surface analysis of Figure 2d.
Figure 2: 22Z 25 May 2008 analysis of a) 300 mb isotachs (blue) and divergence (purple), b) 500 mb heights (black), temperatures (red) and isotachs (blue), c) 850 mb height (black), temperature (red), and dew point
temperature (green), and d) surface mean sea level pressure (peach), surface observations (green), visible satellite imagery, and surface analysis. The supercell that produced the tornado which struck Parkersburg is indicated by the
cyan arrow. Image courtesy of Service Assessment: EF5 Tornado in Parkersburg and New Hartford, Iowa, 2009
4
IV. Mesoscale Analysis
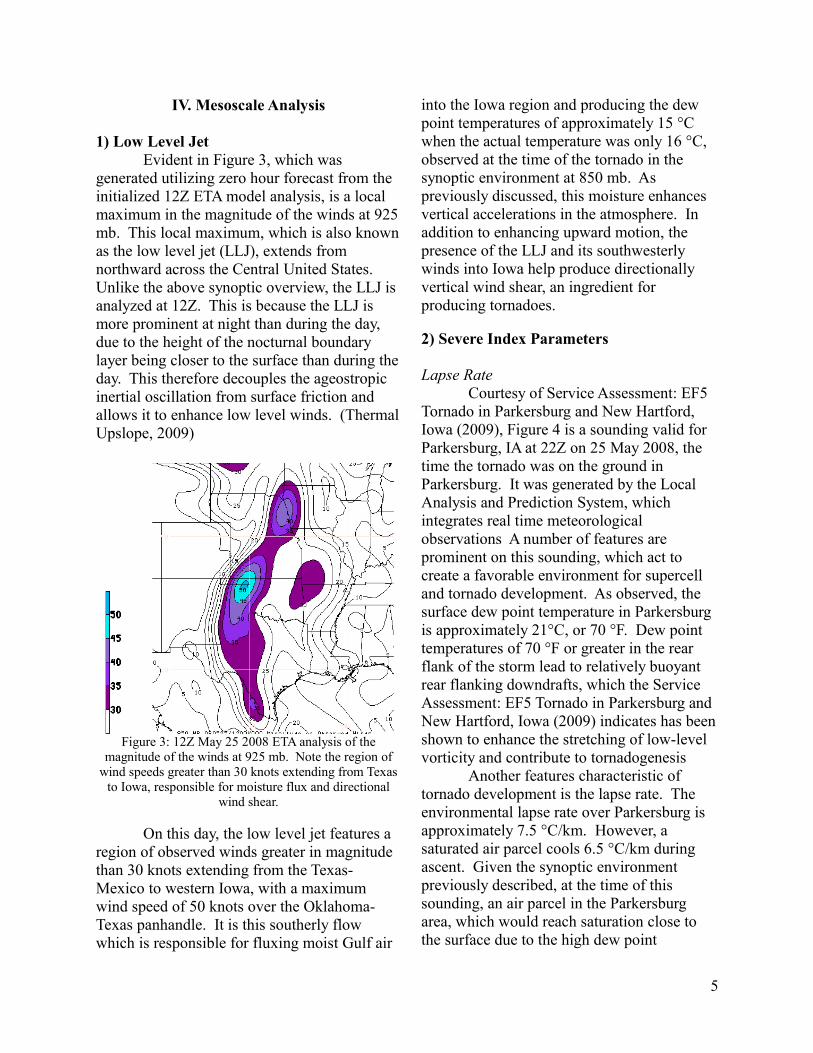
1) Low Level JetEvident in Figure 3, which was
generated utilizing zero hour forecast from the initialized 12Z ETA model analysis, is a local maximum in the magnitude of the winds at 925 mb. This local maximum, which is also known as the low level jet (LLJ), extends from northward across the Central United States. Unlike the above synoptic overview, the LLJ is analyzed at 12Z. This is because the LLJ is more prominent at night than during the day, due to the height of the nocturnal boundary layer being closer to the surface than during the day. This therefore decouples the ageostropic inertial oscillation from surface friction and allows it to enhance low level winds. (Thermal Upslope, 2009)
Figure 3: 12Z May 25 2008 ETA analysis of the magnitude of the winds at 925 mb. Note the region of
wind speeds greater than 30 knots extending from Texas to Iowa, responsible for moisture flux and directional
wind shear.
On this day, the low level jet features a region of observed winds greater in magnitude than 30 knots extending from the Texas-Mexico to western Iowa, with a maximum wind speed of 50 knots over the Oklahoma-Texas panhandle. It is this southerly flow which is responsible for fluxing moist Gulf air
into the Iowa region and producing the dew point temperatures of approximately 15 °C when the actual temperature was only 16 °C, observed at the time of the tornado in the synoptic environment at 850 mb. As previously discussed, this moisture enhances vertical accelerations in the atmosphere. In addition to enhancing upward motion, the presence of the LLJ and its southwesterly winds into Iowa help produce directionally vertical wind shear, an ingredient for producing tornadoes.
2) Severe Index Parameters
Lapse RateCourtesy of Service Assessment: EF5
Tornado in Parkersburg and New Hartford, Iowa (2009), Figure 4 is a sounding valid for Parkersburg, IA at 22Z on 25 May 2008, the time the tornado was on the ground in Parkersburg. It was generated by the Local Analysis and Prediction System, which integrates real time meteorological observations A number of features are prominent on this sounding, which act to create a favorable environment for supercell and tornado development. As observed, the surface dew point temperature in Parkersburg is approximately 21°C, or 70 °F. Dew point temperatures of 70 °F or greater in the rear flank of the storm lead to relatively buoyant rear flanking downdrafts, which the Service Assessment: EF5 Tornado in Parkersburg and New Hartford, Iowa (2009) indicates has been shown to enhance the stretching of low-level vorticity and contribute to tornadogenesis
Another features characteristic of tornado development is the lapse rate. The environmental lapse rate over Parkersburg is approximately 7.5 °C/km. However, a saturated air parcel cools 6.5 °C/km during ascent. Given the synoptic environment previously described, at the time of this sounding, an air parcel in the Parkersburg area, which would reach saturation close to the surface due to the high dew point
5

temperatures, would cool less quickly than its surroundings. Therefore, the warmer parcel would continue to to rise, since warm air rises. A moderate to steep lapse, like the one observed in Figure 4, one of the environmental factors Miller (2006) cites as favorable significant tornado development. Other
environmental factors Miller (2006) suggests are favorable for significant tornado development, such as decreasing mixing rations in the lowest 1 km above ground level and a surface mixing ration of at least 15 g/kg, are also met by the Parkersburg sounding.
Figure 4: 22Z sounding for 25 May 2008 at Parkersburg, IA generated by the Local Analysis and Prediction System. Image courtesy of Service Assessment: EF5 Tornado in Parkersburg and New Hartford, Iowa, 2009
Instability
As evident by the dashed line in the above sounding, representing an adiabatically lifted air parcel from the surface, there is a substantial amount of instability in the Parkersburg region at the time of this sounding. Severe indices are helpful in quantifying the tornado threat resulting from this instability.
The lifted index, which calculates a parcel rising adiabatically from the surface to 500 mb, is -7. This value indicates that severe thunderstorms are probable and tornadoes are possible. Additionally, the Severe Weather Index, which accounts for both directional and speed wind shear between 850 mb and 500 mb as well as temperature and moisture, also
6

indicates the possibility of severe thunderstorms and potential tornadoes. In fact, of all the severe weather calculated for this sounding, including Total's Total and the K Index, only the Cross's Total, which measures the buoyancy of an air parcel but accounts for a moisture at 850 mb because moist air is less dense than dry air, was not above the highest threshold value for the Parkersburg sounding. This therefore indicates the strong potential for severe storms. Different indices account for difference factors in severe weather production: wind shear , moisture, and temperature. Since every index calculated, except one, was maxed out, most of the necessary factors for tornado production are present in Parkersburg.
Instability can also be measured through the convective available potential energy (CAPE) and convective inhibition (CIN). The presence of CAPE acts to accelerate air parcels upward, and the updraft speed can be calculated by taking the derivative of the CAPE, the square root of 2*CAPE. CIN acts to inhibit ascending motion. Therefore, by increasing the amount of CAPE, while decreasing the amount of CIN, convection would be intensified. The sounding in Figure 4 features a large amount of CAPE with little CIN.
Figure 5: Mid-level CAPE (contoured in red) and Mid-level CIN (shaded) for 22Z 25 May 2008. Note the large
value of CAPE with little value of CIN. Image courtesy of Service Assessment: EF5 Tornado in Parkersburg and New
Hartford, Iowa, 2009.
As indicated in Figure 5, the mid-level CAPE values in the Parkersburg region at the
time of the tornado increased to approximately 3000 J/kg. (Service Assessment: EF5 Tornado in Parkersburg and New Hartford, Iowa, 2009) In addition, at 20Z, 100 mb mixed level CAPE was approximately 2300 J/kg (Marshall et al, 2008). Combined with less than 25 J/kg of CIN, the height of the Level of Free Convection (LFC) was less than 1500 meters. In combination, these value are “well within the range of concern for strong and violent tornadoes, according to the research of Rasmussen (2003), Edwards et al. (2003), Davies (2002) and others,” (Marshall et al., 2008). In addition to the observed CAPE and CIN, the Bulk Shear associated with this sounding in the 0-6 km layer was 55 knots, and the 0-1 km shear was 27 knots. These factors would all act to enhance the potential for a significant tornado like the one experienced in Parkersburg at this time. (Marshall et al., 2008).
Veering Winds with HeightIn addition to the instability seen on
the sounding in Figure 4, wind shear values were also “ well within the range of concern for strong and violent tornadoes.” This shear in the wind, either with height or with time, is known as helicity. Winds at the surface of Parkersburg were reportedly from the south at approximately 5 knots at the time of the tornado. However, as height increases, the winds then proceed to veer, becoming south-southwesterly around 850 mb, as previously observed in the synoptic scale at 22Z, and then were westerly by the middle atmosphere, as seen at 500 mb synoptic set-up at 22Z. This veering of wind with height is captured in Figure 6, a forecast hodograph created by the RUC model, valid at the time of the tornado for Waterloo, IA, 23 miles east of Parkersburg. This hodograph, obtained from Service Assessment: EF5 Tornado in Parkersburg and New Hartford, Iowa (2009), is characterized by a distinct 90° angle, described as a “sickle” shape. According to
7
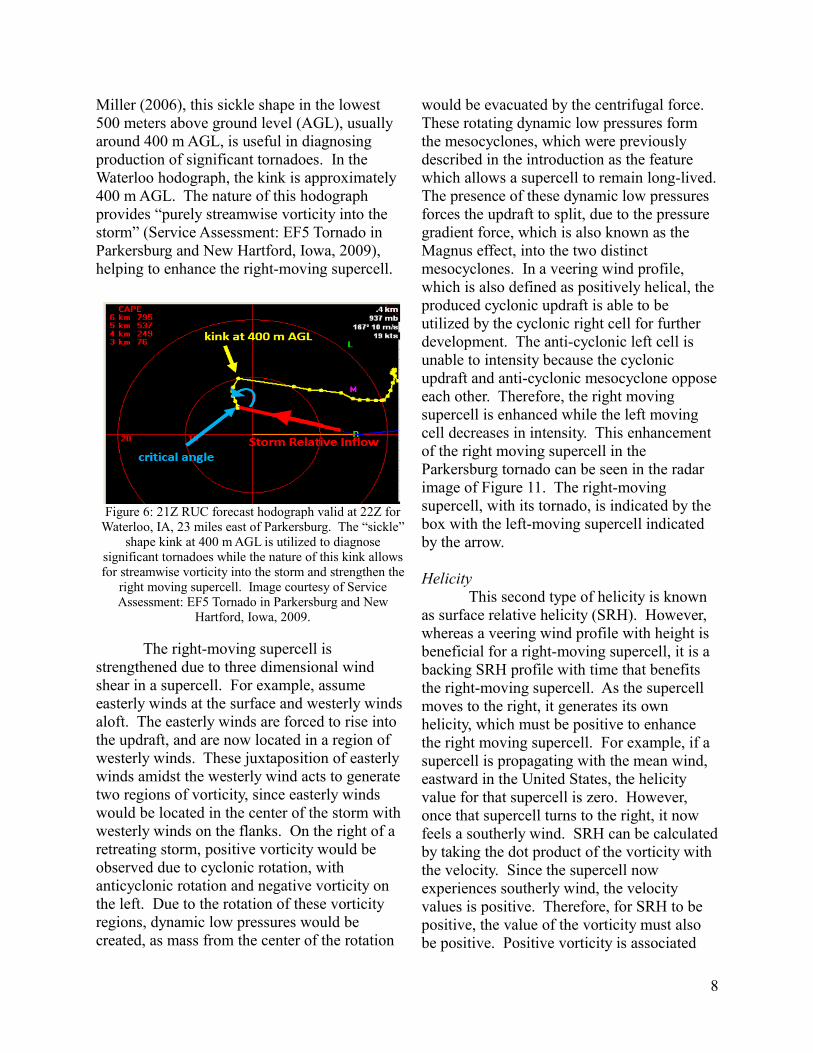
Miller (2006), this sickle shape in the lowest 500 meters above ground level (AGL), usually around 400 m AGL, is useful in diagnosing production of significant tornadoes. In the Waterloo hodograph, the kink is approximately 400 m AGL. The nature of this hodograph provides “purely streamwise vorticity into the storm” (Service Assessment: EF5 Tornado in Parkersburg and New Hartford, Iowa, 2009), helping to enhance the right-moving supercell.
Figure 6: 21Z RUC forecast hodograph valid at 22Z for Waterloo, IA, 23 miles east of Parkersburg. The “sickle”
shape kink at 400 m AGL is utilized to diagnose significant tornadoes while the nature of this kink allows for streamwise vorticity into the storm and strengthen the
right moving supercell. Image courtesy of Service Assessment: EF5 Tornado in Parkersburg and New
Hartford, Iowa, 2009.
The right-moving supercell is strengthened due to three dimensional wind shear in a supercell. For example, assume easterly winds at the surface and westerly winds aloft. The easterly winds are forced to rise into the updraft, and are now located in a region of westerly winds. These juxtaposition of easterly winds amidst the westerly wind acts to generate two regions of vorticity, since easterly winds would be located in the center of the storm with westerly winds on the flanks. On the right of a retreating storm, positive vorticity would be observed due to cyclonic rotation, with anticyclonic rotation and negative vorticity on the left. Due to the rotation of these vorticity regions, dynamic low pressures would be created, as mass from the center of the rotation
would be evacuated by the centrifugal force. These rotating dynamic low pressures form the mesocyclones, which were previously described in the introduction as the feature which allows a supercell to remain long-lived. The presence of these dynamic low pressures forces the updraft to split, due to the pressure gradient force, which is also known as the Magnus effect, into the two distinct mesocyclones. In a veering wind profile, which is also defined as positively helical, the produced cyclonic updraft is able to be utilized by the cyclonic right cell for further development. The anti-cyclonic left cell is unable to intensity because the cyclonic updraft and anti-cyclonic mesocyclone oppose each other. Therefore, the right moving supercell is enhanced while the left moving cell decreases in intensity. This enhancement of the right moving supercell in the Parkersburg tornado can be seen in the radar image of Figure 11. The right-moving supercell, with its tornado, is indicated by the box with the left-moving supercell indicated by the arrow.
HelicityThis second type of helicity is known
as surface relative helicity (SRH). However, whereas a veering wind profile with height is beneficial for a right-moving supercell, it is a backing SRH profile with time that benefits the right-moving supercell. As the supercell moves to the right, it generates its own helicity, which must be positive to enhance the right moving supercell. For example, if a supercell is propagating with the mean wind, eastward in the United States, the helicity value for that supercell is zero. However, once that supercell turns to the right, it now feels a southerly wind. SRH can be calculated by taking the dot product of the vorticity with the velocity. Since the supercell now experiences southerly wind, the velocity values is positive. Therefore, for SRH to be positive, the value of the vorticity must also be positive. Positive vorticity is associated
8
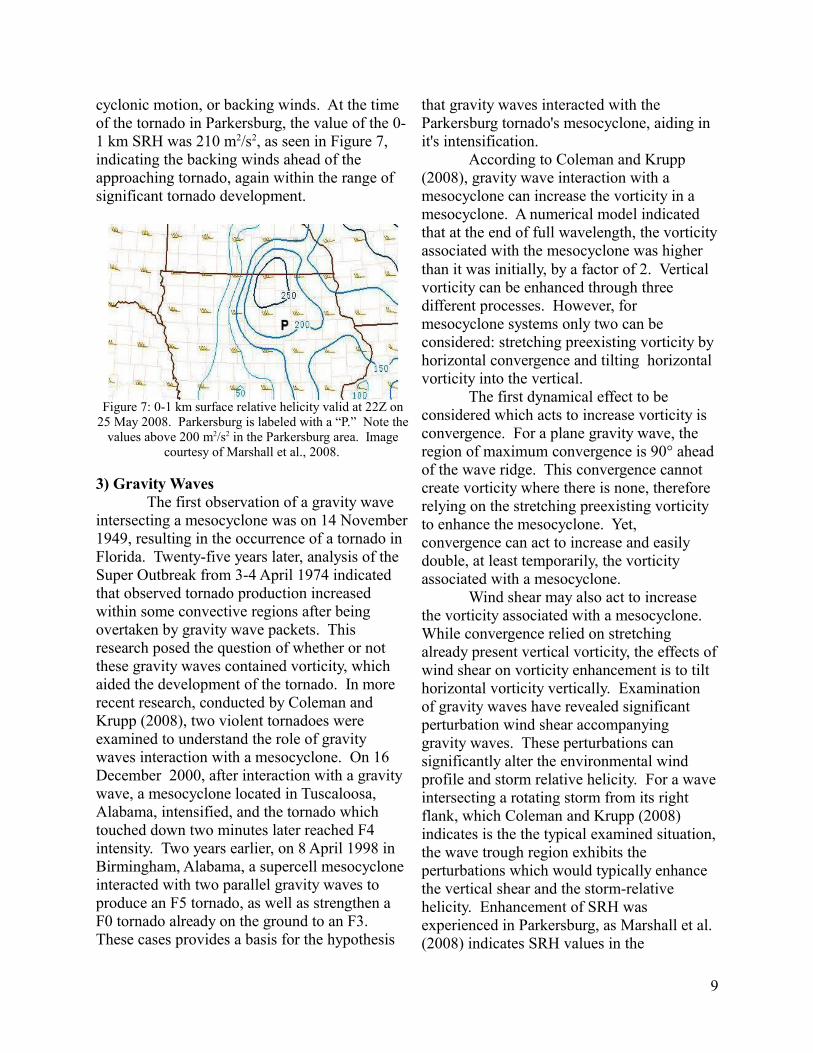
cyclonic motion, or backing winds. At the time of the tornado in Parkersburg, the value of the 0-1 km SRH was 210 m2/s2, as seen in Figure 7, indicating the backing winds ahead of the approaching tornado, again within the range of significant tornado development.
Figure 7: 0-1 km surface relative helicity valid at 22Z on 25 May 2008. Parkersburg is labeled with a “P.” Note the
values above 200 m2/s2 in the Parkersburg area. Image courtesy of Marshall et al., 2008.
3) Gravity Waves The first observation of a gravity wave
intersecting a mesocyclone was on 14 November 1949, resulting in the occurrence of a tornado in Florida. Twenty-five years later, analysis of the Super Outbreak from 3-4 April 1974 indicated that observed tornado production increased within some convective regions after being overtaken by gravity wave packets. This research posed the question of whether or not these gravity waves contained vorticity, which aided the development of the tornado. In more recent research, conducted by Coleman and Krupp (2008), two violent tornadoes were examined to understand the role of gravity waves interaction with a mesocyclone. On 16 December 2000, after interaction with a gravity wave, a mesocyclone located in Tuscaloosa, Alabama, intensified, and the tornado which touched down two minutes later reached F4 intensity. Two years earlier, on 8 April 1998 in Birmingham, Alabama, a supercell mesocyclone interacted with two parallel gravity waves to produce an F5 tornado, as well as strengthen a F0 tornado already on the ground to an F3. These cases provides a basis for the hypothesis
that gravity waves interacted with the Parkersburg tornado's mesocyclone, aiding in it's intensification.
According to Coleman and Krupp (2008), gravity wave interaction with a mesocyclone can increase the vorticity in a mesocyclone. A numerical model indicated that at the end of full wavelength, the vorticity associated with the mesocyclone was higher than it was initially, by a factor of 2. Vertical vorticity can be enhanced through three different processes. However, for mesocyclone systems only two can be considered: stretching preexisting vorticity by horizontal convergence and tilting horizontal vorticity into the vertical.
The first dynamical effect to be considered which acts to increase vorticity is convergence. For a plane gravity wave, the region of maximum convergence is 90° ahead of the wave ridge. This convergence cannot create vorticity where there is none, therefore relying on the stretching preexisting vorticity to enhance the mesocyclone. Yet, convergence can act to increase and easily double, at least temporarily, the vorticity associated with a mesocyclone.
Wind shear may also act to increase the vorticity associated with a mesocyclone. While convergence relied on stretching already present vertical vorticity, the effects of wind shear on vorticity enhancement is to tilt horizontal vorticity vertically. Examination of gravity waves have revealed significant perturbation wind shear accompanying gravity waves. These perturbations can significantly alter the environmental wind profile and storm relative helicity. For a wave intersecting a rotating storm from its right flank, which Coleman and Krupp (2008) indicates is the the typical examined situation, the wave trough region exhibits the perturbations which would typically enhance the vertical shear and the storm-relative helicity. Enhancement of SRH was experienced in Parkersburg, as Marshall et al. (2008) indicates SRH values in the
9

Parkersburg region increased from 140 m2/s2 two hour before the tornado to 210 m2/s2, potentially due to a gravity wave interaction.
Characteristic synoptic scale patterns exist when gravity waves occur. According to Koch and O’Handley (1997), in a climatological study of 13 published cases of gravity waves, gravity waves were found to occur in a region of diffluence, with a 300 mb ridge axis to the northeast, the 300 mb inflection axis to the southwest, and a surface frontal boundary to the southeast. Synoptic analysis at 12Z and 00Z (not shown) indicate that Iowa the region of the 300 mb ridge-trough pattern associated with gravity wave initiation. In addition, Koch and O’Handley (1997) state that the jet streak is seen to propagate away from the 300 mb trough axis towards the inflection point in gravity wave initiation. While this definition seems unclear, according to Service Assessment: EF5 Tornado in Parkersburg and New Hartford, Iowa (2009), a visible satellite image (not shown) indicates a gravity wave initiated in the right-rear quadrant of the 300 mb jet, a region favorable to gravity wave initiation.
In addition to the favorable upper level pattern for the development of gravity waves, the environment at the surface in northeast Iowa also favors gravity wave production. As seen in Figure 8a, a stable layer between 850 mb and 800 mb was observed above Fort Dodge, IA, approximately 80 miles west of Parkersburg, at 17Z. This stable layer is conducive to gravity waves, as the waves would be unable to propagate through the stable inversion and therefore become trapped, or ducted. Three hours later, when a gravity wave was experienced, storms fired just east of Fort Dodge as the gravity waves propagated through. The ability for a gravity wave to become ducted can also be assessed by the duct factor. As explained by Koch and O’Handley (1997), the duct factor is an equation which accounts for the difference in potential temperature from 800 mb to 950 mb as well as the difference in equivalent potential temperature from 800 mb to 400 mb. It can be seen in the below equation.
DF = Θ(800) − Θ(950) + Θe(800) − Θe(400)
The reasoning for this equations, as Koch and O’Handley (1997) explains, is the fact that an efficient duct is one where there exists a conditionally unstable layer above a very stable surface based layer. As seen in Figure 10b, the value of the duct factor for Parkersburg at 22Z is approaching 20 °C, which is considered more than favorable for gravity wave development and propagation, according to EF5 Tornado in Parkersburg and New Hartford, Iowa (2009).
As hypothesized, gravity waves were indeed experienced in the Parkersburg region during tornado development. By 21:40Z, 8 minuted before the initial tornado developed, the leading gravity wave, indicated by the yellow dashed line, had propagated eastward of the tornado development area, as seen in Figure 8c. As the lead gravity wave propagated northeast through Parkersburg, a second gravity wave becomes evident on the visible image. Figure 8d, a composition of visible satellite, as well as radar data, from the National Weather Service WSR-88D captures this second gravity wave. The tornado developed just after the second gravity wave, indicated by the yellow dashed line in Figure 8d, passed. The location of the tornado is expressed by the yellow “T.”
Gravity waves can be indistinguishable from outflow boundaries on visible and radar images. However, surrounding surface analysis indicate the observed features are not outflow boundaries, Neither temperature, dew point temperature, nor wind speed and direction record any significant changes. Since the stable layer necessary for continued ducting of the gravity waves, as seen in Figure 8a, was elevated, the gravity waves were likely elevated as well. So, this could explain why there were no substantial changes in surface observations as both waves moved through the Parkersburg region. However, for further verification of the present gravity waves, observations at the
10
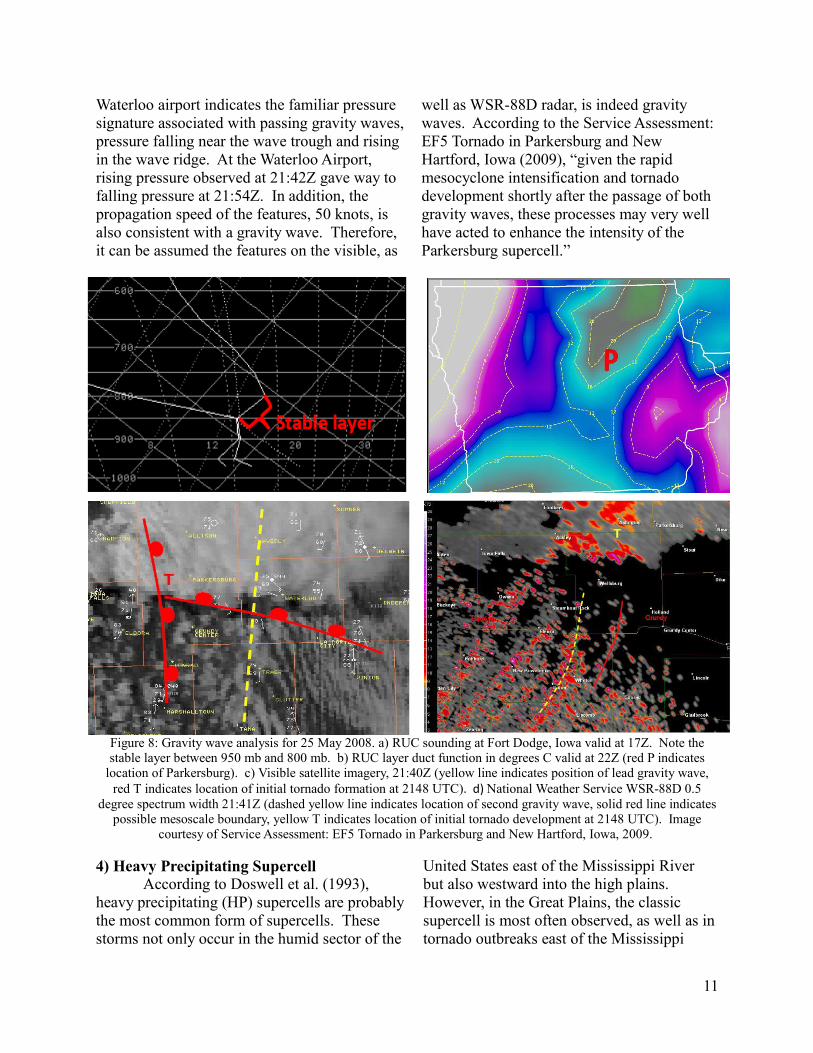
Waterloo airport indicates the familiar pressure signature associated with passing gravity waves, pressure falling near the wave trough and rising in the wave ridge. At the Waterloo Airport, rising pressure observed at 21:42Z gave way to falling pressure at 21:54Z. In addition, the propagation speed of the features, 50 knots, is also consistent with a gravity wave. Therefore, it can be assumed the features on the visible, as
well as WSR-88D radar, is indeed gravity waves. According to the Service Assessment: EF5 Tornado in Parkersburg and New Hartford, Iowa (2009), “given the rapid mesocyclone intensification and tornado development shortly after the passage of both gravity waves, these processes may very well have acted to enhance the intensity of the Parkersburg supercell.”
Figure 8: Gravity wave analysis for 25 May 2008. a) RUC sounding at Fort Dodge, Iowa valid at 17Z. Note the stable layer between 950 mb and 800 mb. b) RUC layer duct function in degrees C valid at 22Z (red P indicates
location of Parkersburg). c) Visible satellite imagery, 21:40Z (yellow line indicates position of lead gravity wave, red T indicates location of initial tornado formation at 2148 UTC). d) National Weather Service WSR-88D 0.5
degree spectrum width 21:41Z (dashed yellow line indicates location of second gravity wave, solid red line indicates possible mesoscale boundary, yellow T indicates location of initial tornado development at 2148 UTC). Image
courtesy of Service Assessment: EF5 Tornado in Parkersburg and New Hartford, Iowa, 2009.
4) Heavy Precipitating Supercell According to Doswell et al. (1993),
heavy precipitating (HP) supercells are probably the most common form of supercells. These storms not only occur in the humid sector of the
United States east of the Mississippi River but also westward into the high plains. However, in the Great Plains, the classic supercell is most often observed, as well as in tornado outbreaks east of the Mississippi
11

River. Therefore, the classic supercell also “probably accounts for the majority of violent (F4-5) tornadoes” (Doswell et al. 1993).
The difference between a heavy precipitating supercell and classic supercell can be seen conceptual models, Figures 9 and 10. For the HP supercell, heavy precipitation is experienced, with the mesocyclone embedded within the precipitation region of the storm, as seen in the precipitation surrounding the wall cloud in Figure 9. However, while classic supercell features moderate precipitation, seen in Figure 10, light to no precipitation is experienced in the mesocyclone. During the collapse of a classic supercell, the mesocyclone may fill with precipitation. However, is not considered a transition to a HP supercell unless the mesocyclone persists amidst the precipitation. (Doswell et al., 1993)
Due to the precipitation surrounding the mesocyclone, the tornadoes produced by HP supercells are not usually long-lived. According to Kulie et al. (1997), if middle tropospheric storm-relative winds are weak, precipitation does not fall downwind of the updraft. Therefore, the mesocyclone is allowed to be
located within the heavy precipitation. When this happens, the baroclinic generation of vorticity at low levels is enhanced, therefore creating a low level mesocyclone. However, due to the strength of the outflow, the storm's main updraft is cut off and this mesocyclone is short lived, and long-lived tornadoes are not typically produced.
Figure 9: Conceptual model of a heavy precipitating supercell courtesy of Doswell et al. (1993). Note the precipitation surrounding the mesocyclone, inhibiting
the formation of long-lived and violent tornadoes.
12
Figure 10: Conceptual model of a classic supercell based on adapted from Lecture 3 (2009). Flow patterns include the Rear Flanking Downdraft (RFD), Forward Flanking Downdraft (FFD), and updraft. Note the lack of
precipitation with respect to the mesocyclone and updraft when compared with the precipitation wrapped wall cloud in the heavy precipitating supercell.
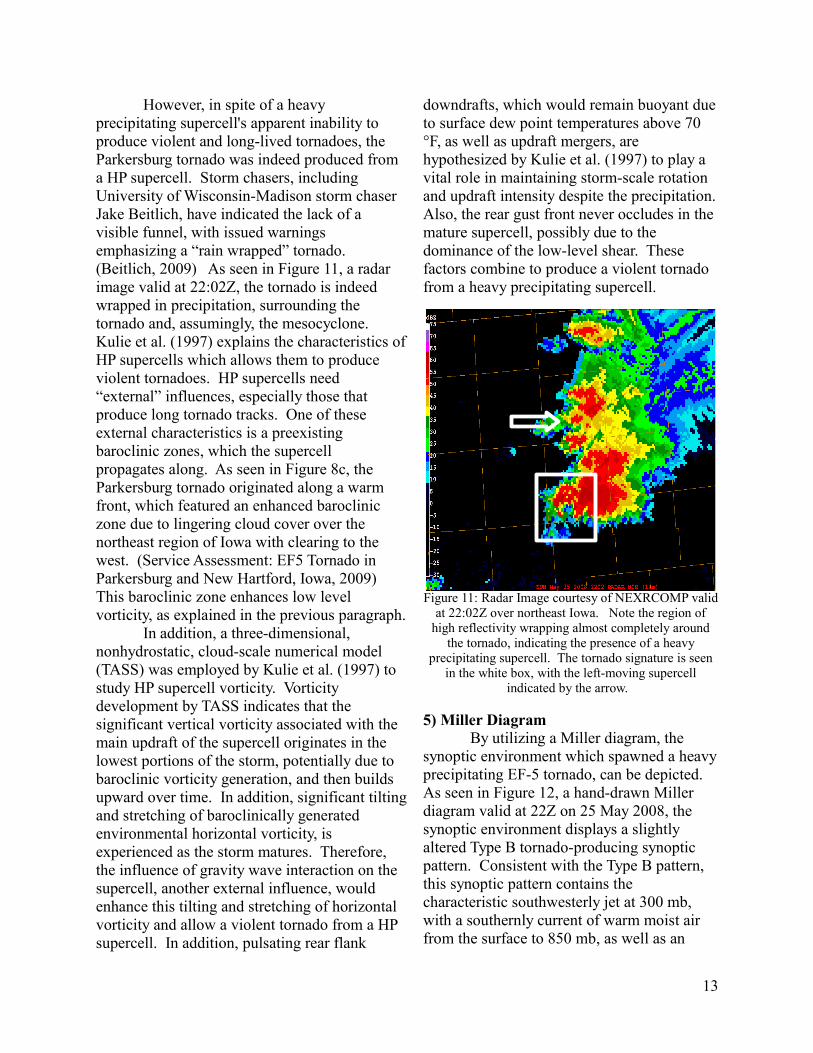
However, in spite of a heavy precipitating supercell's apparent inability to produce violent and long-lived tornadoes, the Parkersburg tornado was indeed produced from a HP supercell. Storm chasers, including University of Wisconsin-Madison storm chaser Jake Beitlich, have indicated the lack of a visible funnel, with issued warnings emphasizing a “rain wrapped” tornado. (Beitlich, 2009) As seen in Figure 11, a radar image valid at 22:02Z, the tornado is indeed wrapped in precipitation, surrounding the tornado and, assumingly, the mesocyclone. Kulie et al. (1997) explains the characteristics of HP supercells which allows them to produce violent tornadoes. HP supercells need “external” influences, especially those that produce long tornado tracks. One of these external characteristics is a preexisting baroclinic zones, which the supercell propagates along. As seen in Figure 8c, the Parkersburg tornado originated along a warm front, which featured an enhanced baroclinic zone due to lingering cloud cover over the northeast region of Iowa with clearing to the west. (Service Assessment: EF5 Tornado in Parkersburg and New Hartford, Iowa, 2009) This baroclinic zone enhances low level vorticity, as explained in the previous paragraph.
In addition, a three-dimensional, nonhydrostatic, cloud-scale numerical model (TASS) was employed by Kulie et al. (1997) to study HP supercell vorticity. Vorticity development by TASS indicates that the significant vertical vorticity associated with the main updraft of the supercell originates in the lowest portions of the storm, potentially due to baroclinic vorticity generation, and then builds upward over time. In addition, significant tilting and stretching of baroclinically generated environmental horizontal vorticity, is experienced as the storm matures. Therefore, the influence of gravity wave interaction on the supercell, another external influence, would enhance this tilting and stretching of horizontal vorticity and allow a violent tornado from a HP supercell. In addition, pulsating rear flank
downdrafts, which would remain buoyant due to surface dew point temperatures above 70 °F, as well as updraft mergers, are hypothesized by Kulie et al. (1997) to play a vital role in maintaining storm-scale rotation and updraft intensity despite the precipitation. Also, the rear gust front never occludes in the mature supercell, possibly due to the dominance of the low-level shear. These factors combine to produce a violent tornado from a heavy precipitating supercell.
Figure 11: Radar Image courtesy of NEXRCOMP valid at 22:02Z over northeast Iowa. Note the region of
high reflectivity wrapping almost completely around the tornado, indicating the presence of a heavy
precipitating supercell. The tornado signature is seen in the white box, with the left-moving supercell
indicated by the arrow.
5) Miller DiagramBy utilizing a Miller diagram, the
synoptic environment which spawned a heavy precipitating EF-5 tornado, can be depicted. As seen in Figure 12, a hand-drawn Miller diagram valid at 22Z on 25 May 2008, the synoptic environment displays a slightly altered Type B tornado-producing synoptic pattern. Consistent with the Type B pattern, this synoptic pattern contains the characteristic southwesterly jet at 300 mb, with a southernly current of warm moist air from the surface to 850 mb, as well as an
13

upper level trough (not depicted in Figure 12). However, unlike the Miller diagram Type B synoptic pattern, the synoptic environment at 22Z on 25 May 2008 does not feature low-level intrusion of dry air. Instead, the dry air is confined to the region west of the surface cold front. This confinement allows moisture to extend to 700 mb. In addition, the synoptic pattern depicted in Figure 12 features convection along the warm front, instead of the cold front described by the Type B synoptic pattern in Miller (1972).
The hybrid Type B synoptic environment, depicted by the Miller diagram in Figure 12, is consistent with the synoptic environment characteristic for the development of heavy precipitating supercells. According to Structure and Dynamics of Supercell Thunderstorms (2005), HP supercells occur in environments with rich low-level moisture and
moderate-to-strong wind shear. As seen in Figure 12, a moisture tongue is present at 850 mb, due to a southerly low level jet bring moist air from the Gulf of Mexico into the region. This moisture at 850 mb also extends to 700 mb to produce an environment rich in low-level moisture. In addition, both directional and speed shear is observed at 22Z on 25 May 2008 in Figure 12. Wind speeds associated with the low level jet at 850 mb reach a maximum of 30 knots from the south-southwest. At 500 mb, wind speeds increase to 50 knots from the west, providing the necessary speed and directional wind shear to produce a heavy precipitating supercell. A 90 knot southwesterly jet is also observed at 300 mb. While this shear due to the 300 mb is not entirely necessary for tornado formation, since bulk shear is only considered from 0-6 km AGL, this jet at 300 mb provides a
14
Figure 12: Miller diagram valid at 22Z on 25 May 2008. Analyzed features include surface fronts (penciled), 850 mb moisture tongue (green) and low level jet maximum and direction (red arrow), 700 mb moisture (solid brown
line) and dryline (dashed brown line), 500 mb wind maximum and direction (blue striped), and 300 mb jet maximum and direction (purple checked). Region of severe weather threat is indicated in black. Note the low-
level moisture extending to 700 mb, as well as wind shear, creating a characteristic of environment production of heavy precipitating supercells.
favorable region for gravity wave initiation, which intensifies a mesocyclone upon interaction. Therefore, these synoptic features combined to produce a threat area associated with the surface warm front, a region characteristic of transitory mesocyclones associated with warm front in a Type B synoptic pattern depicted by Miller (1972) and consistent with the environment in which HP supercells occur.
V. Conclusion
As hypothesized, the tornado, which devastated the town of Parkersburg on 25 May 2008 and originated from a heavy precipitating supercell, formed in the perfect environment for significant tornado development and was further enhanced by interactions with gravity waves. At the upper levels, divergence combined with a surface warm front to provide dynamical lifting for air parcels. These air parcels quickly reached saturation, due to moisture fluxed into the region from the low level jet. Due to a moderate lapse rate seen in the LAPS sounding from Parkersburg, the saturated parcels cooled less than the surrounding environment, and were able to rise in the conditionally unstable enviroment. In addition to the lapse rate, instability, observed in the ratio of convective available potential energy to convective inhibition and depicted in severe index parameters, was “well within the range of concern for strong and violent tornadoes,” (Marshall et al., 2008). This instability combined with positive helicity, in the form of veering wind direction with height and backing wind direction with time, to further strengthen the right moving supercell.
In addition to the favorable synoptic and mesoscale environment, gravity wave interaction with the mesocyclone also heightened the possibility of a violent tornado. Gravity waves act to enhance the vorticity associated with a mesocyclone, through either stretching preexisting vorticity by horizontal convergence or tilting horizontal vorticity into
the vertical direction. Prior to tornado development, the Parkersburg mesocyclone interacted with two gravity waves. According to the Service Assessment: EF5 Tornado in Parkersburg and New Hartford, Iowa (2009), “given the rapid mesocyclone intensification and tornado development shortly after the passage of both gravity waves, these processes may very well have acted to enhance the intensity of the Parkersburg supercell.” The increase in vorticity generated by the two gravity waves acted as external forces, along with a surface warm front, to allow a heavy precipitating supercell to produce a violent tornado despite the precipitation surrounding the mesocyclone. This violent tornado, with maximum winds estimated at 205 miles per hour, would claim 8 lives in its 43 mile path in Iowa's first EF-5 tornado since 1976.
V1. Acknowledgments
The author of this paper would like to thank Michael Phillips for his insight on gravity wave interactions with mesocyclones and Bryan Heth for his help in the synoptic analysis and Miller diagram for this storm, as well as other classmates for their assistance with this paper. In addition, special thanks to Dan Henz and Professor Greg Tripoli from UW-Madison for their insight into tornado development, Jeff Duda from Iowa State for his assistance in obtaining initial information about the Parkersburg tornado, as well as Pete Pokrandt for obtaining data for synoptic and mesoscale analysis.
VII. References
Beitlich, J. Personal Interview, 27 April 2009
Cogil, C. and J. Johnson, 2008: Iowa Tornado Climatology [internet] National Oceanic and Atmospheric Administration; [cited 26 April 2009]. Available from http://www.images/
15

dmx/IowaTorClimatologyFinal-2008.pdf
Coleman T.A., and K.R. Knupp: 2008: The Interaction of Gravity Waves with Tornadoes and Mesocyclones: Theories and Observations. [internet] American Meteorological Society Conference; [cited 2 May 2009] Available from http://ams.confex.com/ams/pdfpapers/115242.pdf
Doswell, C.A. III, and D.W. Burgess, 1993: Tornadoes and Tornadic Storms: A Review of Conceptual Models. The Tornado: Its Structure, Dynamics, Prediction, and Hazards, Geophysical Monograph 79, Amer. Geophys. Union, 161-172.
Koch, S. E., and C. O’Handley, 1997: Operational Forecasting and Detectionof Mesoscale Gravity Waves. Wea. Forecasting, 12, 253-281.
Kulie, M.S., and Y-L Lin, 1997: The Structureand Evolution of a Numerically Simulated High-Precipitation Supercell Thunderstorm. Monthly Weather Review, 126, 2090-2116.
Marshall, T. P., K. A., Jungbluth, and A. Baca, 2008: The Parkersburg, IA Tornado: 25 May 2008 [internet] AmericanMeteorological Society Conference; [cited 28 April 2009]. Available fromhttp://ams.confex.com/ams/pdfpapers/141533.pdf
Miller, D. J., 2006: Observations of low level thermodynamic and wind shear profiles on significant tornado days. Preprints, 23rd Conf. on Severe Local
Storms, St. Louis, MO, Amer. Meteor. Soc., 1206-1223.
Miller, R.C., 1972: Notes on Analysis and Severe-Storm Forecasting Procedures of the Air Force Global Weather Central. Air Weather Service, 1-23.
Parkersburg - New Hartford - Dunkerton EF5 Tornado of May 25, 2008 [internet] [24 June 2008] National Oceanic and Atmospheric Administration; [cited 26 April 2009]. Available from http://www.crh.noaa.gov/dmx/?n=parkersburg
Service Assessment: EF5 Tornado in Parkersburg and New Hartford, Iowa [internet] [January 2009] NationalOceanic and Atmospheric Administration; [cited 26 April 2009]. Available from http://www.crh.noaa.gov/images/dmx/ParkersburgSvcAssmntfinal.pdf
Structure and Dynamics of Supercell Thunderstorms. [internet] [updated 3 Nov 2005] National Weather Service:Louisville. [cited 3 May 2009] Available from http://www.crh.noaa.gov/lmk/soo/docu/supercell.php
Tripoli, G, 2009: Thermal Upslope/Dryline [internet] AOS 453 Lectures; [cited 30 March 2009] Available from http:// www.aos.wisc.edu/~aos452/lectures09.html
---: 2009: Lecture 3 [internet] AOS 453 Lectures; [cited 30 March 2009] Available fromhttp://www.aos.wisc.edu/~aos452/lectures09.html
16