the other mdg report 2010 philippines
TRANSCRIPT


Winning the Numbers, Losing the War:
The Other MDG Report 2010

WINNING THE NUMBERS, LOSING THE WARThe Other MDG Report 2010
Copyright © 2010 SOCIAL WATCH PHILIPPINES andUNITED NATIONS DEVELOPMENT PROGRAMME (UNDP)All rights reserved
Social Watch Philippines and the United Nations Development Programme (UNDP) encourage the use, translation, adaptation and copying of this material for non-commercial use, with appropriate credit given to Social Watch and UNDP. Inquiries should be addressed to:
Social Watch PhilippinesRoom 140, Alumni Center, University of the Philippines, Diliman, Quezon City, PHILIPPINES 1101Telefax: +63 02 4366054Email address: [email protected]: http://www.socialwatchphilippines.org
The views expressed in this book are those of the authors’ and do not necessarily refl ect the views and policies of the United Nations Development Programme (UNDP).
Editorial Board: LEONOR MAGTOLIS BRIONESISAGANI SERRANOJESSICA CANTOSMARIVIC RAQUIZARENE RAYA
Editorial Team:Editor : ISAGANI SERRANOCopy Editor : SHARON TAYLORCoordinator : JANET CARANDANGEditorial Assistant : ROJA SALVADOR RESSURECCION BENOZA ERICSON MALONZO Book Design:Cover Design : LEONARD REYESLayout : NANIE GONZALES
Photos contributed by: Isagani Serrano, Global Call To Action Against Poverty – Philippines, Medical Action Group, Kaakbay, Alain Pascua, Joe Galvez, Micheal John David, May-I Fabros

Winning the Numbers, Losing the War: The Other MDG Report 2010 iii
ACKNOWLEDGEMENT
Many deserve our thanks for the production of this shadow report. Indeed there are so many of them that our attempt to make a list runs the risk of missing names.
Social Watch Philippines is particularly grateful to the United Nations Millennium Campaign (UNMC), the United Nations Development Programme (UNDP), the Millennium Development Goals Achievement Fund (MDG-F) and the HD2010 Platform for supporting this project with useful advice and funding. We are also grateful to the National Economic Development Authority (NEDA), especially its Social Development Com-mittee, for involving us in at least two consultations on the offi cial report, the Philippines Fourth Progress Report on the Millennium Development Goals (MDGs) 2010, which to us is the government’s most impressive MDG report yet, considering the quality of its database and assessment.
We dare to make a long list of organizations and individuals who participated in different consultations organized by Social Watch Philippines and separately by the different authors of the articles composing our shadow report. Based on the list we have compiled we would like to acknowledge the following: Assalam Bangsa Moro People’s Association (ABPA); Action for Economic Reforms (AER); Aksyon Klima; Alliance of Progres-sive Labor; Alyansa Tigil Mina (ATM); Anthrowatch; Asilo De San Vicente De Paul; Asian NGO Coalition for Agrarian Reform (ANGOC); Asian South Pacifi c Bureau of Adult Education (ASPBAE); Association of Schools of Public Administration (ASPAP); Association of Major Religious Superiors in the Philippines – Justice, Peace and Integrity of Creation Commission (AMRSP-JPICC); Center for Community Transformation (CCT); Caucus Development NGO Networks (CODE-NGO); Coalition of Service of the Elderly, Inc. (COSE); Civil Society Network for Education Reforms (E-Net Phil’s.); Eco Waste Coalition; Earth Savers Movement; Earth Day Network Philippines; Fair Trade Alliance (FTA); Family Planning Organization of the Philippines (FPOP); First Philip-pine Conservation Incorporated; Foundation for the Philippine Environment (FPE); Foundation for Sustainable Societies, Inc. (FSSI); First Philippine Conservation Incorporated; Freedom from Debt Coalition (FDC); Global Call to Action Against Poverty (GCAP) – Philippines; German Technical Cooperation (GTZ); RBM Group; Go Organic! Philippines; International Center for Innovation, Transformation and Excellence in Governance (INCITEGov); Haribon Foundation; Health Care Without Borders; Health Care Without Harm; KAAKBAY; Kabataan Kontra Kahirapan (KKK); Kamapiyaan sa Ranao Center (Lanao Development Center) – Marawi City; Kasama Pilipinas; Kilusang Mamayan ng Bagong Milenyo (KMBM); Kilusan Para sa Makatarungang Lipunan at Gobyerno (KMLG); Kumpas E-Net (Pasig Chapter); La Liga Policy Institute; Medical Action Group; Mindanao Center for Women Welfare and Development, Inc.; Moro Human Rights Center (MHRC); No Burn Coalition; NGOs for Fisheries Reform (NFR); Partido Kalikasan Institute (PKI); Partnership for Clean Air (PCA); Philip-pine Rural Reconstruction Movement (PRRM); Philippine Federation for Environmental Concerns (PFEC); Philippine Greens; Philippine Movement for Climate Justice (PMCJ); Philippine Network on Climate Change (PNCC); Ponce Consultancy; Rice Watch Action Network; Saganang Buhay sa Liga ng Bayan Foundation (SBSB Foundation); Santa Filomena Homeowners Association – Iligan City; Social Watch Philippines; Sustainability Watch; Tanggol Kalikasan; Team Asia; Upholding Life and Nature (ULAN); United Nations Coordination Offi ce (UNCO); United Nations Coordination Offi ce/MDG-F; World Vision; Womanhealth Philippines; Women’s Legal and Human Rights Bureau (WLB); Women and Gender Institute (WAGI); Young Public Servants; Individu-als: Ms. Elizabeth Alvarez; Ma. Warina Jukuy; Mr. Rommel Agong; Prof. Glenda O. Abdul; Mr. Mohammad Camamara; Nympha Pimentel Simbulan; Dr. Alberto G. Romualdez Jr.; Dr. Michael L. Tan; Dr. Orville Jose C. Solon; Dr. Sharon Taylor.
To all those mentioned and those who prefer to remain in the shadow, including the ones we missed, our sincerest gratitude for being a part of this project.
The Editorial TeamSocial Watch Philippines

iv SOCIAL WATCH PHILIPPINES
KEY TO ACRONYMS
4Ps Pantawid Pamilyang Pilipino Program ABI-ENVI Alternative Budget Initiative-Environment ClusterABPA Assalam Bangsamoro People’s AssociationADB Asian Development BankADSDPPs Ancestral Domain Sustainable Development and Protection PlansAER Action for Economic ReformAFP Armed Forces of the PhilippinesAHMP Accelerated Hunger Mitigation ProgramAHTEG Ad Hoc Technical Expert Group on Forest Biological Diversity AIP Annual Investment PlanALS Alternative Learning SystemAMANA Aksyon ng Mamamayang NagkakaisaAMRSP-JPICC Association of Major Religious Superiors in the Philippines -
Justice, Peace and Integrity of Creation Commission AMTP AIDS Medium Term PlanANC Antenatal CareAO Administrative OrderAQMF Air Quality Management Fund ARBs Agrarian Reform Benefi ciariesARMM Autonomous Region in Muslim MindanaoARs Assessment ReportsASEM Asia-Europe MeetingASPBAE Asian South Pacifi c Bureau of Adult Education ATM Alyansa Tigil Mina BALAY Balay Rehabilitation Center, Inc. BANGSA Bangsamoro SolidarityBDAF Bangsamoro Development Assistance FundBEmONC Basic Emergency Obstetric and Neonatal CareBESRA Basic Education Sector Reform Agenda BFAR Bureau of Fisheries and Aquatic ResourcesBIR Bureau of Internal RevenueBJE Bangsamoro Juridical EntityBLES Bureau of Labor and Employment StatisticsCADTs Certifi cates of Ancestral Domain Titles CALTs Certifi cates of Ancestral Land TitlesCARL Comprehensive Agrarian Reform LawCARP Comprehensive Agrarian Reform ProgramCBFM Community Based Forest ManagementCBMS Community Based Monitoring SystemCCTs Conditional Cash TransfersCDI Child Development IndexCDM Clean Development MechanismCEDAW Convention on the Elimination of all forms of Discrimination Against Women CEI Child Education IndexCEmONC Comprehensive Emergency Obstetric and Neonatal CareCEMS Continuous Environment Monitoring System CFCs Chlorofl uorocarbons CHED Center for Health DevelopmentCHI Child Health Index

Winning the Numbers, Losing the War: The Other MDG Report 2010 v
CLEEP Comprehensive Livelihood and Emergency Employment Program for ReforestationCLOA Certifi cate of Land Ownership AwardCLPIMS Core Local Poverty Indicators Monitoring System CMA-Phil’s Center for Migrant Advocacy - PhilippinesCO
2 Carbon Dioxide
COLF Community of Learners Foundation CompR Completion RateCOP Conference of the PartiesCPR Contraceptive Prevalence RateCSC Civil Service CommissionCSR Cohort Survival RateCSR Contraceptive Self RelianceDAR Department of Agrarian ReformDBM Department of Budget and ManagementDENR-PAWB Department of Environment and Natural Resources -
Protected Areas and Wildlife BureauDepEd Department of EducationDILG Department of Interior and Local GovernmentDILG-OPDS DILG-Offi ce of Project Development ServicesDOF Department of FinanceDOH Department of HealthDOTS Directly Observed Treatment Short CourseDSWD Department of Social Welfare and DevelopmentECC Environmental Compliance Certifi cateECE Early Childhood EducationEDCOR Economic Development CorporationEDI EFA Development IndexEDSA Epifanio de los Santos AvenueEFA Education for AllEmOC Emergency Obstetric CareENC Essential Newborn CareE-Net Phils Civil Society Network for Education Reforms - PhilippinesENSO El Niño Southern Oscillation EPI Expanded Program on ImmunizationEPZ Export Processing ZoneFAO Food and Agriculture OrganizationFHSIS Field Health Survey Information SystemFIC Fully Immunized ChildFIES Family Income and Expenditure Survey FIVIMS Food Insecurity and Vulnerability Information and Mapping Systems FLEMMS Functional Literacy, Education and Mass Media Survey FP Family PlanningFPE Foundation for the Philippine Environment FPICs Free, Prior and Informed ConsentGAA General Appropriations ActGAD Gender and DevelopmentGATT-WTO General Agreement on Tariffs and Trade - World Trade OrganizationGCAP Global Call to Action Against PovertyGDP Gross Domestic ProductGER Gross Enrolment RateGHGs Greenhouse GasesGNP Gross National ProductGOCC Government Owned and Controlled Corporations
vi SOCIAL WATCH PHILIPPINES
GRDP Gross Regional Domestic ProductGRP Government of the Republic of the PhilippinesGVA Gross Value-AddedGW Global WarmingHDI Human Development IndexHIPC Highly Indebted Poor CountriesHSS Health System StrengtheningHSW Household Service WorkICG International Contact GroupICT Information and Communications TechnologyIDP Internally Displaced PersonIEC Information, Education, CommunicationIFMA Integrated Forest Management AgreementsILO International Labor OrganizationIMF International Monetary FundIMR Infant Mortality RateIPCC Interagency Panel on Climate ChangeIPR Intellectual Property RightIPRA Indigenous Peoples Rights ActIP Indigenous PeopleIRA Internal Revenue AllocationISTC International Standard of Tuberculosis CareITPLA Industrial Tree Plantation Lease AgreementIWRM Integrated Water Resources ManagementIYCF Infant and Young Child FeedingJICA Japan International Cooperation AgencyJPEPA Japan-Philippines Economic Partnership Agreement KALAHI Kapit-Bisig Laban sa Kahirapan KALAHI-CIDSS Kapit-Bisig Laban sa Kahirapan – Comprehensive and Integrated
Delivery of Social ServicesKAP Kapatiran Action for ProgressKMLG Kilusan Para sa Makatarungang Lipunan at Gobyerno KMP Kilusang Magbubukid ng Pilipinas LAM Lactational Amenorrhea MethodLASEDECO Land Settlement Development CorporationLCC Literacy Coordinating CouncilLFPR Labor Force Participation RatesLGU Local Government UnitMA Millennium Ecosystem AssessmentMAG Medical Action Group, Inc.MCP Malaria Control ProgramMD Millennium DeclarationMDGs Millennium Development GoalsMDG-F Millennium Development Goals Achievement FundMDRI Multi-lateral Debt Reduction InitiativeMEDCO Mindanao Economic Development CouncilMGB Mines and Geoscience BureauMILF Moro Islamic Liberation FrontMinDA Mindanao Economic Development AuthorityMKNP Mt. Kanla-on Natural ParkMMR Maternal Mortality RateMNCHN Maternal, Neonatal and Child Health and NutritionMNLF Moro National Liberation Front

Winning the Numbers, Losing the War: The Other MDG Report 2010 vii
MOA-AD Memorandum of Agreement on Ancestral DomainMOOE Maintenance and Other Operating Expenses MP Member of ParliamentMSEE Minimum Standards in Education in EmergenciesMTPDP Medium Term Philippine Development PlanMTPIP Medium Term Philippine Investment PlanNARRA National Resettlement and Rehabilitation Administration NASA National Aeronautics and Space AdministrationNBN-ZTE National Broadband Network-Zhong Xing Telecommunication
Equipment Company LimitedNCIP National Commission on Indigenous PeoplesNCR National Capital RegionNC National CommunicationsNDHS National Demographic Health SurveyNEDA National Economic Development AuthorityNER Net Enrollment RateNG National GovernmentNGO Non-Government OrganizationNIPAS National Integrated Protected Areas System NLSA National Land Settlement AdministrationNMAP National Minerals Action PlanNNC National Nutrition CouncilNNS National Nutrition SurveyNSCB National Statistics Coordinating BoardNSO National Statistics Offi ceNTP National Tuberculosis ProgramODA Offi cial Development AssistanceODS Ozone Depleting SubstancesOECD Organization for Economic Co-operation and DevelopmentOFWs Overseas Filipino WorkersOGB Oxfam Great BritainOIC Organizations of Islamic Conference OOP Out-of-PocketOPAPP Offi ce of the Presidential Adviser on the Peace ProcessOSY Out-of-School YouthPA Protected AreaPAMB Protected Area Management BoardPAPs Programs, Activities and ProjectsPCA Partnership for Clean Air PCW Philippine Commission on WomenPDNA Post Disaster Needs AssessmentPDOS Pre-Departure Orientation SeminarPFEC Philippine Federation for Environmental Concerns PGR Population Growth RatePhilCAT Philippine Coalition Against TuberculosisPhp Philippine PesoPIECE Partners in Education for Community Empowerment PKI Partido Kalikasan Institute PMAC Post Management of Abortion Complication PMSEA Philippine Mine Safety and Environment AssociationPNAC Philippines National AIDS CouncilPNCC Philippine. Network on Climate Change PNHA Philippine National Health Accounts
viii SOCIAL WATCH PHILIPPINES
PNP Philippine National PolicePOEA Philippine Overseas Employment AdministrationPPGD Philippine Plan for Gender Responsive Developmentppm parts per millionPPMD Public-Private Mix for DOTSPRRM Philippine Rural Reconstruction MovementPWHA Persons living with HIV/AIDSQOLI Quantity of Life IndexRE Renewable EnergyRH Reproductive HealthRORO Roll-On Roll-OffRP Republic of the PhilippinesSBM School Based ManagementSBSB Saganang Buhay sa Liga ng Bayan SEA-K Self Employment Assistance-KaunlaranSPS Sanitary and Phyto-SanitarySTIs Sexually Transmitted InfectionsSWP Social Watch PhilippinesSWS Social Weather StationsSY School YearTB TuberculosisTBA Traditional Birth Attendants TBT Technical Barriers to TradeTESDA Technical Education and Skills Development AuthorityTN Tindahan NatinTSP Total Suspended Particulates U5MR Under Five Mortality Rate UHC Universal Health CareULAN Upholding Life and Nature UN United NationsUN DESA United Nations Department of Economics and Social AffairsUNCBD United Nations Framework Convention on BiodiversityUNCCD United Nations Convention to Combat Desertifi cation and Land DegradationUNCED United Nations Conference on Environment and DevelopmentUNDP United Nations Development ProgrammeUNESCAP United Nations Economic and Social Commission for Asia and the Pacifi cUNESCO United Nations Educational, Scientifi c and Cultural Organization UNFCCC United Nations Framework Convention on Climate ChangeUNICEF United Nations Children’s FundUNMC United Nations Millennium CampaignUNSIAP United Nations Statistical Institute for Asia and the Pacifi cUSAID United States Agency for International Development VADD Vitamin A Defi ciency Disorders VAT Value Added TaxVAW Violence Against WomenWB World BankWHO World Health OrganizationWLB Women’s Legal and Human Rights Bureau, Inc.YAFSS Young Adult Fertility and Sexuality SurveyZSOPAD Zones of Peace and Development

Winning the Numbers, Losing the War: The Other MDG Report 2010 ix
ABOUT THE AUTHORS/CONTRIBUTORS
Leonor Magtolis Briones is a Professor at the National College of Public Administration and Governance, Uni-versity of the Philippines, Diliman. She is the Lead Convenor of Social Watch Philippines. She was the Republic of the Philippines’ National Treasurer from 1998 to 2001, and, in concurrent capacity, served as Presidential Adviser for Social Development. She was the speaker at the 2005 Millennium Plus Five Summit during the UN General Assembly on September 14-16, 2005 in New York where she spoke during the Financing for Development (FfD) segment of the summit. She is also one of the eight ambassadors of the W8, a group of eight prominent health and education campaigners from South America, Africa, Europe and South East Asia, who have come together to bring the voice of their communities to the attention of world leaders and the general public. The W8 members came together in 2009 through working with Oxfam International.
Isagani R. Serrano is the President of the Philippine Rural Reconstruction Movement (PRRM); a Co-Convenor of Social Watch Philippines; and Editor of Social Watch Philippines’ MDG Midterm (7.7.7) Shadow Report 2007. He has authored many books and articles on the environment and development, poverty, MDGs, climate change, civil society and governance. He has participated in UN summits in the 1990’s and 2000’s, starting from the Earth Summit in Rio in1992, and was among the founders of Social Watch following the 1995 UN Social Summit in Copenhagen. More recently he was an invited speaker at the UNGA NGO Hearings on the Millen-nium Declaration in June 2005, in New York.
Marivic Raquiza has been involved in poverty and social development issues, including gender equality, as an advocate, researcher and writer, at the national and international levels. She lived in Mindanao for three years doing rural development work. She holds an MA from the Institute of Social Studies in The Hague and is cur-rently Assistant Professor at the University of the Philippines - National College of Public Administration and Governance and a Co-Convenor of Social Watch Philippines.
Rene R. Raya is a Co-Convenor of Social Watch Philippines. He is also a member of the Action for Economic Reforms (AER) management collective and also serves as lead policy analyst of the Asia South Pacifi c Association for Basic and Adult Education (ASPBAE).
Cecilia Soriano is the National Coordinator of the Civil Society Network for Education Reforms (E-Net Philip-pines), which is a network of more than 150 organizations advocating for quality Education for All.
Ma. Luz Anigan serves as social research coordinator of the Action for Economic Reforms.
Reginaldo Guillen is the National Coordinator of the Global Call to Action Against Poverty in the Philippines.
Mae Buenaventura has a long history of working in the fi eld of human rights and economic policy advocacy. In more recent years, she focused her development work on women and gender, taking part in preparing the 2006 NGO Shadow Report on the Philippine government’s compliance with the Convention on the Elimination of all forms of Discrimination Against Women and in many other women’s rights-focused activities, when she served as Executive Director of the Women’s Legal and Human Rights Bureau, Inc. (WLB) from 2007-2009. She has a master’s degree in Women and Development Studies from the University of the Philippines Diliman, which comes to good use in continuing involvements that include the feminist legislative and economic empowerment advocacies pursued by WLB and the Freedom from Debt Coalition Women’s Committee.
x SOCIAL WATCH PHILIPPINES
May-i L. Fabros is a member of WomanHealth Philippines. She works as a freelance communication specialist on the advocacies closest to her heart - women, children, youth, and urban poor rights. She is a staunch believer that everything and anything is possible.
Mercedes Fabros is the Advocacy and Campaign coordinator of WomanHealth Philippines.
Medical Action Group, Inc., (MAG) has been a service-provider to victims of human rights violations since 1982. MAG actively works together with other human rights organizations to promote peoples’ access to afford-able, accessible and quality medicines.
Rachael O. Morala is the Deputy Managing Director of the La Liga Policy Institute and Project Manager of the “MDG Pathways” project.
Jonathan D. Ronquillo is the Environment Campaigner of the La Liga Policy Institute and the Project Coordi-nator of the Alternative Budget Initiative - Environment Cluster.
Reagan John Gabriel is the Associate Environment Campaigner of the La Liga Policy Institute and Project As-sistant of the Alternative Budget Initiative - Environment Cluster.
Jessica Reyes-Cantos is the Chief of Staff of Representative Lorenzo Tañada III of the 4th District of Quezon Province. She is the President of the Action for Economic Reforms and a Co-Convenor of Social Watch Philip-pines. Her other NGO involvements include being a Convenor of Rice Watch and Action Network and the East Asia Rice Working Group; and a member of the Fair Trade Alliance. Jolly S. Lais is among the pioneers of community organizing and development work in the Moro communities in Mindanao and Metro Manila since it started in the 1980’s. He is an active campaigner for peace, and human rights and a campaigner against poverty and inequality. He is currently the Secretary General of Assalam Bangsamoro People’s Association (ABPA), a UNMC partner in Mindanao for the MDG campaign; Lead Convenor of the Bangsamoro Solidarity (BANGSA) - a lobby network of Moro civil society organizations; Lead Convenor of Kapatiran Action for Progress (KAP); Convening Director of Al Fatihah Foundation, Inc.; and Secretary General of Aksyon ng Mamamayang Nagkakaisa (AMANA).
Mohammad Musib Buat is a lawyer. He is the former chair of the Technical Committee on Moro Islamic Libera-tion Front (MILF) Peace Panel. He subsequently became a member of the MILF Negotiating Panel during the crafting of the Memorandum of Agreement on Ancestral Domain (MOA-AD) between the Government of the Republic of the Philippines and the Moro Islamic Liberation Front from 1997-2008.

Winning the Numbers, Losing the War: The Other MDG Report 2010 xi
FOREWORD
By ISAGANI R. SERRANO
This report ‘Winning the Numbers, Losing the War: The Other MDG Report 2010’ produced by Social Watch Philippines is the other report on our country’s progress on the Millennium Development Goals (MDGs) and
the prospects of achieving them by 2015. In sharp contrast to the ‘Philippines Fourth Progress Report on the Millennium Development Goals 2010’,
the most impressive and self-critical government MDG report so far, our shadow report warns that the problem is much more serious than what the government is prepared to admit. Indeed we are urging the government to treat our 2010 MDG baseline as if we have an “MDG crisis” on our hands.
The poverty situation is worse in 2010 than when we started on the MDGs in 2000. Many of the quantita-tive indicators on key goals (MDG 1 on reducing poverty and hunger, MDG 2 on universal primary education, MDG 5 on maternal mortality, MDG 8 on debt, trade and aid) are still between low and medium probability of achievement when they should all be on the high side going into the last fi ve years.
Behind the numbers, the inequality picture looks even grimmer. As of 2000, the poor and excluded in 2010, live in rural communities far from Manila—in Bicol, the Vizayas, and Mindanao, many of them women, Muslims, Indigenous Peoples and tribal Filipinos. They probably are still the same landless, homeless, jobless, underemployed, uneducated, sick, malnourished, and discriminated Filipinos of ten years ago although some of them may have moved out of poverty and slid back again.
The government has lost the war on poverty in the past decade, not for lack of rhetoric and trying. The policy declarations and national development plans bannered the MDGs. And so did the strategies, programs, activities and projects (PAPs) that were derived from them. An obvious explanation is that the government did not spend enough for the MDGs. But there might be other more basic and less obvious reasons which are rooted in the fl aws of the anti-poverty plans and strategies themselves.
Notwithstanding the MDG rhetoric, the Medium Term Philippine Development Plan (MTPDP) was an economic growth strategy blueprint which may have reduced poverty at one end only to reproduce it at the other. The outcomes are clear enough. Instead of expansion of job opportunities we saw a growth in the number of jobless and hungry. Instead of universal basic education and health care we fi nd so many left behind. Instead of land reform and asset distribution we got more wealth concentration. Instead of growing out of indebtedness our nation has sunk deeper into debts than before.
The specifi c strategies and PAPs, the heroic efforts to catch the fallouts and target the poorest among them provided only temporary relief at best. And these could only be sustained at high costs to taxpayers as fi scal defi cits widened that had to be fi nanced by more borrowings.
In the end, there would be more and more poor than we are able to catch and save.The different articles in this alternative report, each in their own way, try to tease out the claimed achieve-
ments, dig into the underlying causes of failure to make the sort of progress expected of a middle income country, and suggest ways of catching up and moving beyond the MDGs.
The blueprint and strategies need to be re-examined. We have to understand better why until now we continue to fail to reverse the poverty trend, to reduce high inequality, deep-seated corruption, high population growth, and mounting indebtedness. We need to learn how to deal squarely with the structural causes hindering our efforts towards social justice and sustainable development.
Keeping the minimalist MDG promises by 2015, or sooner, is an essential step before we could even begin to aspire for higher standards of well-being for all Filipinos.


Winning the Numbers, Losing the War: The Other MDG Report 2010 xiii
Acknowledgment .............................................................................................................................................................................................................................................................................................iii
Key to Acronyms ...............................................................................................................................................................................................................................................................................................iv
About the Authors ...........................................................................................................................................................................................................................................................................................ix
Foreword........................................................................................................................................................................................................................................................................................................................xi
An urgent MDG message: Inadequate funding places MDGs at risk ..................................................................................................................................1Prof. Leonor Magtolis Briones
MDG chances: stability and vulnerability .....................................................................................................................................................................................................................5Isagani R. Serrano
Losing the war on poverty: The Other MDG10 Report .....................................................................................................................................................................15Isagani R. Serrano
On poverty, hunger and employment: Off-track but not without hope......................................................................................................................29Marivic Raquiza
Crossroads: Marginalization versus achieving universal primary education by 2015................................................................................43Rene Raya, Cecilia Soriano, Reginaldo Guillen, Luz Anigan
Filipino women in the lead-up to the 2015 MDG deadline .........................................................................................................................................................53Mae V. Buenaventura
From 2010 and beyond: children should live past age 5 .....................................................................................................................................................................75May-i L. Fabros
Improve maternal health: a move towards universalizing health care ...............................................................................................................................87Mercedes Fabros
The rising challenge of HIV/AIDS and other diseases......................................................................................................................................................................107Medical Action Group
Not much time, but not without options: A review of the Philippines’ progress on achieving the MDG on environment sustainability ........................................................................................................................................119Jonathan D. Ronquillo, Rachael O. Morala and Reagan A. Gabriel
Trade, debt and aid: MDG retardants .......................................................................................................................................................................................................................135Jessica Reyes-Cantos
The Bangsamoro Outlook on the Millennium Development Goals............................................................................................................................145Jolly S. Lais
Updated Offi cial List of MDG Indicators ...........................................................................................................................................................................................................165
TABLE OF CONTENTS


An urgent MDG message: Inadequate funding places MDGs at risk
Winning the Numbers, Losing the War: The Other MDG Report 2010 1
By PROF. LEONOR MAGTOLIS BRIONES
Introduction
In fi ve years time (2010-2015), the Millennium Development Goals (MDGs) will be due.
These are the eight development goals which the international community of nations has
committed to attain within 15 years. The deadline will occur during the fi fth year of Presi-
dent Benigno S. (Noynoy) Aquino’s administration.
In 2015, all the 191 country signatories to the MDGs will meet at the United Nations and
report on the success or failure of the MDGs. Even now, the sense of urgency is palpable. Coun-
tries are busy assessing each of the 8 goals to determine which are likely to be attained and those
which are at risk. They are working out strategies to speed up the attainment of goals which have
lesser chances of being reached.

2 SOCIAL WATCH PHILIPPINES
The latest official report on the status of the MDGs in the Philippines1 reveals that, among others, indicators for education are going down, attainment of the goals for reduction of maternal mortality may not be achieved, and the targets for nutrition may not be reached.
Financing the MDGs: a major roadblockSocial Watch Philippines has been advocating for
adequate funding for social development since its orga-nization in 1995 as part of the international network of Social Watch. This was in the wake of the Copenhagen Summit of the same year, when the international com-munity committed itself to the attainment of social de-velopment goals, e.g. reduction of poverty, attainment of stable employment levels, enhancement of the status of women, and sustainable development.
When the MDGs were adapted by the interna-tional community in 2000, Social Watch Philippines immediately called for estimates of the costs of the MDGs. Even at that time, it was clear that fi nancial resources as allocated in the budget were inadequate. This was also true in other countries.
In 2002, Dr. Rosario Manasan of the Philippine Institute of Development Studies came out with annual estimates of additional resources required for selected MDGs. These estimates were used by Social Watch to gauge the adequacy of budgetary allocations for the MDGs. In 2006, graduate students of the National Col-lege of Public Administration and Governance examined the budget allocations in terms of the Manasan esti-mates. As expected, these were woefully inadequate.2
Spending for education and health as a percentage of the total budget has been declining over the years. While it is expected that spending for social develop-ment will increase in the light of population increases, with the emergence of epidemics and the need to catch up with accumulated shortfalls, the opposite has been happening.
Chronic shortfalls in revenueThe continuing inability of collection agencies to
generate targeted revenues remains a major problem in fi nancing the MDGs. Collection effi ciency remains low. Problems in revenue administration are exacerbated by what is politely referred to as “deviant or negative bureaucratic behavior.”
At the same time, increases in tax collections from the Value Added Tax are mitigated by increased levels of foregone revenue. These are huge amounts of revenue lost due to unnecessary tax incentives, tax breaks, perks and exemptions. What is taken on the one hand by increased VAT rates is given away by the other hand through incentives.
In 2009, the Secretary of Finance Gary Teves wrote Sen. Edgardo Angara, who was then Chair of the Finance Committee of the Senate, that an ad-ditional Php 75 billion was expected to be collected due to the increase in VAT rates. However, he noted that foregone revenues due to laws passed by Congress which granted more tax incentives would total Php 90 billion!
Problems in the budget processSocial Watch has pointed out time and again that
our budget system is driven and dominated by the executive. This is obvious when the budget process is examined. The budget preparation stage is handled by the executive. This is when the magnitudes of the budget are calculated, the defi cit fi gured out and the budget call is issued. The different agencies of govern-ment submit budget proposals based on parameters issued by the executive. Technical hearings are con-ducted by the Department of Budget and Management. Budget estimates are then collated and presented to the legislature.
The budget legislation stage is within the ambit of the legislature. Nonetheless, the executive plays an active role. If the House and Senate are in a deadlock over the budget, the previous year’s budget is reenacted. Once the Bicameral Committee agrees on the budget which is then presented to the president, he or she can veto the budget in part or as a whole.
The budget implementation stage is the arena of the executive. The president can withhold the release of funds even if these are provided for in the appropria-tions law. He or she can transfer funds from one agency to another, and declare savings if necessary. Thus the functions of resource allocation can be taken over by the executive.
In recent times, this practice has reached grotesque proportions. In 2004, the DBM reported that the presi-dent transferred Php140 billion from various agencies to other offi ces.
1 The Philippines Fourth Progress Report on the MDGs, Third Draft, 07/12/2010. 2 Social Watch Philippines. 2006. Moving forward with the Millennium Development Goals: May pera pa ba?

Winning the Numbers, Losing the War: The Other MDG Report 2010 3
The use of the budget instrument for political ven-detta also reached new heights. Pork barrel allocations and budget items sponsored by members of the opposi-tion were withheld under the fl imsiest of reasons.
The fi nal stage of the budget process which is bud-get accountability has not been effective. Last year, the Commission on Audit formally reported to Congress that in 2008, government expenditures exceeded the amounts provided for in the appropriation law. Nothing came out of that report.
The Alternative Budget InitiativeIn 2006, Social Watch Philippines went into
partnership with progressive legislators from the House of Representatives and the Senate in order to increase available allocations for selected MDGs in what is now known as the Alternative Budget Initiative (ABI). Civil society organizations worked closely with congressmen and senators in formulating alternative budget propos-als in four areas: education, health, agriculture and the environment.
As proposed by ABI, a total of Php 5.3 billion was added to the 2007 national budget, while Php 6.3 billion was added to the 2008 budget for education, health, agriculture and the environment. In 2009 and 2010, the national budgets were increased by Php 6.7 billion and Php 5.4 billion respectively for the above four categories.
Financing the MDGs under the new administrationLast August 25, the President submitted the
proposed 2011 National Budget to Congress. This cannot be considered completely as his budget since the budget cycle started last May 12 with the budget call. When President Aquino took over the reigns of government last July 1, the budget was practically fi nished already.
Nonetheless, there are features which augur well for budget reform. The most important of these is the effort to reach out to the public, particularly civil society. In his budget message, the President asked the private sector, civil society and the general public to help monitor the implementation of the budget.
This is a good enough start even as Social Watch Philippines is of the view that Participatory Budgeting is not only about monitoring the implementation of the budget. It is also about effective public participation in the entire budget cycle—starting from the preparation phase to accountability.
On the other hand, revenue collection agencies, particularly the Bureau of Internal Revenue (BIR) have been active in tracing tax evaders and fi ling cases. It is heartening to note that the focus is on the collection of direct taxes, namely income tax.
It is to be hoped that the practice of indiscrimi-nately granting tax incentives by Congress to the private sector will not only be moderated but stopped.
Along with the rest of the public, Social Watch Philippines is still waiting for the much promised im-position of ‘sin’ taxes to generate additional revenues for the MDGs.
An urgent message: inadequate funding places the MDGs at risk!
The Social Watch Shadow Report has shown that there are problems with each of the MDG goals which goes beyond the numerical targets themselves and can be linked, among others, to inadequate fi nancing.
Poverty remains intractable; education statistics are deteriorating and the goals for maternal mortality are at risk. Still another disturbing fact is that the indigenous peoples are left behind in the MDG race. There are 18 million indigenous people in the Philippines. Many of them live below the poverty line. Their communities are among the poorest in the country. The National Com-mission on Indigenous Peoples (NCIP) is attached to the Department of Environment and Natural Resources even as their problems and concerns are more complex than the issue of ancestral domain. Out of the total NCIP 2010 budget of Php 621 million, Php 560.847 million is for projects and operations. This is less than the combined pork barrel of three senators.
Recommendations for financing the MDGsIn summary, the following are recommended in
order to generate more resources for the MDGs: • Improve tax collection effi ciency; • Rationalize the incentives system; • Ensure that government owned and controlled
corporations (GOCCs) remit the dividends due to the government and regulate their salaries and other compensation;
• Accelerate the recovery of ill-gotten wealth from different offi cials; and
• Review ‘invisible budget’ items and tap the Global Climate Change Fund.
The 2015 deadline is nearing. We cannot fail.
4 SOCIAL WATCH PHILIPPINES
References
ADB. April 2009. The Economics of Climate Change in Southeast Asia: A Regional Review.
Alyansa Tigil Mina. Frequently Asked Questions. www.alyansa-tigilmina.net.
Archival, N. D. 2009. Airshed Governing Board: The Cebu Experi-ence. PowerPoint Presentation.
Atienza, J. L. February 2008. Revitalizing Philippine Mining: From Policy to Practice. PowerPoint Presentation.
Cammack, D. R. December 2007. Overseas Development Institute. Understanding the Political Economy of Climate Change is Vital to Tackling It.
Christine, K. I. 2010. Environmental Performance Index. Conservation International. Biodiversity Hotspots. www.biodiver-
sityhotspots.org. Department of Budget and Management. 2010. General Appropria-
tions Act.2002-2010. www.dbm.gov.ph. DENR Administrative Order (DAO) No. 2007- 22. Guidelines on the
Requirements for Continuous Emission Monitoring Systems (CEMS) and other acceptable protocols, ‘Thereby modifying and clarifying certain provisions of Section 5, Rule X of DAO 2000-81 and other related provisions. July 2007.
DENR. Ensuring a “Greener” Legacy for Filipinos. www.denr.gov.ph. DENR Administrative Order (DAO) No. 8. 2004. Revised Chemical
Control Order for Ozone Depleting Substances (ODS). DENR Sec. Ramos cites gains in natural resources management
under Arroyo administration. www.denr.gov.ph. DENR. Down-loaded June 11, 2010.
DENR-EMB. 2009. Ten Years of Clean Air Act Implementation. PowerPoint Presentation.
DENR-FMB. Integrated Forest Management Agreement/Industrial Tree Plantation Lease Agreement (IFMA/ITPLA). Tree Farm and Agroforestry Farm Leases: 1977-2007. Philippine Forestry Statistics. http://forestry.denr.gov.ph.
DENR-MGB. July 2005. Priority Mineral Development Projects in the Philippines. PowerPoint Presentation.
DENR-PAWB. List of Proclaimed Protected Areas under NIPAS. www.pawb.gov.ph.
DENR, UNDP and ACB. 2009. The 4th National Report to the Convention on Biological Diversity.
DENR, UNDP, GEF. 2009. Enabling Activity for the Preparation of the Philippines’ Second National Communication on Climate Change to the UNFCCC.
DILG Offi ce of Project Development Services. Statistics. Millen-nium Development Goals Achievement Fund. www.mdgfund.org/country/Philippines.
DOH. 2004 – 2008. Annual Reports. National Epidemiology Center. Field Health Services Information System.
EM-DAT: The OFDA/CRED International Disaster Database - Université Catholique de Louvain - Brussels - Belgium. www.em-dat.net.
Forest and Mountain Biodiversity: Overview. Philippine Clearing House Mechanism for Biodiversity. http://chmphl.98labs.com.
Habito, C. June 6, 2010. Is Mining Growth Inclusive? Philippine Daily Inquirer.
La Liga Policy Institute – Alternative Budget Initiative Environment Cluster. 2009. Financing Climate Change Actions: A Must for the 2010 Budget.
La Liga Policy Institute – Alternative Budget Initiative Environ-ment Cluster. September 2009. Institutional Arrangements for Disaster Risk Management in the Philippines.
Medium Term Philippine Development Plan (MTPDP). 2004-2010.NEDA. June 2010. Second draft. Philippines Fourth Progress
Report on the Millennium Development Goals (MDGs). Unpub-lished.
Offi ce of the President-Climate Change Commission. 2010-2022. National Framework Strategy on Climate Change.
Oposa, A. A. 1996. Legal Marketing of Environmental Law: The Philippine Experience. Paper presented during the Fourth International Conference on Environmental Compliance and Enforcement.
PAGASA – DOST Service Institutes. http://kidlat.pagasa.dost.gov.ph/cab/statfram.htm.
Philippine National Government in support of the Kapit-Bisig Laban sa Kahirapan. July 2007. Waterless Municipalities. A Convergence Project.
R.A. 7942. The Philippine Mining Act of 1995.Ramos, H. C. June 2008. Update on the Mining Revitalization
Program of the Philippines. Powerpoint Presentation. Ronquillo, J.D. and Morala, 2007. R.O. Environmental Insecurity:
The Cost of Mis-Governance. Serrano, I. R. October 2005. Slowing Down, Coming TogetherSocial Watch Philippines. 2006. Moving forward with the
Millennium Development Goals: May pera pa ba?The Digital Filipino Stats Report. www.digitalfi lipino.com. UNDP. 2004. Common Country Assessment. UN Habitat. The Habitat Agenda Goals and Principles,
Commitments and the Global Plan of Action. http://www.unhabitat.org/declarations/habitat_agenda.htm.
UN Habitat. March 2010. World Urban Forum 5. The Right to the City. Bridging the Urban Divide.
Villarin, J.T., Loyzaga, A.Y. and La Viña, A.G.M. (et. al.). July 2008. In the Eye of the Perfect Storm: What the Philippines should do about climate change. Working Paper.
World Bank. December 2005.Philippines Environment Monitor 2005. Coastal and Marine Resource Management.

Winning the Numbers, Losing the War: The Other MDG Report 2010 5
MDG chances: stability and vulnerability By ISAGANI R. SERRANO
Introduction
This paper describes the context within which the Millennium Development Goals
(MDGs) will be played out between 2010 and 2015. This period falls within the term
of the new regime.
Within that short span of time the government of President Benigno S. (Noynoy) Aquino
(P-Noy) is expected to keep the MDG promises, building on (or perhaps, reconstructing from)
the legacy of the previous regime.
The tasks at hand are simple enough: bring down poverty and hunger levels to half of that
in 1990; make sure all children are in school and stay to complete elementary education; achieve
gender parity in education at all levels and promote women empowerment; reduce infant, child
and maternal mortality; control old and new diseases; ensure environmental sustainability; and,
assure all these with adequate fi nancing, policy and institutional support, nationwide consensus
and broad citizen participation.

6 SOCIAL WATCH PHILIPPINES
gest rice importer. Our so-called export winners, like electronics are import-dependent.
The country continues to grapple with huge bud-get defi cits and mounting debt burden. Tax collection may be improving but the highest levels of collection have barely made a dent on the defi cit.
The culture of impunity and privilege fostered in the old regime had dampened and eroded the possibil-ity of change. It’s now up to P-Noy to lift the nation from that feeling of hopelessness and give every citizen a reason to believe that real change is going to happen under his watch.
The alternative or shadow report prepared by Social Watch Philippines, while giving due regard to the progress made, presents a different picture. Despite consistent positive economic growth—6 percent on av-erage—there are more poor Filipinos now than when we set off on the MDG track in 2000. The high inequality picture of 1990—expressed in income, employment, spatial, gender, ethnic dimensions—hardly changed or might have even worsened. These outcomes indicate that we have not won the war on poverty as declared by ex-PGMA on assumption to offi ce in 2001. We may in fact be losing that war, considering the many challenges before us.
Under a regime of stabilityThe previous regime came to power in a turbulent
changeover. Shortly after assumption of offi ce, it was challenged by mass protests, called the EDSA3, which led to tragic consequences. From then on, there was no let up in other forms of challenges to the unpopular regime, including military coups, Moro insurgencies, and communist rebellion. On top of all these, the country had to suffer the impacts of the global crises in fi nance and economy, food and feed, fuel and energy, and now climate change.
In contrast the P-Noy regime’s ascent happened with a smooth transition. Most of all, we now have a new regime whose legitimacy is beyond question.
The unprecedented mandate given to P-Noy may be seen as a vote for what ex-PGMA was not, as a vote for change, a vote of hope that the change will happen. While nothing can be guaranteed, we are certain that the ‘We can do it’ feeling pervades across the land. And that makes for a comparatively easier building of a nationwide consensus for ending poverty and achieving sustainable development.
A word of caution, though, high expectations
Where P-Noy is taking off fromThe Philippines Fourth Progress Report on the
Millennium Development Goals (MDGs) has laid out what the previous PGMA regime achieved in the last ten years. It’s a mixed bag of accomplishments and shortfalls in each of the eight MDGs.
The previous regime takes pride in having set the economic fundamentals. It has publicly challenged the new regime to prove that the consistent positive growth in GNP and GDP of the last ten years can be sustained. The balance of payments is positive.
Moreover, an environmental legacy of 26 legisla-tions, covering concerns like solid waste, clean air, clean water, renewable energy, climate change, disaster risk reduction and management, and organic agriculture, are certainly laudable. Supreme Court Chief Justice Reynato Puno has also added his own green imprint in the justice system. This includes the writ of kalikasan, green courts, and continuing mandamus to rehabilitate Manila Bay.
Our country is said to be a ‘net carbon sink’ based on our latest greenhouse gas (GHG) inventory, given the 700,000 hectares net increase in our forest cover. Public awareness on environment and climate change issues has increased greatly. All these of course would not have been possible without the sustained efforts of non-state actors and an environmental legacy that traces back to Marcos time.
But ensuring environmental sustainability means much more than laws and policies. Indeed we have passed more than enough environmental legislation since our participation in the UN Conference on Hu-man Environment in Stockholm in 1972. It is also in the environment sector where we observe wide gaps in policy and action. Green mandates remain poorly funded as environment ranks low in budget priority. Considering the fi scal crisis, additional appropriations for the environment are not easy to come by.
Even more basic, the environment has always been sacrifi ced in the name of growth.
Remittances of overseas Filipino workers (OFWs)—between 16 and 18 billion US dollars an-nually—have streamed in despite global economic crises. Ours would be equivalent to the World Bank’s historical annual lending average and about three times that of the ADB’s. Few countries outside of China and India have had so much fortune.
The country’s balance of trade negative is of course consistently negative. The country is the world’s big-
Winning the Numbers, Losing the War: The Other MDG Report 2010 7
may mean a short honeymoon period. In light of the MDG shortfalls and the mounting economic, social and environmental problems, including outstanding political issues, like corruption, that are potentially divisive, the new regime must seize the moment to rally the nation around where it wants to go and how to get there.
Can the Philippine government keep its MDG promises by 2015? Maybe.
The new regime could cash in on its overwhelming mandate. If that mandate was really a vote for change, then it should not be diffi cult to rally the nation and build a nationwide MDG-consensus. It should not be diffi cult to concentrate all available resources to meet the targets.
The new regime can aim to make poverty history1 at the end of its term. To begin with, the MDGs are a very minimalist set of goals for a middle income country like the Philippines. We should have achieved them under the previous regime.
Looking to 2012 and 2015 In 2015 the Millennium Development Goals
(MDGs) will be up for judgment. Derived from the Millennium Declaration of the Millennium Summit of 2000, the MDGs are a set of minimum com-mitments to free humanity from poverty, hunger, disease, and other forms of deprivation, to reduce inequality, promote human rights and enlarge our basic freedoms.
By then, 15 years will have gone by for both the Copenhagen Social Summit and the Beijing Women’s Conference. These two UN summits vowed to end poverty, create employment, improve social cohesion, reduce gender inequality and promote women empow-erment. These promises are synthesized in the MDGs which comprise 8 goals, 18 targets, and 48 indicators. Four more targets and corresponding indicators were added during the World Summit of 2005 or MDG+5 Summit. These goals, targets and indicators are mea-sured against the 1990 baseline.
By 2012 it will be the 20 year anniversary of the Rio Earth Summit. As has already been decided by the
UN there will be another global summit of world lead-ers in 2012 to take stock of the world situation, assess progress, agree on what needs to be done, and renew commitment to achieve sustainable development within the soonest possible timeframe.
Sustainable development2 was the theme of the United Nations Conference on Environment and De-velopment (UNCED), held in Rio de Janeiro, Brazil, more popularly known as the Rio Summit or Earth Summit of 1992. It is an all-embracing concept that integrates environment and development, defi ned as the kind of “development that meets the needs of the present generation without compromising the ability of future generations to meet their own needs”.
The Rio+20 summit will bring back to center stage the concept and practical operations of a green economy3 or eco-economy4 which was already raised but pushed to the backburner in the previous sum-mit in 2005. The theme is critical given the stubborn persistence of poverty and the continuing rise in CO
2
emissions and dangerous human interference into the climate system.
Increasing uncertainties worldwideAs we look forward to a regime of stability, and
are mindful of the past regime’s legacy, we have to take stock of our vulnerabilities.
The fi rst decade of 2000 is notable for such events as 9/11, the US-led wars in Iraq and Afghanistan, and great forest fi res, storms, earthquakes and tsunamis. In 2008 we saw the near-collapse of the fi nancial system, combined with the food and fuel crisis. Before we could fully recover from their impacts, we got one more disaster after another. All these and the great oil spill in the Mexican Gulf seem to indicate that the worst is yet to come.
Increasing uncertainties make it diffi cult to tell whether we are actually headed toward sustainable development or systemic shut downs.
In 1990, climate change was a side concern of sustainable development. In 2010, climate change is seen as one of the greatest threats to sustainable devel-opment. World leaders who came to the failed climate
1 A banner call used by the UN Millennium Campaign (UNMC)2 Defi ned by the World Commission on Environment and Development (otherwise known as the Brundtland Commission) in its 1987
Report to the UN, under the publication title Our Common Future.3 Pearce, D.W., Markandya, A. and Barbier, E.B. Blueprint for a Green Economy (London: Earthscan, 1989). Jacobs, M. The Green
Economy: environment, sustainable development and the politics of the future (London: Pluto Press, 1991).4 Brown, L. R. Eco-Economy: Building an Economy for the Earth (New York: W. W. Norton & Co., 2001).

8 SOCIAL WATCH PHILIPPINES
summit in Copenhagen in December 2009 agreed that poverty and climate change are the biggest challenges of our time.
In 1990, the world population stood at around 5 billion, over a billion of them absolutely poor. The Philippine population then was about 60.7 million, with more than 15 million in absolute poverty. By 2000, the world population had breached the 6 billion level and still over a billion of them poor. The Philippine population was then 76.5 million, with more than a fi fth living in extreme poverty.
Climate change could change it allPerhaps there’s no challenge as great as climate
change. At the least, it could compromise the achieve-ment of the minimalist MDGs. In a worst-case scenario, say a rise of 5 or 6 degrees Centigrade in global average temperature from the averages in pre-industrial times, all human and natural systems might be stressed beyond their tolerance limits.
Nobody knows for sure what will happen in the future. Things can just turn helter-skelter as a result of positive feedback which scientists as yet cannot fully comprehend. Nature knows best, so to say, and humans must be responsible for their own action.
The United Nations Framework Convention on Climate Change, or UNFCCC, was one of the agree-
Source: UNFCCC-IPCC Fourth Assessment Report 2007. Stern Review. IAASTD.
ments of the 1992 Earth Summit. It was intended to put in check the dangerous human interference in the climate system and stabilize greenhouse gas (GHG) concentrations in the atmosphere to levels that make life on Earth sustainable.
The climate convention is an agreement binding industrialized or rich countries (Annex 1 Parties) to cut their GHG emissions (mitigation) and help poor countries (Non-Annex 1 Parties) with money and technology to be able to adjust (adaptation) to climate impacts and enable them to achieve sustainable develop-ment. Mitigation, adaptation, fi nance and technology are called the UNFCCC pillars.
Several principles, if not all of the 26 principles stated in the 1992 Rio Declaration, served as a guide to the climate convention. The principle of common but differentiated responsibilities means that we’re all responsible but some must answer for more. This may be considered the bedrock principle of climate justice. The polluters pay principle says that if you pollute, you pay, and if you pollute more you pay more. The precautionary principle says that if you’re not sure about the impact and consequences of what you do, don’t do it. All of them serve the goal of sustainable development.
Yet after 15 Conferences of the Parties (COP) to the UNFCCC and 20 years of chasing climate justice

Winning the Numbers, Losing the War: The Other MDG Report 2010 9
what we got from Annex I countries after COP 15 in December 2009 in Copenhagen was the so-called Copenhagen Accord.5
The controversial ‘accord’ talks of a stabilization target of <2°C, spreading the burden of cutting emis-sions to over-emitters (Annex I) and under-emitters (Non-Annex I) alike, and a promise of aid for adapta-tion. The fi rst means nothing without fi rm commit-ment to urgent and deep cuts in GHG emissions. The second means Annex I Parties skirt their mitigation obligation. The promised adaptation financing of $10bn/yr or $30bn in three years (2010- 2012) build-ing up to $100bn/yr by 2020 is inadequate to begin with, and worse, highly uncertain, conditional, and most likely to come by mainly as loans.
Agreeing on <2°C or an even lower target is cool since the lower it is the safer it gets. But the real issue is how. The mitigation offers on the table are patheti-cally low, if not outright insulting. The UNFCCC In-teragency Panel on Climate Change (IPCC) scientists calculated that the sum of those offers will be tanta-mount to allowing the temperature to rise up to 3°C and higher, even up to a high of 5 or 6 degrees.
According to British MP Sir Nicholas Stern, some 47 billion tons of CO2
are already up there in the at-mosphere.6 Emissions must peak by 2015, come down to 44 billion by 2020, then to less than 35 billion by 2030, down to below 20 billion by 2050 for a 50:50 chance to keep global warming (GW) below 2°C. How on earth can that happen?
5 A controversial document introduced at the UNFCCC COP15 in Copenhagen in December 2010 and noted by the UNFCCC secretariat.6 Stern, N. Business must champion low-carbon growth. Financial Times. Monday December 7, 2009, p.13. 7 Typhoons Ondoy and Pepeng: Post Disaster Needs Assessment (PDNA), November 26, 2009. 8 WB-NDCC, Estimated Damage of Disasters, 2008
NASA scientist James Hansen believes that 350 ppm (parts per million) is the safe level of carbon concentration in the atmosphere that will keep global warming (GW) below 2°C of pre-industrial temperatures. At 350ppm corals live, at 450ppm they die.
Can the climate convention still prevent dangerous human interference in the climate system? Can it still bind industrialized countries to cut their GHG emis-sions and help developing countries in their adaptation efforts through fi nance and technology transfer? Can it still be an instrument for enforcing carbon justice and achieving sustainable development?
The other climate summit convened by Colombian president Evo Morales in April 2010 in Cochabamba was a response to the Copenhagen failure. The Coch-abamba 2010 agreed on four key proposals to the UN and the peoples of the world: (a) binding agreement on a ‘Universal Declaration of Mother Earth Rights’; (b) a ‘Climate Justice Tribunal’ to hear cases and bring to trial violators; (c) ‘Climate Debt’ of rich countries to poor countries who had little responsibility for the climate crisis; and (d) ‘World People’s Referendum on Climate Change’ as the means to air people’s views and to legitimizing decisions.
The UN still cares to listen, and that gives us reason to hope.
A baseline of reconstructionIn just one month in 2009, two storms alone left
Photo by Isagani R Serrano, December 2009 Copenhagen
the Philippines with about 1000 dead, thousands more homeless, and damages totaling US$4.38 billion or 206 B pe-sos,7 nearly 14 times the annual average of direct damage (1970-2006) of about US$305 million or 15 B pesos.8
This would consume about 20 per-cent of the 2010 national budget and set the country back to a baseline of recon-struction, not development.
The Philippines is geographically situated in a region where more tropical cyclones develop than elsewhere in the world. An average of 20 tropical cyclones enter the Philippine Area of Responsibility
10 SOCIAL WATCH PHILIPPINES
(PAR) annually, about 7 to 9 of them making landfall. May to December is considered the tropical cyclone season and the peak tropical cyclone activity occurs from July to September with an average of 3 or more occurrences.
Low adaptive capacityHow much increase in temperature can a vulnerable
country like the Philippines endure—1, 2, 3 degrees Cen-tigrade? And, for how long? How many super typhoons and fl oods can we survive, and at what cost? What would it take to adjust to climate change impacts?
Adaptation to climate change is a must, a default mode, something we cannot skip regardless of what happens in climate negotiations and whether or not help from rich countries is coming our way.
A high adaptive capacity means a stable and prosperous economy and a high degree of access to technology at all levels. It also means well-delineated roles and responsibilities for implementation of adapta-tion strategies, with systems in place for the national, regional and local dissemination of climate change and adaptation information. It also indicates equitable distribution of access to resources.
Food security on the lineAgriculture and fi sheries are extremely vulnerable
to the impacts of climate change. The IPCC has cal-culated the cost on agriculture to be between 30 per-cent and 50 percent reduction in yield in rainfed rice. Productivity is expected to decline due to decreasing freshwater supply, drought and fl oods. Jobs and busi-nesses that are dependent on natural resources are on the line. Failure of food systems will hit the rainfed and subsistence farmers in rural areas the hardest.
Two of the sharpest drops in volume of produc-tion and gross value-added (GVA) in agriculture were experienced during two of the worst El Niño South-ern Oscillation (ENSO) episodes recorded in history (1982-1983 and 1997-1998). Increased temperature altered the rainfall patterns. Increase in the frequency and intensity of extreme climate events intensifi ed the risk in agricultural production.
Lack of water supply during the critical growth stage of crops due to El Niño-induced drought will adversely affect crop yields. Similarly, submerging of seedlings in fl oodwater and washing out of standing crops because of strong typhoons associated with La Niña may lead to crop damages and thus, low harvest.
Pests and diseases are also rampant during extremely wet weather conditions, which may infect not only crops but also livestock and poultry. Consequently, households that depend on crop farming as well as live-stock and poultry business as sources of livelihood may incur substantial economic losses. In 2006, as refl ected in the Family Income and Expenditure Survey (FIES), about 50 percent of households in the Philippines are engaged in agriculture.
The country has some 36,000 km of coastline and the archipelago is surrounded by large bodies of water—the Pacifi c Ocean, the South China Sea, and the Sulu-Sulawesi Sea. This condition brings many benefi ts but also many vulnerabilities in the face of climate change.
Extreme weather events and associated storm surges, ocean warming and sea-level rise will lead to destruction of the livelihood of those situated in vulner-able areas such as coastal and fl ood-prone areas. Too much heat can result in coral bleaching, leading to a loss of shelter and food for coral-associated fi shes. In the 1997-1998 El Niño one of the worst coral bleaching events ever occurred. Other effects of ocean warming include toxic algal blooms, imbalance of salt and fresh water content in estuaries thereby affecting the growth and/or survival of juvenile and shell fi sh, decline in plankton species or food for fi sh, among others. These outcomes imply a reduction in fi sheries yield.
Sea-level rise also causes saltwater intrusion, which may reduce the number of fi sh in estuaries. It also increases the salinity within coastal mangrove forests, thereby adversely affecting mangrove production. Moreover, signifi cant rise in the sea level may also inhibit sea grass productivity due to light reduction in sea grass beds. .
Coastal areas are heavily populated, accounting for 60 per cent or more of the population. Coastal ecosystems are stressed heavily by destructive natural events, over-exploitation of marine resources, con-struction of infrastructures, and pollution. Fishing communities are among the poorest of the population. Coastal and marine ecosystems are the major sources of fi sh and other fi shery products.
In 2006, the Philippines ranked 8th among the top fi sh producing countries in the world, 10th in aquaculture production and the 2nd largest producer of aquatic plants (seaweeds, etc) (BFAR 2007).
The economic contribution of fi sheries in 2007, accounts for 2.2% (Php143.4 billion) and 3.3%

Winning the Numbers, Losing the War: The Other MDG Report 2010 11
(Php58.6 Billion) of GDP at current and constant prices, respectively. The exports of these products in 2007 earned as much as US$569.79 Million (BFAR 2007) foreign currency. Fisheries is also a livelihood generator. The entire fi sheries industry directly employs 1,614,368 fi shing operators (NSO 2002 Census for Fisheries), of which 1,371,676 are from the municipal sector, 16,497 from the commercial sector and 226,195 from the aquaculture sector. Such numbers of fi shing operators further generate additional employment as fi shers, and in ancillary activities such as processing, boat building, and marketing.
Around 70% of the protein in the diets of Filipinos is supplied by fi sh. But the protein intake from fi sh and seafood has declined to 87 grams or 6.50% of the daily calorie intake of the average Filipino between 2003 and 2005 from 99 grams daily between 1990-1995 (FAO 2008).
The social and economic benefi ts from fi sheries have come by at great costs to our biodiversity and economic sustainability. The fi sheries sector must now confront the challenges of declining catch, degradation of important habitats, heightened inter- and intra-sec-tors confl ict, loss of foreign currency revenues from exports of fi sheries products, worsening poverty in coastal communities, and increasing vulnerability to extreme weather events.
The FAO/World Bank (Sunken Billions 2009) un-derpin that global fi sheries is losing at least US$50 Bil-lion annually through over-investments in fi shing gears, processing facilities, and subsidies. This is more than half of the total value of the global seafood industry.
Water resourcesClimate change will disturb the water cycle. The
warming of the atmosphere and oceans will change ma-jor weather systems and consequently alter the temporal and spatial patterns of rainfall with consequences for runoff, surface and groundwater storage, and river fl ow regimes. With changing climate and rainfall patterns, it is estimated that there will be greater likelihood of extremes – droughts and fl oods – in different parts of the world.
Water-related infrastructure such as dams and impoundments for domestic water supply, irrigation and energy generation will have to be climate-proofed. We need to assess the vulnerability of existing dams and water supply infrastructure, watersheds, and river basins to extreme weather variability and climate change.
The design criteria for new water-related infrastruc-ture development must consider climate change and disaster risks.
Even in wet countries like the Philippines, where people take water for granted, raising consciousness on water conservation cannot be overstated. We have to do water recycling and reuse, improve rainwater harvesting, management and protection of watersheds, catchments, and surface and groundwater. Urban and population centers need to improve their wastewater treatment systems and control pollution of surface and groundwater.
The integrated water resources management (IWRM) approach still hovers in the margins despite offi cial recognition of its importance in water conserva-tion and the achievement of sustainable development. All sectors involved with managing water resources in a fragile archipelagic ecosystem like ours cannot continue with the usual fragmented approaches and therefore have to seriously pay attention to the issues and con-cerns from source to sink and areas in-between.
BiodiversityThe Philippine environment is endowed with
many diverse species and ecosystems making it one of the 18 mega biodiversity countries in the world. It ranks fi fth in terms of plant diversity and fourth for bird endemism. To protect its biodiversity rich ecosystems, the DENR-PAWB identifi ed and declared 234 areas with a total of about 5.234 million hectares as Protected Areas that are off-limits to extractive activities.
However, threats to biodiversity are increasing due to pressures from extractive activities. One is com-ing from poor communities who depend on natural resources for their subsistence and survival. The other comes from operations of commercial logging and mining. Human-induced threats to biodiversity are further compounded by the adverse impacts of climate change on terrestrial and aquatic plant and animal communities.
Increases in temperature would affect the survival of plants and animals with narrow tolerance range for temperature and those which are presently living at the upper limit of their tolerance level. A substantial increase in temperature in the range of 30oC to 40oC may possibly cause the migration of animal species with narrower temperature tolerance to other more suitable areas as their form of adaptation. Such temperature level increases may also disrupt species interactions like the

12 SOCIAL WATCH PHILIPPINES
relationship between plants and pollinators that may affect the survival of plant species. Most vulnerable are those species that have diffi culties in migrating as a form of survival. Further increase in temperature to 50oC or 60oC may cause a number of animals and plant species to die out and become extinct while critical habitats may be lost. Many research studies claim that coastal ecosystems have higher vulnerability to climate change compared to terrestrial ecosystems.
On the other hand, sea level rise of one meter is predicted to inundate many coastal towns and cities in the Philippines while practically submerging many small islands (defi ned as those with areas of less than 1,000 hectares) especially during high tides. Sea level rise will also affect sea grass beds and mangroves and cause saline intrusion into groundwater, lakes and rivers.
Acidifi cation of coastal waters due to increased carbon dioxide threatens the survival of plankton at the base of the food chain and then the productivity of fi sheries.
A baseline for the new millennium9
1990 is the reference year for the MDGs and other in-ternational agreements like the Agenda 21, the UN Frame-work Convention on Climate Change (UNFCCC), the UN Framework Convention on Biodiversity (UNCBD), and the UN Convention to Combat Desertifi cation and Land Degradation (UNCCD). The UNFCCC baseline covers the greenhouse gas emissions inventory obtained from national communications (NatComs or NCs) and assessment of vulnerability and adaptation. The climate convention’s scientifi c body, the Interagency Panel on Climate Change (IPCC) makes the regular assessments reports (ARs). The fourth and last assessment report in 2007, which made headlines and won the IPCC a Nobel Prize, gave a more defi nitive conclusion about human responsibility for global warming (GW) and consequent destabilization of the climate system.
Succeeding reviews and assessments provide up-dated baselines.
One of these was the Millennium Ecosystem As-sessment9 (MA), carried out under the auspices of the UN between 2001 and 2005. The MA aimed to assess the consequences of ecosystem change for human well-being and set a baseline for needed actions for enhanc-ing the conservation and sustainable use of ecosystems and their contribution to human well-being.
The MA, which involved around 1,360 experts from 95 countries, was a multilateral response to the request for science-based information by state parties to the four international conventions—the UNCBD, the UNCCD, the Ramsar Convention on Wetlands, and the Convention on Migratory Species. It also responded to needs expressed by the business community, NGOs, health sector, and Indigenous Peoples.
The MA focused on ecosystem services, defi ned as benefi ts people obtain from ecosystems. An ecosystem is a dynamic complex of plant, animal, and microor-ganism communities and the non-living environment interacting as a functional unit. These include provi-sioning services such as food, water, timber, and fi ber; regulating services that affect climate, fl oods, disease, wastes, and water quality; cultural services that that provide recreational, aesthetic, and spiritual benefi ts; and supporting services such as soil formation, photo-synthesis, and nutrient cycling.
Human well-being includes security, basic mate-rial for a good life, health, good social relations, and freedom of choice and action.
The MA has come up with four main fi ndings.One, over the past 50 years humans have changed
ecosystems more rapidly and extensively than in any comparable period of time in human history, largely to meet rapidly growing demands for food, fresh water, timber, fi ber, and fuel. This has resulted in a substantial and largely irreversible loss in biodiversity of life on Earth.
Two, the changes have contributed to human well-being for the present generation. But the growing costs in terms of the degradation of many ecosystem services, increased risks, and worsening of poverty for some groups of people will put at risk the well-being of future generations.
Three, the degradation of ecosystem services could grow signifi cantly worse during the fi rst half of this century and is a barrier to achieving the Millennium Development Goals.
Four, the challenge of reversing the degradation of ecosystems, while meeting increasing demands for their services, can be partially met under some scenarios that the MA has considered. But this assumes signifi cant changes in governance.
These fi ndings confi rm what many believed was already happening. Together, the MA and the IPCC
9 Millennium Ecosystem Assessment, 2005. Ecosystems and Human Wellbeing Synthesis. Island Press 2005 World Resources Institute.

Winning the Numbers, Losing the War: The Other MDG Report 2010 13
Fourth Assessment Report provide a grim baseline which governments and citizens can choose to heed or ignore at their own peril.
Poverty worldwide has been reduced, mainly be-cause of China’s massive efforts. Less China’s dramatic achievement, world poverty has in fact increased.
Poverty is reducing but inequalities and disparities are increasing.
From 1990 to 2006, we have seen further increases in CO
2 emissions. Emissions from developed countries
increased from 11.2 B metric tons to 12.2 billion metric tons, and developing countries from 6.8 B metric tons to 13.8 B metric tons. Worldwide the increase is from 21.9 B metric tons to 28.7 B metric tons.10
Consumption of ozone depleting substances (ODS) is on a downward trend, indicating progress in the implementation of Montreal Protocol.
Deforestation has continued at an alarming rate—13 M hectares/year. This is equivalent to the land area of Bangladesh. Forestry accounts for 17.4% of world’s CO
2 emissions.
Some 18 M km2 of land and 3 M km2 of territorial marine waters are protected. This accounts for 12 % of Earth’s surface. However, the depletion rate of fi sheries increased from 70% in 1995 to 80% in 2006.
Water withdrawal rate for agriculture increased from 70% in 1990 to 78% in 2000. The target for access to safe drinking water is on track but 884 M people still rely on unsafe sources, 84% — 746 M of them in rural areas.
Some 1.1 B people gained access to improved sanitation from 1990 to 2006 but 1.4 B more must have access by 2015. About 18% or 1.2 B people still defecate in the open.
Almost half of urban dwellers in developing coun-tries lived in slums in 1990, reduced to 36% by 2005. There is improvement in the lives of slum dwellers in almost all regions but the current housing and energy crisis may slow or even reverse progress gained.
Sustainability in Asia—a big questionAn Asia free of poverty is not impossible, as China
and other Asian economic miracles have shown so far. That is, if we could solve the dilemma in which
poverty is reduced on one end only to be reproduced on the other.
The forces that made possible the economic mir-acle which lifted more than 270 million Asians out of poverty within two decades are the same ones creating all the inequalities between and within countries. They are also the same forces damaging Asia’s environment and compromising the region’s further development and long-term sustainability.
A ‘green growth’11 approach, as proposed by the UNESCAP, which aims to shift economic growth patterns from the conventional ‘grow now, clean up later’,12 might help address the dilemma. Such a strategy must squarely address the many environmental issues confronting the region.
Asia’s generally rapid economic development has not only failed to eradicate extreme poverty but has also come about at a high environmental cost. Its farmlands and forestlands, surface and ground water, forests, seas and oceans are being drained of resources and poisoned in a big way. This home of the world’s biodiversity has suffered tremendous losses of its plant and animal spe-cies. Its pollution level is high, contributing greatly to the destabilization of the global climate system.
The region’s forests have been converted massively into croplands; its soil has been degraded at differing extents of severity; its land surface is getting drier (already 46% dry (1,977 million ha)); and its deserts continue to expand, affecting more than 500 million of its people. The yearly economic loss due to land degradation amounts to billions (US$).
Where extreme poverty was dramatically reduced, if not totally eradicated, is where you fi nd the environ-ment at its worst state.
China and India may go the same way as the rich countries in destroying their environments. Already, in rapid fashion these two giants are both contributing increasing levels of GHG emissions even as their lands, forests, and freshwater resources are already in advanced stages of degradation. These high-fl ying economies have left an environmental wasteland which threatens food security and human well-being.
By 2015, Asia and the Pacifi c might surpass the OECD countries in greenhouse gas emissions.
10 Global MDG Report 2009. UN.11 UNESCAP State of the Environment in the Asia and the Pacifi c 2005 report. 12 ‘Grow now, pay later’ strategy was used by this author in his 1994 book, Pay Now, Not Later: essays on the environment and develop-
ment published by the Philippine Rural Reconstruction Movement (PRRM), to mean development that discounts social and environmen-tal costs in the name of growth.

14 SOCIAL WATCH PHILIPPINES
In the world’s tropical regions, Asia and the Pacifi c show the highest rate of deforestation, the fastest rate of commercial logging and the highest rate of fuel wood removal. The major causes of forest cover loss are at-tributed to the expansion of farming, large economic development programs involving resettlement, agricul-ture, and infrastructure. Add to this overharvesting for industrial use and fuel wood, pollution and extreme climate events like storms.
Asia and the Pacifi c has been losing its water re-sources fast due to ever rising demands of its growing population, agriculture, industry, and homes. Water for irrigation accounts for the largest withdrawal from both surface and ground water sources. Excessive abstraction of groundwater has been depleting aquifers, lowering water tables, and inducing sea water and salt intrusion. Degradation through pollution of river systems, lakes, wetlands and marshes have aggravated over extraction.
The coastal and marine environments of Asia and the Pacifi c are being stressed by ever growing demands for fi sh and marine resources, for expansion of industry, tourism and human settlements. Open access to these supposedly common property resources is rapidly transforming the region’s coasts and seas into a classic tragedy of the commons.
Asia and the Pacifi c is losing its biodiversity fast. Though the region is still the home of seven of the 18 mega-diversity nations (Australia, China, India, Indonesia, Malaysia, the Philippines, and Papua New Guinea) its plant and animal species are being destroyed at a rate that threatens extinction. The obvious causes are clear cutting of forests and mangroves, diminishing agro-biodiversity, destruction of corals, and over-fi sh-ing. Not as obvious are the impacts of biotechnology, genetic modifi cation and mono-culture.
ConclusionThe chances of our country achieving its MDG
commitments by 2015 are high, mainly because we are favored by a stable political environment. The new regime has come to power in a smooth transition and enjoys a high level of trust across the whole nation. Very few regimes had such fortune. In contrast, its im-mediate predecessor was born of turbulence, governed in turbulence, and left with many outstanding issues demanding urgent closure.
But our advantage in political stability stands on vulnerable grounds. The problems left behind by the previous PGMA regime are many and the solutions
not easy. There are more poor Filipinos now than when we started on the MDGs. The damage caused by natural disasters in 2009 threw us back to a baseline of reconstruction.
The country is so vulnerable to the impacts of climate change and variability. Our adaptive capacity is at a low level, considering the poverty situation and our country’s geography. The resilience of our communi-ties and our natural environments has yet to be tested against the worst-case climate change scenarios.
We are also confronted with increasing uncertain-ties within the Asian region and worldwide. China is the leading success story of the MDGs without which there would be little or no reduction at all in global poverty. There is much to learn about how it achieved a high level of prosperity with universal social protec-tion. However, the China model is not only hard to replicate, its claim to success has come about at great costs to the environment.
Not everything is lost despite our failure to bring the MDG progress up to a high probability level of achieve-ment with only fi ve years remaining. It simply means that the new regime has a lot of catching up to do.
The MDGs is not an impossible dream, just a set of minimum goals.
References
Brown, L. R, 2001. Eco-Economy: Building an Economy for the Earth. New York: W. W. Norton & Co.
Department of Environment and Natural Resources (DENR) 2010. The Philippine Strategy on Climate Change Adaptation 2010-2022.
Jacobs, Michael, 1991. The Green Economy: environment, sustain-able development and the politics of the future London: Pluto Press.
Millennium Ecosystem Assessment, 2005. Ecosystems and Human Wellbeing Synthesis. Island Press. World Resources Institute.
Pearce, D.W., Markandya, A. and Barbier, E.B. 1989. Blueprint for a Green Economy. London: Earthscan.
Serrano, I. R. 1994. Pay Now, Not Later: essays on the environ-ment and development. Philippine Rural Reconstruction Move-ment (PRRM).
Stern, N., 7 December 2009. Business must champion low-carbon growth. Financial Times. p.13.
The Philippines Fourth Progress Report on the MDGs, Third Draft, 07/12/2010.
Typhoons Ondoy and Pepeng: Post Disaster Needs Assessment (PDNA), November 26, 2009.
United Nations. 2009. Global MDG Report.UNESCAP, 2005. State of the Environment in the Asia and the
Pacifi c 2005 report.UNFCCC COP15, December 2010. Copenhagen Accord.UN Millennium Campaign (UNMC) and Global Call to Action Against
Poverty (GCAP). ‘Making poverty history’ Banner slogan. WB-NDCC, 2008. Estimated Damage of Disasters.World Commission on Environment and Development (Brundtland
Commission). 1987. Our Common Future. Report to the UN.
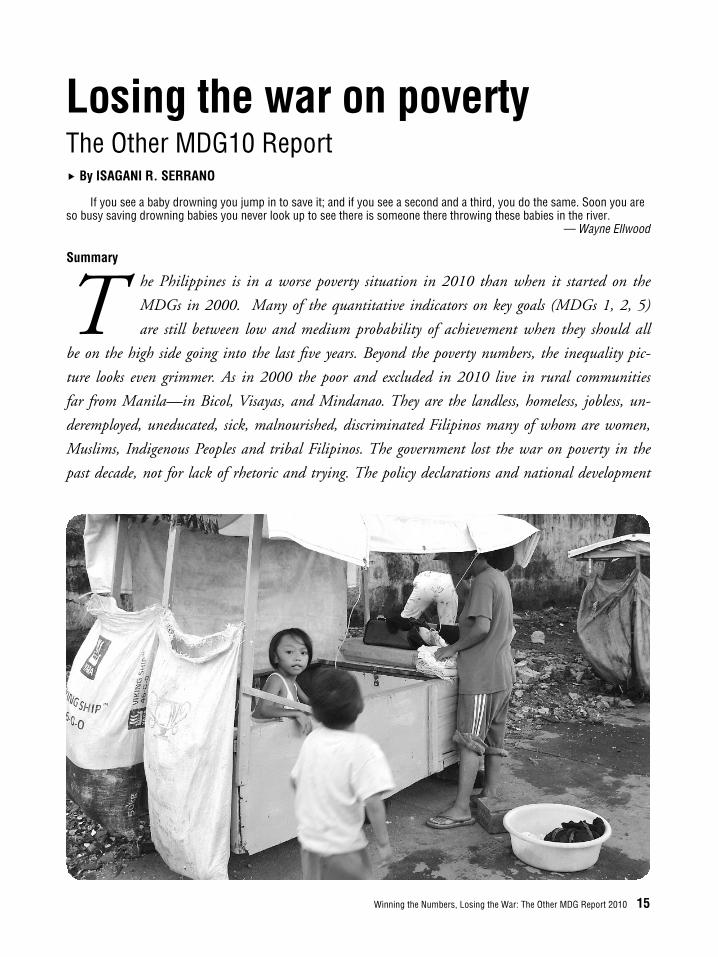
Winning the Numbers, Losing the War: The Other MDG Report 2010 15
Losing the war on povertyThe Other MDG10 Report By ISAGANI R. SERRANO
Summary
T he Philippines is in a worse poverty situation in 2010 than when it started on the
MDGs in 2000. Many of the quantitative indicators on key goals (MDGs 1, 2, 5)
are still between low and medium probability of achievement when they should all
be on the high side going into the last fi ve years. Beyond the poverty numbers, the inequality pic-
ture looks even grimmer. As in 2000 the poor and excluded in 2010 live in rural communities
far from Manila—in Bicol, Visayas, and Mindanao. They are the landless, homeless, jobless, un-
deremployed, uneducated, sick, malnourished, discriminated Filipinos many of whom are women,
Muslims, Indigenous Peoples and tribal Filipinos. The government lost the war on poverty in the
past decade, not for lack of rhetoric and trying. The policy declarations and national development
If you see a baby drowning you jump in to save it; and if you see a second and a third, you do the same. Soon you are so busy saving drowning babies you never look up to see there is someone there throwing these babies in the river.
— Wayne Ellwood

16 SOCIAL WATCH PHILIPPINES
plans bannered the MDGs, and so did the strategies, programs, activities and projects derived from them. The policy-action gap was obvious: government did not spend enough for the MDGs. But there might have been other less obvious reasons which may be rooted in the fl aws of the anti-poverty plans and strategies themselves. Notwithstanding the MDG rhetoric, the Medium Term Philippine Development Plan (MTPDP) was an eco-nomic growth strategy blueprint which failed to reduce, or may have even reproduced, poverty after ten years. The programs, activities, and projects (PAPs) that tried to catch the fallout and targeted the poorest among them could only provide temporary relief at best. This needs deeper review. The review called for entails an explana-tion as to why till now we have failed to deal squarely with high inequality, deep-seated corruption, population growth, mounting indebtedness, and other structural causes hindering our efforts for justice and sustainable development. The different articles in this alternative report, each in their own ways, try to dig into the more basic reasons why we are progressing in some and failing in other MDG targets. Keeping the minimalist MDG promises by 2015, or sooner, is an essential step before we can even proceed to aspire for higher standards of well-being for all Filipinos.
IntroductionWith fi ve years remaining and so much left to
do, the Philippine government will have to exert extra efforts and quickly fi nd better ways to keep its MDG promises by 2015.
It’s been 10 years now since the UN Millennium Summit of 2000. In that once in a lifetime event 189 nations, the Philippines among them, signed on to the summit’s Millennium Declaration (MD) aimed at making poverty history.1 The MD promises to eradicate world poverty and hunger, reduce inequality, promote human rights and enlarge our basic freedoms. These promises were synthesized in the Millennium Develop-ment Goals (MDGs), a set of measurable targets to be achieved by 2015, using 1990 as the baseline.
Note also that 2015 marks 15 years since the Copenhagen Social Summit and the Beijing Women’s Conference. These two UN summits, predecessors to the Millennium Summit, committed to end poverty, create full employment, improve social cohesion, reduce gen-der inequities, and advance women empowerment.
Like the rest of the pledgers, the Philippine gov-ernment has the obligation to report periodically on how it’s doing. Since 2000 three such reports have been submitted to the UN and a fourth one is coming out in time for the September 2010 world summit in New York.
In parallel, Social Watch Philippines (SWP) has been producing its own shadow reports. Three such reports have been produced so far—in 2003, 2005 and 2007. These reports echo the voices of the ‘voiceless’ who are living in poverty at the margins of social pro-tection. These reports represent alternative perspectives and views of non-state actors, including recommenda-tions on how to move forward.
This fourth shadow report intends to feed into the annual planning and budgeting processes, from top to bottom or from the ground up, and the new regime’s six-year blueprint.
Our hope is to see a Medium-Term Development Plan (MTPDP) and local development plans that are truly MDG-sensitive and committed to deliver on the minimalist MDG promises. That MTPDP should be able to build our country’s adaptive capacity and resil-ience to worst-case scenarios arising from multiple crises of food, fuel, fi nance/economy, and climate change.
Reviewing progress and prospectsAt a glance
Where the Philippines stands on quantitative in-dicators is summarized in Table 1: Philippines’ MDG progress and prospects at a glance. The table is adopted from the offi cial report and modifi ed to include trend data from the earliest to the latest available values.
What these numbers mean to usThe medium to high probability on MDG 1 in-
dicators cannot be taken at face value. Poverty stopped declining in 2003 and from that point on started to rise steadily. The impact of 2008-09 crises are yet to be known fully but poverty will most likely exceed the 2000 and 2006 levels. The numbers cannot capture the depth of trauma and agony of those affected, especially the poor.
If the numbers for MDG 2 are bad enough, the quality of our education is even worse. Failure in such a basic thing as universal primary education indicates an education in crisis. The low score on net enrolment rate
1 ‘Making poverty history’ was a banner slogan of the UN Millennium Campaign (UNMC) and Global Call to Action Against Poverty (GCAP).

Winning the Numbers, Losing the War: The Other MDG Report 2010 17
Table 1. Philippines’ MDG progress at a glance2
MDG goals, targets and indicators Earliest Value
%
Value in % 2000
Latest Value
%
Pace of progress
(%)
Probability of attaining the target
Goal 1: Eradicate extreme poverty and hunger Target 1.A: Halve, between 1990 and 2015, the proportion of people whose income is less than one dollar a day
Proportion of population below poverty threshold 45.3 (1991) 33
32.9 (2006) 0.82 MEDIUM
Proportion of population below food threshold
24.3 (1991) 15.8 1.20 HIGH
Target 1.C: Halve, between 1990 and 2015, the proportion of people who suffer from hunger
Prevalence of underweight children under-five years of age 24.6
(2005) 26.2
(2008) 0.63 MEDIUM
Proportion of households with per capita intake below 100% dietary energy requirement
69.4 (1993) 56 0.72 MEDIUM
Goal 2: Achieve universal primary education
Target 2.A: Ensure that, by 2015, children everywhere, boys and girls alike, will be able to complete a full course of primary schooling
Elementary education net enrolment rate 85.1 (1991) 96.8 83.2 (06-07) 0.00 LOW
Elementary education gross enrolment rate 111.2 (1991) 113.5 99.9 (06-07) LOW
Elementary education cohort survival rate 68.7 (1991) 63.5 (99-00)
75.4 (08-09) 0.63 MEDIUM
Elementary education completion rate 66.5 (1991) 65.3 (99-00)
73.3 (08-09) 0.54
MEDIUM
Goal 3: Promote gender equality and empower women
Target 3.A: Eliminate gender disparity in primary and secondary education, preferably by 2005, and in all levels of education no later than 2015
Ratio of girls to boys in elementary education participation rate HIGH
Ratio of girls to boys in secondary education participation rate
HIGH
Ratio of girls to boys in elementary education cohort survival rate HIGH
Ratio of girls to boys in secondary education cohort survival rate HIGH
Ratio of girls to boys in elementary education completion rate HIGH
Ratio of girls to boys in secondary education completion rate HIGH
2 Table adopted and modifi ed by the author from the Philippines Fourth Progress Report on the MDGs, Third Draft, 07/12/2010

18 SOCIAL WATCH PHILIPPINES
Table 1. Philippines’ MDG progress at a glance (continuation)
MDG goals, targets and indicators Earliest Value
%
Value in % 2000
Latest Value
%
Pace of progress
(%)
Probability of attaining the target
Goal 4: Reduce child mortality Target 4.A: Reduce by two-thirds, between 1990 and 2015, the under-five mortality rate
Infant mortality rate 57 (1990) 29
(2003) 25
(2008) 1.11 HIGH
Under-five mortality rate 80 40
(2003) 34
(2008) 1.13 HIGH
Goal 5: Improve maternal health
Target 5.A: Reduce by three quarters, between 1990 and 2015, the maternal mortality ratio
Maternal mortality ratio 209 (1993) 172 (1998)
162 (2006) 0.47 LOW
Target 5.B: Achieve, by 2015, universal access to reproductive health
Contraceptive prevalence rate 40 (1993) 49 (2003)
51 (2008) 0.25 LOW
Goal 6: Combat HIV/AIDS, malaria and other diseases
Target 6.A: Have halted by 2015 and begun to reverse the spread of HIV/AIDS
Number of new HIV/AIDS reported cases 4424 (2009) -14.56 LOW
Number of population aged 15-24 with HIV 311 44 (2006)
218 (2009) 0.60 MEDIUM
Target 6.C: Have halted by 2015 and begun to reverse the incidence of malaria and other major diseases
Malaria mortality rate 1.5 0.8 (1998)
0.02 (2009) 1.23 HIGH
Tuberculosis treatment success rate 88 (2003)
90 (2007) 43.75 HIGH
Goal 7: Ensure environmental sustainability
Target 7.C: Halve, by 2015, the proportion of people without sustainable access to safe drinking water and basic sanitation
Proportion of population with access to safe water
73.8 (1991) 78.7 (2000)
81.5 (2007)
3.20 HIGH
Proportion of population with access to sanitary toilet facilities 71.8 (1991) 82.9
(2000) 87.9
(2007) 3.87 HIGH
Notes: MEDIUM-pace of progress is between 0.5 and 0.9; HIGH-pace of progress is greater than 0.9.Probability of attaining the target: LOW - pace progress is less than 0.5.All basic education indicators showed favorable trends for girls
Winning the Numbers, Losing the War: The Other MDG Report 2010 19
(NER) and medium on both cohort survival rate (CSR) and completion rate (CompR) are unacceptable for a country that started off in 1990 as an early achiever.
The apparently high performance in MDG 3 on gender parity for all education indicators is tricky and deceptive. Yes, there’s a girl for every boy in school but there are far fewer girls and boys in school now than in 1990 or 2000. Filipino women may rank high in most empowerment measures but they still suffer discrimina-tion and oppression, both crude and subtle, at home, in school, in the workplace, in the community.
The country is a high achiever for MDG 4 on reducing child mortality —both for infant and under-5 deaths. The government’s health policies and programs seem to have improved a lot despite declining health spending. Perhaps, the science and art of caring for the child have also improved. However, the worsening hunger situation could threaten a slowdown or reversal anytime.
In contrast, MDG 5 on reducing maternal mor-tality rate (MMR) is at great risk. Low probability on both indicators of mothers dying at child birth and access to reproductive health, specifi cally contracep-tive prevalence rate; tell enough about the quality of maternal care in the country.
MDG 6 on combating HIV/AIDS, malaria and other diseases is on the whole positive. But documenta-tion of HIV/AIDS cases is still problematic. We also need to know more about the impact of climate change and extreme weather events on our health situation.
MDG 7 on ensuring environmental sustainability is high on all counts, including those not shown on the table, such as increase in forest cover of about 700,000 hectares and expansion of protected areas. The increase in forest cover made the Philippines a ‘net carbon sink’, based on the latest greenhouse gas (GHG) inventory of the Philippines’ Second National Communication to the UN Framework Convention on Climate Change (UNFCCC). However, the decline in biodiversity and forest quality has yet to be arrested and reversed. The increase in protected area coverage was mainly expan-sion by proclamation, not actual progress in forest conservation. The remaining natural growth forest continues to be threatened and harmed by logging and mining operations.
MDG 8 which includes global cooperation, enabling policies, trade-debt-aid links, and MDG fi nancing has no quantitative indicators but are es-sential to meeting all other targets. Progress in this
goal was no less disappointing, as: trade liberalization hurt the domestic industries and agriculture, offi cial development assistance (ODA) is declining whilst debt is increasing.
Where we should beWe should be at the high probability level for all
indicators. Or at least at high to medium probability where we’re lagging behind (NER, MMR, CPR, HIV/AIDS). That’s where we should be with only fi ve years remaining, and for good reasons.
One, the MDGs are a low bar, to begin with. The Philippines cannot be any different from its middle-income ASEAN neighbors who have reduced their poverty signifi cantly.
Two, continuity of political leadership. We have been under one and the same presidency since the start of the MDGs. Although the legitimacy of the now for-mer PGMA remained in question, there had never been any break in government operations since 2001.
Three, economic growth for all those nine or ten years has been consistently positive, despite the effects of the 2008-2009 global crises in fi nance and economy, food and feed, fuel and energy. The impact of the crises on the country was comparatively mild, as the OFW remittances continued to stream in.
Four, the previous regime considered its 2004-2010 Medium Term Philippine Development Plan as its MDG strategy blueprint. This means that the MDGs were not a marginal issue in planning and budgeting. In fact, the MDGs were hyped as providing coherence to all poverty-targeted programs, activities, and projects (PAPs) and the entire operations of government.
Five, improvement in statistics made for better gov-ernment targeting. This enabled government to know better who the poor were, how many there were, and where to fi nd them. Offi cial data has been disaggregated at sub-national levels, by gender, by age group, though not yet by ethnicity which in any case might be derived from available data. The Community Based Monitoring System (CBMS) had been implemented throughout the country. Trend data on inequality was especially noteworthy. Poverty strategies, programs, projects and activities could therefore be more focused and tracking progress was made easier and more concrete.
Six, rising public awareness of the MDGs made for broader public support. More local governments got on board and actually had their local development plans oriented to the MDGs. People’s organizations, NGOs,

20 SOCIAL WATCH PHILIPPINES
businesses, churches, academe, media, and other sectors got involved in MDG-related advocacies and projects.
Too many still left behindWhat if the Philippines achieved all the MDG
targets?Many would still be left behind, and their numbers
are simply staggering by any count. These millions of Filipinos are probably angry but still hopeful that some real change in their lives will happen soon.
In actual numbers poverty incidence translates to 28.1 million people in 1991, 25.2 million in 2000, and 27.6 million in 2006. Our population was about 62.1 million in 1991, 68.6 million in 1995, 76.5 million in 2000 and 88.5 million in 2007, and now growing at an average 2.04 percent annually (see Table 2).
The extremely poor or those living below subsis-tence may be less but they are many. From 24.3 percent or 15.1 million people in 1991 it decreased to 14.6 percent or 12.2 million individuals in 2006. Note that it had gone down to 13.5 percent in 2003 and climbed back up in 2006. The subsistence incidence of families also declined, from 20.4 percent in 1991 to 11 percent in 2006, a reduction of 24 percent from 2.5 million families to 1.9 million families. As with poverty inci-dence, these trends for both the individual and family will most likely be reversed post-2006 and exceed the 2000 reference levels. The old poverty analysis meth-odology that generated the 1991 data included special rice as part of the menu, referred to regional prices, and assumed a six-member family.
The official report says that the Philippines, starting from 69.4 percent in 1993, is now halfway to meeting its hunger reduction target of 34.7 percent of households with per capita intake below 100 percent dietary requirement. But this also means that only four out of every ten Filipino households are having the recommended energy intake per person.
Faces of poverty and inequalityPoverty in the Philippines has many faces. It shows
in location (more rural than urban, far from and south of Manila), in assets (landless, moneyless), in gender (woman or more female than male), by region (Muslim Mindanao), and in ethnicity (IPs, minorities).
Of the country’s 16 regions, the National Capital Region has always had the lowest poverty incidence: 16.7 percent in 1991, 7.8 percent in 2000, and 10.4 percent in 2010. Wealth and power continue to be unequally biased in Manila’s favor. A recent World Bank study on Mindanao graphically showed the extreme inequality in gross regional domestic product (GRDP) between the National Capital Region and the rest of the country’s regions.5
The poorest region in 1991 was Region XII SOCC-SKSARGEN in Mindanao with 63.1 percent poverty incidence. In 2000 and 2006, the poorest region was the Autonomous Region in Muslim Mindanao (ARMM) with poverty incidence of 60.0 percent in 2000 and 61.8 percent in 2006. Most of the regions north of Metro Manila had less poor people than those in the south (MIMAROPA and Bicol), and in the Visayas and Mindanao regions. In fact, these regions (includ-ing NCR, Regions I to III, and CALABARZON) had poverty incidence lower than the national average.
More than 50 percent of the top 20 poorest prov-inces in 2003 and 2006 were from Mindanao. The poorest among the poorest in 2003 was Zamboanga del Norte with a poverty incidence of 64.6 percent. In 2006 Tawi-Tawi ranked fi rst with a much higher poverty incidence of 78.9 percent. On the 20th rank in 2003 was Zamboanga Sibugay with a poverty incidence of 40.7 percent. In 2006, Negros Oriental was the 20th poorest with a poverty incidence of 43.7 percent.
Eighty (80) percent of the 20 poorest municipali-ties in 2003 were in Mindanao. The poorest of these was Siayan in Zamboanga del Norte with a poverty
Table 2. How many are there3
1991 2000 2006 2010 2015 Population (million) 62.1 76.5 88.5 (2007) 94.0 (projected) 102.9 (projected) Poverty rate (%)4 45.3 33.0 32.9 Number of poor (millions) 28.1 25.2 27.6
3 National Statistics Offi ce4 NSCB data5 In Figure 1 showing economic density in the Philippines in Behind the veil of confl ict: moving towards economic integration for sustained
development in Mindanao, Philippines. May 2010. World Bank and AusAID.

Winning the Numbers, Losing the War: The Other MDG Report 2010 21
incidence of 97.46 percent. The last in the list was Talaingod, Davao with a poverty incidence of 78.56 percent.
The government report attributed this situation to the confl icts and peace and order problem. What is not said is that several of these poorest regions, prov-inces and towns are also host to large plantations and mining enclaves.
Losing the war on poverty The top economic adviser of former PGMA,
Albay Governor Joey Salceda6 had this to say about what President Noynoy Aquino is inheriting from his predecessor: “My biggest frustration as a presidential adviser is that 34 quarters of uninterrupted expansion in the past nine years did little to reduce poverty and the numbers of poor people.” As to the statistics that tell a different story, the governor was not convinced. “These rosy fi gures cannot hide the fact that there are more poor people now than when the President started her term.”
The new regime is in fact starting from a baseline of reconstruction not development, if we consider the Php 206 billion pesos worth of damage from just two storms and associated fl oods that occurred in 2009.
From 45.3 percent in 1991, poverty incidence in the Philippines stopped declining at 30 percent in 2003 and from that point on proceeded to rise steadily up to 32.9 percent in 2006. Considering the impacts of global crises in 2008-2009 and the natural disasters of 2009 the poverty situation could only have gotten worse.
It’s not for lack of rhetoric or strategy that we fi nd our country still with so much poverty and inequality. The results as indicated by the numbers at least should already warrant a questioning of the roadmap (MTPDP) itself. Such a review should cover the strategies, policies, activities, and programs (PAPs) derived from it.
The offi cial report was impressive in its goal-by-goal trends and inequality analysis, identifi cation of gaps and key bottlenecks, and in suggesting possible solutions. But after all is said and done, we are still left wondering why numbers don’t seem to add up and refl ect the deterioration of the national situation.
There was no in-depth review of the roadmap and strategy framework (MTPDP 2004-2010 and the
Updated MTPDP of 2008) and the specifi c policies, activities and projects (PAPs) beyond an inventory of accomplishments and identifi cation of gaps and bottlenecks. The government report assumed that the plans and strategies were correct and would lead us to delivery of the MDG commitments.
The reversal in poverty reduction was explained as being caused by infl ation. The projected further rise post-2006 was attributed to the impact of the global crises of 2008-2009 and the devastation brought about by natural disasters. Persistence of poverty in the poorest areas was on account of social confl icts and rebellions.
The offi cial report admits that the country has done relatively poorly over the last 15 years. Its slow rate of poverty reduction is even surpassed by Indonesia, Cambodia, Lao PDR, Thailand and Vietnam.7 More-over, it is only in the Philippines where the absolute number of poor people increased during the period 1990 to 2005, suggesting that a signifi cant propor-tion of the population have been chronically poor and economic growth scarcely dented the poverty and inequality situation.
On assumption to offi ce in 2001 President Gloria Macapagal Arroyo laid out her framework of governance to achieve her vision of winning the war against poverty within the decade and set specifi c targets to attain this vision: an economic philosophy of free enterprise ap-propriate to the 21st century, a modernized agricultural sector founded on social equity, a social bias toward the disadvantaged to balance economic development, and good governance to build confi dence in the nation and channel resources to the poor.
The previous GMA regime referred to its Medium-Term Philippine Development Plan (MTPDP) 2004-2010 as the country’s anti-poverty plan. Its theme was “fi ght poverty by building prosperity for the greatest number of the Filipino people.” Its fi ve major thematic components covered economic growth and job creation, energy, social justice and basic needs, education and youth opportunity, and anti-corruption and good gov-ernance. It consisted of a Ten-Point Agenda and Legacy hyped as ‘Beat the Odds’: Balanced Budget; Education for All; Automated Elections; Terminate confl ict with the MILF; Healing the wounds of EDSA; Electricity
6 Interview by Philippine Daily Inquirer appearing in its Monday March 8, 2010 headline story More Pinoys poor, GMA adviser admits, Salceda: rich also became richer.
7 Basic Statistics 2008, ADB (as cited in: Pernia, Ernesto. 2010. Population and the future of Children. Discussion paper prepared for the UNICEF Refl ection Session

22 SOCIAL WATCH PHILIPPINES
and Water for all; Opportunities to Create 6 to 10 Million Jobs; Decongesting Metro Manila; Developing Clark; and Subic as Logistics Hub.
From the MDG perspective the MTPDP was a failure. It failed on its promise to reduce the poverty incidence of families by 20 percent come 2010. The Plan’s promised asset reform, delivery of essential services, employment and livelihood, community empowerment—long-standing advocacies of non-state actors—fell short of expectations.
So what happened to the strategies and programs intended to reach the poor and provide for their needs?
The Kapit-Bisig Laban sa Kahirapan (KALAHI) was the overarching strategy and program. It was sup-posed to provide coherence to all other poverty-targeted programs, activities, and projects (PAPs).
The Pantawid Pamilyang Pilipino Program (4Ps) was launched in 2008 as a poverty reduction program through conditional cash transfers (CCTs) for the one million poorest families to improve health, nutrition, and education outcomes of their children. The 4Ps entitled benefi ciary households an average monthly cash subsidy of PHP 1,400 for a period of fi ve years. The health pack-age provided Php 500 per household per month. The education package granted Php 300 monthly per child for ten months (corresponding to one school year) for a maximum of three children per household.
In 2008, the 4Ps had been implemented nation-wide providing cash grants to a total of 337,416 poor households for the period January to December 2008 or 105 percent of the targeted 321,000 poor households for the year.
The 4Ps directly addressed the MDGs 2 and 5 on achieving universal primary education and on reducing maternal mortality ratio. Since MDGs 2 and 5 remain at great risk the 4Ps claim to success must be in ques-tion. Anecdotal accounts speak of certain moral hazards arising out of this direct cash subsidy. CCTs seemed to foster dependency.
The Accelerated Hunger Mitigation Program (AHMP) was launched in 2007 as a strategy to address hunger in 42 priority provinces identifi ed through the Social Weather Stations (SWS) surveys. The AHMP sought to reduce the hungry households by fi fty percent from 1.2 million to 600,000 households.
The AHMP was a framework that included both supply side and demand side interventions. The sup-ply side strategy included increasing food production
and enhancing the effi ciency of logistics and food delivery involving seed subsidies, technical assistance on intercropping corn with coconut, rehabilitation of irrigation facilities, among others. The programs included the Barangay Bagsakan (formerly Barangay Food Terminals) and the Tindahan Natin (TN), com-munity stores selling cheap basic food items in poor communities. Also included were the construction of roll-on roll-off (RORO) ports and farm-to-market roads, the Food-for-School Program of the DSWD and the Department of Education (DepEd).
The so-called demand side strategy entailed put-ting more money in poor people’s pockets through livelihood skills training, microfi nance, upland land distribution for cultivation of rubber, jathropa and other cash crops, and the promotion of good nutrition education and population management.
The government claimed that from 2004 to Sep-tember 2008, a total of 570,360 hectares were distrib-uted by the Department of Agrarian Reform (DAR). This accounted for 90.5 percent of the revised land distribution target of 630,046 hectares for 2004-2008. When the Comprehensive Agrarian Reform Program (CARP) ended in 2008 the Department of Agrarian Reform (DAR) was still grappling with a huge land distribution balance of 1,337,538 hectares.
Following the Indigenous Peoples Rights Act (IPRA) of 1997, the government awarded 85 Cer-tifi cates of Ancestral Domain Titles (CADTs) and 145 Certifi cates of Ancestral Land Titles (CALTs) from 2004 to December 2008. This represented only 28 and 36 percent of the 2010 Plan targets of 306 CADTs and 405 CALTs, respectively. To pursue development within ancestral domains, 48 Ancestral Domain Sustainable Development and Protection Plans (ADSDPPs) were formulated during the period 2004 to 2007.
Policies and laws were put in place for the welfare, development and empowerment of the vulnerable groups. Major legislations included the Expanded Senior Citizens Act of 2010, Anti-Violence Against Women and Their Children Act of 2004, Amendment to the Magna Carta for Disabled Persons, the Juvenile Justice and Welfare Act of 2006, the Magna Carta for Women, and the adoption of Children and Anti Pornography Act.
Poor and vulnerable groups were continuously provided with community-based services. By September 2008, groups assisted included (a) 380,145 children in need of special protection; (b) 21,761 youth with

Winning the Numbers, Losing the War: The Other MDG Report 2010 23
special needs; (c) 228,928 women in especially diffi cult circumstances; (d) 34,238 persons with disabilities; and (e) 11,197 older persons. Relief and rehabilitation to di-saster victims reportedly benefi ted 3,982,168 families.
The Kapit-Bisig Laban sa Kahirapan – Comprehen-sive and Integrated Delivery of Social Services (KALAHI-CIDSS) project aimed to empower communities, improve local governance, and reduce poverty through capability building and skills training in development planning, resource allocation, and management. KA-LAHI-CIDSS enabled community participation in situation analysis, project planning and implementa-tion, and fi nancial and project management.
By end of 2009, the KALAHI-CIDSS project was reported to have been institutionalized and imple-mented in 42 provinces (100%), 184 municipalities (100%) and 4,229 barangays (100%). Under this program, 2,826 subprojects were completed covering mainly construction and rehabilitation of: roads (742), potable water sources (682), health stations (240), schools (281) and day care centers (206). Increase in KALAHI-CIDSS coverage was attributed to opera-tional improvement and timely release of funds.
The Community-Based Monitoring System (CBMS) aided the nationwide adoption and implemen-tation of the enhanced Core Local Poverty Indicators Monitoring System (CLPIMS) for local empower-ment. By February 2010, CBMS had been adopted and implemented in 59 provinces (31 of which were province-wide), 51 cities, 679 municipalities, and 17,521 barangays.
Because government continued to be in defi cit, most of these programs ran on borrowed money, including loans from multilateral development banks and bilateral aid agencies. As such, the reported ac-complishments of the MTPDP and the PAPs fell short of the mark.
Targeted social protectionSocial protection in the Philippines is not univer-
sal; it is simply a bundle of safety net measures targeted at the poorest of the poor. It is not a rights-based entitle-
ment for all citizens. It does not address the structural causes of poverty but only vulnerabilities associated with being poor and risks of falling into poverty.
Whereas the MTPDP worried about economic growth by any means, the KALAHI and its associated programs took care of the fallouts.
Since KALAHI targeted only the ‘poorest of the poor’ many poor remained excluded from the govern-ment’s anti-poverty programs.
Growth without development
In May 2010 the outgoing regime announced a 7.3-percent fi rst quarter GDP growth, the highest in three decades. Shortly after, the Department of Finance (DOF) announced its projection of a 4-5 percent quarterly increase in 2010, with GDP expected to reach 8.53 trillion pesos.8 GDP refers to total value of products and services generated within the country at any given time.
In 2008, the Philippines registered the third highest, after India and China, in remittances among Asia-Pacific migrant-sending countries.9 It posted US$18.643 B, equivalent to 11.3 percent of 2007 GDP in comparison to India’s 3.3 percent (US$51.974B) and China’s 1.0 percent (US$40.641B).
Growth in the economy has been held up as the crowning legacy of the previous regime. What is this exactly? Obviously, our economy registered consistent positive growth since 2000.10 But it’s growing in the wrong places, and its growth regardless of social and environmental costs. Debt stocks and debt service are growing or remain at high levels. Remittances by overseas Filipinos have grown most remarkably in re-cent years. So have shopping malls and other icons of consumerism. Taxes have grown. Ordinary citizens and fi xed-income earners get taxed heavily even as a select group of big taxpayers get all sorts of tax breaks and deductions, not to mention tax evasion.
According to Balisacan and Pernia (2002) and Balisacan and Hill (2003, 2007),11 income growth does not necessarily translate into welfare improvement for the poor. Indeed a one percent growth in GNP or
8 Philippine Daily Inquirer Thursday June 17, 2010. RP to grow by 4-5 % a quarter in ’10, DOF says.9 Asia-Pacifi c Regional Report 2009/10. Achieving the Millennium Development Goals in an Era of Global Uncertainty. UNESCAP, ADB
& UNDP.10 This was noted in the MDG Midterm Shadow Report 2007 of Social Watch Philippines, Serrano, I.R. Can the Philippines deliver, and
how?11 The Philippines Fourth Progress Report on the Millennium Development Goals (MDGs) 2010 referred to these studies in its discussion of
“growth elasticity of poverty reduction”, an indicator showing the effect of economic growth on poverty reduction.

24 SOCIAL WATCH PHILIPPINES
GDP does not automatically convert to a one percent reduction in poverty. Otherwise, we would have done away with poverty way before 2015.
Former NEDA chief Cielito Habito12 calls it narrow, shallow and hollow growth or poverty-raising growth that benefi ts few industries, few regions, few sectors of society. The kind of growth we’re seeing is so far removed from the so-called ‘inclusive growth’ of the multilateral development banks.
If anything, what we have is growth without de-velopment. Or more precisely, plain economic growth, and certainly not sustainable development. A strategic goal of development policy set as early as the 1990s, sus-tainable development means that environment cannot be treated as mere input into economic development which has been the case ever since.
Too many peoplePopulation continues to be a challenging concern.
Failure to reduce poverty and inequality underlies the problem. Those with more money and more secure futures tend to have fewer children. The poor have bigger families and rely on numbers as productive as-sets and as their old-fashioned social security fallback for old-age.
Our population was 62.1 million in 1990, 68.6 million in 1995, 76.5 million in 2000, 81.1 million by 2003 and 88.5 million in 2007. Although the population growth rate (PGR) has decreased from a high of 2.36 percent a year in 2000 to 2.04 percent in the 2007 census, it is still considered to be one of the highest in Asia.13
Poverty in the Philippines may be explained in part by population growth. It seems that the government is in a state of denial or plain indecisiveness in meeting the policy challenge. As in the past, population has been a very contentious issue that continues to divide the nation.
Carrying capacity is a real serious problem in a largely mountainous archipelago inhabited by over 90 million and projected to grow to over 100 million by 2015. The high population growth rate makes the country vulnerable. For sustainable development and
quality of life one study14 on carrying capacity recom-mended that for each person a total of 0.004 sq. km or 0.4 hectares would be needed to satisfy the opti-mum Filipino food requirement/capacity. The study suggested that the country had long ago exceeded its carrying capacity.
So much inequalityThe high inequality baseline has hardly changed in
over fi fteen years. It has slightly improved from 0.4680 in 1991 to 0.4580 in 2006.15
The Philippines has a relatively high inequal-ity compared with most of its Asian neighbors. It is only slightly better-off than most Latin American countries.
Income distribution in the country remains largely unequal. The gap between the richest 20 percent and the bottom poorest is widening in spite of the reform measures, including land reform and local autonomy, thus far put in place and implemented.
The regions with the most inequitable income distribution are Central Visayas, Eastern Visayas, Zamboanga Peninsula, Northern Mindanao and CARAGA. These regions have Gini coeffi cients higher than 0.44.
There is wide inequality among the country’s regions, provinces and municipalities. More than 50 percent of the top 20 poorest provinces were from Mindanao in the years 2003 and 2006, with Tawi-Tawi having the highest poverty incidence in 2006.
The situation in Mindanao may be due in part to the seemingly endless confl ict and peace and order problems but its roots go much deeper. Mindanao is such a rich area it could be a country by itself if it were to be autonomous or totally independent. How could it even fail to make progress on so basic a goal as the MDGs?
The poverty and inequality that continues to hound Mindanao, especially the Moro and lumad areas, are rooted in historical injustices and discrimina-tion dating back to our colonial past and perpetrated by a succession of post-colonial regimes. They are imbedded in unjust economic, political, and socio-
12 Habito, Cielito F. ‘Narrow, shallow and hollow growth’ No Free Lunch, Philippine Daily Inquirer Tuesday, June 22, 2010.13 UNESCAP Statistical Yearbook for Asia and the Pacifi c, 2007.14 Prof. Ted Mendoza of the University of the Philippines at Los Banos estimated the area requirement of six key food items (rice, fruits,
vegetables, meat, egg, fi sh) consumed by each person at a minimum level annually (Journal of Crop Science).15 Income inequality, or disparity, is commonly measured through the Gini coeffi cient ratio. A Gini ratio of zero means perfect equality while
a ratio of one (1) implies perfect inequality.
Winning the Numbers, Losing the War: The Other MDG Report 2010 25
cultural structures urgently needing to be changed. The government itself had long ago realized that war is not the answer.
Too much corruptionCorruption in government is seen by many as a
major cause of poverty in the Philippines.No study has yet come out to say exactly how
much has been lost and continues to be lost to corrup-tion. Some guesses put it at 25 percent of the annual budget, at least.
In 2004 PGMA said that corruption was strangling the Philippines, and called on its citizens to “join hands to root out this evil.” In 2010, corruption is widely believed to have worsened under her regime.
Corruption may be a big problem and curbing it is a big part of the solution. But note that our country’s corruption level16 is just as much as China’s, thus sug-gesting it can only explain in part why we are where we are now.
Unsustainable debt Government borrows a lot to reduce poverty. Its
major anti-poverty programs, like conditional cash transfer, ran on borrowed money.
About a third of the budget every year is taken away from the national budget to pay for the interest and principal of the country’s mounting debt stock. That’s a third of the pie sliced off from poverty reduc-tion activities.
The National Government’s debt stock stood at Php 4.436 trillion as of end-April 2010. Of the total outstanding debt, Php 1.888 trillion is owed to foreign creditors, accounting for 43 percent of the debt pie. Php 2.548 trillion or 57 percent is owed to domestic creditors.
The contingent debt of the National Govern-ment rose to Php 603.8 billion composed mainly of guarantees.
The government is in a tight fi scal fi x due to the widening budget defi cit, poor tax collection, and ram-pant corruption. The budget gap is expected to reach up to about Php 325 billion in 2010.
Not enough fi nancing for MDGsThe MDGs has been more honoured in word
than in action. The best proof of that is shown in fi nancing.
MDGs are mostly refl ected in the government expenditures for social and economic services. Based on the Department of Budget and Management (DBM) Budget of Expenditures and Sources of Financing, na-tional government expenditures for social and economic services decreased from the late 1990s until 2005. Social services expenditures as a percentage of GDP steadily decreased from 1999 (6.48%) down to 2005 (4.69%). Also, expenditures for economic services as percentage of GDP were in a downward trend from 1990 (5.01%) to 2005 (3.19%).
Spending for social and economic services as a percentage of total national government expenditures has been declining.
Historically, education, culture and manpower development received the largest share from the budget, averaging about 17 percent of the National Govern-ment (NG) total expenditures for the period 1990-2009. However, this is below the international standard of allocating 20 percent of total budget expenditures for education. Over the years, the share of education to total NG expenditures has been shrinking: 19.88 percent in 1998; 19.06 percent in 1999; and 13.80 percent in 2006. As a percentage of the GDP, NG expenditure on education was highest in 1998 at 4.0 percent of GDP. Since then, it has been declining and by 2009, it was down to 2.5 percent. UNESCO sets the desirable level of expenditure for education at 6.0 percent of GDP.
The NG share of health expenditures to GDP has generally declined: 0.7 percent in 1990; 0.4 percent in 1995; 0.4 percent in 2000; and 0.3 percent in 2008. Based on the 2005 Philippine National Health Ac-counts (PNHA), the share of total health expenditure (NG, LGU, social insurance, private sources) to GDP was 3.4 percent and 3.3 percent in 2004 and 2005, respectively. This is below the 5 percent standard set by the World Health Organization (WHO) for develop-ing countries.
LGU expenditures contracted from 2001 to 2005, after exhibiting an upward trend during the period 1996-2000. The social sectors appeared to have been given lower priority relative to the other sectors, e.g. public administration.
16 Walden Bello, 2010. Reaching the Philippines’ MDG Targets: Why Policy Paradigms Matter. Paper presentation at the PLPCD Conference, ‘Human Development in the Phil’s: Context & Challenges: Policy Gaps & Opportunities in the 15th Congress,’ Crowne Plaza Galleria.

26 SOCIAL WATCH PHILIPPINES
Conclusions and RecommendationsThe Philippines is in a worse poverty situation
in 2010 than when it started on the MDGs in 2000. Many of the quantitative indicators on key goals (MDGs 1, 2, 5) are still between the low and medium probability of achievement when they should all be on the high side going into the last fi ve years. Underlying these numbers were much grimmer realities of poverty and exclusion on account of location, gender, ethnicity, religion or racial profi le.
The picture of inequality has hardly changed since 2000. The poor live in rural communities far from Manila—in Bicol, Visayas, and Mindanao. They are the landless, homeless, jobless, underemployed, uneducated, sick, malnourished, discriminated Filipi-nos. Many of them are women, Muslims, Indigenous Peoples and tribal Filipinos.
What we have seen since 2000 shows that the government is losing the war on poverty, and not for lack of rhetoric and trying. The policy declarations and national development plans were MDG-oriented, and so were the strategies, programs, activities and projects that derived from them. The policy-action gap as explanation was obvious: government did not spend enough for the MDGs. But there might have been other less obvious reasons due to the fl aws in the poverty strategies themselves.
The different articles in this alternative report each in their own way try to uncover those reasons to understand what’s hindering us from the achieving the minimalist MDG targets.
Keeping the MDG promises by 2015 is an essential step before we can proceed to aspire for higher standards of well-being for all Filipinos. Probably, the government will still be able to keep its MDG promises by 2015. Nothing in the offi cial report says any target is out of reach. A low probability prospect simply suggests that much more needs to be done to get back on track.
MDG catch up The MDG catch up plan needs to focus on where
we’re lagging behind—MDGs 1, 2 and 5.For MDG 1 this means jobs, decent work gen-
erated out of the many problems (social, economic, political, and environmental) we face as a nation. Rural workers in huge numbers can be absorbed in sustain-able/organic agriculture, coastal resource management, agroforestry, and light infrastructure like farm-to-mar-ket roads, communal irrigation, potable water, and
renewable energy systems. The government may follow the lead of China
and Korea who are spending a large percentage of their national budgets to create green jobs. A similar stimulus package may be included in the national budget of the Philippines.
The land distribution backlog of 1.1 million hect-ares must be completed as soon as possible. Benefi ciaries of land reform must be given all the necessary support to make their lands productive and help achieve food security for the country.
For MDG 2, this means ensuring that all children are in school. Out-of-school youth from the past ten years must be encouraged to come back. The best and brightest graduates in all courses may be encouraged to teach in the provinces by giving them salaries and benefi ts equivalent to what they would get if they worked abroad.
For MDG 5 the government has to make sure that all births are attended by skilled health profes-sionals and women have easy access to reproductive health services.
The national budgets beginning 2011 until 2015 must be MDG-dedicated. The General Appropriations Acts (GAAs) to be enacted for those years should be pre-audited for their MDG-sensitivity.
The Manasan study can be the initial take-off point. Based on this study, for the year 2010 alone, about Php 112.2 billion or 1.16% of GDP is needed to fi ll in the resource gap for the MDGs. For the period 2010-2015, around Php 480.8 billion or 0.67% of GDP is needed to meet the targets.
Beyond MDGsSocial Watch has always stressed that the MDGs
are set at a low bar to begin with. These goals are so basic that achieving them all would simply mean having done away with extreme forms of deprivation.
The reforms needed should be encompassing and far-reaching. For example, the current land reform will not suffi ce. We need an arrangement that takes into account access and modes of utilization of every square meter of our 30-million hectare archipelago, to say nothing yet about the coastal zones and marine areas beyond.
Poverty is central to our vulnerability to climate change and climate variability. Our food systems, land and water resources, our human infrastructure are at great risk. Ending poverty will surely raise our adaptive

Winning the Numbers, Losing the War: The Other MDG Report 2010 27
capacity to confront the dreaded climate and weather scenarios.
The Medium Term Philippine Development Plan (MTPDP) and the Medium Term Philippine Invest-ment Plan (MTPIP) must be pre-audited not only for their MDG-fi t but also for their sensitivity to climate risks. Annual Investment Plans (AIPs) and annual budgets at all levels must be aligned accordingly. The National Climate Change Adaptation Plan may be used as one reference during the planning and budgeting exercises.
An MDG-sensitive budget should be able to ad-dress and rectify the inequalities highlighted in this report. Beyond that, the national and local budgets should be an equalizer. It must be a democratic instru-ment that will help eliminate poverty and inequality in all their dimensions—class, gender, spatial, ideological, cultural, generational.
The government must ensure people participation at all times in all levels. The poor must be given all the necessary means and scope to actively participate in poverty eradication.
Education, health, decent work, livelihood, food security for all (not just for a half or for two-thirds of the poor) are a basic minimum in any decent society. No less is expected from any regime that truly cares for human rights and the security of every citizen.
Let’s make sure no Filipino is left behind.
References
ADB, 2008. Basic Statistics, (as cited in: Pernia, Ernesto. 2010. Population and the future of Children. Discussion paper pre-pared for the UNICEF Refl ection Session.
Asia-Pacifi c Regional Report 2009/10. Achieving the Millennium Development Goals in an Era of Global Uncertainty. UNESCAP, ADB & UNDP.
Balisacan and Hill, 2003, & 2007. Cited in Philippines Fourth Progress Report on the MDGs, Third Draft, 07/12/2010.
Habito, C. F., June 22, 2010. ‘Narrow, shallow and hollow growth’ No Free Lunch. Philippine Daily Inquirer.
Mendoza, T., 2008: Philippine Journal of Crop Science.NSCB data.National Statistics Offi ce.Philippine Daily Inquirer, March 8, 2010. More Pinoys poor, GMA
adviser admits, Salceda: rich also became richer. Headline story.Philippine Daily Inquirer, June 17, 2010. RP to grow by 4-5 %
a quarter in ’10, DOF says.Philippines Fourth Progress Report on the MDGs, Third Draft,
07/12/2010.Serrano, I.R., 2007. Can the Philippines deliver, and how? MDG
Midterm Shadow Report 2007 of Social Watch Philippines.UNESCAP Statistical Yearbook for Asia and the Pacifi c, 2007.UN Millennium Campaign (UNMC) and Global Call to Action
Against Poverty (GCAP). ‘Making poverty history’. Banner slogan.
Walden Bello, 2010. Reaching the Philippines’ MDG Targets: Why Policy Paradigms Matter. Paper presentation at the PLPCD Conference, ‘Human Development in the Phil’s: Context & Challenges: Policy Gaps & Opportunities in the 15th Congress,’ Crowne Plaza Galleria.
World Bank and AusAID, May 2010. Behind the veil of confl ict: moving towards economic integration for sustained develop-ment in Mindanao, Philippines.


On poverty, hunger and employment: Off-track but not without hope
Winning the Numbers, Losing the War: The Other MDG Report 2010 29
By MARIVIC RAQUIZA
Summary
T he pace of poverty reduction in the Philippines did not only deceler-
ate but has actually been reversed, and poverty incidence is expected
to register a further increase in the next round of offi cial estimates.
Self-rated hunger, which is a reliable indicator, is at record levels. Furthermore,
a signifi cant section of our people, many women and young people, are resorting
to part-time and low productive work in order to augment family incomes, especially in the context of
the multiple crises that have recently hit the country. Most anti-poverty programs of the government
only provide short-term relief, or, at best, poverty reduction but at localized levels. The government’s
over-all offi cial development strategy must be examined to understand why poverty, and inequality,
remain stubborn problems. Indeed, on certain issues like debt, trade and aid, and foreshadowing the
MDG 8 chapter, it is likely that many policy positions taken have meant even increased impoverish-
ment for our people.

30 SOCIAL WATCH PHILIPPINES
MDG Goal 1 Targets 1 and 3: On eradicating extreme poverty and hungerOn poverty
The dominant and offi cial paradigm to measure poverty in the Philippines and elsewhere is the mon-etary approach. It is the basis for measuring success or failure in reaching MDG 1.
The Philippine government began to monitor poverty trends in 1985, and since then, has changed its methodology twice—in 1992 and 2002. In both cases, the changes resulted in the lowering of poverty incidence. While this has caused many to wonder whether such a move was part of the government’s attempt at window-dressing, the government has con-sistently maintained that these changes were the result of refi nements in estimation procedures.
Since 1985, the offi cial poverty line1 has been on a slow, downward trend across the latter half of the eighties and throughout the nineties. This trend was echoed into the millennium, from year 2000 until 2003. After that, offi cial poverty, for the fi rst time in recorded history, experienced a reversal, when the poverty incidence rose by almost 3% from 2003 to 2006. It must be noted that the results of the 2006 Family Income and Expenditure Survey (FIES) were only offi cially announced in March 20082; prior to this, the government was still standing by the 2003 FIES results of poverty reduction, at a time when many sec-tors in society began to complain of a worsening of the quality of life. How did the government explain the rise in poverty incidence? A NEDA statement (March 5, 2008) cited three factors for the increase in poverty incidence: 1) government’s expansion of the value added tax (VAT) coverage in November 2005 and the imposed higher tax rate in February 2006, 2) higher oil prices, and 3) population growth which grew faster than personal incomes.
To begin with, many in civil society have argued that the methodology to measure poverty uses a very low poverty threshold which has resulted in a much
lower poverty incidence. Poverty threshold3 means the minimum amount needed to cover both the food and non-food requirements of a family. As former National Statistics Offi ce Administrator Tomas Africa states, “the offi cial poverty line is a conservative estimate; if poverty goes up, then the situation must really be bad on the ground”.4
Currently, the monthly poverty threshold is Php 6,273.75 for a family of fi ve members and this trans-lates to Php 41 per person per day. The Global Call to Action Against Poverty (GCAP) in fact turned this unrealistically low poverty threshold into a campaign by stating the obvious: that Php 41 per day is not enough to cover the food and non-food expenses (e.g., medical, educational, transportation, rental expenses) of anyone. Finally, this paper argues that an unrealistically low poverty threshold has two serious implications: One, that the poor can be found not just below, but also above the poverty line; and Two, it has the effect of making the public accept that segments of our people who live in wretched conditions are not part of the ‘deserving poor’ and consequently do not oblige the State to provide help.
Many analysts already anticipate a further increase in poverty incidence to be refl ected in the upcoming 2009 FIES due to the multiple crises that have struck the country in recent years. The year 2008 ushered in three crises: the food, the fuel, and the global fi -nancial crisis. The fi rst two resulted in high infl ation rates which pushed some three million Filipinos into poverty, widening the poverty gap and intensifying poverty severity. The impact of the third crisis, mostly in the form of job losses, was less in the Philippines compared to other countries. Dejardin6 argues that this is because exposure was mostly felt in the export-oriented manufacturing sector, with the electronics sector in particular taking the hardest hit. Still, some 1.4 million Filipinos are expected to fall into poverty this year as a result of the global fi nancial crisis.5 Apart from these crises, there is also a need to take into ac-
1 Offi cial poverty is that which is monitored by government as against other types of poverty monitored using other methods (e.g., self-rated poverty used by the Social Weather Station).
2 The 2006 FIES was announced in March 2008 although preliminary results were made public in October 2007.3 Poverty threshold is low for a number of reasons:1) actual food expenses of Filipino families are higher than the costs used for the
artifi cially constructed food baskets; 2) it does not include those who: consume ‘non-basic’ items such as alcoholic beverages, cigarettes; enjoy recreational activities; or those who have access to durable goods; 3) the non-food component that goes to measure the poverty threshold is merely a statistical norm and makes no attempt to verify if this is suffi cient to cover non-food needs.
4 Interview 11 July 2008, Raquiza 2008.5 World Bank, 2009.6 Dejardin, A. K., 2010.
Winning the Numbers, Losing the War: The Other MDG Report 2010 31
count the negative impact of subsequent shocks on poverty and hunger that hit the country in 2009 and early 2010, that is, tropical storm Ondoy, typhoon Pepeng and the effects of El Niño.
On hungerHunger levels tell a more dramatic story. This
paper will use the Social Weather Station (SWS) self-rated hunger7 as the indicator to measure hunger. As a concept, there is less ambiguity in perceptions of hunger since it basically refers to the lack of food and its conse-quent biological expression, that of hunger. As Manga-has7 argues, self-rated hunger levels are “as objective as the standard of statistical measures of unemployment and underemployment which rely on self-reporting by respondents and are in principle verifi able by observers such as their neighbors.” In fact, one major anti-hunger program of the government, the Accelerated Hunger Mitigation Plan (AHMP), was prioritized in 2007 as a response to the high levels of self-rated hunger reported by the SWS. Today, the AHMP operates in 42 provinces identifi ed by a survey which uses the self-rated hunger questions of the SWS.8
SWS starting monitoring hunger levels in 1998 on a quarterly basis; in 1998, hunger levels see-sawed within the range of 6.5% to 14.5% but hunger levels reached a new high with the assumption of Arroyo as Philippine president, in 2001, at 16.1%. Shortly thereafter, hunger levels went down to as low as 5.1% in September 2003, but starting June 2004 these climbed to double digit levels, and never returned to single digit levels, reaching an all-time high of 21.5% in Septem-ber 2007, which soared higher to 23.7% in December 2008 and 24% in December 2009. In the fi rst quarter of 2010, hunger levels only slightly dipped to 21.2% (or 4 million families). In this context, this paper argues that the target of halving the proportion of people who suffer from hunger (using 1998 as the base as there is no data prior to this) is way off-track.
Undernutrition remains to be a serious public health problem in the country. According to the offi cial report, there is an average decline of 1.25 percentage points per year. At this rate, the country will miss the target of 34.7 (as it will only reach 41.9% by 2015).
Obviously, much more work needs to be done. Further-more, we have yet to check the adverse effects of the events after 2005 on poverty and hunger, especially the crises in 2008 and subsequent calamities that visited the country (storms, and drought) in 2009 and 2010.
According to the 2008 National Nutrition Survey (NNS), about 3 out of 10 children are undernourished. The prevalence of underweight and underheight chil-dren under 5 years old remains high at 26.2%, and 27.9% respectively in 2008. This fi gure is comparable to the prevalence of underweight children under 5 years of age in Sub-Saharan Africa (28%, 1996-2004).9
Undernutrition is largely a rural phenomenon with MIMAROPA, the Bicol Region, Regions VIII and IX leading in the ranks (see Table 1). The poverty incidence in these respective regions supports the fact that hunger is closely intertwined with poverty. Region IX for example, where the poorest town in the country is located, consistently ranks in the top two regions with highest prevalence of underweight, underheight and thin children under 5 years.
Increased poverty as a result of confl ict also domi-nated many areas of Muslim Mindanao, areas which are already amongst the provinces with the lowest access to basic social services and the highest poverty rates. From 2000 to 2009, yearly clashes between the military and rebels in Muslim Mindanao resulted in the displacement of hundreds of thousands. Social exclusion in the form of identity-based discrimination is an enduring cause of poverty; some Muslims lament about the diffi culty of fi nding employment in urban centers once potential employers fi nd out that they have Islamic names. As a result, many poor Muslims fall back to self-employment types of activities (e.g., selling of wares).
In a discussion with members from the urban poor sector, many have also observed the rise in prostitution; a women’s NGO10 reported stories of women exchang-ing sexual favors in exchange for fi sh or vegetables (‘palit isda’ and ‘palit bigas’). These stories underscore the desperation some women face, and ‘survival tactics’ they resort to in order to survive. This is an example of the gender differentiated impact of poverty, which rests on the exploitation of women. More research is
7 According to Mangahas, the SWS hunger is the proportion of household heads who state that their families have experienced hunger (e.g. without having anything to eat) at least once in the last 3 months (2008: 23)
8 Reyes, Celia M. (2010). Philippines Fourth Progress Report on the MDGs, NEDA-UNDP 9 UNICEF State of the World’s Children 2006.10 Center for Women’s Resources.

32 SOCIAL WATCH PHILIPPINES
necessary, not only to validate these observations, but to further understand how worsening poverty hits dif-ferent segments of the poor, and their coping strategies, including attempts at survival.
MDG Goal 1 Target 2: On achieving full and productive employment and decent work for all, including women and young peopleOverall status
The Philippines has one of the highest levels of unemployment and underemployment in Asia (see Table 2). Unemployment fi gures stayed on average at 10.6 % from the late 1990’s to 2004. After that, unemployment levels fell to a single digit but only after the Philippine government re-defi ned employment to conform to ILO standards. Since then, unemployment rates have hovered in the vicinity of 7% from 2007 to the present.
From 1990 to 1996, even when employment levels increased, marked by an average annual labor growth rate of 3.7% (or 833,000 entrants a year), this did not always mean an increase in full and productive employment.
Unemployment rates decreased to 8.4% in 1996 (from 9.5% the previous year) and concentrated mostly
in the age group 15-24 years old, mostly out-of-school youth, and unskilled.
In 1996, average weekly hours fell from 42 hours (in 1995) to 41.2 hours. This meant a decrease of full-time employment from 64.8% to 62.6% and an increase in part-time employment from 34% to 36.2%. In the meantime, underemployment grew to 20.9 in 1996 (up from 20% in 1995).
Underemployment is a much more serious prob-lem as its magnitude is much higher—20.9% of the employed, and it hits all age groups in the Philippines. It is also important to note that underemployment during this period is a largely rural phenomenon. Table 3 shows how a signifi cant number of agricultural workers are classifi ed as unpaid family workers from 2001 to 2007, and count more women than men each year.
A signifi cant part of those who found employment in 1996 were in the agricultural and services sector where jobs are characterized by short working hours, seasonal/unstable, with low productivity and earnings. The industry sector, where better jobs can be found, made up barely one-fi fth of total additional employ-ment during this period.
However, the services sector has been the biggest source of employment for some time. According to
Region Underweight Underheight Thinness Philippines 26.2 27.9 6.1 I 26.1 23.9 6.7 II 23.9 24.3 5.9 III 20.2 18.9 6.2 CAR 19.9 29.5 5.2 NCR 20.7 20.1 6.1 IV-A 21.5 21.3 5.4 IV-B (MIMAROPA) 33.1 31.6 6.9 V (Bicol) 33.8 33.5 7.2
VI 31.9 33.6 7.1
VII 25.8 31.1 4.3 VIII 32.1 37.6 5.6 IX 33.3 37.9 7.3 X 26 32.3 5.5 XI 26.3 31.6 4.8 XII 30.5 34.1 5.4 CARAGA 28.8 31.6 6.1 ARMM 28.8 34.7 9.6
Table 1. Prevalence of undernutrition per region, % of children 0-5 years old, 2008
Source: 7th National Nutrition Survey

Winning the Numbers, Losing the War: The Other MDG Report 2010 33
Source: Current Labor Statistics, Bureau of Labor & Employment Statistics, July 2010
Country Period Covered Unemployment Rate
Current A Year Ago
Brunei 2010 (2008 Estimate) 3.7 3.7
Indonesia 2010 (2009 Estimate) 7.7 8.4
Malaysia 2010 (2009 Estimate) 5.0 3.3
Philippines 2010 (January) 7.3 7.7
Singapore 2010 (2009 Estimate) 3.0 2.2
South Korea 2010 (2009 Estimate) 4.1 3.2
Taiwan 2010 (2009 Estimate) 5.9 4.1
Thailand 2010 (2009 Estimate) 1.6 1.4
Vietnam 2010 (2009 Apr 30 Estimate) 2.9 4.7
Table 2. Comparative Unemployment Rates in Selected Asian Countries: 2009-2010
Table 3: Distribution of workers in agriculture by class, year, type, 2001-2007 (in thousands)
Source: National Statistical Coordination Board (NSCB)
2001 2002 2003 2004 2005 2006 2007
F M F M F M F M F M F M F M Wages and salary
542 1,800 504 2,015 596 2,207 598 2,418 578 2,016 539 2005 524 2,333
Own-account worker
844 4,104 906 4,902 921 5,108 861 5,128 881 4,384 854 4,366 891 5,238
Unpaid family worker
1,464 1,348 1,530 1,433 1,507 1,340 1,476 1,305 1,585 1,320 1,636 1,354 1,663 1,511
Dejardin before the 2008 global fi nancial crisis struck, the services sector expanded in 1990 from 40% - 47% in 2000 to 49% in 2007 and came in the form of wholesale and retail trade, personal services (e.g., pri-vate households), transport and other business services. During this period, agricultural employment decreased from 45% in 1990 to 38% of men’s employment and 23% of women’s employment in 2007. Furthermore, manufacturing shrunk from providing 10% of total employment in 1996 to 9.1% in 2007 and industry stagnated from 16 to 15%.
Indeed, labor productivity (the labor income share of GDP) fell from 0.262 to 0.234 from 2000 to 2005 which is way below the level of other Asian middle-income countries which stands at 0.506.
Dejardin observes that the men who lost op-portunities in agriculture transferred to construction,
transport, storage and communications, trade and services. Also, unlike in the ‘70s and ‘80s, manufactur-ing stopped being a major source of employment for women, and work opportunities for them became more focused on trade and services, and in domestic work in private households.
Private establishments provided three-fourths of wage employment at this time, but according to Dejardin11 employment expansion in this sector occurred mostly in the informal economy (e.g., private households and family-owned businesses) from 2004 to 2007. Men were increasingly taking up work in this sector although women still out-numbered men six to one. Dejardin notes that since the ‘90s, men’s unemployment rates have increased more rapidly compared to women such that by 2000, the national gender gap had narrowed and by
11 The public sector accounted for 15 percent and private households about 10 percent of wage employment

34 SOCIAL WATCH PHILIPPINES
2007, women’s national unemployment rates were lower than men’s.
What were the labor trends in 2008 to 2009 noting the context of the three crises earlier discussed? Labor force participation rates were declining from 2005 to 2008, but began to rise from the 3rd quarter of 2008 until the end of 2009. It is interesting to note that this uptrend was driven by women, the very young (15-19 years old) and much older workers (55-64 years old) and those without a secondary education. According to Dejardin, during periods of economic downturn, when main breadwinners (usually considered the men) lose their jobs, the ‘added-worker’ effect kicks in; that is, families mobilize additional income-earners which means that women’s work hours are lengthened, as they are now busy with both reproductive and productive work.
Furthermore, unemployment levels began to rise in the 4th quarter of 2008, for both women and men, and employment levels for those aged 20-24 fell. However, this paper agrees with the Bureau of Labor and Employment Statistics (BLES) 2010 report that states that unemployment levels as an indicator do not capture important labor trends given that the country’s labor force is signifi cantly composed of self-employed workers and unpaid family workers. Indeed, in a country where the coverage of social security is low, and without unemployment insur-ance, the people have no other recourse but to work in order to survive.6
During the economic downturn experienced in 2008-2009, GDP growth rate fell to 1.1%, yet, employ-ment continued to grow to 2.9%. It is important to ask: what kind of employment? Data shows that growth occurred mostly among part-time workers (8.4%) while full-time work actually fell (-0.5). According to BLES, this also happened during the Asian fi nancial crisis and the 2001 economic slowdown due to political events. The reverse is true of course, in good economic times: employment including full-time work goes up. The one exception was in 2006 when full-time work fell and part-time work went up at a time of stable economic growth.
The labor fi gures in 2009-2010 illustrate the rise in jobs found in the informal sector: while the numbers of those employed grew from 35,477 to 35, 992, the numbers of those underemployed also rose from 6,875 to 7,102 persons. This underscores a marked increase in part-time and low productive work.
Indeed, by the fi rst half of 2009, the number of full-time jobs plummeted compared to 2008 levels, and an increase in full-time work in the latter half of 2009 was not enough to offset the number of full-time work previously lost. This was the result of many companies resorting to shorter and more ‘fl exible’ arrangements for their workers, in the face of falling export/market demand. In the second quarter of 2009, part-time work increased, mostly in the form of self-employ-ment (e.g., own account and unpaid family members) of women and very young workers 15-19 years old, but in the second half of 2009, wage employment was driving the increase in part-time work. While an increase in wage employment can be seen as a signal of job recovery, Dejardin points out that it was the sector of private households that generated these jobs which are characterized as being among the lowest paid, and least protected. Furthermore, a rise in wage employ-ment needs to be examined in the face of falling real incomes and the size of part-time work as this implies lower earnings and less job security.
On a fi nal note, the 2006 FIES data reveals the following (see Figure 1): entrepreneurial activities and non-agricultural waged and salaried employment are the main sources of household income in the country. The poorest households are dependent on entrepre-neurial activities – low-income subsistence activities, and agricultural wage employment – characterized by low wages for farmers, fi sherfolk and agricultural labor-ers. Furthermore, domestic remittances (from migra-tion from rural to urban) is playing an increasing role for poorer households. Overseas remittances and non-agricultural wage incomes, on the other hand, benefi t families at the higher end of the economic ladder. That overseas remittances benefi t only a small percentage of households (23.8%) i.e. those with higher skills and assets, and underscores how overseas remittances are reinforcing inequalities.
The Overseas Filipino Workers The Philippines continues to rely on overseas em-
ployment as a major anchor of the economy. In 2009 alone, we have deployed 1,422,586 (government report: 1,854,000) land-based and sea-based workers abroad, constituting 4.05% of average national employment for 2009 (see Table 4).
In return, overseas Filipino workers have sent home a total of US$17.3 billion in remittances that kept our macroeconomic current account afl oat, and allowed

Winning the Numbers, Losing the War: The Other MDG Report 2010 35
Source of basic data: 2006 FIES micro-datasetsTable from: Amelita King Dejardin, The Philippine labour market in the aftermath of another crisis. ILO Policy Integration Department, March 2010.
Figure 1. Share of real per capita total HH income according to source, by HH income decile
Table 4. Number of Deployed Overseas Filipino Workers by Type of Hiring: 2008-2009
Source: POEA 2009 Overseas Employment Statistics*Government Placement Branch
Type of Worker and Hiring 2008 2009 % Change
Grand Total - All Workers 1,236,013 1,422,586 15.1%
Land based Workers 974,399 1,092,162 12.1%
New Hire 376,973 349,715 -7.2%
GPB* Hire 4,102 3,192 -22.2%
Private Agency Hire 347,000 326,156 -6.0%
Name Hire 25,263 19,660 -22.2%
Workers with Special Exit Clearance 72 253 251.4%
Employment-based Immigration 536 454 -15.3%
Rehires 597,426 742,227 24.2%
Seabased Workers 261,614 330,424 26.3%
Others
Rental
Entrepreneurial Act
Family Act
Cash domestic
Cash abroad
Non Agric. Wages
Agric. Wages
1st 2nd 3rd 4th 5th 6th 7th 8th 97h 10th
0%
10%
20%
30%
40%
50%
600%
70%
80%
90%
100%
their families to thrive. The data, however, reveals challenges faced by our overseas workers. The increas-ing deployment of workers abroad refl ects the fact that employment opportunities in the Philippines are scarce such that the pull-factor of going abroad remains to be attractive for our population. Through the years,
the total deployment of workers has been increasing: from 2008 to 2009 alone, it increased by 15%. Even those who returned home still sought to get employed outside the country as shown by the sustained increase in rehires (24.3%). Most deployed workers take blue-collar jobs abroad, with the largest number employed
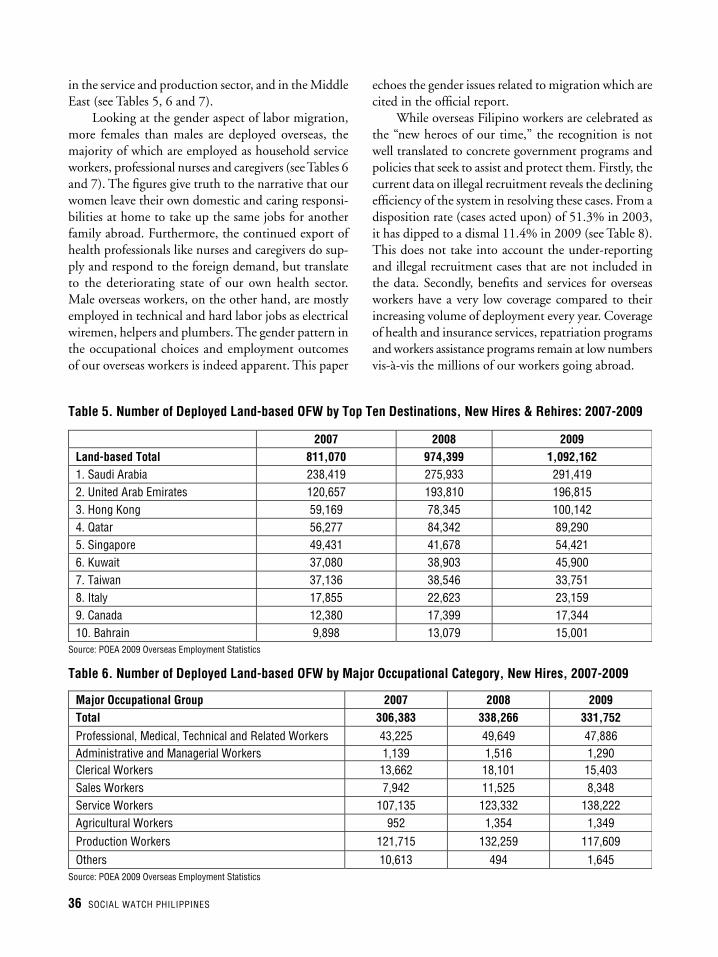
36 SOCIAL WATCH PHILIPPINES
in the service and production sector, and in the Middle East (see Tables 5, 6 and 7).
Looking at the gender aspect of labor migration, more females than males are deployed overseas, the majority of which are employed as household service workers, professional nurses and caregivers (see Tables 6 and 7). The fi gures give truth to the narrative that our women leave their own domestic and caring responsi-bilities at home to take up the same jobs for another family abroad. Furthermore, the continued export of health professionals like nurses and caregivers do sup-ply and respond to the foreign demand, but translate to the deteriorating state of our own health sector. Male overseas workers, on the other hand, are mostly employed in technical and hard labor jobs as electrical wiremen, helpers and plumbers. The gender pattern in the occupational choices and employment outcomes of our overseas workers is indeed apparent. This paper
echoes the gender issues related to migration which are cited in the offi cial report.
While overseas Filipino workers are celebrated as the “new heroes of our time,” the recognition is not well translated to concrete government programs and policies that seek to assist and protect them. Firstly, the current data on illegal recruitment reveals the declining effi ciency of the system in resolving these cases. From a disposition rate (cases acted upon) of 51.3% in 2003, it has dipped to a dismal 11.4% in 2009 (see Table 8). This does not take into account the under-reporting and illegal recruitment cases that are not included in the data. Secondly, benefi ts and services for overseas workers have a very low coverage compared to their increasing volume of deployment every year. Coverage of health and insurance services, repatriation programs and workers assistance programs remain at low numbers vis-à-vis the millions of our workers going abroad.
Source: POEA 2009 Overseas Employment Statistics
Major Occupational Group 2007 2008 2009 Total 306,383 338,266 331,752 Professional, Medical, Technical and Related Workers 43,225 49,649 47,886 Administrative and Managerial Workers 1,139 1,516 1,290 Clerical Workers 13,662 18,101 15,403 Sales Workers 7,942 11,525 8,348 Service Workers 107,135 123,332 138,222 Agricultural Workers 952 1,354 1,349 Production Workers 121,715 132,259 117,609 Others 10,613 494 1,645
Source: POEA 2009 Overseas Employment Statistics
Table 6. Number of Deployed Land-based OFW by Major Occupational Category, New Hires, 2007-2009
2007 2008 2009 Land-based Total 811,070 974,399 1,092,162 1. Saudi Arabia 238,419 275,933 291,419 2. United Arab Emirates 120,657 193,810 196,815 3. Hong Kong 59,169 78,345 100,142 4. Qatar 56,277 84,342 89,290 5. Singapore 49,431 41,678 54,421 6. Kuwait 37,080 38,903 45,900 7. Taiwan 37,136 38,546 33,751 8. Italy 17,855 22,623 23,159 9. Canada 12,380 17,399 17,344 10. Bahrain 9,898 13,079 15,001
Table 5. Number of Deployed Land-based OFW by Top Ten Destinations, New Hires & Rehires: 2007-2009
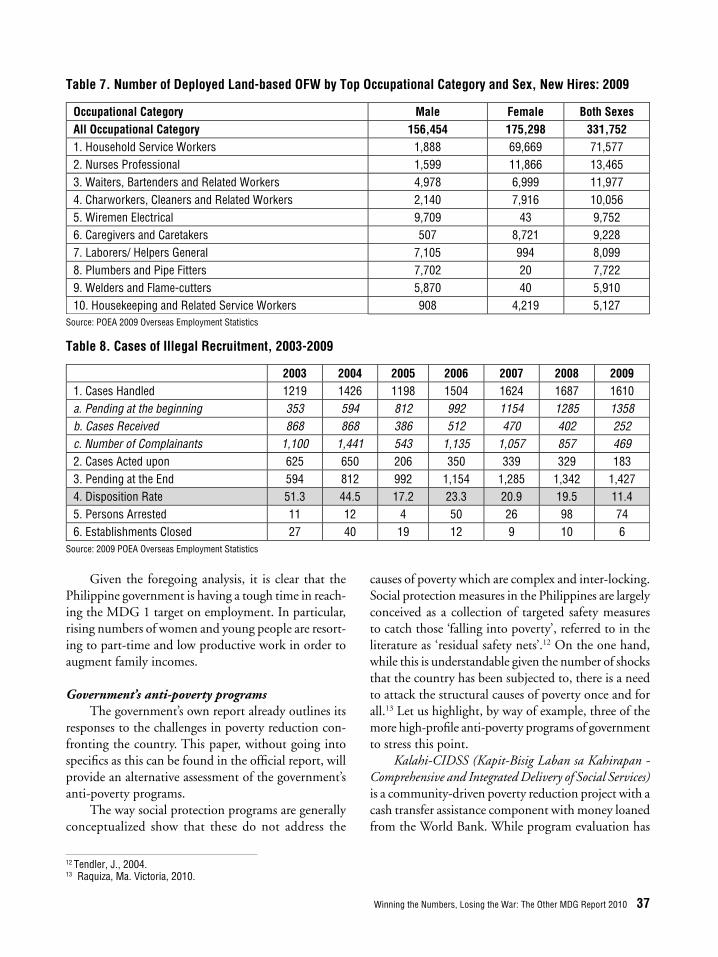
Winning the Numbers, Losing the War: The Other MDG Report 2010 37
Source: POEA 2009 Overseas Employment Statistics
Table 8. Cases of Illegal Recruitment, 2003-2009
Occupational Category Male Female Both Sexes All Occupational Category 156,454 175,298 331,752 1. Household Service Workers 1,888 69,669 71,577 2. Nurses Professional 1,599 11,866 13,465 3. Waiters, Bartenders and Related Workers 4,978 6,999 11,977 4. Charworkers, Cleaners and Related Workers 2,140 7,916 10,056 5. Wiremen Electrical 9,709 43 9,752 6. Caregivers and Caretakers 507 8,721 9,228 7. Laborers/ Helpers General 7,105 994 8,099 8. Plumbers and Pipe Fitters 7,702 20 7,722 9. Welders and Flame-cutters 5,870 40 5,910 10. Housekeeping and Related Service Workers 908 4,219 5,127
Table 7. Number of Deployed Land-based OFW by Top Occupational Category and Sex, New Hires: 2009
2003 2004 2005 2006 2007 2008 2009 1. Cases Handled 1219 1426 1198 1504 1624 1687 1610 a. Pending at the beginning 353 594 812 992 1154 1285 1358 b. Cases Received 868 868 386 512 470 402 252 c. Number of Complainants 1,100 1,441 543 1,135 1,057 857 469 2. Cases Acted upon 625 650 206 350 339 329 183 3. Pending at the End 594 812 992 1,154 1,285 1,342 1,427 4. Disposition Rate 51.3 44.5 17.2 23.3 20.9 19.5 11.4 5. Persons Arrested 11 12 4 50 26 98 74 6. Establishments Closed 27 40 19 12 9 10 6
Source: 2009 POEA Overseas Employment Statistics
Given the foregoing analysis, it is clear that the Philippine government is having a tough time in reach-ing the MDG 1 target on employment. In particular, rising numbers of women and young people are resort-ing to part-time and low productive work in order to augment family incomes.
Government’s anti-poverty programsThe government’s own report already outlines its
responses to the challenges in poverty reduction con-fronting the country. This paper, without going into specifi cs as this can be found in the offi cial report, will provide an alternative assessment of the government’s anti-poverty programs.
The way social protection programs are generally conceptualized show that these do not address the
causes of poverty which are complex and inter-locking. Social protection measures in the Philippines are largely conceived as a collection of targeted safety measures to catch those ‘falling into poverty’, referred to in the literature as ‘residual safety nets’.12 On the one hand, while this is understandable given the number of shocks that the country has been subjected to, there is a need to attack the structural causes of poverty once and for all.13 Let us highlight, by way of example, three of the more high-profi le anti-poverty programs of government to stress this point.
Kalahi-CIDSS (Kapit-Bisig Laban sa Kahirapan - Comprehensive and Integrated Delivery of Social Services) is a community-driven poverty reduction project with a cash transfer assistance component with money loaned from the World Bank. While program evaluation has
12 Tendler, J., 2004. 13 Raquiza, Ma. Victoria, 2010.

38 SOCIAL WATCH PHILIPPINES
been generally positive—increased incomes for baran-gay residents, increased access to social infrastructure and decision-making processes, the development of new skills for local residents, higher levels of collective action, social capital and local empowerment14 —the highly ‘micro-ized and project-ized’ nature of many of the initiatives under this program have shown that its impact is, at best, localized. It seems that it has not made a signifi cant dent in reducing over-all poverty and unemployment in the country. It is noteworthy that the Kalahi-CIDSS was started in 2003, and implemented over a period which coincided with the increase in of-fi cial poverty as recorded in the 2006 FIES.
Self-Employment Assistance–Kaunlaran (SEA-K) is a micro-credit program available to people’s organiza-tions and effectively targets women at the community level. It is reported though that the projects funded by SEA-K are low-value trade and commercial activities which translates to a limited impact on poverty reduc-tion.15 Furthermore, since the program operates at zero interest rate, the revolving fund is eroded because there is a need to pay for administrative, fi nancial and other costs (ibid).
The Pantawid Pamilyang Pilipino Program (4Ps) is a conditional cash transfer, fi ve year program for one million poorest families with the objectives of improv-ing human development (education and health) and breaking inter-generational poverty. A preliminary Social Watch study of the 4Ps,13 using a limited survey of 4Ps benefi ciaries, validates improvements in educa-tion and health outcomes. However, the majority of participants expressed the belief that what would lift them out of poverty was access to regular employ-ment/livelihood, a feature which is not central in the design of the 4Ps.
There are also a number of issues that are raised which could seriously undermine the 4Ps chances of success in meeting its poverty reduction objective. These are: the need to focus on the supply side (e.g., limited health and education infrastructure and person-nel at the local level, including issues around quality), the need to complement the 4Ps with asset reform, and quality job-generation program, as well as an ef-fective exit strategy to ensure that benefi ciaries don’t simply graduate from the program but from poverty. For example, after the fi ve year program run for the
benefi ciaries, how can poor families without access to a regular source of income stay out of poverty? Finally, at 1 million benefi ciaries, the 4Ps outreach is only 25% of the total poor as defi ned by the 2006 FIES. Note that the number of poor families is likely to increase in the 2009 FIES so the 4Ps outreach, relative to the increased size of the poor, will be even more limited.
Beyond social protection programs, the government’s over-all offi cial development strategy must be examined. Why is it that in the last ten years, the pace of poverty reduction has not only decelerated, but has actually been reversed? Some of the reasons for this will be discussed below, and corresponding policy recommendations are raised. Important economic issues that impact on poverty reduction such as debt, trade and aid will be discussed in a separate chapter. Indeed, to foreshadow the chapter on MDG 8, it is argued that the offi cial policy positions on these issues oftentimes have in fact reproduced and deepened poverty in the country.
Conclusions and RecommendationsThe whys and ways forward
This paper affirms the notion that economic growth is an important but insuffi cient condition for poverty reduction. Other important interventions are necessary for poverty reduction to occur. Poverty and inequality in the Philippines have extensively been analyzed and many factors have been cited to explain its persistence in the Philippine landscape. The fol-lowing provides some reasons why and suggests ways to move forward.
Use a multi-dimensional lens to poverty, including a participatory approach. The many dimensions of poverty were enshrined in a United Nations Declaration during the UN World Summit for Social Development in 1995, and included the notion of deprivation, social exclusion and lack of participation. Poverty reduction, together with the promotion of productive employment and social integration, were seen as integral components to social development. Today, the dominant MDG discourse defi nes both international and national devel-opment agendas, and in doing so, has focused basically on the monetary approach to poverty.
This paper argues that while the monetary ap-proach—which uses income or consumption levels
14 Reyes, Celia M., 2010. Philippines Fourth Progress Report on the MDGs. NEDA-UNDP.15 Manasan, Rosario. G., 2009.

Winning the Numbers, Losing the War: The Other MDG Report 2010 39
per household—may be a useful method to measure poverty, it is also riddled with serious methodological and ethical issues (e.g., the inadequate recognition of energy and dietary requirements and the suppression of the non-food items of basic needs), and does not capture important non-income dimensions such as so-cial exclusion, the self-perception of the poor, the asset profi le of households, the inadequate provisioning of basic services, and intra-household inequalities .16
It is now known that how one defi nes poverty matters as it translates into different types of poverty measurements, different groups of people targeted, and different policy solutions forwarded.17 As suggested by the 2010 UN Report ,18 multiple indicators and complementary approaches are needed to capture the various scales and dimensions of poverty, such as mea-sures of the depth of—and vulnerability to—poverty. According to the report, one way of measuring poverty is to address all defi cits within any dimension of well-being whether in a state of money poverty or not.
Furthermore, the actual experience and participa-tion of the poor must be an integral component of any poverty reduction strategy for a number of reasons: one, people living in poverty have a right to infl uence decisions that affect them, and two, their participation enhances the proper identifi cation and implementation of poverty reduction programs and projects.
Economic growth has not been pro-poor, further heightening inequalities. Economic growth has not addressed the inequality in access to assets whether in terms of human development (in the form of educa-tion and health), physical capital (e.g., water, housing, transportation and other infrastructure), fi nancial capital (in the form of stocks, e.g., savings or credit, or infl ows, e.g., wage earnings, pensions, government transfers, remittances) and natural capital (e.g., land, clean and healthy environment); at worst, it has exacerbated it across income decile groups. In more concrete terms, infrastructure development and increased investments in social services as a result of economic growth have not equally benefi ted those living in the different island groups and regions in the Philippines,19 or even between
genders. Going by this view, development programs have favored those in Luzon, and discriminated against those in the Visayas, and Mindanao, not to mention special groups like poor women, indigenous peoples, and the Moro people. Towards this end, the government must fi nd ways to push for broad-based, equitable growth so that the poorest provinces and regions, including the most socially excluded groups, benefi t the most.
One important area for asset reform is agrarian reform. In the Philippines, agrarian reform is regarded as an important ingredient in rural and national de-velopment because the assignment of property rights allows our farmers to realize the full gains from tilling the land and engaging in agriculture and to be free from the bondage of feudal labor. In a World Bank report, the Comprehensive Agrarian Reform Program (CARP), the main asset distribution program of the government, has been found to have had a modest impact on growth and poverty because of two reasons: fi rst, the program’s inability to prioritize the acquisition of private lands through compulsory acquisition has led to the imperfect targeting of the poor; and second, the Agrarian Reform Communities that were sought to support benefi ciaries were also poorly targeted and did not reach the poorest benefi ciaries.20 Furthermore, compulsory land acquisi-tion in areas where CARP can benefi t the most has been confronted by confl icting landlord interests, violence and oppression. In many ways, landlords circumvented the law to avoid the compulsory acquisition such as ineffi cient conversion/industrialization of productive lands or establishment of unproductive structures in idle properties. Table 9 shows a partial list of the biggest private agricultural lands in the country. It is noteworthy that many of these properties are owned by the families of government offi cials, or are owned by prominent personalities’ infl uential in both business and political circles or by multinational corporations.
In terms of the structure of ownership and control of the country’s corporate sector, one study21 suggests that as much as 52.5% of total market capitalization is controlled by the country’s top 10 families.22
To underscore the big picture of inequality, in 2006, at a time when the Philippines fi rst registered a
17 Laderchi, C.R., R. Saith and F. Stewart, 2003. & Caizhen, Lu, 2009. 18 UN Report on the World Situation 2010 entitled ‘Rethinking Poverty’.19 Balisacan, Arsenio M., 2007. 20 World Bank Group (2009). Land Reform, Rural Development and Poverty in the Philippines: Revisiting the Agenda. Ortigas, Pasig City.21 Claessens, et al., 1999.22 Malaluan, 2006.

40 SOCIAL WATCH PHILIPPINES
Table 9: Partial Listing of Big Landowners
Landowner/Hacienda No. of Hectares Location
Danding Cojuangco 30,0000 Negros, Isabela, Cagayan, Davao del Sur, Cotabato, Palawan
Hacienda San Antonio/Sta. Isabel (Danding Conjuangco, Faustino Dy, Juan Ponce Enrile)
12,085 Ilagan, Isabela
Nestle Farms 10,000
(but 160,000 is the target) Isabela, Cagayan, Compostela Valley, Agusan del Sur
Floreindo Family (TADECO) 11,048 Davao del Norte
Almagro Family 10,000 Dalaguete, Cebu
Dimaporo Family 10,000 Lanao
Hacienda de Santos 9,700 Nueva Ecija
Hacienda Banilad/Palico (Roxas Family) 8,500 Batangas
Canlubang Sugar Estate (Yulo Family) 7,100 Laguna
Luisa vda. De Tinio 7,000 Nueva Ecija
Hacienda Luisita (Cojuangco Family) 6,000 + Tarlac
Escudero Family 4,000 Southern Tagalog
Andres Guanzon 2,945 Pampanga
Reyes Family 2, 257 Southern Tagalog
Sanggalang Family 1,600 Southern Tagalog
Uy Family 1,500 Southern Tagalog
Palmares and Co. Inc. 1, 027 Iloilo
Source: Kilusang Magbubukid ng Pilipinas (KMP), 2006
worsening of poverty, the country ‘contributed’ three names to the annual list of billionaires compiled by Forbes magazine: Jaime Zobel de Ayala, who tied with Henry Sy, at 349th place, both with a net worth of US$2.6 billion each, and Lucio Tan, at 407th place, with a net worth of US$2.3 billion.23
As such, this paper re-echoes the recommendation from the Social Watch 2007 Shadow Report; that is, for the government to urgently address the paramount issue of inequality through re-distributive measures such as the implementation of progressive taxation, and genuine agrarian reform. If the government does not address the long-festering problem of inequality, social polarization may become inevitable.
The poor are mostly in the rural areas. Even with rapid urbanization, poverty is still significantly a ru-ral phenomenon in the Philippines. Experiences from other countries suggest that productivity growth in agriculture exerts a strong influence on reducing poverty and food insecurity (ibid). Unfortunately, the Philippines has overlooked much of this strategy and its performance in these areas pales in comparison to its Asian neighbors. This means increased invest-ment in such areas as rural infrastructure and human development, removal of public spending bias for larger farmers and agri-businesses, promotion of small-scale enterprises, and improved access to land and technology.19
23 Raquiza, 2007

Winning the Numbers, Losing the War: The Other MDG Report 2010 41
There is a lack of productive and full-time employment. There is a need to reverse employment trends where the biggest source of employment is in the entrepreneurial and agricultural wage sectors. Instead, the country needs to combine social policy with economic policy with the view of providing productive and full em-ployment to Filipinos. This should take place within a national development strategy that promotes industrial policy and the manufacturing sector since it is here that decent work (in terms of wages and benefi ts) is pro-moted. Unfortunately, this strategy seems to have been muted by offi cial policy discourse, which promotes the unrestrained liberalization of markets and trade which has resulted in the demise of domestic industries.24
This will be discussed at greater length in MDG 8. To reiterate, for as long as the country does not
develop its industrial and manufacturing sector (which includes building a knowledge-based economy), the structure of employment in our country will condemn a signifi cant section of our labor force to low quality jobs that will keep them poor. An additional caveat in this regard—in the era of climate change, policymak-ers face the added challenge of promoting not just any kind of industrial development that will pollute the environment and leave its carbon footprint resulting in irreversible losses in the environment; it must walk the extra mile in promoting clean industries, clean technologies and green jobs if we are to envision sus-tainable development.
There is a need to address social exclusion and dis-criminatory practices. The poorest municipalities and provinces must be among the recipients of largest investments in social spending and basic infrastruc-ture. Furthermore, the historic wrongs committed against the indigenous people and the Moro’s should be rectifi ed. This includes respecting their right to self-determination.
There is a need to address the root causes of an explosive population growth within a reproductive rights frame-work. One aspect that must be addressed is the explosive population growth rate of the Philippines (2.04%). The Philippines is now the 7th most populous nation in Asia, and the 12th most populous in the world. This
phenomenon has put a great strain on the carrying capacity of our environment, and to the government capacities’ and resources to respond to the needs of the people. As importantly, many Filipino families have re-ported that they are exceeding their desired family size, oftentimes, as the result of poverty, lack of information and a sense of powerlessness. In this regard, there is a need to implement a sexual and reproductive rights program to help families plan for their desired family size and within an integrated approach. More on this will be covered in the discussion on MDG 5.
Social protection programs should be re-oriented to-wards a more transformative and strategic orientation. Government can explore building the foundation of a more universal approach. As mentioned earlier, social protection measures in the Philippines are largely con-ceived of as a collection of targeted safety nets or are comprised of as a set of ‘project-ized, micro-ized’ eco-nomic activities that have resulted in either providing temporary relief for a limited number of benefi ciaries,25
or at best, poverty reduction at a micro/local level. This paper argues that the government must focus
on addressing the structural causes of poverty (e.g., lack of productive livelihoods/employment, asset reform, increased social spending) and go beyond a social safety net approach in its anti-poverty and social protection programs. Furthermore, ‘project-ized, micro-ized’ economic activities, in order to make a signifi cant dent on over-all poverty reduction, need to be scaled-up, professionalized with regards to operations, be more competitive and linked to an over-all national develop-ment strategy.
The Philippine government is also urged to explore a broader defi nition of social protection which includes addressing ‘vulnerability associated with being poor’ (for which social assistance is needed), vulnerability with the risk of becoming poor (for which social insur-ance is needed) as well as social injustice arising from structural inequalities and abuse of power (for which social equity is needed).26 In this context, the provi-sion of socio-economic security should be viewed as a rights-based entitlement of the citizens. Furthermore, poverty eradication measures must take into account the differential impact of poverty on men and women
24 For example, shoe manufacturing, tires, textile, oil refi ning, pulp and paper, plastic, chemical, steel, auto parts. (Rene Ofreneo in the Forum Roundtable on the Employment Situation in the Country Today, UP Forum, Vol 11 Issue 2, March-April 2010).25 Ma. Victoria Raquiza, (unpublished), April 201026 Devereux, Sabates-Wheeler 2004

42 SOCIAL WATCH PHILIPPINES
and promote gender equality in all areas. Apart from the usual problems associated with
targeting the ‘poorest of the poor’ such as inclusion and exclusion errors, as well as the ‘stigmatizing’ effect of targeting, many anti-poverty programs do not address the needs of other poor and vulnerable groups: the ‘new poor’ as a result of economic and/or political shocks, and the millions just above the poverty line. In other words there is an added need to provide for a system for those who are not protected by current anti-poverty and social security programs.
Finally, the literature shows that generating politi-cal support from the middle classes and the rich for social protection programs is much more secure if they too have access to these programs. On these grounds, this paper urges the Philippine government to explore building the foundation of a universal program that views social protection as rights-based entitlement for all, in order to wipe out the most destitute forms of poverty in the country and ensure a life of dignity for all citizens.
No doubt the challenge of fi scal constraints re-mains but the starting point in governance should be the rights of citizens to basic entitlements to ensure their well-being, and the responsibility of the State in the fulfi llment of these needs.
References
Balisacan, A. M., 2007. Why Does Poverty Persist in the Philippines? Facts, Fancies and Policies, SEARCA Agriculture & Development Discussion Series, No. 2007-1, paper presented at the ‘Whither the Philippines in the 21st Century? Conference on the Philippines’, organized by the Institute of Southeast Asian Studies, Singapore, 13-14 July 2006.
Bureau of Labor and Employment Statistics, 1997. Labor Market Profi le in the Philippines. LabStat Updates,Vol.1, No.1, Department of Labor and Employment, Manila.
Bureau of Labor and Employment Statistics, 2010. Employment and Economic Milestones. LabStat Updates, Vol. 14 No.35, Department of Labor and Employment, Manila.
Caizhen, L., 2009. Who is Poor in China? Comparison of Alternative Approaches to Poverty Assessment in Rural China. PhD thesis, Institute of Social Studies, The Hague, Netherlands.
Chacchi, A., 2010. Engendering Social Protection Initiatives. PowerPoint presentation presented during the Southeast Asian Conference on Social Protection and Universalizing Socio-Economic Security held April 6-7, 2010 in Quezon City Philippines.
Claessens, et al., 1999.
Devereux S. and R. Sabates-Wheeler, 2004. Transformative Social Protection. IDS Working Paper No. 232, October (http://www.ids.ac.uk/ids/bookshop/wp/wp232.pdf).
Dejardin, A. K., 2010. The Philippine Labor Market in the Aftermath of Another Crisis. Paper submitted for the Policy Coherence Forum ‘Overcoming the Jobs Crisis and Shaping an Inclusive Recovery: The Philippines in the Aftermath of the Global Economic Turmoil’ 11-12 March, 210, Makati City, Philippines.
Economic and Social Affairs, 2010. Re-thinking Poverty: Report on the World Social Situation 2010. United Nations, New York
Laderchi, C.R., R. Saith and F. Stewart, 2003. Does it Matter that We Do Not Agree on the Defi nitions of Poverty? A Comparison of Four Approaches. Oxford Development Studies.
Malaluan, N. A., 2006. Dire State of the Nation: The Crisis of Income and Employment in the Philippines, Development Roundtable Series Towards Mutual Understanding and Common Action Papers. Focus on the Global South, Quezon City.
Manasan, R. G., 2009. Reforming Social Protection Policy: Responding to the Global Financial Crisis and Beyond. Discussion Paper Series No. 2009-22, Philippine Institute of Development Studies, Makati.
Mangahas, M. 2008. SWS Monitoring of Self-Rated Deprivation. Paper submitted for the PIDS-NEDA-UNDP Project Comprehensive Documentation and Analysis of Issues on the Offi cial Poverty Estimation Methodology in the Philippines.
Mkandawire T., 2006. Targeting and Universalism in Poverty Reduction. Social protection the role of cash transfers. Poverty in Focus, International Poverty Center. UNDP.
Reyes, C. M., 2010. Philippines Fourth Progress Report on the MDGs. NEDA-UNDP
Raquiza, Ma. V., 2008. Democratizing Poverty Discourse: The Case of the SWS Self-Rated Surveys on Poverty and Hunger. Master’s thesis (unpublished), Institute of Social Studies, The Hague, Netherlands.
Raquiza, Ma. V., 2010. Social Protection in the Philippines: In Search of a Strategic and Transformative Perspective. Unpublished, Social Watch Philippines.
Saith, A., 2005. Poverty Lines Versus the Poor: Method Versus Meaning. ISS Working Paper Series No. 420. Institute of Social Studies, The Hague, Netherlands
Saith, A., 2007. Downsizing and Distortion of Poverty in India: The Perverse Power of Offi cial Defi nitions. Indian Journal of Human Development 1(2): 247-281.
Tendler, J., 2004. Why Social Policy is Condemned to a Residual Category of Safety Nets and What to Do About it?. in Thandika Mkandawire (ed.) Social Policy in a Development Context. Houndsmill and Geneva: Palgrave and UNRISD, ch. 6, pp. 119-142.
United Nations, 2010. Report on the World Situation entitled ‘Rethinking Poverty’.
World Bank, 2009. Philippine Quarterly Update.World Bank, 2009. Land Reform, Rural Development, and Poverty
in the Philippines: Revisiting the Agenda. World Bank Manila. Ortigas, Pasig City.

Winning the Numbers, Losing the War: The Other MDG Report 2010 43
Crossroads:
Marginalization versus achieving universal primary education by 2015
Summary
I n the ten years of the MDGs, the government has failed to arrest, much less
reverse, the continuing decline of Philippine education. It is failing in both
quantitative and qualitative indicators and the probability of achieving the
minimum targets are below expectations. Such failure means another generation of
poorly educated Filipinos. The Philippine government has been spending much less
on education compared to its Asian neighbors. It now ranks amongst the lowest spenders in the world.
By RENE RAYA, CECILIA SORIANO, REGINALDO GUILLEN and LUZ ANIGAN
“The State shall protect and promote the right of all citizens to quality education at all levels, and shall take appropriate steps to make such education accessible to all.”
— 1987 Constitution of the Republic of the Philippines
“Ensure that, by 2015, children everywhere, boys and girls alike, will be able to complete a full course of primary schooling”— Millennium Development Goal 2

44 SOCIAL WATCH PHILIPPINES
While many see this as an education in crisis, the offi cial report1 could only admit to poor performance. The report’s assessment is so restrained it fails to convey the magnitude and depth of the problem. Today, we face a critical junc-ture – a crossroads – that will determine if the country can get back on its feet or become the worst case education scenario in the Asian region. This alternative report will discuss key points that are missing in the offi cial report. It will argue that the problem is far more serious than what the government is prepared to admit and conclude by suggesting urgent measures deemed necessary to address the education crisis.
Highlights of the Official Report on MDG 2The Philippines Fourth Progress Report on the
Millennium Development Goals (MDGs) states that the MDG “target of universal access to elementary edu-cation by 2015 is in great risk of not being achieved.” This is based on the current rate of progress, indicat-ing that the key education targets will most likely be missed in 2015. The report estimated a “low” prob-ability of achieving the targets on elementary net and gross enrolment rates. While improving in recent years, elementary cohort survival and completion rates have only “medium” probability of meeting the targets (see Table 1).
1 “Philippines Fourth Progress Report on the Millennium Development Goals (MDGs).” Third Draft, July 2010 (n.p.).2 The number of children of offi cial primary school age who are enrolled in primary education as a percentage of the total children of the
offi cial school age population.3 This is defi ned as the number of pupils (of any age) who are enrolled in primary education as a percentage of the total children of offi cial
school age population. GER can be over 100% due to the inclusion of over-aged and under-aged pupils/students because of early or late entrants, and grade repetition.
4 Percentage of Grade 1 pupils who reach Grade 6.5 Grade 1 pupils who were able to complete the elementary cycle.
The net enrolment rate (NER2) in elementary education declined sharply from 96.8 percent in SY 2000-2001 to 90.1 percent in SY 2001-2002. The sharp decline is partly explained by the change in the offi cial school age from 7-12 years old to 6-11 years old as many parents still opted to send their children to school at age 7 or older. Enrolment rate continued its downward trend until SY 2006-2007 before mov-ing up marginally to 85.1 percent in SY 2008-2009. The gross enrolment rate (GER3) generally followed the same downward trend – declining from a high of 119.2 percent in SY 1999-2000 to 102.1 percent in SY 2008-2009 (see Figure 1).
Table 1. Goal 2: Achieve universal primary education
Target 2.A: Ensure that, by 2015, children everywhere, boys and girls alike, will be able to complete a full course of primary schooling
Elementary education net enrolment rate
0.00 LOW
Elementary education cohort survival rate
0.63 MEDIUM
Elementary education completion rate
0.54 MEDIUM
From 1991 to 2008, learning effi ciency as mea-sured by the cohort survival rate (CSR4), showed erratic fl uctuation, indicating the poor holding capacity of the school system. However, from its lowest level of 63.5 percent in SY 1999-2000, the CSR gradually improved, reaching its highest level at 75.4 percent in SY 2008-2009. During the same period, the completion rate5 likewise improved, reaching its highest level at 73.3 percent in SY 2008-2009 (see Figure 2). These im-provements need to become consistent and signifi cant in terms of the holding power of schools if the MDG target is to be met, as the drop-out rate remains alarm-ingly high at an average of 6.0% in SY 2008-2009.
Figure 1. Elementary education NER and GER (%), SY 1991-1992 to SY 2008-2009 (public and private)
Source of basic data: Department of EducationNote: The years 1991 to 2008 in the horizontal axis represent start of school year (i.e., 1991 corresponds to school year 1991-1992)

Winning the Numbers, Losing the War: The Other MDG Report 2010 45
Figure 2. Elementary education CSR and CompR (%), SY 1991-1992 to SY 2008-2009 (public and private)
Source of basic data: Department of EducationNote: The years 1991 to 2008 in the horizontal axis represent start of school year (i.e., 1991 corresponds to school year 1991-1992)
The report noted wide disparities in the key education indicators across regions, between rural and urban areas, and by gender, with girls out-performing the boys in terms of enrolment, survival and comple-tion in elementary education from 2000 to 2008. It identifi ed the key bottlenecks in the education sector, specifi cally the continuing shortages in classrooms and teachers in many areas across the country as a result of poor targeting of resources. The report argued that poverty, poor health, peace and order problems in some areas, and the prevalence of child labor are factors that keep children from attending school. It noted the high incidence of drop-out rates particularly among children in the fi rst three years of elementary education. This was attributed mainly to the weak pedagogical skills of teachers which aggravate the inability of children to cope with school work.
While the report admitted the poor performance and failings of the education sector, the analysis and arguments presented appear to be restrained. It fails to capture the magnitude and depth of the problem confronting the education system. There has been a continuing and historic decline of education in the Philippines in the past ten years ever since the Millen-nium Summit of 2000. Today, we face a critical juncture – a crossroads that will determine if the country can get back on its feet or become the worst case educa-tion scenario in the Asian region. Urgent measures are needed to reverse the education crisis.
This alternative report will discuss key points that are missing in the offi cial report. It will argue that the problem is far more serious than what the government is prepared to admit; that stagnation and reversals in education are leaving the marginalized further behind,
thus, exacerbating inequality even more; that the country has long been under investing in education; and that poor governance has failed to transform the education sector.
Premises v. promisesIn setting the premises on which this report shall
base its analysis, it is best to look into several areas of concern where education is the central goal. First, it is explicitly enshrined in the Constitution of the Republic of the Philippines, that education is a basic right of every Filipino citizen.
Second, the Philippines is signatory to a succes-sion of international agreements – from the 1948 Universal Declaration of Human Rights, through to the 1989 Convention on the Rights of the Child, and to the more recent 2000 Dakar Framework for Action and the 2000 Millennium Declaration – all of which recognize education not only as a development goal but a fundamental human right.
Third, as a signatory to the Education for All (EFA) Goals set forth in the 2000 Dakar Framework of Action, the country commits itself to the fulfi llment of six education goals:
• Expanded early childhood care and educa-tion
• Universal completion of basic education• Learning and life skills for young people and
adults• Increase in adult literacy by 50 percent• Gender parity by 2005 and gender equality by
2015• Improved quality of educationTwo of these goals - universal primary education
and gender parity in education – have been adopted as part of the MDG 2.
Rising enrolment, falling performanceEnrolment in both public and private schools
has increased annually with 2008–2009 registering an increase of 1.75 percent reaching an actual number of 21.62 million students. On June 15, 2010, both public and private schools formally opened with an unprecedented increase in the number of enrollees. There were a total of 23.04 million students, 87 percent of whom enrolled in public schools (or an equivalent of 19.97 million pupils) while 13 percent are in private schools (or an equivalent of 3.07 million pupils (see Table 2), Continuous increases in enrollment are also

46 SOCIAL WATCH PHILIPPINES
seen in both public and private pre-schools, with pupils enrolled in private pre-schools comprising more than half of the total number of those enrolled in public pre-schools.
The annual increase in the enrollees in public school is not surprising since there had been an upward trend in enrolment rate over the past fi ve years estimated at around 2 percent on annual basis. This is also in line with the Philippine population growth rate of 2.04 percent in the 2007 census. The government admitted that while enrolment fi gures have been increasing over the years, the key performance indicators, especially the participation rate and the dropout rate, have been deteriorating consistently since 2001, falling way short of the EFA targets for the corresponding years.
The Department of Education reported that more learners drop out from the system particularly in the lower grade levels even before functional literacy is ac-quired. It also noted the low participation of children in early childhood education (ECE) with only 34% of the 3-5 year age group attending preschool and only 60 percent of entrants in the fi rst grade having an ECE background. Dropout at the elementary level remained alarmingly high at 6.0% to 7.4% during the school years 2004-05 to 2008-09 (see Table 3).
About a quarter of the students who enter Grade 1 drop out before reaching Grade 6. Every year, at least half a million students drop out from elementary and secondary school, with a signifi cant percentage per-
Table 2. Enrollment Statistics, SY 2010-2011
Source: DepEd Statistics 2010
Pre-School Elementary Secondary
PUBLIC 0.88 Million 13.44 Million 5.65 Million
PRIVATE 0.45 Million 1.17 Million 1.45 Million
TOTAL 1.33 Million 14.61 Million 7.10 Million
Source: DepEd Factsheet as of September 2009
Drop Out Rate 2004-2005 2005-2006 2006-2007 2007-2008 2008-2009
Elementary 6.98% 7.33% 6.37% 5.99% 6.02%
Table 3. Dropout Rate (School Leavers Rate) SY 2004-05 to SY 2008-09
manently staying out of school. For 2007, UNESCO6 estimated that 1.003 million Filipino children, 6 to 11 years old, were not attending school. This is similar to the estimate of the Action for Economic Reforms which placed the number of out-of-school children 6-15 years old at 2.2 million, 1.2 million of whom were between 6 to 11 years old. Apart from the 2.2 million school leavers, another 2.8 million youth (16 to 21 years old) were not attending school and had not completed their basic education.7 UNESCO’s Global Monitor-ing Report (2010) noted that the Philippines, along with Myanmar, Vietnam, Thailand and Indonesia, are countries facing the greatest challenge in the number of out-of-school children.
An earlier survey conducted in 2003,8 noted that poor children are nearly three times more likely to drop out of school, compared with non-poor children. The same survey further reported a high incidence of out-of-school children and youth in the depressed regions of Mindanao and the Visayas.
The main reason9 children drop out of school has been cited as poverty and the need to work to help with the family’s livelihood. Other reasons poor children are excluded from the school system are because of poor health, malnutrition and disability. A signifi cant number are forced to quit because of the high cost of school-related expenses. Others could not cope with the school work or lost interest in schooling.
Widening disparities Marginalization is strongly associated with poverty
and geographical location. Education performance in terms of access, survival and completion varies greatly across regions and economic status. Children in poor, remote, or confl ict-affected regions of the country showed much lower levels of education performance compared to the richer and urbanized regions. The Autonomous Region in Muslim Mindanao (ARMM)
6 UNESCO’s Global Monitoring Report 2010.7 Raya, 2010.8 the 2003 Functional Literacy, Education and Mass Media Survey (FLEMMS).9 All reasons cited are based on offi cial surveys and assessments of education trends in the Philippines.

Winning the Numbers, Losing the War: The Other MDG Report 2010 47
and other poorer regions in Mindanao are consistently falling behind the rest of the country in nearly all key education indicators.
The 2008 National Health and Demographic Survey showed that the median schooling duration of Filipinos aged 6 years and over is 6.4 years for males and 7.4 years for females. The corresponding fi gures for rural areas indicate much lower years of schooling compared to those in urban areas (see Table 4). In the more developed regions of the National Capital Region (NCR) and CALABARZON, median schooling dura-tion ranged from 8 to 9 years. In comparison, residents of the Autonomous Region in Muslim Mindanao (ARMM) have only 3.5 years of schooling. Compared with the richest quintile, with 9.9 years of schooling, those belonging to the poorest quintile have an average of only 3.7 years for males and 4.2 years for females. These fi ndings are consistent with earlier health and demographic surveys conducted in 1998 and 2003. This means that over the past 10 years, the disparity in education access and attainment has persisted.
The National Statistics Coordination Board (NSCB) came out with a separate set of indicators called the Child Development Index (CDI). The CDI is a composite in-dex which measures the overall state of child development in terms of education, health and quantity of life (i.e. income) as measured through the Child Health Index (CHI), Child Education Index (CEI), and Quantity of Life Index (QOLI), respectively.10
According to the Child Education Index, the Regions with the lowest CEI and ranking are regions 10, 11, and 12; all of them in Mindanao (see Table 5). Over the last six years, there has been a notable
10 NSCB – Child Development Index. www.nscb.gov.ph
Table 4. Median Years of SchoolingHousehold Population 6 Years Old and Above, 2008
Location Male Female Wealth Quintile Male Female
Urban 8.7 9.1 Lowest 3.7 4.2
Rural 5.4 5.7 Second 5.4 5.7
Selected Regions Middle 6.9 7.3
NCR 9.2 9.3 Fourth 9.1 8.2
CALABARZON 8.4 9.0 Highest 9.9 9.9
CARAGA 5.5 6.1
ARMM 3.2 3.8 Total 6.4 7.4 Source: National Demographic and Health Survey 2008 (National Statistics Offi ce and ORC Macro 2009).
Table 5. Education Index per Region
Region Education Index (EI)
Index Rank 2000 2003 2006 2000 2003 2006
Philippines 0.790 0.739 0.607 NCR 0.921 0.860 0.644 REGION IV-A 0.832 0.817 0.654 3 1 1
Region I 0.857 0.784 0.646 1 3 2 Region III 0.806 0.807 0.643 4 2 3 Region IV –B 0.792 0.735 0.641 6 5 4
Region V 0.799 0.721 0.635 5 7 5
Region II 0.769 0.726 0.601 8 6 6
Region VIII 0.737 0.664 0.595 9 14 7 Region VI 0.840 0.703 0.584 2 9 8 Region IX 0.713 0.670 0.583 13 13 9 CARAGA 0.695 0.639 0.582 14 15 10 ARMM 0.559 0.569 0.567 16 16 11 Region VII 0.773 0.14 0.566 7 8 12 CAR 0.521 0.744 0.561 11.5 4 13 Region XII 0.691 0.673 0.559 15 12 14.5 Region X 0.721 0.702 0.559 11.5 10 14.5 REGION XI 0.729 0.683 0.545 10 11 16
Source: NSCB – Child Development Index www.nscb.gov.ph
decrease in the number of regions with a high Child Education Index. The fi ndings affi rm what has been already been stated that across regions, the disparity in terms of education inequality is high especially for the poorest regions.
The marginalized and disadvantaged groups are unable to catch up as they continue to be ignored and neglected. Good practices and programs that have been successfully piloted and highlighted in the offi cial report, have also been marginalized by under-funding

48 SOCIAL WATCH PHILIPPINES
and therefore, limited coverage. The funding for the Alternative Learning System that is supposed to cater to the out-of-school youth and marginalized groups has remained grossly inadequate to make an impact. Programs and funding, including the school feeding program and the conditional cash transfer, are focused mainly on the formal school system. Those outside the formal school system or at risk of being excluded from the system have to live with peripheral programs that are more cosmetic than real. Only a simple account-ing of funds and actual extension of programs for the marginalized groups can tell the story of continuing neglect and deprivation (see Box 2, Financing Gap section).
Box 1. Education in emergency situation
Emergency situations as a result of armed con-fl ict causing the displacement of families, affects most especially the children as school and community life is disrupted. In Central and Muslim Mindanao, hundreds of thousands of families, coming mostly from Muslim and IP (Indigenous Peoples) communities, have been displaced by the ongoing confl ict between government forces and rebel groups. The prevailing emergency situation, compounded by widespread poverty and long standing neglect, are major constraints to the achievement of the Education for All goals.
Since 2007, the Civil Society Network for Education Reforms (E-Net Philippines), in partnership with Oxfam Great Britain (OGB), Balay Rehabilitation Center, Inc. (BALAY) and Community of Learners Foundation (COLF), supported education and peace-building initiatives in the confl ict-affected municipalities of Columbio in Sultan Kudarat, Datu Paglas and Paglat in Maguindanao and Tulunan in North Cotabato. These areas are located in the poorest and lowest performing provinces of the Philippines. About half of the population are Muslims and almost a quarter are IPs.
A survey conducted in 2008 covering the four municipalities re-vealed serious education gaps that refl ect the continuing deprivation and marginalization of communities in large parts of Mindanao. Partici-pation rate at the elementary level was 75.7% while the corresponding fi gure for high school was 24.1%. A large majority of the 12 to 15 year old children were still in elementary schools when they should have
been in high school. This accounts for the low participation rate at the secondary level.
Among the residents the following average educational attainment levels were recorded: 17.3% had no formal educa-tion; 49.1% reached only elementary level education; 24.5% attended high school; and only 9% reached post-secondary vocational or college education. In rural areas, the percentage of residents with no formal education increased to 24.4%, almost double the percentage of those who lived in or near the town centers. The level of education is signifi cantly lower compared to the national average11 which showed that only 9% had no formal education while 19.1% have reached post secondary education, with 8% earning a college degree or higher.
Similarly, the average basic literacy rate among 10 years old and over is only 82.2% which again is much lower com-pared to the national literacy rate of 93.4%. The situation is even more serious for those in remote areas where the literacy rate was estimated at 74.0%. Among the areas covered by the survey, the municipality of Paglat had the lowest literacy
rate of 67.7%.Different from what has been
a consistent national trend, females in the surveyed municipalities had a lower educational attainment than males. The disparity in education performance is further refl ected in the lower literacy rate of females at 80.6% compared to males at 83.8%.
Various factors have caused disruptions of classes and affected school attendance. Among the most frequently cited factors were work or employment opportunities, armed confl ict and natural disasters such as typhoons, floods, drought and earthquake. The survey revealed that 39.1% of the households have relo-
The global comparison: The Philippines is left behind
Based on the UNESCO’s EFA Development In-dex (EDI) which measures overall EFA achievement, the Philippines ranked 85th out of 128 countries in 2007, falling behind most Asian countries such as China, Malaysia and Indonesia. What is worse is that the EDI score of the Philippines has been decreasing since 2003 when it ranked at 75th out of 125 countries (see Table 6).
This confi rms the observation that the Philip-pines has been under-performing in education, with key indicators way below what might be expected of a middle-income country. As an example, the average
11 FLEMMS 2003

Winning the Numbers, Losing the War: The Other MDG Report 2010 49
cated or transferred residency, either temporarily or permanently. Some of those who have relocated indicated that they have done so several times, some as many as ten times. Most respon-dents cited the recurring armed confl ict as the main reason for relocation.
Families moved to safer grounds but far from where the children were enrolled. Classes were suspended, sometimes indefi nitely, to safeguard the security of teachers and students while some schools were used as evac-uation centers. The poor conditions in evacuation centers make it virtu-ally impossible to conduct emergency classes. Children and teachers were afraid to return to school and several experienced psychoso-cial trauma that affected the normal learning processes. Many affected schools could not resume operations, even long after the confl ict ended, because rehabilitation work of destroyed school buildings and facilities was not prioritized.
Those who dropped out were asked about plans to return to school. Almost half (49.5%) said they defi nitely had no plans of going back to school while about a fi fth were undecided (21.3%). Only 29% mentioned that they planned to resume schooling. While about half of the surveyed popula-tion were Muslims, only 8.7% attended Madrasah, mostly for Arabic literacy. Very few (4%) participated in training activities, mostly related to livelihood development.
This situation calls for urgent action to reach out to disadvantaged children whose education and lives have been seriously affected by the recurring armed confl ict. As an im-mediate step, the Philippine Government and the Department of Education (DepEd) should enforce the Minimum Standards in Education in Emergencies (MSEE) and ensure the integra-tion of its relevant provisions in national and local policies.
The mapping of ongoing and high-risk emergency/con-
fl ict areas must be conducted whilst closely monitoring the rehabilitation efforts in post confl ict areas for an appropriate and calibrated response to address the educational needs of children and adults. Along this line, the tracking of displaced children should become a part of the disaster management plan. An inter-agency coordinating group for education should also be made functional in all confl ict-affected areas to ensure continuing education even in emer-gency and crisis situations.
Appropriate interventions must be institutionalized, including psy-chosocial debriefi ng for displaced
and other affected children (i.e. children of communities hosting internally displaced persons (IDPs) whose schools have been converted to evacuation centers in times of emergencies). The capacity of teachers to provide psy-chosocial intervention must be harnessed and developed. Emergency situations will require more mobile teachers and expanded coverage of the Alternative Learning Sys-tem to reach out to displaced and out-of-school children. Education must be given high priority in peace-building initiatives and advocacy, recognizing that education, literacy and cultural sensitivity are factors that contribute to social cohesion and peace.
Within the next 5 years, education disparities and deprivation must be seriously addressed throughout Mindanao as a priority agenda for lasting peace and the attainment of the MDGs by 2015.
Source: Education Watch In Armed-Confl ict Areas: Tracking children, youth and adults missing an educa-tion. Civil Society Network for Education Reforms (E-Net Philippines) and Partners in Education for Community Empowerment (PIECE), 2010.
Table 6. EFA Development Index Value and Rank, Philippines (2003-2007)
Philippines 2003 2004 2005 2006 2007
EDI Value 0.898 0.897 0.893 0.888 0.895
Ranking 75th 82nd 86th 85th
Number of Countries 125 129 129 128
Source: UNESCO EFA Global Monitoring Report (2006, 2007, 2008, 2009, 2010
income in the Philippines is four times that of the United Republic of Tanzania or Zambia, but it has a lower net enrolment ratio that has stagnated over time. In comparison, net enrolment ratios in the two African
countries have been steadily increasing.12 The sad reality is that the Philippines is being left behind, while most other countries in the world are making signifi cant strides towards universal primary education.
Financing gapThe low spending on education plays a large part
in the poor and declining performance of the Philippine education. Preliminary data indicates that the expendi-ture level remained at 2.1 percent of GDP in 2010.
The Philippines has been under-spending on education, with the expenditure share declining in relation to the gross domestic product (GDP) and to total public expenditure. International benchmarks
11 UNESCO. 2009.
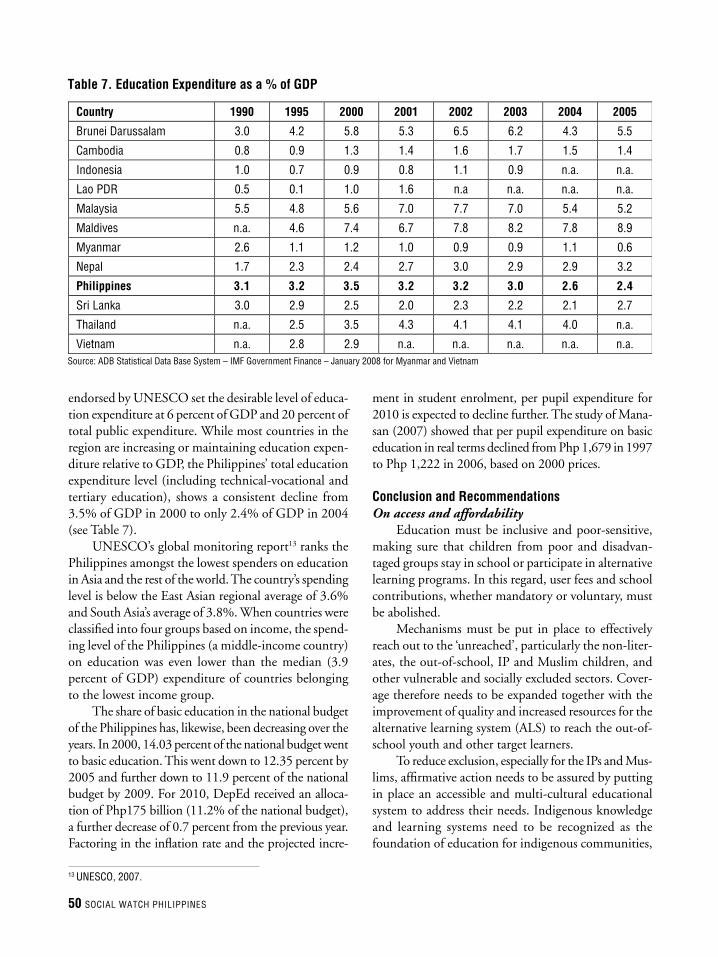
50 SOCIAL WATCH PHILIPPINES
13 UNESCO, 2007.
endorsed by UNESCO set the desirable level of educa-tion expenditure at 6 percent of GDP and 20 percent of total public expenditure. While most countries in the region are increasing or maintaining education expen-diture relative to GDP, the Philippines’ total education expenditure level (including technical-vocational and tertiary education), shows a consistent decline from 3.5% of GDP in 2000 to only 2.4% of GDP in 2004 (see Table 7).
UNESCO’s global monitoring report13 ranks the Philippines amongst the lowest spenders on education in Asia and the rest of the world. The country’s spending level is below the East Asian regional average of 3.6% and South Asia’s average of 3.8%. When countries were classifi ed into four groups based on income, the spend-ing level of the Philippines (a middle-income country) on education was even lower than the median (3.9 percent of GDP) expenditure of countries belonging to the lowest income group.
The share of basic education in the national budget of the Philippines has, likewise, been decreasing over the years. In 2000, 14.03 percent of the national budget went to basic education. This went down to 12.35 percent by 2005 and further down to 11.9 percent of the national budget by 2009. For 2010, DepEd received an alloca-tion of Php175 billion (11.2% of the national budget), a further decrease of 0.7 percent from the previous year. Factoring in the infl ation rate and the projected incre-
Table 7. Education Expenditure as a % of GDP
Country 1990 1995 2000 2001 2002 2003 2004 2005
Brunei Darussalam 3.0 4.2 5.8 5.3 6.5 6.2 4.3 5.5
Cambodia 0.8 0.9 1.3 1.4 1.6 1.7 1.5 1.4
Indonesia 1.0 0.7 0.9 0.8 1.1 0.9 n.a. n.a.
Lao PDR 0.5 0.1 1.0 1.6 n.a n.a. n.a. n.a.
Malaysia 5.5 4.8 5.6 7.0 7.7 7.0 5.4 5.2
Maldives n.a. 4.6 7.4 6.7 7.8 8.2 7.8 8.9
Myanmar 2.6 1.1 1.2 1.0 0.9 0.9 1.1 0.6
Nepal 1.7 2.3 2.4 2.7 3.0 2.9 2.9 3.2
Philippines 3.1 3.2 3.5 3.2 3.2 3.0 2.6 2.4
Sri Lanka 3.0 2.9 2.5 2.0 2.3 2.2 2.1 2.7
Thailand n.a. 2.5 3.5 4.3 4.1 4.1 4.0 n.a.
Vietnam n.a. 2.8 2.9 n.a. n.a. n.a. n.a. n.a. Source: ADB Statistical Data Base System – IMF Government Finance – January 2008 for Myanmar and Vietnam
ment in student enrolment, per pupil expenditure for 2010 is expected to decline further. The study of Mana-san (2007) showed that per pupil expenditure on basic education in real terms declined from Php 1,679 in 1997 to Php 1,222 in 2006, based on 2000 prices.
Conclusion and RecommendationsOn access and affordability
Education must be inclusive and poor-sensitive, making sure that children from poor and disadvan-taged groups stay in school or participate in alternative learning programs. In this regard, user fees and school contributions, whether mandatory or voluntary, must be abolished.
Mechanisms must be put in place to effectively reach out to the ‘unreached’, particularly the non-liter-ates, the out-of-school, IP and Muslim children, and other vulnerable and socially excluded sectors. Cover-age therefore needs to be expanded together with the improvement of quality and increased resources for the alternative learning system (ALS) to reach the out-of-school youth and other target learners.
To reduce exclusion, especially for the IPs and Mus-lims, affi rmative action needs to be assured by putting in place an accessible and multi-cultural educational system to address their needs. Indigenous knowledge and learning systems need to be recognized as the foundation of education for indigenous communities,

Winning the Numbers, Losing the War: The Other MDG Report 2010 51
ensuring appropriate and relevant curriculum, learning modules, materials and approaches that are appropriate and relevant. The Mother Language education policy needs to be implemented through provisions for lo-cal research, training and development of indigenous learning materials.
The minimum standards in education in emer-gencies, needs to be institutionalized to make schools as zones of peace with adequate provisions for safety, emergency assistance and psychosocial support for at risk children.
Relevant education programs need to be developed to ensure that working children return to school, and also for the support of the eradication of child labor.
On quality teachers for quality educationThe quality of public education should be im-
proved through the continued professional develop-ment of teachers, to keep up to date with content and improved teaching pedagogy. There also needs to be a fair and sound system of promotion and career development, with better salaries and ben-efits that provide comprehensive welfare assistance, including full health coverage, housing support and provision for scholarships. Further recommenda-tions include:
• Ensure reasonable work hours and teaching load of teachers in order to improve teaching quality in the classroom.
• Enhance the participation of teachers in the governance of public education and the im-provement of education.
• Improve the school conditions that will sup-port quality teaching such as smaller classroom size, provision of learning materials, classrooms and laboratories.
• Decisively address the perennial shortages in key education input:
1:35/40 teacher and classroom to pupil ratio 1:1 ratio for textbook and desk Adequate sanitation and water facilities Adequate library, science and computer
laboratories On gender-sensitive education
Schools should be a gender-sensitive environment. There needs to be:
• Adequate facilities for females
• Provisions of gender-sensitive textbooks and teaching materials.
• A system to ensure the right to education of young mothers by implementing a non-dis-criminatory policy against pregnant adoles-cents.
• An elimination of violence in school affecting most especially the girls.
On fi nancing There has to be a substantial increase in invest-
ment for education to fast track initiatives to achieve universal basic education and meet all the MDG and EFA Goals by 2015. This means a move closer to meeting the international benchmark of 6% of GDP as public expenditure for education and a reserve of at least 20% of the national budget for education, with an increased allocation for maintenance and other operating expenses (MOOE) including teacher train-ing. There should be a participatory and transparent budgeting process, and easy public access to all fi nancial information and documents.
On governance The governance of education should be improved
by ensuring transparency and accountability, and by enhancing participation of all stakeholders, includ-ing parents, students, community representatives and NGOs. The representation and meaningful participa-tion of stakeholders in policy bodies at national, local and school levels should be assured.
Mechanisms should be created for the participa-tion of students and their organizations in formulating school policies, in curriculum development and in improving teaching methodologies.
Finally, institutions must be strengthened by mak-ing them accountable. The problems of the country’s education sector are not new. They have long been identifi ed and well-studied and appropriate solutions formulated and piloted. A comprehensive reform agenda had been adopted – the Basic Education Sector Reform Agenda or BESRA. Commitments were made; and targets set and revised periodically. However, it was business-as-usual in the last 10 years amidst failures and reversals. Some serious accounting must be done to correct the failings of the institution and allow the education sector to move on.

52 SOCIAL WATCH PHILIPPINES
Box 2. Education budget tracking (2008-2009)
The DepEd is the biggest government agency, em-ploying over half a million teachers and non- teaching personnel and serving more than 20 million students. Every year, billions of pesos worth of inputs and services are procured such as textbooks, armchairs, teaching ma-terials and food, and the construction of school buildings and even the hiring of consultants for various projects. Being a centralized bureaucracy faced with immense work, the DepEd has diffi culty in ensuring effi cient use of resources and quality of services. Ineffi ciencies and wastages were observed in the budget tracking initiative undertaken by E-Net Philippines jointly with Social Watch Philippines.
A case in point is in teacher hiring. While the govern-ment devotes funds for additional teachers to lower the pupil-teacher ratio, delays in the hiring of new teachers are usual. Based on the budget tracking, teachers were hired only towards the end of the year. The school administrators explained that this was due to the long 11-step process in hiring teachers. Sometimes, the delay in the hiring was done deliberately to generate savings from the unspent salaries of teachers yet to be hired. These savings could then be used to augment teachers’ end-of-year bonuses.
Similarly, the DepEd has been questioned in the past years for controversial procurements of textbooks. One alleged irregularity involved the purchase of erroneous textbooks for Filipino and Social Studies for grades 1-5, which was part of the 12 million textbooks purchased with funds from the World Bank.
The food for school program is another case of a wasted initiative that had a large fund allocation but was poorly conceptualized and badly implemented with many irregularities, thus, rendering the project ineffective. School nutritionists doubted the effectiveness of the program given the short duration of implementation, irregular rice delivery schedules and the limited quantity of rice distributed to the pupils. In several cases, rice deliveries occurred late in the school year when pupils had already dropped out of school. The impact of the program in terms of improving nutrition and pupil performance and in reducing drop-out rates is questionable particularly because of the absence of a moni-toring system. These noted weaknesses of the program led the new administration to cancel the program, but only after wasting several billions in much needed resources.
The School Based Management (SBM) grant aims to support efforts of schools and divisions towards improvement as part of the decentralization efforts and school empowerment process. However, delays in the release of funds from the SBM grant amounting to a total of Php 500 million were also monitored by E-Net. For example, the SBM funds for 2007 were released only in the last week of December 2007. Considering the processes involved, paper requirements in govern-ment purchasing and the corresponding time needed in disbursing funds, all these made utilization of the SBM within the fi scal year very diffi cult. Problems in the management funds are threatening the implementation of the plan to empower schools.
These are but a few examples that refl ect ineffi ciencies and the poor governance of the education in the country.
References
ADB Statistical Data Base System & IMF Government Finance. January 2008.
ASPBAE (Asia South Pacifi c Association for Basic and Adult Edu-cation). 2007. Mapping Out Disadvantaged Groups in Educa-tion. Education Watch Reports, Philippines summary report.
Dakar Framework for Action. 2000. Education for All: Meeting our Collective Commitments. Adopted by the World Educa-tion Forum. Dakar, Senegal, 26-28 April. http://www.unesco.org/education/wef/en-conf/dakframeng.shtm.
Delors, J., In’am, A. M., Amagi, I., et al. 1996. Learning: The Treasure Within. Report to UNESCO of the International Com-mission on Education for the Twenty-First Century. Paris. www.unesco.org/delors/.
DepEd (Department of Education). Factsheet, Basic Education Statistics (School Years 1990/1991 – 2007/2008).
IDMC. October 2009. Cycle of confl ict and neglect. Mindanao’s displacement and protection crisis. Internal Displacement Monitoring Centre, Norwegian Refugee Council. www.internal-displacement.org
Manasan, R. G. 2007. Financing the Millennium Development Goals: The Philippines (Final Report). United Nations Develop-ment Programme.
NSCB – Child Development Index www.nscb.gov.phNational Statistics Offi ce and ORC Macro. 2004. National Demo-
graphic and Health Survey 2003. Calverton, Maryland.National Statistics Offi ce and ICF Macro. 2009. National Demo-
graphic and Health Survey 2008. Calverton, Maryland.
NSO, LCC, and DepEd. 2005. 2003 Functional Literacy, Education and Mass Media Survey (FLEMMS) Final Report. Manila.
“Philippines Fourth Progress Report on the Millennium Develop-ment Goals (MDGs).” Third Draft, July 2010 (n.p.)
Raya, R. 2010. “Investing in the Out-of-School.” Philippine Institu-tions: growth and Prosperity for All. Sta. Ana III, Filomeno (Ed.). Action for Economic Reforms. Quezon City.
Republic of the Philippines. 2009. Republic Act No. 9524, General Appropriations Act Fiscal Year 2009. http://www.dbm.gov.ph/index.php?pid=8&xid=28&id=989.
Republic of the Philippines. 2008. Republic Act No. 9498, General Appropriations Act Fiscal Year 2008. http://www.dbm.gov.ph/index.php?pid=8&xid=28&id=461
Republic of the Philippines. 2007. Republic Act No. 9401, General Appropriations Act Fiscal Year 2007.http://www.dbm.gov.ph/index.php?pid=8&xid=28&id=38&page=
Republic of the Philippines. 2005. Republic Act No. 9336, General Appropriations Act Fiscal Year 2005.http://www.dbm.gov.ph/index.php?pid=8&xid=28&id=39&page=
UNESCO. 2007. EFA Global Monitoring Report 2008. Education for All by 2015: Will We Make It? Paris.
UNESCO. 2008. EFA Global Monitoring Report 2009. Overcoming Inequality: Why Governance Matters. Paris.
UNESCO. 2009. EFA Global Monitoring Report 2010. Reaching the marginalized. Paris.
UNESCO and UNICEF. 2005. Children Out of School, Measuring Exclusion from Primary Education. Montreal: UNESCO Institute for Statistics.

Winning the Numbers, Losing the War: The Other MDG Report 2010 53
Filipino women in the lead-up to the 2015 MDG deadline By MAE V. BUENAVENTURA
Summary
As state party to the Women’s Convention and all other core international
human rights conventions, the Philippines is often commended as being
well ahead of its Asian neighbors when it comes to the realm of women’s
human rights. This view has strengthened over the years with the country’s adop-
tion of other international commitments, such as the Millennium Development
Goals. The ultimate bar of success though, lies in how these pledges play out domestically. Some steps
in harmonization have certainly contributed in improving Filipino women’s lives, such as increased
participation in basic education and in formal labor. Gender inequalities, however, stubbornly persist,
challenging the gains women may have won from realizing these targets. Large gaps endure in productive
and social reproductive labors. Women’s presence is insignifi cant in spheres of political decision-making.
Violence against women, manifesting entrenched discriminations against them, persists.

54 SOCIAL WATCH PHILIPPINES
state colleges and universities, government-owned and controlled corporations (GOCCs) and Local Govern-ment Units (LGUs).
Recognized as a means to support the PPGD, the measure gained ground with a memorandum issued by then president Fidel Ramos to the Department of Budget and Management (DBM) and the issuance of ad-ministrative guidelines by the National Economic Devel-opment Authority (NEDA), the DBM and the National Commission on the Role of Filipino Women (now the Philippine Commission on Women or PCW).3
Other laws promoting and strengthening women’s rights were adopted from the mid-90’s onwards. Repub-lic Act 7822 (February 20, 1995) provided assistance to Filipino women engaged in micro and cottage enter-prises, including priority access to loans from public fi -nancial institutions for the purchase of equipment, tools and materials for their business. The Migrant Workers and Overseas Filipinos Act of 1995 (Republic Act No. 8042) contains many provisions aiming to “establish a higher standard of protection and promotion of the welfare of migrant workers,” many of whom are women in the domestic work sector. Signifi cant strides in le-gally protecting women against sexual violence came with the passage of the Anti-Sexual Harassment Law of 1995, the Anti-Rape Law of 1997, the Anti-Traf-fi cking in Persons Act of 2003 and the Anti-Violence Against Women and their Children Act of 2004. In 2009, the Convention on the Elimination of all forms of Discrimination Against Women (CEDAW) was localized in the form of the Magna Carta of Women, a framework law recognizing among others, the prin-ciple of substantive equality between men and women and stressing the state’s duty to progressively abolish structures and practices perpetuating discrimination against women.
Gains and challenges in education targets under Goal 3
Of the MDG indicators, those under Goal 3 on education show important achievements. Women and
This paper looks at highly vulnerable groups of women from a rights-based perspective to exam-ine the progress with Goal 3 on Gender Equality and Women’s Empow-erment. Further informed by intersectional approaches, it stresses the need to interrogate layered discriminations against women that has and will continue to block substantive advancements under this Goal. Women’s empowerment will need interventions more comprehensive and substantive than ensuring gender parity and formal equality in school, work and political participation. Recognition of structural and systemic inequalities and inequities, including discriminations stemming from gender, is a crucial fi rst step towards a more dynamic ap-preciation and implementation of Goal 3. These have to be brought front and center of all efforts to comply with Goal 3, as well as the rest of the MDGs, for deeper, wider and faster interventions that contribute to the strategic goal of women’s empowerment.
Gains for Filipino women in legislation and policyCompared to other registers of progress in women’s
rights, the legal and policy environments show the most signifi cant progress over the last two decades since the formal recognition of gender equality in the 1986 Phil-ippine Constitution. Continuing women’s legislative advocacies produced more gains in succeeding years, such as the landmark Women in Nation-building Act (Republic Act 7192) passed by Congress 1991 and signed into law by Corazon Aquino the following year. It provided for the drafting of the Philippine Plan for Gender Responsive Development (PPGD) 1995-2025, described as the “main vehicle for implementing the 1995 Beijing Declaration and Platform for Action.1
The funding mechanism for these started with a general provision in the 1995 General Appropriations Act (GAA) mandating all departments, bureaus, offi ces and agencies to set aside a minimum of fi ve percent of their appropriations for gender and development-related plans, programs and activities.2 The Gender and Development Budget (GAD) Policy has since been incorporated in the annual GAAs and now covers
1 Philippine Commission of Women, “About Us,” 2 Philippine Commission of Women. 2002. GAD Planning and Budgeting: Adding Value to Governance, GAD Budget Policy Compliance
Report 2001-2002.3 Senate Economic Planning Offi ce, “Engendering a gender responsive budget: A look at the GAD Budget policy,” Policy Brief 10, No. 2
March 2010.4 “Basic education” refers to “pre-school, elementary and secondary education and basic non-formal/informal learning programs focused
on functional literacy, livelihood-oriented training, and citizenship/values inculcation for adults and out-of-school youths.” http://www.nscb.gov.ph/activestats/psced/expnotes.asp.
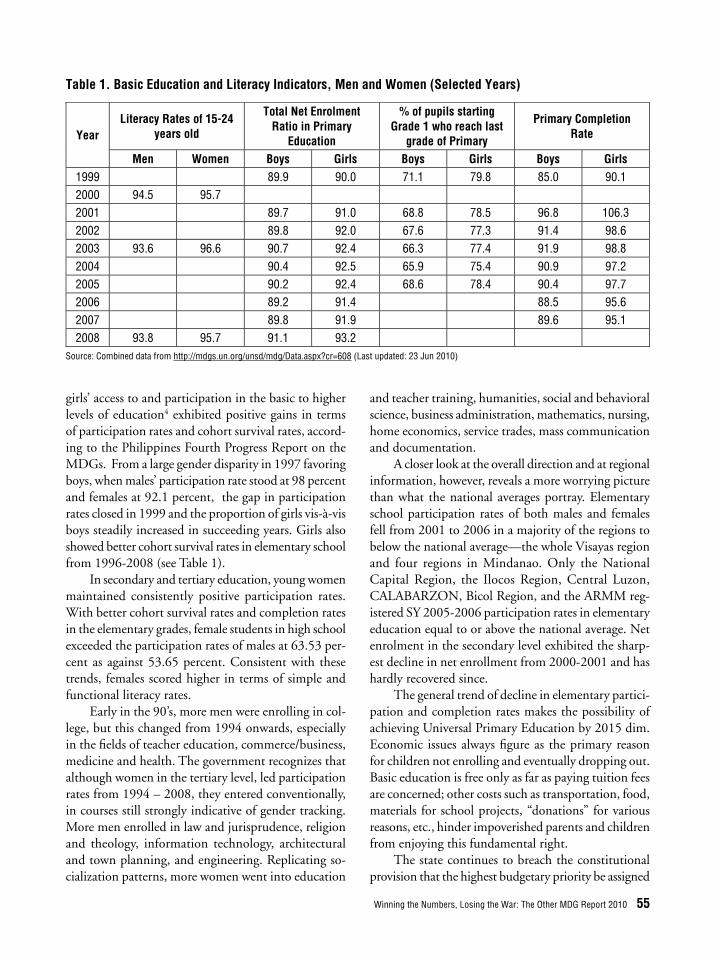
Winning the Numbers, Losing the War: The Other MDG Report 2010 55
girls’ access to and participation in the basic to higher levels of education4 exhibited positive gains in terms of participation rates and cohort survival rates, accord-ing to the Philippines Fourth Progress Report on the MDGs. From a large gender disparity in 1997 favoring boys, when males’ participation rate stood at 98 percent and females at 92.1 percent, the gap in participation rates closed in 1999 and the proportion of girls vis-à-vis boys steadily increased in succeeding years. Girls also showed better cohort survival rates in elementary school from 1996-2008 (see Table 1).
In secondary and tertiary education, young women maintained consistently positive participation rates. With better cohort survival rates and completion rates in the elementary grades, female students in high school exceeded the participation rates of males at 63.53 per-cent as against 53.65 percent. Consistent with these trends, females scored higher in terms of simple and functional literacy rates.
Early in the 90’s, more men were enrolling in col-lege, but this changed from 1994 onwards, especially in the fi elds of teacher education, commerce/business, medicine and health. The government recognizes that although women in the tertiary level, led participation rates from 1994 – 2008, they entered conventionally, in courses still strongly indicative of gender tracking. More men enrolled in law and jurisprudence, religion and theology, information technology, architectural and town planning, and engineering. Replicating so-cialization patterns, more women went into education
Table 1. Basic Education and Literacy Indicators, Men and Women (Selected Years)
Year Literacy Rates of 15-24
years old
Total Net Enrolment Ratio in Primary
Education
% of pupils starting Grade 1 who reach last
grade of Primary
Primary Completion Rate
Men Women Boys Girls Boys Girls Boys Girls 1999 89.9 90.0 71.1 79.8 85.0 90.1 2000 94.5 95.7 2001 89.7 91.0 68.8 78.5 96.8 106.3 2002 89.8 92.0 67.6 77.3 91.4 98.6 2003 93.6 96.6 90.7 92.4 66.3 77.4 91.9 98.8 2004 90.4 92.5 65.9 75.4 90.9 97.2 2005 90.2 92.4 68.6 78.4 90.4 97.7 2006 89.2 91.4 88.5 95.6 2007 89.8 91.9 89.6 95.1 2008 93.8 95.7 91.1 93.2
Source: Combined data from http://mdgs.un.org/unsd/mdg/Data.aspx?cr=608 (Last updated: 23 Jun 2010)
and teacher training, humanities, social and behavioral science, business administration, mathematics, nursing, home economics, service trades, mass communication and documentation.
A closer look at the overall direction and at regional information, however, reveals a more worrying picture than what the national averages portray. Elementary school participation rates of both males and females fell from 2001 to 2006 in a majority of the regions to below the national average—the whole Visayas region and four regions in Mindanao. Only the National Capital Region, the Ilocos Region, Central Luzon, CALABARZON, Bicol Region, and the ARMM reg-istered SY 2005-2006 participation rates in elementary education equal to or above the national average. Net enrolment in the secondary level exhibited the sharp-est decline in net enrollment from 2000-2001 and has hardly recovered since.
The general trend of decline in elementary partici-pation and completion rates makes the possibility of achieving Universal Primary Education by 2015 dim. Economic issues always fi gure as the primary reason for children not enrolling and eventually dropping out. Basic education is free only as far as paying tuition fees are concerned; other costs such as transportation, food, materials for school projects, “donations” for various reasons, etc., hinder impoverished parents and children from enjoying this fundamental right.
The state continues to breach the constitutional provision that the highest budgetary priority be assigned

56 SOCIAL WATCH PHILIPPINES
to education.5 In practice, debt payments are of the highest priority, enjoying automatic appropriations in accordance with the 1987 Revised Administrative Code.6 Spending no higher than 3.8 percent of GNP for education from 1996-2007, the Philippines’ is some distance from the 6 percent of GNP recommended by the UNESCO Delors Commission.7
Gender parity as an indicator and a target have certainly yielded gains for the country’s performance on Goal 3 but it also needs to be used in ways that connect to the bigger picture and to the wider goal of eliminating gender inequality and empowering women. We call to mind the observation a few years back by Education for All (EFA), that “[t]o the extent that progress towards gender parity suggests a weaken-ing of the factors that keep women and men in unequal positions, it represents the fi rst steps towards achieving equality of outcomes for the sexes….However, gender parity indicators have some limitations, even when they are available over time. First, even if progress towards parity appears to be being made, this sometimes masks declines in male or female enrolment and participation, rather than indicating positive gains for both boys and girls. Second, a focus on quantitative balances reveals nothing about the processes by which they are being secured, nor about the qualitative changes that would be necessary if gender parity is to lead to full equality.”8
Gender equality is concerned not only with formal equality between men and women but with equality in the enjoyment of the results of interventions. Thus, conditions outside schools, in households, communities and society at large are necessarily implicated. The EFA Report aptly stresses: “Inequalities arise from unequal power relations between women and men, and hence assessments of progress towards gender equality need to establish whether the changes that are being achieved are signifi cantly altering these relations.”9
In this light, studying the link between the males’ poor performance in education and the need to earn an income for the household should be broadened to include the situation of girls and women as well. For one, parents’ willingness to invest more in girls’ education could be linked to increasing participation of women in non-agricultural sectors and the demand for female domestic labor abroad.
The need to work as one of the reasons recorded for decreased male enrollment and presence in school also fosters the view that women and girls are free from economic activity and thus have the time to participate and stay in school. This underscores the relevance of data on intra-level household decision-making and the gender division of labor, as one of the fi ndings of a study undertaken by the Asia-South Pacifi c Education Watch points out. It showed reproductive labor such as housekeeping and childcare remaining as girls and women’s responsibility; these burdens did not lighten because they enrolled and stayed in school. Housework was recorded as the second biggest factor causing drop-outs among females. Discrimination also emerges as a factor among females who left school due to pregnancy and early marriage.10
Women’s political participationWomen’s voice in political decision-making did
not fare as well as education, and many still entered the fi eld through a historically embedded system of politi-cal patronage. The UN Statistics Division, on MDG indicators tracks the minuscule increases in the number of seats held by women in the legislature as compared to men and the snail’s pace with which these increased over a 10-year period (see Table 2).
Women occupied only a 16.6 percent share of elective positions as of December 2008 as opposed to men who held 83.4 percent. Although, the number of male representatives decreased in later years, the gap
5 1987 Philippine Constitution, Article 14, Section 5, (5).6 The Revised Administrative Code of 1987 stipulates: “Section 26. Automatic Appropriations. — All expenditures for personnel retirement
premiums, government service insurance, and other similar fi xed expenditures, (2) principal and interest on public debt, (3) national gov-ernment guarantees of obligations which are drawn upon, are automatically appropriated: provided, that no obligations shall be incurred or payments made from funds thus automatically appropriated except as issued in the form of regular budgetary allotments.” (emphasis supplied).
7 Freedom from Debt Coalition (FDC) and the Youth Against Debt (YAD), ““The Neglected Generation,” 8 United Nations Educational, Scientifi c and Cultural Organization (UNESCO), Gender and Education for All, The Leap to Equality, Global
Monitoring Report 2003/04, (France, 2003), 116.9 Ibid.10 Asian South Pacifi c Bureau of Adult Education (ASPBAE), Philippines: Summary Report, Mapping Out Disadvantaged Groups in Educa-
tion, (2007) 12.

Winning the Numbers, Losing the War: The Other MDG Report 2010 57
remained signifi cant at 23.2 percent and 76.8 percent for women and men, respectively11 (see Table 3).
As for the government bureaucracy, numbers of men and women were almost equal in 2008, only because of a substantial decrease in female employees but this does not appear to be a gain when compared to the previous period reported when there were more than 800,000 women government employees. Women in career service positions, though still in the majority,
Table 2. Seats held by women and men in national parliament (updated June 23, 2010)
2001 2002-04 2005-07 2008-09 2010 Total number of seats in national parliament 222 214 236 239 267 Seats held by men in national parliament 197 176 200 190 211 Seats held by women in national parliament 25 38 36 49 56 Seats held by women in national parliament (%) 11.3 17.8 15.3 20.5 21.0
Source: UN Statistics Division, Department of Economic and Social Affairs, MDG Indicators.
Table 3. Elective Positions Held by Men and Women
As of March 2007* As of March 2010*
Women Men Women Men Proportion (%) of occupied elective positions 16.6 83.4 23.2 76.8 No. of elected women and men by position 2,901 14,565 3,037 14,440 President 1 0 1 0 Vice President 0 1 0 1 Senators 3 9 3 9 Congress representatives 32 179 1 11 Governors 7 62 45 173 Vice Governors 15 71 18 62 Mayors 125 623 13 67 Board members 244 123 1,352 Vice Mayors 222 274 1,375 Councilors 2,251 230 10,881
Source: NSCB Fact Sheet, March 1, 2010. * Reference period/source: 2004 and 2008 COMELEC, NSCB Factsheets, March 2007 and March 2010, respectively
Table 4. Distribution of Government Personnel by Major Subdivision
fell by over 100,000 from 2007-2010. Downsizing may have accounted for this fall, and the gender differentials show how women are disproportionately affected when the public sector contracts (see Table 4).
Of government personnel in the career service, the part of civil service founded on merit, women comprised the majority at 583,045 or 52.33 percent, a significant drop from previous years when they numbered 722,40112 (see Table 5). They comprised
As of March 2007* As of March 2010*
Women Men Women Men Total Number 817,266 640,191 640,304 632,124 National Agencies (%) 72.8 58.9 66.0 59.6 Government Owned & Controlled Corporations (%) 6.2 12.7 6.3 9.2 Local Government Units (%) 21.0 28.4 27.7 31.2
*Reference Period/source: 2004 and 2008 Civil Service Commission, NSCB Factsheets, March 2007 and March 2010, respec-tively.
11 NSCB Fact Sheets, March 1, 2010 (FS-201003-SS2-01), &(FS-200703-SS1-01).12 NSCB Fact Sheet, March 8, 2007.

58 SOCIAL WATCH PHILIPPINES
more than 70 percent of employees in the second level (professional, technical and scientifi c positions doing both supervisory and non-supervisory work). As of the 2008 Civil Service Commission (CSC) data, women in career executive positions (third level) numbered just over 5,000 or 0.9 percent as compared to 1.5 percent for men or almost 8,000. There were even fewer women in the past, when they totaled only 2,889 (0.4 percent) as against close to 6,000 men (1.1 percent).
The same patterns hold for the judiciary where women are in the minority at 20 percent of total posi-tions in this governmental branch. The participation of women in the judiciary barely increased from 20 percent of the total incumbent judges in the fi rst and second level courts, including Shari’a courts (2001); to 24 percent in 2002; 25 percent in 2003; and 26 percent in 2004. The Philippine Commission on Women itself described women’s presence in the judicial system as “dismal”. The same can be said of the Supreme Court. There were 3 women out of 15 justices in 2001; 4 out of 15 in 2002; 4 out of 14 in 2003; 5 out of 15 in 2004; and 5 out of 15 in 200713 (see Figures 1 and 2).
Women’s economic empowerment: lagging behind Gains in gender parity in education are diffi cult to
make sense of when weighed against stubborn conditions of gender inequality that hold back women’s empower-ment. We do not discount the fact that socio-cultural fac-tors also impede women’s empowerment, but it is often the case that where women are enabled economically, they also advance in empowerment and autonomy.
In this area of women’s economic participation, signifi cant gaps endure, affecting other gender parity
Table 5. Distribution of Government Personnel in Career Service Positions
As of March 2007* As of March 2010*
Women Men Women Men Total number of personnel in career 722,401 543,767 583,045 531,040 First level (%) 21.1 38.7 26.1 36.4 Second level (%) 78.1 59.4 72.3 60.4 Third level (%) 0.4 1.1 0.9 1.5 Non-executive career (%) 0.4 0.8 0.7 1.6
Source: Reference period/source: 2004 and 2008 Civil Service Commission, NSCB Fact Sheets, March 2007 and March 2010 respectively.
Figure 1: Women Judges in the 1st, 2nd Level Courts including Sharia Courts (percent)
80.476.4 74.3 73.6
19.623.6 25.3 26.4
0
10
20
30
40
50
60
70
80
90
2001 2002 2003 2004Men Women
34 4
5 5
1211
10 10 10
0
2
4
6
8
10
12
14
2001 2002 2003 2004 2007Women Men
Figure 2: Women Justices in the Supreme Court (in tens)
Source for both fi gures: Philippine Commission on Women, “Statistics on Filipino Women in Politics and Governance”
13 Philippine Commission of Women, “Statistics on Filipino Women Participation in Politics and Governance,” http://www.ncrfw.gov.ph/in-dex.php/statistics-on-fi lipino-women/14-factsheets-on-fi lipino-women/72-statistics-fs-fi lipino-women-politics-governance (accessed June 3, 2010).

Winning the Numbers, Losing the War: The Other MDG Report 2010 59
targets not only in education but also across the other MDGs, vis-à-vis political participation, reproductive health, environmental sustainability, and the like. For purposes of this section, we take guidance from the Concluding Comments to the Philippine Government’s 2006 report by the CEDAW Committee, which stressed women and work, specifi cally women in rural popula-tions, the informal sector and migration.
Correlating employment and education data shows that having more years of education did not translate to greater participation in formal labor. Education is obviously not the critical determinant in increasing one’s chances of employment. Government data on Labor Force Participation rates (LFPR) or the ratio of the labor force population to the household population 15 years old and older, shows the large gap between men and women persisting throughout the last decade, from the 1998–2008. Women’s LFPR reached its highest point in 2002 at 52.8 percent, from
Table 6. Labor Force, Labor Force Participation Rate (LFPR) and Men-Women Participation Gap by Sex, Philippines: 1998 – 2008 ((In thousands except rates)14
14 Bureau of Labor and Employment Statistics, “2009 Gender Statistics on Labor and Employment”
49.1 percent in 1998. Men’s LFPR on the other hand, fell no lower than 78.8 percent during the 10-year period and reached a high of 83.8 percent in 2004 (see Table 6).
By 2008, LFPR stood at 78.8 percent for men and only 48.6 percent for women, registering a gap of 30.1. From the October 2009 LFS survey LFPR only slightly rose for women at 49.3 percent and minimally decreased for males at 78.8 percent, with no trend changes in the immediate future.
While there are more women in the workforce than before, they receive less wages for substantively the same work that men do. Wage gaps, an indicator not as often cited as other factors impeding gender inequality such as education and employment, have proven unshakeable as well in almost all categories of employment. Gains in increasing LFPRs of women cannot therefore be taken as absolutes; norms discriminatory to women continu-ously operate and when unheeded, erode already limited
Source: Bureau of Labor and Employment Statistics; source of basic data: National Statistics Offi ce, Labor Force Survey.Notes: 1. Details may not add up to totals due to rounding.2. Labor force is the sum of all the employed and unemployed persons.3. Labor force participation rate is the ratio of the total labor force to total household population 15 years old and over multiplied by 100.4. 1998-2005 data were calculated using population projections based on the 1995 Census of Population.5. 2006-2008 data were calculated using population projections based on the 2000 Census of Population. a The NSO adopted the new (ILO) defi nition of unemployment in the LFS questionnaire starting with the April 2005 survey round (survey rounds (January,
April, July and October). Due to the change in methodology, labor force data series for 2005 and onward cannot be computed for the four are not compa-rable with the old. As the data for January 2005 were based on the old defi nition of unemployment, averages for 2005
YEAR (Survey rounds January, April, July and October)
Labor Force LFPR Men-Women Participation
Gap Both
Sexes Male Female Both Sexes Male Female
1998 Average 29,674 18,533 11,140 65.9 83.2 49.1 34.1
1999 Average 30,759 19,104 11,654 66.4 82.9 50.1 32.8
2000 Average 30,911 19,307 11,605 64.9 81.4 48.5 32.9
2001 Average 32,809 20,098 12,710 67.1 82.4 51.8 30.6
2002 Average 33,936 20,601 13,335 67.4 82.0 52.8 29.2
2003 Average 34,571 21,216 13,354 66.7 82.2 51.4 30.8
2004 Average 35,862 22,204 13,659 67.5 83.8 51.2 32.6
2005 Average a a a a a a a
2006 Average 35,464 21,811 13,653 64.2 79.3 49.3 30.0
2007 Average 36,213 22,217 13,995 64.0 78.8 49.3 29.5
2008 Average 36,805 22,673 14,132 63.6 78.8 48.6 30.1

60 SOCIAL WATCH PHILIPPINES
spaces that incrementally open for women to enjoy their rights (see Table 7).
An expanding informal sectorWaged labor does not capture all the work that
Table 7. Average Daily Basic Pay by Major Occupation Group and Sex, 2002 - 2008
MEN 2002 2003 2004 2005 2006 2007 2008 All Occupations 223.37 228.63 232.00 245.82 264.76 268.79 279.17 Officials of Government & Special Interest-Organizations, Corporate Executives, Managers, Managing Proprietors and Supervisors
505.37 541.09 561.80 581.80 639.61 649.15 665.90
Professionals 530.99 541.19 553.87 555.76 567.42 605.87 625.81 Technicians & Associate Professionals
359.74 354.19 361.20 381.63 445.28 417.86 435.30
Clerks, Service Workers & Shop & Market 266.80 275.17 277.01 296.44 323.97 342.95 363.31
Sales Workers 238.16 242.66 247.38 250.26 263.29 270.89 281.31 Farmers, Forestry Workers & Fishermen
116.79 117.47 129.97 138.91 163.36 183.11 174.37
Craft & Related Trades Workers 211.98 219.29 226.38 236.91 259.73 261.65 272.34
Plant & Machine Operators and Assemblers 219.90 227.30 231.74 247.48 264.10 278.18 284.94
Laborers & Unskilled Workers 133.63 138.29 142.86 152.21 166.35 165.40 172.96 Special Occupations 358.67 397.52 403.88 454.30 471.55 520.02 500.45 WOMEN All Occupations 231.11 232.52 237.53 244.71 257.60 263.42 278.56 Officials of Government & Special Interest-Organizations, Corporate Executives, Managers, Managing Proprietors and Supervisors
518.81 520.03 555.90 579.08 614.94 636.79 685.32
Professionals 473.24 471.35 491.77 482.43 497.60 504.59 529.07 Technicians & Associate Professionals 332.21 326.93 325.28 337.38 384.76 364.77 386.08
Clerks 261.24 264.35 271.44 293.26 334.47 334.71 349.57 Service Workers & Shop & Market Sales Workers 153.06 155.84 161.11 161.64 165.36 175.60 182.82
Farmers, Forestry Workers & Fishermen 102.23 98.53 109.14 97.02 122.29 115.29 115.38
Craft & Related Trades Workers 171.01 179.79 181.29 193.53 195.22 205.43 211.07
Plant & Machine Operators and Assemblers 227.28 237.93 243.05 254.03 263.40 277.77 293.39
Laborers & Unskilled Workers 107.61 108.40 110.77 111.33 114.94 122.50 125.33 Special Occupations 222.74 228.65 216.92 244.80 295.81 291.39 337.39
Notes: 1. Data excludes basic pay of wage and salary workers paid on commission basis, honorarium, and boundary as in the case of jeep-ney/bus/tricycle drivers. 2. Data for 2002-2005 were based on 1995 Census of Population results, while data for 2006-2008 were based on the 2000 Census of Population.Source of basic data: National Statistics Offi ce, Labor Force Survey.
women do and their substantial contributions to the economy. Filipino women have been going into informal work in large numbers for various reasons, among them the many gender gaps in employment and wages, discrimination in fl exible labor arrange-

Winning the Numbers, Losing the War: The Other MDG Report 2010 61
15 NSCB Resolution No. 15-Attachment 1, Offi cial Defi nition of the Informal Sector: “…‘units’ engaged in the production of goods and services with the primary objective of generating employment and incomes to the persons concerned in order to earn a living…[typically operating] at a low level of organization, with little or no division between labor and capital as factors of production. It consists of household unincorporated enterprises that are market and non-market producers of goods as well as market producers of services….Labor relations, where they exist, are based on casual employment, kinship or personal and social relations rather than formal contractual arrangements.”
16 Clarence Pascual, “Social and economic empowerment of women in the informal economy : impact case study of Sikap Buhay.” ILO Asia-Pacifi c Working Paper Series No.18 (International Labour Organization Subregional Offi ce for South-East Asia and the Pacifi c: September 2008),
17 2009 Gender Statistics on Labor and Employment.
ments and multiple burdens of reproductive work in the home.15 Without social protection and job security, the informal workers are widely recognized as a highly vulnerable sector. “While it accounts for a large propor-tion of employment creation,” Pascual writes, “the bulk of informal employment involves marginal activities characterized by low productivity and low pay. The poor quality of informal jobs is evident in high rates of underemployment—due to lack of work hours or low earnings—and high poverty rates among the informal workforce….Besides underemployment and low in-comes, informal workers face a host of problems with adverse welfare consequences, including irregular work, volatile earnings, indebtedness, lack of social protection, harassment at work, and multiple burdens for women. The consequences can be immediate: poor health status,
Table 8. Employed Persons by Class of Worker and Sex, Philippines: 2002-2008 (in thousands)
CLASS OF WORKER AND SEX 2002 2003 2004 2005 2006 2007 2008 BOTH SEXES 30,062 30,635 31,613 32,313 32,636 33,560 34,089 MEN 18,306 18,873 19,646 19,910 20,013 20,542 20,959 Wage and Salary Workers 9,022 9,554 10,368 10,129 10,316 10,827 11,093 Worked for Private Establishment 7,372 7,934 8,871 8,610 8,728 9,109 9,406 Worked for Private Household 398 354 193 215 246 302 269 Worked for Family-Operated Activity 91 107 95 93 89 111 79 Worked for Gov't/Gov't Corporation 1,161 1,159 1,209 1,212 1,253 1,306 1,341 Own-Account Workers 7,429 7,583 7,682 8,057 7,880 7,883 7,984 Self-Employed 6,091 6,296 6,391 6,854 6,766 6,784 6,878 Employer 1,338 1,287 1,291 1,203 1,114 1,100 1,107 Unpaid Family Workers 1,854 1,736 1,597 1,723 1,818 1,832 1,882 WOMEN 11,756 11,762 11,968 12,403 12,622 13,018 13,130 Wage and Salary Workers 5,631 5,800 6,105 6,187 6,357 6,682 6,754 Worked for Private Establishment 3,174 3,361 3,682 3,651 3,695 3,841 3,878 Worked for Private Household 1,212 1,199 1,179 1,259 1,380 1,481 1,467 Worked for Family-Operated Activity 29 33 34 35 36 42 27 Worked for Gov't/Gov't Corporation 1,217 1,209 1,211 1,241 1,247 1,318 1,382 Own-Account Workers 3,970 3,934 3,933 4,047 4,070 4,117 4,097 Self-Employed 3,646 3,616 3,620 3,730 3,759 3,787 3,777 Employer 324 318 313 316 311 330 320 Unpaid Family Workers 2,155 2,029 1,931 2,170 2,195 2,219 2,280
Notes: 1. Details may not add up to totals due to rounding. 2. Data were averages of four survey rounds (January, April, July and October). 3. 2002-2005 data were calculated using population projections based on the 1995 Census of Population. 4. 2006-2008 data were calculated using population projections based on the 2000 Census of Population.Source of data: National Statistics Offi ce, Labor Force Survey, Public Use Files.
for example. Poor health can be long-term leading to loss of assets and future income, hence continuation of a cycle of poverty.”16
Using the Goal 3 indicator alone for women’s share of waged work in the non-agricultural sector leaves no room for looking at unremunerated work that women mainly do as part of family-owned busi-nesses or enterprises. The total number of unpaid family workers rose from 4 million in 2006 to 4.16 million (average) in 2009. Table 8 shows women in unpaid work as consistently greater in number than men, comprising over 50 percent of the total number from 2002 – 2008.17
The numbers of those involved in traditional informal work (vending, dressmaking, operating small sari-sari stores, etc.) have gone down from 60 percent

62 SOCIAL WATCH PHILIPPINES
in the 80’s, according to Sibal,18 which he explains may be due to “…the absorption of some of its members in the formal sector as non-regular or contractual work-ers. Non-regular workers hired locally or overseas are absorbed in formal establishments periodically. If we add the number of non-regular employees and agency-hired workers to the informal sector, their numbers would be increasing as experienced in the Asia and the Pacifi c region.” Similar to the trends in other countries in the region, employment is reported as becoming increasingly ‘informalized’, a condition that covers “…the traditional informal sector composed of the own account workers and the contributing family workers but also the ‘casualized’ (or contractualized) workers within formal establishments.” In the same manner, domestic work here and abroad is carried out on informal terms, making adherence to labor laws and workers’ rights diffi cult to monitor.
This is evident in fl exible labor arrangements that have become standard practice in the country’s pursuit of structural adjustment prescriptions, notably export-orientation and liberalization. Labor, and women’s labor in particular, is only one of various types of collateral damage of this drive to fully open the country to the global market and to foreign investments. Flexibiliza-tion measures can take the form of casualization/con-tractualization or substituting temporary and casual labor for regular or permanent workers.
Arrangements like these abound in the Export Processing Zones (EPZs) where women comprise the majority or an estimated 74 percent of workers. The very nature of work in which women are preferred channels them back into their socially constructed identities and reproductive work roles that they disproportionately bear in their households. “Employers in the EPZs are more likely to favour women for routine, repetitive work in the low-tech and labour-intensive industries like garments and electronics. Some consider women more compliant, disciplined and hard-working than their male counter-parts,” a 2004 report on the EPZs noted. The comments of an executive of the IT manufacturer Fujitsu, which
had up to 80 percent women in its employ at the time, is illustrative. He reportedly said that “…they are better than men,” and added that “they barely cost one-fi fth as much as a skilled worker in Japan.”19
Such issues can easily be masked by positive devel-opments in the rising share of women in waged work, slow and incremental this may be. Studies of EPZs in other countries establish the link between the need for cheap labor and the rise of women’s employment. Indicators must also be able to surface gender norms discriminatory to women that are acted out in the poli-cies and organizational cultures of workplaces.
Rural womenOne of the issues raised by the CEDAW with the
Philippine government was “…the precarious situation of rural and indigenous women, as well as the Muslim women in the autonomous region of Muslim Min-da-nao, who lack access to adequate health services, educa-tion, clean water and sanitation services, and credit facili-ties. The CEDAW Committee is also concerned about women’s limited access to justice in cases of violence, especially in the confl ict zones, and the lack of sanctions against perpetrators of such violence.”20 In noting these problems the CEDAW Committee brought to light the issue of discrimination against women as a major obstacle in rural and indigenous women’s poverty.
Legislation is in place to claim gender equality. The Comprehensive Agrarian Reform Law (CARL) provides that “[a]ll qualifi ed women members of the agricultural labor force must be guaranteed and assured equal rights to ownership of the land, equal shares of the farm’s produce, and representation in advisory or appropriate decision-making bodies.”21 This further gained strength institutionally with the passage of the Magna Carta of Women in 2009. The law reiterates the equal status of women and men, whether married or unmarried, in the titling of land and the issuance of contacts and patents. It also stipulates that equal treatment shall be given to women and men benefi ciaries of the agrarian reform pro-gram, wherein the vested right of a woman agrarian
18 Jorge Sibal, “Measuring the Informal Sector in the Philippines and the Trends in Asia.” Paper presented at the 10th National Convention on Statistics, October 1-2, 2007, EDSA Shangri-La Hotel, Mandaluyong City, sponsored by the NSCB.
19 Sarah Perman with Laurent Duvillier, Natacha David, John Eden et Samuel Grumiau, ed. Natacha David, “Behind the brand names, Work-ing conditions and labour rights in export processing zones. December 2004.
20 Raised as one of the CEDAW Committee’s Concluding Comments, in response to the Philippine government’s 5th and 6th report. For the full text, see “Concluding comments of the Committee on the Elimination of Discrimination against Women: Philippines.” 36th Session of the Committee on the Elimination of Discrimination against Women, August 7-25, 2006, New York.
21 Republic Act 6657, An Act Instituting a Comprehensive Agrarian Reform Program to Promote Social Justice and Industrializ-ing, Provid-ing the Mechanisms for its Implementation and for Other Purposes, Section 40, (5).
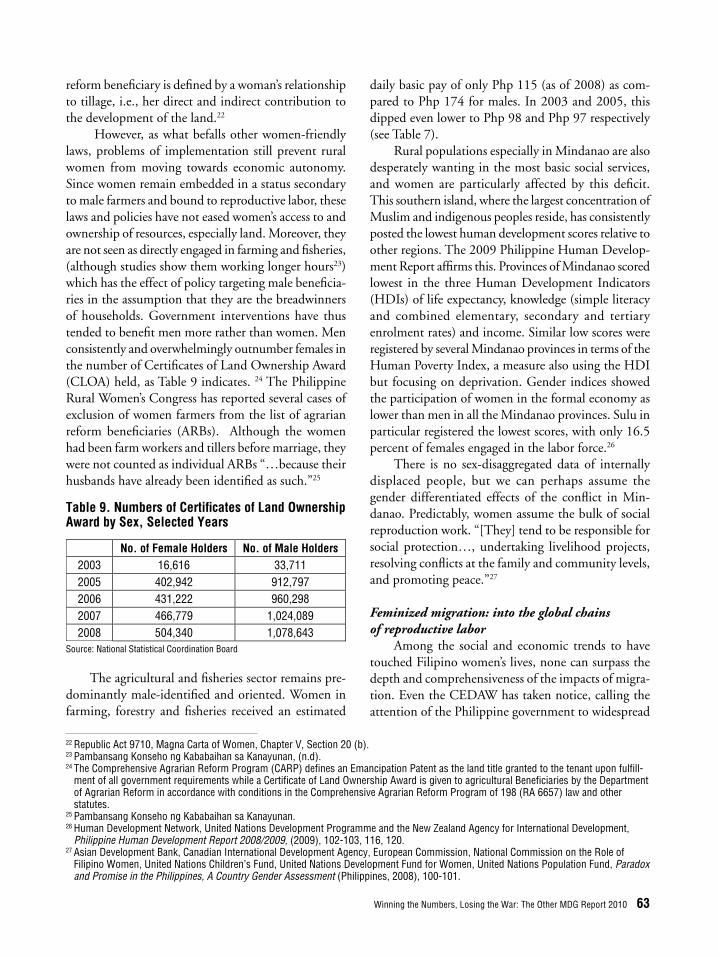
Winning the Numbers, Losing the War: The Other MDG Report 2010 63
22 Republic Act 9710, Magna Carta of Women, Chapter V, Section 20 (b). 23 Pambansang Konseho ng Kababaihan sa Kanayunan, (n.d). 24 The Comprehensive Agrarian Reform Program (CARP) defi nes an Emancipation Patent as the land title granted to the tenant upon fulfi ll-
ment of all government requirements while a Certifi cate of Land Ownership Award is given to agricultural Benefi ciaries by the Department of Agrarian Reform in accordance with conditions in the Comprehensive Agrarian Reform Program of 198 (RA 6657) law and other statutes.
25 Pambansang Konseho ng Kababaihan sa Kanayunan. 26 Human Development Network, United Nations Development Programme and the New Zealand Agency for International Development,
Philippine Human Development Report 2008/2009, (2009), 102-103, 116, 120.27 Asian Development Bank, Canadian International Development Agency, European Commission, National Commission on the Role of
Filipino Women, United Nations Children’s Fund, United Nations Development Fund for Women, United Nations Population Fund, Paradox and Promise in the Philippines, A Country Gender Assessment (Philippines, 2008), 100-101.
reform benefi ciary is defi ned by a woman’s relationship to tillage, i.e., her direct and indirect contribution to the development of the land.22
However, as what befalls other women-friendly laws, problems of implementation still prevent rural women from moving towards economic autonomy. Since women remain embedded in a status secondary to male farmers and bound to reproductive labor, these laws and policies have not eased women’s access to and ownership of resources, especially land. Moreover, they are not seen as directly engaged in farming and fi sheries, (although studies show them working longer hours23) which has the effect of policy targeting male benefi cia-ries in the assumption that they are the breadwinners of households. Government interventions have thus tended to benefi t men more rather than women. Men consistently and overwhelmingly outnumber females in the number of Certifi cates of Land Ownership Award (CLOA) held, as Table 9 indicates. 24 The Philippine Rural Women’s Congress has reported several cases of exclusion of women farmers from the list of agrarian reform benefi ciaries (ARBs). Although the women had been farm workers and tillers before marriage, they were not counted as individual ARBs “…because their husbands have already been identifi ed as such.”25
daily basic pay of only Php 115 (as of 2008) as com-pared to Php 174 for males. In 2003 and 2005, this dipped even lower to Php 98 and Php 97 respectively (see Table 7).
Rural populations especially in Mindanao are also desperately wanting in the most basic social services, and women are particularly affected by this defi cit. This southern island, where the largest concentration of Muslim and indigenous peoples reside, has consistently posted the lowest human development scores relative to other regions. The 2009 Philippine Human Develop-ment Report affi rms this. Provinces of Mindanao scored lowest in the three Human Development Indicators (HDIs) of life expectancy, knowledge (simple literacy and combined elementary, secondary and tertiary enrolment rates) and income. Similar low scores were registered by several Mindanao provinces in terms of the Human Poverty Index, a measure also using the HDI but focusing on deprivation. Gender indices showed the participation of women in the formal economy as lower than men in all the Mindanao provinces. Sulu in particular registered the lowest scores, with only 16.5 percent of females engaged in the labor force.26
There is no sex-disaggregated data of internally displaced people, but we can perhaps assume the gender differentiated effects of the confl ict in Min-danao. Predictably, women assume the bulk of social reproduction work. “[They] tend to be responsible for social protection…, undertaking livelihood projects, resolving confl icts at the family and community levels, and promoting peace.”27
Feminized migration: into the global chains of reproductive labor
Among the social and economic trends to have touched Filipino women’s lives, none can surpass the depth and comprehensiveness of the impacts of migra-tion. Even the CEDAW has taken notice, calling the attention of the Philippine government to widespread
Table 9. Numbers of Certifi cates of Land Ownership Award by Sex, Selected Years
No. of Female Holders No. of Male Holders 2003 16,616 33,711 2005 402,942 912,797 2006 431,222 960,298 2007 466,779 1,024,089 2008 504,340 1,078,643
Source: National Statistical Coordination Board
The agricultural and fi sheries sector remains pre-dominantly male-identifi ed and oriented. Women in farming, forestry and fi sheries received an estimated

64 SOCIAL WATCH PHILIPPINES
reports of female OFW deaths, sexual, physical and psychological abuse, and other forms of maltreatment by their employers. Few economic activities have brought in as much revenues for the Philippine govern-ment as migration, reaching as high as US$ US$17.3 billion in 2008.28 The Philippines is one of the 10 countries in the world whose remittance-to-GDP ratio registers at more than 10 percent. Migration is a phenomenon that no development intervention can afford to ignore.
Female OFWs increased to 968,000 in 2008 and dropped slightly to 901,000 in 2009 (see Table 10). Consistent with previous years, the regions with the highest number of unemployed women—the National Capital Region, Central Luzon and CALABARZON—also sent the most number of female OFWs.
Care labor is in the highest rungs of “fertile job markets”, where women in the developed countries have the resources to hire other women to assume reproduc-tive tasks. At the same time, there is no dearth of ap-plicants because the qualifi cations for these jobs deemed
Table 10. Overseas Filipino Workers by Sex (in thousands)
Year Both sexes Male Female 2009 1,911 1,010 901 2008 2,002 1,034 968 2007 1,747 890 857 2006 1,515 751 764 2005 1,327 667 660 2004 1,180 604 577 2003 983 508 475 2002 1,056 554 502 2001 1,029 528 501 2000 978 527 451 1999 1,043 547 497 1998 904 469 435 1997 1,013 554 459 1996 795 416 379 1995 795 504 396
Source: National Statistics Offi ce - Survey on Overseas Filipinos. Details may not add up due to rounding
Table 11. Deployed Landbased Contract Workers (New Hires) by Skills Category and Sex, 2002 - 2008
28 Bangko Sentral ng Pilipinas
Note: Disaggregation by skill may not add up to totals due to non-reporting of sex of OFWsa Includes workers whose skill were not reported and the 829 workers deployed thru Employment-based Immigration scheme.Source of data: Philippine Overseas Employment Administration.
SKILLS CATEGORY AND SEX 2002 2003 2004 2005 2006 2007 2008 Men 77,850 66,401 72,355 79,079 123,668 160,046 174,930 Professional, Technical & Related Workers 14,849 11,620 13,677 11,953 17,212 21,464 27,929 Administrative, Executive & Managerial Workers 246 284 398 381 528 715 1,041 Clerical & Related Workers 1,501 1,761 2,230 1,985 3,271 4,782 6,455 Sales Workers 1,591 1,096 1,189 1,288 2,405 2,553 4,247 Service Workers 9,292 7,725 11,343 10,666 16,135 20,894 22,759 Agricultural, Animal Husbandry & Forestry Workers, Fishermen & Hunters 596 384 661 311 716 873 1,082
Production & Related Workers, Transport Equipment Operators & Laborers 49,190 42,579 42,855 51,694 80,240 101,699 111,024
Not elsewhere classified/Not Stated 585 952 2 801 3,161 7,066a 393 Women 197,441 166,325 209,372 201,538 184,454 146,285 163,324 Professional, Technical & Related Workers 84,828 67,330 80,450 48,356 24,046 21,754 21,717 Administrative, Executive & Managerial Workers 128 103 167 109 289 424 475 Clerical & Related Workers 2,511 2,204 3,093 3,553 4,641 8,878 11,646 Sales Workers 1,452 1,393 2,758 2,972 3,112 5,385 7,277 Service Workers 88,078 76,292 102,035 123,219 128,186 86,215 100,570 Agricultural, Animal Husbandry and Forestry Workers, Fishermen & Hunters 15 29 21 39 91 79 272
Production and Related Workers, Transport Equipment Operators & Laborers 20,319 18,766 20,847 23,096 23,344 20,004 21,266
Not elsewhere classified/Not Stated 110 208 1 194 745 3,546a 101 Not Reported 8,785 86 44 - 52 12

Winning the Numbers, Losing the War: The Other MDG Report 2010 65
as “unskilled” or “semi-skilled” are few and the hope of economic advancement is compelling. Professional and technical workers used to lead in deployments but this has changed over the years. As of 2008, there were only 21,717 deployments in the professional and technical category as opposed to 100,570 in service work (see Table 11). The same trend continued in 2009, with female new hires in household service work (HSW) leading in deployment, followed by nurses and caregiv-ers29 (see Table 12).
What started as a stopgap measure of the Marcos government in the 70’s to provide employment is now an established practice, promoted by the high-est government offi cials. The prevailing situation has been one of persistent violations of women’s legal and human rights, particularly for the large numbers of women crossing borders (whether through regular or irregular30 channels) as domestic helpers (see Table 13). The POEA has coverage only over documented workers, and hence has no reach over the signifi cant numbers of undocumented women migrants or those whose status became irregular abroad.
Some of the policies intended to strengthen protec-
Table 12. Number of Deployed Landbased Overseas Filipino Workers by Top Occupational Category and Sex, Newa Hires1/: 2009
Male Female Both Sexes All Occupational Category 156,454 175,298 331,752 Household Service Workers 1,888 69,669 71,557 Waiter, Bartenders & Related Workers 4,97 6,999 11,977 Charworkers, Cleaners & Related Workers 2,140 7,916 10,056 Wiremen Electrical 9,709 43 9,752 Caregivers and Caretakers 507 8,721 9,228 Laborers/Helpers General 7,105 994 8,099 Plumbers & Pipe Fitters 7,702 20 7,722 Welders & Flamer Cutters 5,870 40 5,910 Housekeeping & Related Service Workers 908 4,219 5,127
Source: POEA, “Compendium of OFW Statistics,” http://www.poea.gov.ph/ html/statistics.html
29 The term “Household Service Workers” came about with the issuance of new guidelines from the POEA in 2007 for upgrading the skills of prospective migrant domestic helpers to turn them into what former President Gloria Macapagal Arroyo called “supermaids”. The Technical Education and Skills Development Authority (TESDA) administer the professionalization training course.
30 “Irregular migrants – These are migrants whose stay abroad is not properly documented. They also do not have valid residence and work permits; they may also be overstaying workers or tourists in a foreign country. Migrants belonging to this category shall have been in such status for six months or more. A related label to these migrants is “undocumented migrants”. In Filipino parlance, these migrants are called “TNTs” (tago ng tago, or ‘always in hiding’).” See http://almanac.ofwphilanthropy.org/component/option,com_frontpage/Itemid,1/limit,2/limitstart,2/.
31 Statement of the Center for Migrant Advocacy read by Atty. Cecilia Jimenez of the Geneva Forum for Philippine Concerns at the NGO meeting of the UN Committee on the Migrant Workers Convention. United Nations, Geneva, Switzerland, November 25, 2008.
tion especially of domestic workers have proven inef-fective. For instance, it set a higher minimum age for HSWs at 25 years old (the standard minimum age for all other migrant workers is 18) “to improve prepared-ness and maturity of the HSWs and in light of reports of unabated abuses and maltreatments against HSWs.” However, no implementing measures are provided to attain this. The policy itself provides no proactive ac-tions or measures to prevent abuse and instead seems to put the blame on migrant workers for their suffering at the hands of abusive employers without the benefi t of consultations among migrants and migrant rights advo-cates as well as with receiving governments. The Center for Migrant Advocacy reported that the migrants were not con-sulted on these policies.31
The stories of abuse of migrant women raises questions as to the effectiveness of government agencies mandated to protect their rights, such as the Foreign Affairs Department’s Offi ce of Legal Assistance for Migrant Workers Affairs. The Arroyo administration alone has six OFW beheadings to its name; 26 remain in death row in the Middle East alone and hundreds more are incarcerated. In Singapore, 51

66 SOCIAL WATCH PHILIPPINES
Table 13. Trafficked Migrants Assisted by DSWD32
Year Sex Total No.
of Victims Male Female 2003 6 116 122 2004 23 141 164 2005 154 320 474 2006 69 120 189
NCR 2003-2006 22 478 500 2007 25 334 359 Total 299 1,509 1,808
Source: From data consolidated by the Center for Migrant Advocacy - Philip-pines, Inc. (CMA-Phils.)
OFW deaths of suspicious circumstances have also been reported.33
An additional layer of protection can be gained from bilateral agreements drawn between receiving and sending countries to establish regulated labor migration and to ensure that the contracting parties are both understand the protection and promotion of workers’ rights. The CEDAW in its concluding comments on the last Philippine report pointed to the need for bilateral labor agreements with receiving countries. However, as of September 2009, the country has concluded only 34 agreements with 22 countries on employment
welfare and labor cooperation; 12 agreements with 10 countries on social security; and 44 agreements on recognition of seafarer’s certifi cates.34 This is grossly inadequate considering that there are more than eight million Filipinos working abroad in more than 190 countries, mostly in contractual or temporary jobs in Middle East countries.
Violence against women (VAW)To the government’s credit, it recognizes the
crippling consequences of VAW and their capacity to erode what gains women win in education, public life and economic participation. The UNDP cites data estimating that “…around 2.2 million Filipino women or nine percent of all women ages 18 years and above, experienced violence infl icted by their partners. In the past two years, around 70 percent of child-abuse victims were girls and about 40 percent of cases were sexual abuse and exploitation.”35 The Philippine National Police reports a sharp increase of 37.4 percent from 4,881 in 2006 to 9,485 in 2009 (see Figure 3). The number of DSWD-reported cases is even higher at 14,040 cases, increasing from 10,630 in 2008.36
Reporting VAW still meets with much stigma for the victim/s, so that actual fi gures are likely to be
Figure 3. Number of VAW Cases Reported to the Philippine National Police, 1997-200937
32 Center for Migrant Advocacy - Philippines, Inc., Philippine Migrants Rights Groups’ Written Replies to the List of Issues Relating to the Consideration of the Initial Report of the Philippines. Philippines: March 2009.
33 Ibid. 34 Abigail Kwok, “Better Migrant Filipinos’ Protection Pushed,” Inquirer.net, September 2009.35 “Millennium Development Goals, Goal 3, Gender Equality and Empowerment,” http://www.undp.org.ph/?link=goal_3.36 Businessworld Research, “Reported incidence of violence against women rises,” July 21, 2010.37 “Statistics on Violence Against Women.”

Winning the Numbers, Losing the War: The Other MDG Report 2010 67
larger. Lack of effi cient and well-coordinated systems in monitoring and evaluating incidents also results in various sets of data generated by different agencies, making it diffi cult to establish trends.
A step towards enhancing the quality of data on VAW, was to include in the National Demographic Health Survey (NDHS) 2008, questions on women’s experiences with sexual, physical, emotional and eco-nomic violence. The NDHS found, among others, that one in fi ve women aged 15-49 have experienced physical violence since age 15 and that almost one in 10 women in the same age range experienced sexual violence.38
Climate change: new threats to Goal 3Added impediments to the realization of Goal 3
have been posed by the climate crisis. Experience and documentation indeed establishes that disadvantaged communities are more in danger of being hardest hit by the current climate crisis, or any crisis for that matter. Within these communities, however, social constructs such as gender, intersecting with ethnicity, age, and economic entitlements, add more layers of risk to already vulnerable groups.
“For example, in places where women have less access to food and health care than men, they start off at a disadvantage when facing natural disasters and environmental stress. Since they are often the primary caregivers for children and the elderly, they may also have less mobility,” writes Hartman. “Cultural restrictions on women’s mobility can compound the problem. During the 1991 cyclone in Bangladesh many more women died than men because early warnings were displayed in public spaces where women were prohibited and women delayed leaving their homes because of fears of impropri-ety.”39 It is alarming that women’s voices, especially those from the grassroots, are still not strongly heard in both international negotiations and national debates.
The framing itself of the phenomenon of climate change and the privileging of technical and fi nancial solutions (e.g., carbon trading) contains bias against poor people and poor women in particular, who even remotely cannot be part of these transactions and processes. What is worrisome is how the Philippines has been abiding by this perspective, buying into debt-creating, market-based mechanisms installed
by international fi nancial institutions and Northern governments. This immediately presents diffi culties for women whose economic participation, social standing and political presence are already compromised and marginalized to begin with.
One example is the Clean Development Mecha-nism (CDM), which allows industrialized countries to circumvent their caps by transferring “clean technology” to a developing country. CDM projects, whose costs the Philippines partly covers, now dot the country from north to south. In effect, the developed countries of the North conveniently elude the reductions in GHG emissions required to lessen global warming and the impacts of climate-induced disasters.
The focus of interventions and resources has been mainly in mitigation—the offsetting or reduction of GHG emissions, rather than adaptation, or responding to and preparing for the impact of climate change. The bias is evident against the developing countries that emit far less than the developed countries.
For the developing world and vulnerable groups in particular, adaptation is the greatest human need in the face of climate change. Even in everyday life, women stretch their time and incomes to adapt to economic diffi culties. In situations of social service privatization, they fi ll in by default to compensate for services that are no longer state-subsidized and which their households can no longer afford. Thus, the adequacy of adapta-tion strategies is critical in determining whether more burdens will add to the coping and survival strategies that women in poor households and communities are already doing on a daily basis.
Thus far, the government’s responses to climate-induced disasters have been found wanting in gender awareness and sensitivity. Interventions have tended to be gender-blind, refl ecting a lack of understanding of equal but different needs and resulting in women’s unmet reproductive health needs. Also absent is consid-eration for the physical and emotional toll on women who mostly stay behind with their children in congested resettlement and rehabilitation centers while men seek livelihoods elsewhere. Among others, they lose what little mobility they have, access to social networks and incomes from informal work.
Being the 12th most populous nation in the world raises a particular aspect of climate change debates, im-
38 Romulo Virola, “Violence Against Women…At Home!” 39 Betsy Hartman. ZSpace. “Gender, Militarism and Climate Change,” April 10, 2006.

68 SOCIAL WATCH PHILIPPINES
plicating overpopulation and poor women, which can prove adverse to the realization of to women’s control over their bodies and is hence material to Goal 3 of women’s empowerment. Some population control poli-cies especially during times of political turmoil have led to harmful consequences for women and girls. Points raised by Jonathan Porritt, UK’s chief environmental adviser, exemplifi es how dangerous this terrain can be. He cited how China’s prevention of 400 million births through a one-child policy implemented since 1979 also saved it some 1.4 billion tonnes in CO
2 emis-
sions— “the biggest CO2 abatement since Kyoto came
into force.” Phil Ward comments that Porritt “fails to mention that up to 2002 Chinese women were given no choice about contraceptive method, with the result that 37 percent of married women have been sterilized.”40 Though the example of China is extreme, it serves as a cautionary tale.
Conclusions: enabling the realization of Goal 3The Philippines’ obligations to the realization of
many international development and human rights goals, as concomitant to its ratifi cation and adoption of the instruments in which these are enshrined, have been used many times and proven useful in pushing for the promotion of women’s rights and in seeking state accountability for the full realization of the same. Since the Philippines became state party to the CEDAW, there have been many gains won especially in the fi eld of legislative advocacy and policy reform. These inter-national commitments continue to be used as platforms for calling attention to enduring gender inequalities and human rights violations against women. The adoption of the eight measurable, time-bound goals in 2001 and their mainstreaming in the Philippine Medium Term Development Plans add to the gains achieved thus far towards moving in the direction of improving women’s lives.
The increased participation of women in education and comparatively greater enjoyment of their right to work are important steps forward in the framework of the MDGs. Purposively aligning the MTPDP with the MDGs and monitoring compliance have also gener-ated measures towards progressively seeking women’s empowerment. These include, as reported by govern-ment, shaping educational content to bring the gender
differentials and gender-based discriminations to the fore by highlighting the need for and importance of shared roles in care labor and household management, equitable spaces in decision-making and access to and ownership of resources, gender parity and affi rmative actions for enhancing women’s political participation, and ending VAW. Education is, after all, a critical part of the meso-level of institutions, laws and policies where gender biases disadvantageous to women are usually legitimated and institutionalized. A way of monitoring the impact of these interventions over time would yield invaluable information on government’s compliance to both its CEDAW and MDG commitments to pro-gressively address norms and practices discriminatory to women.
The recognition of inadequacies is VAW is recog-nized as “…a major obstacle to law implementation, sound programming and tracking for accountabil-ity.”
However, as the preceding sections indicate, gains in education, waged work and public life have yet to translate into meeting other targets set towards empow-ering women. Gender gaps and inequalities endure, eroding the gains achieved and impeding women’s moves towards realizing truly empowering goals of socio-economic and political autonomy. Data indicate that biases operating to the disadvantage of women remain pervasive at the macro level, at the meso level of institutions, laws and policies and at the micro level of families and households. Bridging the gaps towards women’s empowerment will need interventions that are more comprehensive and substantive than ensuring gender parity and formal equality in school, in work and in avenues of political participation.
The greater majority especially among the economically disadvantaged remain at the fringes of political decision making and are compelled by long-standing socio-economic forms of discrimination at home to respond to high demand for lowly paid and dangerous work abroad. Women are disproportionately represented in unpaid work, which means that the price of much of the work they do they is priced zero; with income alone and economic growth as barometers, large numbers will not be accounted for.
Women are not only outnumbered by men in the labor force, but receive comparatively lower wages
40 Ward, Phil. “Population Control and Climate Change, Part One: Too Many People?” March 2, 2008. http://climateandcapitalism.com/?p=348.
Winning the Numbers, Losing the War: The Other MDG Report 2010 69
and are tracked in large numbers into extensions of their social reproduction work at home. Women con-tribute to production all the time but in home-based enterprises and this work is usually unpaid and unac-counted for. As the line between formal and informal work blurs under fl exible labor arrangements, more of women’s unpaid and invisible work is likely to be exploited.
The informal sector has provided women with many ways of earning a living, paving the way for a sense of empowerment in being able to have money of one’s own, to have mobility, to have a say in the household, however limited this may be. However, they also suffer both instability in their livelihoods and insecurity in their persons. In agricultural production, women’s con-tributions are also assumed as free and complementary only to the work that men do.
Various reasons —from economic constraints to narrowing spaces for individual development —draw large numbers of women to cross borders. Many have gained fi nancial security, personal autonomy, positions of decision-making in their households and commu-nities. But for others the costs have been too high. In migration, the intersectional discriminations arising from being a woman, poor, colored and often with little education, are further accentuated.
These impediments to substantive equality are too deep to be effectively addressed by piecemeal and me-chanical approaches to development. Goal 3, towards achieving gender equality and women’s empowerment, is already circumscribed by narrow indicators of gender parity in education, governance and waged work. But the achievement of these targets are dependent on the achievement of the other Goals, many of which are alarmingly off track and behind schedule.
When the Philippine government ratified the CEDAW in 1981, it took upon itself the obligation to mainstream gender and work towards gender equality and women’s empowerment. This was already in place when it signed up with the rest of the world to work towards achievement of the eight MDGs. Five years before the MDGs, the Beijing Platform for Action was also in place. The Philippine government also has obligations under the other core international human rights treaties it has signed. The rights-based approach is inherent in these legally binding instruments but again, the HRBA has not been mainstreamed into the government’s planning, budgeting, implementation and monitoring processes.
Recognition of the structural and systemic in-equalities and inequities, including discriminations stemming from gender, is a crucial fi rst step towards a more dynamic appreciation and implementation of Goal 3. We need to bring these front and center of compliance with Goal 3. We can then build on the gains thus far, not with more measures that contribute too little and too late to improving women’s lives, but with deeper, wider and faster interventions that contribute to the strategic goal of women’s empowerment.
RecommendationsState obligations and enabling analytical and planning frameworks
With the passage of the Magna Carta of Women, the legal framework for the enjoyment of women’s rights has been further strengthened. It also gives added basis for laws, policies, programs and activities to be brought in line with the CEDAW and other core human rights and development commitments, the MDGs included.
A desirable first step that should accompany specifi c efforts to realize Goal 3 is to work towards developing a paradigmatic shift in the country’s devel-opment framework that puts the most marginalized and excluded people at the center. This necessarily entails using gender as a category of analysis in planning, implementation and monitoring. All else should follow, such as reviewing a System of National Accounts that does not take into consideration women’s reproductive labor as material to the economy, much less surfaces women’s contributions, setting aside the necessary resources and engendering budgets and instituting tax reforms that do not further disadvantage women.
The experiences of women in establishing the eco-nomic value of social reproduction can be instructive. For instance, women in some countries like Canada have been able to add parameters in their Census of Population, “[making]… women’s unwaged work visible - numerical, actual, and unavoidable” and allowing it to enter in the design of the country’s national accounts. They were then able to introduce methodologies to calculate the cost of replacing unpaid with paid work and the income that women would have had the opportunity to earn in waged work instead of doing unpaid work. They estimated the replacement value of women’s reproductive labors at 30 – 40 percent of Canada’s GDP in 1992 or around CAN$284.9 billion, and the opportunity value at

70 SOCIAL WATCH PHILIPPINES
CAN$318.8 billion. While they found the rates poor, it made a clear statement that women’s care work is not priced zero.41
Gender analysis should further lead to interro-gating the inequalities and discriminations built into systems, structures and processes at various levels of the economy and society. There are gender biases in economic and political decision making at the macro-, meso-, and micro levels. There are also gender-based distortions at these levels that constrain, even set back women’s education choices, work opportunities, ac-cess to and ownership of land and other resources and entitlements, tax burdens, etc. There are institutional biases (schools, business, government policies and pro-grams, laws) that foster norms discriminatory to women and ultimately impede efforts at gender equality and empowerment. Factors like these ground the many laws Filipino women have won to make their lives better but implementation (or the lack thereof ) reveals how thin awareness and comprehension levels are.
Budgeting for women’s rights: 15 years of the GAD Budget Policy
With one of the smallest allocations in the national budget, the national women’s machinery PCW also taps into the GAD commitments of national agencies and LGUs. However, accessing this—if indeed fi ve percent of agency/LGU budgets are set aside for GAD as mandated – has become more prob-lematic over time. Rampant reports of misalignment and abuse indicate low levels of awareness and understanding of the basis and legal mandate of this policy. The biggest fall was from 2003 when al-location reached Php 4.7 billion or fi ve times its amount in 2002 to less than a billion pesos or Php 951.7 million in 2007. It spiked up to Php 6.5 billion in 2006 but in 2010 dropped to almost the same level as when the policy began to be enforced. Total funds are indeed generally rising but as a share of the national budget, GAD money is shrinking. In all the years of implementation, the GAD budget’s share of the national budget has not gone beyond 0.57 percent42 (see Table 14).
15 years after the landmark 1995 GAA that institu-tionalized gender-responsive budgeting in the country, it is high time the GAD Budget Policy is reviewed in a comprehensive, transparent and participatory manner. The lackluster performance and even outright resistance to its realization are clearly worrisome concerns. Part of the problem could be operationalizing the instruc-tion for agencies to utilize at least 5 percent of their total budget appropriations for GAD-related activi-ties. Francisco wrote of the government’s diffi culty in concretely calculating the cost of services and activities in the PPGD. “Without the necessary computation behind the proportional allocation to GAD, it was easy enough to dismiss the 5 percent benchmark as a political concession that was neither signifi cant nor to be taken seriously.”43
The Policy also has accountability issues, relying only on reporting procedures. This prompted calls is-sued many times in the past to strengthen these with “innovative and more participatory methods of moni-toring and surveillance”44 A Policy Brief released by the Senate Economic Planning Offi ce, noted the same issues, including “weak institutional mechanism[s]” for monitoring. Among their recommendations are monitoring and evaluating the impacts of GAD related programs and projects; setting clear targets and bench-marks; developing even stronger links of coordination, monitoring and evaluation with other agencies. The Commission of Audit has a signifi cant role in conduct-ing a gender budget audit, considering that the PCW does not have the institutional mechanism to audit and evaluate GAD budget compliance, much less enforcing capacity in the case of non-performing agencies.45 With the offi ce of the GAD Ombud now mandated by the Magna Carta of Women, ensuring accountability in full GAD Budget compliance should have greater chances of being realized.
Harmonizing Goal 3: Taking the CEDAW Committee’s concluding comments forward
Measures to realize the MDGs and address the challenges specifi cally on Goal 3 have to be harmonized
41 “Valuing Unpaid Work,” Citing a keynote address given by Evelyn Dresher at the symposium “Counting Women’s Work” of the UN Plat-form for Action Committee (Manitoba) Canada May 1999.
42 Ibid.43 Josefa Francisco, “The GAD Budget Examining Public Financing with a Gender and Poverty Lens.” 2001 Report: Social Watch Philippines,
http://www.socialwatchphilippines.org/publications.htm. 44 Ibid.45 Senate Economic Planning Offi ce, 8.

Winning the Numbers, Losing the War: The Other MDG Report 2010 71
with the government’s other obligations as signatory and state party to the core international human rights treaties and to several development accords. Many of these have their own mechanisms for reporting that often cause various responses to be generated sepa-rately by the different government agencies concerned. Multi-treaty approaches should encourage coherence and generate more holistic interventions to address the multiple and intersectional discriminations in women’s lives.
Bringing Goal 3 in line with the CEDAW, we need to revisit and take account for the concluding com-ments or recommendations of the CEDAW Commit-tee to the Philippine government in 2006. A welcome development is the Philippine government’s cognizance of the need for sex-disaggregated data in truly responsive policy reform. Data on men and women are more read-ily available today from government statistical bodies as well as national agencies, although scrutinizing the
measures used for gender bias remains a relevant con-cern. These should be pursued across all branches and agencies of the government and throughout the local levels where the inadequacy of sex-disaggregated data and statistics has been noted.
Also relevant to monitoring and evaluation are the recommendations of the 2006 NGO Shadow Report for 1) putting in place open, credible and accountable monitoring mechanisms to track results and impacts of the government’s own initiatives and varying measures addressing women’s rights especially social services covering health, education, and infrastructure, which especially affect grassroots, poor communities; and 2) ensuring that gender analysis and social impact assess-ments of the government’s projects on environment and ecological preservation meticulously consider impact on culture and participation of, and the effect on women.47
Other recommendations, however, have yet to be acted upon in substantial and strategic ways. These concern the review and repeal of laws discriminatory to women, the uncertain and dangerous conditions of rural women in the face of trade liberalization, confl ict, and climate change, the high risks faced by migrant women, the persistence of VAW, and most especially, the prevalence of gender-based practices norms and norms that are particularly discriminatory to women. Some of the recommendations pertinent to this paper are excerpted below, with additions from long-standing advocacies of women’s groups and people’s organiza-tions.48 They are by no means a complete list of the steps towards fulfi lling Goal 3.
a. Women’s political participationi. Establish concrete, time-bound and measurable
goals and undertake sustained efforts at putting Tempo-rary Special Measures in place to address the low level of women’s participation in elected and public bodies. The representation of rural, indigenous and Muslim women is particularly stressed.
ii. Give the highest priority to the passage of pending bills ensuring women’s rights such as the reproductive health bill and the anti-sexual discrimi-nation bill.
Table 14. Trends in GAD Budget vis-à-vis National Government Budget (in billion Php)46
Total National
Government Budget
GAD Budget
Allocation
GAD budget as % of NG Budget
1995 372.1 1.0 0.27 1996 416.1 1.3 0.31 1997 491.8 2.8 0.57 1998 537.4 2.7 0.50 1999 293.6 3.4 0.57 2000 682.5 3.2 0.47 2001 710.8 2.9 0.41 2002 742.0 0.8 0.11 2003 826.5 4.7 0.57 2004 867.0 3.9 0.45 2005 947.6 2.2 0.23 2006 1,044.8 1.1 0.11 2007 1,155.5 0.9 0.08 2008 1,314.6 1.1 0.08 2009 1,426.0 6.5 0.46 2010 1,541.0 1.3 0.08
Source: BESF-DBM, NCR; Senate Policy Brief
46 Senate Economic Planning Offi ce, 4. 47 Mae Buenaventura and Maureen Pagaduan, 2006 NGO Shadow Report, (Quezon City, 2006, unpublished).48 Women’s reproductive health rights are discussed in a separate article in this volume. Thus for brevity and considerations of space,
the CEDAW recommendations on women’s health have not been included in this list. For the full text of the Concluding Comments, see http://www.un.org/womenwatch/daw/cedaw/36sess.htm.

72 SOCIAL WATCH PHILIPPINES
b. Women’s economic empowermenti. Study the impacts of trade agreements and at-
tendant labor arrangements on the socio-economic conditions of women, especially the effects of trade liberalization on women in the rural areas.
ii. Create new sustainable employment opportuni-ties to address women’s high unemployment
iii. Eliminate gender discrimination in the formal labor market, such as wage gaps and gender tracking
iv. Enhance the situation of women in the infor-mal economy by ensuring stronger mechanisms and processes of social protection.
v. Review and repeal laws, policies and programs that de-prioritize public expenditures on social services (e.g., automatic appropriations for debt payments) and constrict access to the same (e.g., privatization law for power and water).
c. Rural women49 i. Implement CARP’s guidelines governing gender
equality in agrarian reform, that all qualifi ed women members of the agricultural labor force must be guar-anteed and assured equal rights to ownership of land, equal shares of the farm’s produce, and representation in advisory or appropriate decision-making bodies.
ii. Recognize women farmers as agrarian reform benefi ciaries in their own right, not as spouses of male agrarian reform benefi ciaries.
iii. Implement the issuance of EPs/CLOAs without prejudice to women’s marital status.
iv. Strengthen women’s access to support services especially credit.
v. Educate program implementers on legal gender mandates, gender equality, and women’s rights.
d. Women migrants i. Strengthen bilateral, regional and international
cooperation with countries of origin, transit and des-tination to address traffi cking in women. (The Com-mittee took notice that “…bilateral agreements and memorandums of understanding do not exist with all countries and regions to which Filipino women
migrate and that women workers who migrate to other countries and regions in search of work opportunities through informal channels remain vulnerable to becom-ing victims of various forms of exploitation = violence and traffi cking.)
ii. Adopt holistic approaches, such as measures towards women’s economic empowerment, sus-tainable development, and the generation of “safe and protected jobs for women as a viable economic alternative to migration or unemployment.”
e. VAWi. Increase awareness on all forms of violence
against women, including domestic violence, marital rape and incest, and the unacceptability of all such violence.
ii. Repeal laws and/or amend provisions discrimi-natory to women (e.g., the provision in the Anti -Rape Law of 1997 canceling criminal action and reducing penalties in the event the offended party pardons the crime)
iii. Enhance data collection on various forms of violence (e.g., harmonizing data collection of the DSWD, PNP, NGOs, etc.) and research the prevalence, causes and consequences of domestic violence
iv. Conduct consistent and sustained education and awareness raising on attitudes and stereotypes that discriminate against women. (The Committee stresses these stereotypical norms and views as constituting a “signifi cant impediment to the implementation of the Convention and…a root cause of violence against women, as well as of the disadvantaged position of women in a number of areas, including in all sectors of the labour market and in political and public life.)
f. Women and climate changei. Ensure women’s representation, especially of
grassroots sectors in climate change negotiations and debates.
ii. Conduct participatory gender analysis of climate-stressed and vulnerable groups and impact assessments of climate change responses.
49 Culled from “Pantay ang Karapatan ng Kababaihan at Kalalakihan sa Pagmamay-Ari Ng Lupa.” (n.d.)Position Paper. Pambansang Koali-syon ng mga Kababaihan sa Kanayunan,” (n.d.).

Winning the Numbers, Losing the War: The Other MDG Report 2010 73
References
Asian Development Bank, et. al. Paradox and Promise in the Philippines, A Country Gender As-sessment. Philippines, 2008.
Asian South Pacifi c Bureau of Adult Education. Philippines: Summary Report, Mapping Out Disadvantaged Groups in Education. Philippines, 2007. http://www.aspbae.org/ in-dex.php?option=com_phocadownload&view=category&id=6:edwatch-booklets&Itemid=54 (accessed 13 July 2010).
Bangko Sentral ng Pilipinas. http://www.bsp.gov.ph/publications/tables/2010_05/news-05172010a1.htm (accessed July13, 2010).
Silawal-Giri, Bhavai and Emily Esplen. “Revisiting the GDI and GEM.” Bridge Bulletin 19, August 2007. http://www.mineaction.org/downloads/1/InBrief19_Indicators[1].pdf (accessed June 23, 2010).
Buenaventura, Mae and Maureen Pagaduan, 2006 NGO Shadow Report. Quezon City, 2006, n.p. http://cedaw-seasia.org/philippines_shadow_report.html (accessed June 18, 2010).
Bureau of Labor and Employment Statistics. “2009 Gender Statistics on Labor and Employment. http://www.bles.dole.gov.ph/2009%20Publications/2009%20Gender%20Stat/2009_GenderStat.html (accessed July 26, 2010).
Businessworld Research. “Reported incidence of violence against women rises.” July 21, 2010. http://www.bworldonline.com/Research/economicindicators.php?id=0401 (accessed July 28, 2010).
Center for Migrant Advocacy - Philippines, Inc.. Philippine Migrants Rights Groups’ Written Replies to the List of Issues Relating to the Consideration of the Initial Report of the Philippines. Philippines, March 2009.
Center for Migrant Advocacy. “Statement read by Atty. Cecilia Jimenez of the Geneva Forum for Philippine Concerns, on behalf of its partner Center for Migrants Advocacy Philippines, at the NGO meeting of the UN Committee on the Migrant Workers Convention.” United Nations, Geneva, Switzerland, November 25, 2008.
http://www2.ohchr.org/english/bodies/cmw/docs/ngos/CMAPhilippines10.pdf (accessed May 26, 2010).
“Concluding Comments of the Committee on the Elimination of Discrimination against Women: Philippines.” 36th Session of the Committee on the Elimination of Discrimination against Women, August 7-25, 2006, New York. http://www.un.org/womenwatch/daw/cedaw/36sess.htm. (accessed July 20, 2010).
Ellao, J. A. J. “15 years after death of Flor Contemplacion, OFWs remain vulnerable as ever.” Bulatlat. http://www.bulatlat.com/main/2010/03/21/15-years-after-death-of-fl or-contemplacion-ofws-remain-vulnerable-as-ever/ (accessed May 24, 2010).
“Flor Contemplacion – A Diplomatic Incident.” http://www.capitalpunishmentuk.org/fl or.html (accessed May 25, 2010).
Francisco, Josefa. “The GAD Budget Examining Public Financing with a Gender and Poverty Lens.” 2001 Report: Social Watch Philippines.”http://www.socialwatchphilippines.org/publications.htm (accessed May 30, 2010).
Freedom from Debt Coalition (FDC) and the Youth Against Debt (YAD), “The Neglected Gen-eration,” (n.d.) http://www.fdc.ph/index.php?option=com_docman&task=cat_view&gid=49&&Itemid=89 (accessed June 16, 2010).
Human Development Network, et. al. Philippine Human Development Report 2008/2009. Phil-ippines, 2009. http://hdn.org.ph/2009/05/21/20082009-philippine-human-development-report-2/ (accessed July 4, 2010).
“Is HK becoming another Middle East? Deaths of domestic workers show violence against women and migrants and fl aws in HK migrant policies.” http://www.migrants.net/_resources/_press_releases/03.html (accessed 25 May 2010).
Kwok, A. “Better Migrant Filipinos’ Protection Pushed.” Inquirer.net. September 2009. http://globalnation.inquirer.net/news/breakingnews/view/20091101-233408/Better-Filipino-migrants-protection-pushed (accessed May 20, 2010).
Mata, E. “‘They treated us like commodities.’” Philippine Daily Inquirer. January 15, 2008. http://globalnation.inquirer.net/features/features/view/20080115-112567/They-treated-us-like-commodities (accessed May 25, 2010).
“Millennium Development Goals, Goal 3. Gender Equality and Empowerment.” http://www.undp.org.ph/?link=goal_3 (accessed May 17, 2010).
“NSCB Fact Sheets.” March 1, 2010 (FS-201003-SS2-01). http://www.nscb.gov.ph/factsheet/pdf10/Women_Men_March2010.pdf.
“NSCB Fact Sheets.” March 8, 2007 (FS-200703-SS1-01). http://www.nscb.gov.ph/factsheet/pdf07/FS-200703-SS1-01.pdf (accessed June 29, 2010).
“NSCB Resolution No. 15-Attachment 1.” http://www.nscb.gov.ph/resolutions/2002/15_1.asp (accessed July 24, 2010).
Pambansang Koalisyon ng mga Kababaihan sa Kanayunan. “Pantay ang Karapatan ng Kababaihan at Kalalakihan sa Pagmamay-Ari Ng Lupa.” [Position Paper], (n.d.) http://www.ruralwomen.org.ph/index.php?option=com_content&view=article&id=59:rural-womens-property-rights-in-agrarian-reform&catid=29:agrarian-reform&Itemid=87 (accessed June 19, 2010).
Pascual, C. “Social and economic empowerment of women in the informal economy: impact case study of Sikap Buhay.” ILO Asia-Pacifi c Working Paper Series No.18. International Labour Organization Subregional Offi ce for South-East Asia and the Pacifi c, September 2008. http://www.ilo.org/public/english/ region/asro/manila/publ/pubind.htm (accessed July 25, 2010).
Pambansang Konseho ng Kababaihan sa Kanayunan, (n.d), http://www.ruralwomen.org.ph/index.php?option=com_content&view=category&id=34:gender-and-development&Itemid=78&layout=default (accessed July 6, 2010).
Perman, Sarah with Laurent Duvillier, Natacha David, John Eden et Samuel Grumiau, ed. Natacha David. “Behind the brand names, Working conditions and labour rights in export processing zones.” International Confederation of Free Trade Unions, December 2004. www.icftu.org/www/PDF/EPZreportE.pdf (accessed July 14, 2010).
Philippine Commission of Women. “About Us.” http://www.ncrfw.gov.ph/index.php/ncrfw-profi le (accessed 27 May 2010).
Philippine Commission of Women. GAD Planning and Budgeting: Adding Value to Governance, GAD Budget Policy Compliance Report 2001-2002.” 2002. http://www.ncrfw.gov.ph/index.php/component/content/article/247-gad-planning-and-budgeting-adding-value-to-governance (accessed 30 May 2010).
Philippine Commission on Women. “Statistics on Violence Against Women.” http://www.ncrfw.gov.ph/index.php/statistics-on-fi lipino-women/14-factsheets-on-fi lipino-women/73-

74 SOCIAL WATCH PHILIPPINES
statistics-fs-violence-against-fi lipino-women (accessed July 26, 2010).
Philippine Commission on Women. “Statistics on Filipino Women in Politics and Governance.” http://www.ncrfw.gov.ph/index.php/statistics-on-fi lipino-women/14-factsheets-on-fi lipino-women/72-statistics-fs-fi lipino-women-politics-governance (accessed June 17, 2010).
1987 Philippine Constitution, Article 14, Section 5, (5)“Philippines Fourth Progress Report on the Millennium
Development Goals (MDGs).” Third Draft, July 2010 (n.p.).Philippine Overseas Employment Administration. “Compendium of
OFW Statistics.” http://www.poea.gov.ph/ html/statistics.html (accessed 22 June 2010).
Republic Act 6657, An Act Instituting a Comprehensive Agrarian Reform Program to Promote Social Justice and Industrializing, Providing the Mechanisms for its Implementation and for Other Purposes. Section 40, (5).
Republic Act 9710, Magna Carta of Women. Chapter V, Section 20 (b).
Revised Administrative Code of 1987. Section 26 (2). Senate Economic Planning Offi ce. “Engendering a gender
responsive budget: A look at the GAD Budget policy.” Policy Brief 10, No. 2, March 2010.
http://senate.gov.ph/publications/PB%202010-03%20-%20Engen
dering%20a%20gender%E2%80%90responsive%20budget.pdf (accessed 15 July 2010).
Sibal, J. “Measuring the Informal Sector in the Philippines and the Trends in Asia.” (n.p.) Paper presented at the 10th National Convention on Statistics, October 1-2, 2007, EDSA Shangri-La Hotel, Mandaluyong City sponsored by the NSCB. http://www.nscb.gov.ph/ncs/10thNCS/papers/invited papers/ips-22/ips22-03.pdf (accessed July 12, 2010).
United Nations Educational, Scientifi c and Cultural Organization. Gender and Education for All, The Leap to Equality, Global Monitoring Report 2003/04. France, 2003. http://www.unesco.org/en/efareport/reports/20034-gender/ (accessed 18 July 2010).
UN Platform for Action Committee – Manitoba (UNPAC). “Valuing Unpaid Work,” citing from a keynote address given by Evelyn Dresher at the symposium “Counting Women’s Work” of the UNPAC-Manitoba, Canada May 1999. http://www.unpac.ca/economy/valuingunpaidwork.html (accessed June 17, 2010).
Virola, R. “Violence Against Women…At Home!” http://www.nscb.gov.ph/ head-lines/StatsSpeak/2010/030810_rav_vaw.asp (accessed June 25, 2010)
Ward, P. “Population Control and Climate Change, Part One: Too Many People?” March 2, 2008. http://climateandcapitalism.com/?p=348 (accessed May 28, 2010).

Winning the Numbers, Losing the War: The Other MDG Report 2010 75
From 2010 and beyond:
Children should live past age 5Summary
A ll children have the right to live. The right to life is a fundamental,
non-derogable right that for obvious reasons cannot be suspended in
any circumstance. Millions of Filipino children, however, are denied
this right, falling beyond the severely limited reach of government programs on
immunization, food supplements, infant and young child feeding.
The Philippines counts among many developing countries, where large numbers of children, espe-
cially from economically disadvantaged households and communities, start dying after they are born.
Findings on the infant mortality rate (IMR) and the under-fi ve mortality rate (U5MR) clearly affi rm
the connections between children’s health status and economic position: the poorest areas with the least
access to the basic health needs of the very young also have the highest deaths recorded for every 1,000
infants and children under-fi ve. Ensuring equity could prevent 40 percent of all child deaths, which
occur largely among poor children who are comparatively more exposed to health risks and also have
less access to preventive and curative interventions.
By MAY-I L. FABROS

76 SOCIAL WATCH PHILIPPINES
New policies and programs meant to fast-track progress, such as emergency neonatal care, have yet to show positive impact. With infant and under-fi ve mortality still unac-ceptably high, there is much reason to challenge the govern-ment claims of a high probability of achieving Millennium Development Goal 4. Indicators for MDG 4 on reducing child mortality include both under-fi ve and infant mortal-ity rates, together with the proportion of 1 year-old children immunized against measles. To achieve this goal, and the target of reducing child mortality by two-thirds, there is an urgent need to mount effective and adequate responses.
Status, causes and trendsThe Philippines is one of 68 countries where 97
percent of all neonatal, child and maternal deaths worldwide occur.1 Children born in the Philippines are at a greater risk of dying than those born in other Asian countries..2 Annually 82,000 children under fi ve die in the country.
In 1990, the under-fi ve mortality rate was 80 deaths per 1,000 live births; the goal is to reduce this by two-thirds come 2015. The infant mortality rate and the proportion of 1-year-old children immunized against measles are indicators of the progress in elimi-nating under-fi ve mortality.
Neonatal mortality (NN): the probability of dying within the first month of lifePostneonatal mortality (PNN): the difference between infant and neonatal mortalityInfant mortality (1q0): the probability of dying before the first birthdayUnder-five mortality (5q0): the probability of dying between birth and fifth birthday.All rates are expressed per 1,000 live births
1 State of the World’s Children 2009 report. 2009. United Nations Children’s Fund (UNICEF).2 UNICEF.
Under-fi ve, infant and neonatal mortality rate, and immunization status
Under-fi ve mortality rates (U5MR) in the country decreased by more than half since 1990 (see Figure 1). However, the drastic drop in U5MR only took place from 1990 to 1993, and slowed down soon after. Over-all, the base estimate decreased by only 34 percent to the current estimate of 34 deaths per thousand. This current U5MR (2008), although still way above the current regional average of 22 deaths per 1,000 live births, seems on track towards reaching the target of 26.7 (see Table 1). But a closer look at the data shows risks of reversing the decrease.
Source: 1990 and 1993 National Demographic Survey1998, 2003, 2008 National Demographic Health Survey
MDG4 Indicator (in percent) 1990 1993 1998 2003 2008 2015 Government Assessment
Under-five mortality rate 80 54 48 40 34 26.7 High
Infant mortality rate 57 34 35 29 25 19 High
Proportion of 1 year-old children immunized against measles 78 71 70 76 100 High
Table 1. MDG 4 Indicators Status
Figure 1. Infant and Child Mortality in the Philippines (Per 1,000 live births)
Source: 1990 and 1993 National Demographic Survey; 1998, 2003, 2008 National Demographic Health Survey
Infant mortality, which contributes to almost 70 percent of all under-fi ve deaths, registered the barest improvements over the past two decades. As with U5MR, infant mortality rates (IMR), underwent a sharp decrease from 1990 to 1993, when the rate fell from 57 infant deaths per 1,000 live births to 34. But in 1998, the IMR increased slightly to 35, then slowly declined to 29 in 2003, until it reached 25 deaths in 2008 (see Table 1). The current rate is still high
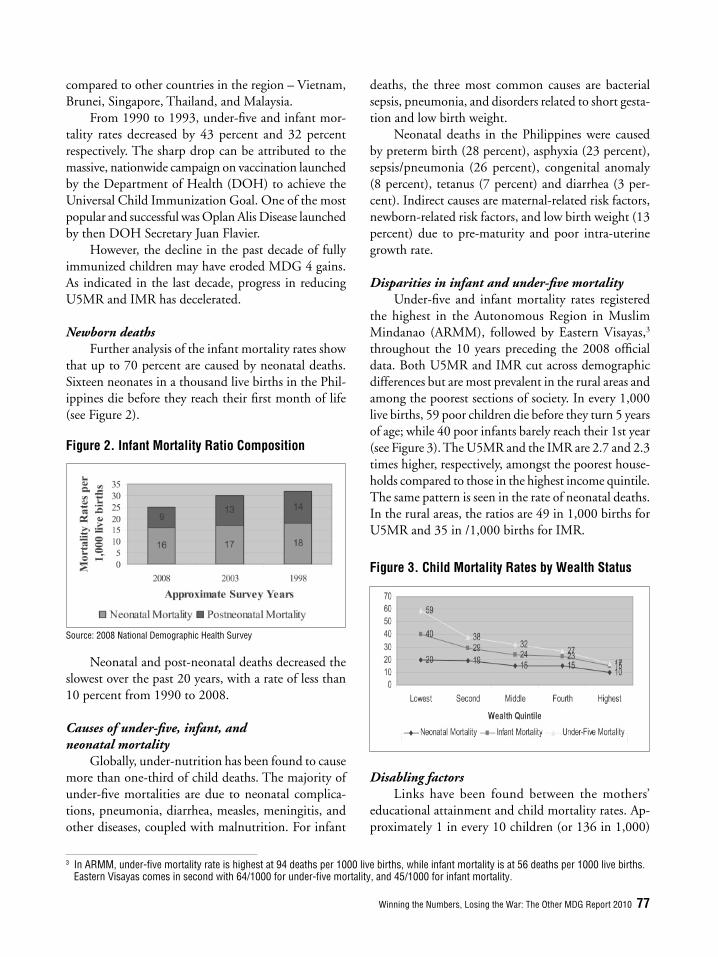
Winning the Numbers, Losing the War: The Other MDG Report 2010 77
compared to other countries in the region – Vietnam, Brunei, Singapore, Thailand, and Malaysia.
From 1990 to 1993, under-fi ve and infant mor-tality rates decreased by 43 percent and 32 percent respectively. The sharp drop can be attributed to the massive, nationwide campaign on vaccination launched by the Department of Health (DOH) to achieve the Universal Child Immunization Goal. One of the most popular and successful was Oplan Alis Disease launched by then DOH Secretary Juan Flavier.
However, the decline in the past decade of fully immunized children may have eroded MDG 4 gains. As indicated in the last decade, progress in reducing U5MR and IMR has decelerated.
Newborn deathsFurther analysis of the infant mortality rates show
that up to 70 percent are caused by neonatal deaths. Sixteen neonates in a thousand live births in the Phil-ippines die before they reach their fi rst month of life (see Figure 2).
Figure 2. Infant Mortality Ratio Composition
Source: 2008 National Demographic Health Survey
Neonatal and post-neonatal deaths decreased the slowest over the past 20 years, with a rate of less than 10 percent from 1990 to 2008.
Causes of under-fi ve, infant, and neonatal mortality
Globally, under-nutrition has been found to cause more than one-third of child deaths. The majority of under-fi ve mortalities are due to neonatal complica-tions, pneumonia, diarrhea, measles, meningitis, and other diseases, coupled with malnutrition. For infant
deaths, the three most common causes are bacterial sepsis, pneumonia, and disorders related to short gesta-tion and low birth weight.
Neonatal deaths in the Philippines were caused by preterm birth (28 percent), asphyxia (23 percent), sepsis/pneumonia (26 percent), congenital anomaly (8 percent), tetanus (7 percent) and diarrhea (3 per-cent). Indirect causes are maternal-related risk factors, newborn-related risk factors, and low birth weight (13 percent) due to pre-maturity and poor intra-uterine growth rate.
Disparities in infant and under-fi ve mortalityUnder-fi ve and infant mortality rates registered
the highest in the Autonomous Region in Muslim Mindanao (ARMM), followed by Eastern Visayas,3 throughout the 10 years preceding the 2008 offi cial data. Both U5MR and IMR cut across demographic differences but are most prevalent in the rural areas and among the poorest sections of society. In every 1,000 live births, 59 poor children die before they turn 5 years of age; while 40 poor infants barely reach their 1st year (see Figure 3). The U5MR and the IMR are 2.7 and 2.3 times higher, respectively, amongst the poorest house-holds compared to those in the highest income quintile. The same pattern is seen in the rate of neonatal deaths. In the rural areas, the ratios are 49 in 1,000 births for U5MR and 35 in /1,000 births for IMR.
Figure 3. Child Mortality Rates by Wealth Status
Disabling factorsLinks have been found between the mothers’
educational attainment and child mortality rates. Ap-proximately 1 in every 10 children (or 136 in 1,000)
3 In ARMM, under-fi ve mortality rate is highest at 94 deaths per 1000 live births, while infant mortality is at 56 deaths per 1000 live births. Eastern Visayas comes in second with 64/1000 for under-fi ve mortality, and 45/1000 for infant mortality.
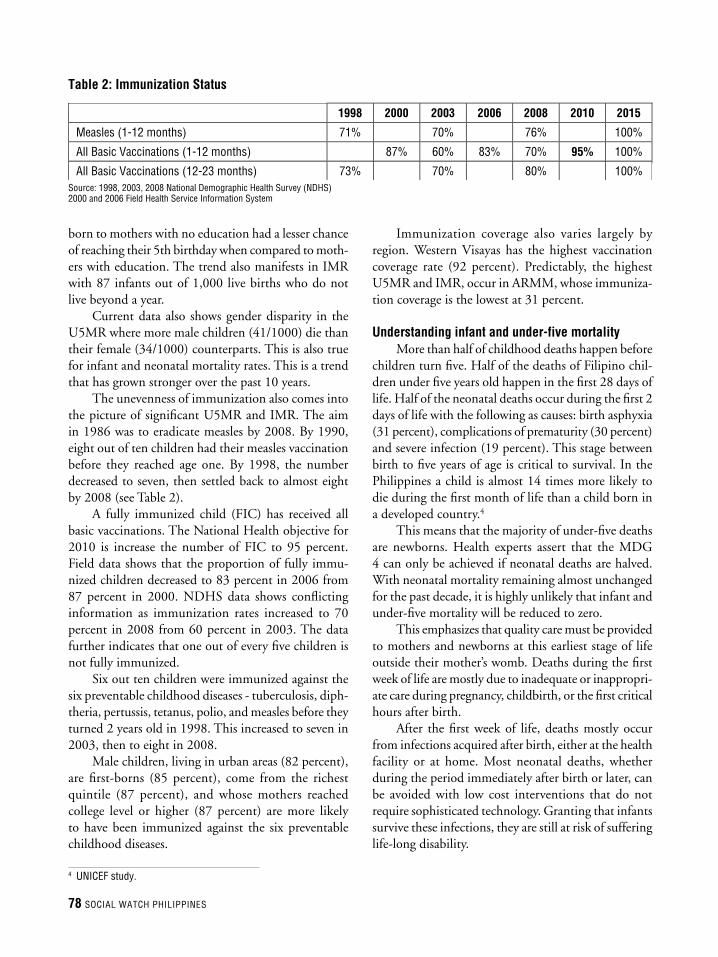
78 SOCIAL WATCH PHILIPPINES
born to mothers with no education had a lesser chance of reaching their 5th birthday when compared to moth-ers with education. The trend also manifests in IMR with 87 infants out of 1,000 live births who do not live beyond a year.
Current data also shows gender disparity in the U5MR where more male children (41/1000) die than their female (34/1000) counterparts. This is also true for infant and neonatal mortality rates. This is a trend that has grown stronger over the past 10 years.
The unevenness of immunization also comes into the picture of signifi cant U5MR and IMR. The aim in 1986 was to eradicate measles by 2008. By 1990, eight out of ten children had their measles vaccination before they reached age one. By 1998, the number decreased to seven, then settled back to almost eight by 2008 (see Table 2).
A fully immunized child (FIC) has received all basic vaccinations. The National Health objective for 2010 is increase the number of FIC to 95 percent. Field data shows that the proportion of fully immu-nized children decreased to 83 percent in 2006 from 87 percent in 2000. NDHS data shows confl icting information as immunization rates increased to 70 percent in 2008 from 60 percent in 2003. The data further indicates that one out of every fi ve children is not fully immunized.
Six out ten children were immunized against the six preventable childhood diseases - tuberculosis, diph-theria, pertussis, tetanus, polio, and measles before they turned 2 years old in 1998. This increased to seven in 2003, then to eight in 2008.
Male children, living in urban areas (82 percent), are fi rst-borns (85 percent), come from the richest quintile (87 percent), and whose mothers reached college level or higher (87 percent) are more likely to have been immunized against the six preventable childhood diseases.
Table 2: Immunization Status
1998 2000 2003 2006 2008 2010 2015
Measles (1-12 months) 71% 70% 76% 100%
All Basic Vaccinations (1-12 months) 87% 60% 83% 70% 95% 100%
All Basic Vaccinations (12-23 months) 73% 70% 80% 100% Source: 1998, 2003, 2008 National Demographic Health Survey (NDHS)2000 and 2006 Field Health Service Information System
Immunization coverage also varies largely by region. Western Visayas has the highest vaccination coverage rate (92 percent). Predictably, the highest U5MR and IMR, occur in ARMM, whose immuniza-tion coverage is the lowest at 31 percent.
Understanding infant and under-five mortalityMore than half of childhood deaths happen before
children turn fi ve. Half of the deaths of Filipino chil-dren under fi ve years old happen in the fi rst 28 days of life. Half of the neonatal deaths occur during the fi rst 2 days of life with the following as causes: birth asphyxia (31 percent), complications of prematurity (30 percent) and severe infection (19 percent). This stage between birth to fi ve years of age is critical to survival. In the Philippines a child is almost 14 times more likely to die during the fi rst month of life than a child born in a developed country.4
This means that the majority of under-fi ve deaths are newborns. Health experts assert that the MDG 4 can only be achieved if neonatal deaths are halved. With neonatal mortality remaining almost unchanged for the past decade, it is highly unlikely that infant and under-fi ve mortality will be reduced to zero.
This emphasizes that quality care must be provided to mothers and newborns at this earliest stage of life outside their mother’s womb. Deaths during the fi rst week of life are mostly due to inadequate or inappropri-ate care during pregnancy, childbirth, or the fi rst critical hours after birth.
After the fi rst week of life, deaths mostly occur from infections acquired after birth, either at the health facility or at home. Most neonatal deaths, whether during the period immediately after birth or later, can be avoided with low cost interventions that do not require sophisticated technology. Granting that infants survive these infections, they are still at risk of suffering life-long disability.
4 UNICEF study.

Winning the Numbers, Losing the War: The Other MDG Report 2010 79
Infant and under-fi ve malnutrition increases threats to children’s survival beyond fi ve years
For the past decade, a signifi cant percentage of 0-5 year old children have remained malnourished. The proportion of underweight, stunted and wasted preschool children5 decreased slightly from 1998 to 2008. At present, 26 out of every 100 preschoolers are underweight; 28 out of every 100 are stunted or have lower height than that of normal; and 6 out of every 100 are wasted or thin (see Table 3).
Table 3. Malnutrition Status of Children 0-59 months old
5 Underweight - A condition in which the child’s weight is less than that of normal children of the same age and is measured using weight-for-age as indicator.
Stunted - A condition in which the child’s height is less than that of normal children of the same age and is measured using height-for-age as indicator.
Wasted - A condition in which the child’s weight is less than that of normal children of the same height and is measured using weight -for-height as indicator.
* Based on the Food and Nutrition (FNRI)-PPS standards.
0-59 months 1998 2003 2008
Underweight 38% 28% 26%
Stunted 32% 30% 28%
Wasted 6.9% 5.5% 6.0%
Overweight 1.4% 2%
Anemia at 6-11 months 57% 66%
Anemia at 12-24 months 53% Source: 1998, 2003, and 2008 National Nutrition Survey
From 2003-2005, the number of underweight children decreased by 1.1 percent annually, however, from 2005 to 2008 there was signifi cant increase in underweight (24.6 percent to 26.2 percent) and stunted (26.3 percent to 27.9 percent) preschoolers. The level of stunted children translates to about 3.1 million preschoolers.
The prevalence of overweight and obese children increased in the last decade. Obesity shows another face of malnutrition with children and adults suffering from under-nutrition but with excessive weight gain.
The prevalence of anemia among infants from six months to less than one year has increased throughout the years. From 57 in every 100 infants in 1998, it has risen to 66 in every 100 infants in 2003. Iron defi ciency anemia leads to short attention spans and ultimately impacts on the child’s ability to learn.
In addition, the prevalence of Vitamin A defi -ciency disorders (VADD) among children 6 months
to 5 years of age increased from 35.3 percent in 1993 to 40.1 percent in 2003. It is important to note that the prevalence of VADD weakens the immune system and increases a child’s risk of dying from diarrhea and measles by 20-24 percent.
Data also confi rms the positive correlation of birth weight and child mortality. The healthier and less underweight children are, the lesser the chances for early death.
Regional disparities further provide evidence of these links. The top 10 poorest regions in the country such as ARMM, Eastern Visayas, and Bicol where health services are lacking, inaccessible and/or barely accessed, are also where U5MR and IMR are the high-est. They are also the most food-insecure regions, and as a consequence, children are more undernourished compared to others. The National Nutrition Council (NNC) confi rms that under-nutrition is more pro-nounced in Visayas and Mindanao.
Regions with relatively better indicators for children’s health and mortality are not without areas of high vulnerability. Anecdotal information repeatedly cites the desperate practice of ‘pag-pag’ - scavenging through the garbage of fast food chains to fi nd any-thing edible.
Based on the results of the Food Insecurity and Vulnerability Information and Mapping Systems (FIVIMS) under the NNC, food insecurity in the Philippines emerged as most intense in ARMM and prevalent as well in varying degrees across 49 provinces (see Table 4).
Malnutrition has intergenerational effects The health and nutrition of women during pre-
pregnancy signifi cantly affects the level of vulnerability to maternal mortality, the chances of fetal development, and the survival, growth and development after birth. Fetal life development has profound and irreversible effects on a child’s brain development and mental capacity.
Women’s under-nutrition during pre-pregnancy, pregnancy and childbirth is linked with deliveries of

80 SOCIAL WATCH PHILIPPINES
Table 5. Malnutrition in Pregnant and Lactating Women
small, low birth weight babies who are likely to end up malnourished as well. Well-nourished and healthy women, on the other hand, who received adequate nutrients before and during pregnancy delivered healthy babies. From 2005 to 2008, the National Nutrition Survey indicated a 1.7 percentage point rise in the proportion of nutritionally at-risk pregnant women (see Table 5).
Birth weight is an important indicator of a new-born’s health status. Babies born with low birth weight6 generally have higher rates of morbidity and mortality. A decrease in the proportion of births with low birth weight contributes to reducing child mortality.
As shown above, the intimate link between the mother and her child affects a newborn’s chance for
Table 4. List of Nutritionally Vulnerable Regions (FIVIMS, 2004)
Source: NNC 2006 Briefi ng Kit; www.nnc.gov.ph
CLUSTER 3 Vulnerable
Region 1 La Union
CAR Abra Ifugao Mountain Province
CALABARZON Quezon
MIMAROPA Marinduque Occidental Mindoro Palawan Romblon
Region 5 Albay Camarines Norte Camarines Sur Catanduanes Sorsogon
Region 6 Aklan Antique Iloilo Negros Occidental
Region 7 Bohol
Region 8 Leyte Eastern Samar Northern Samar Samar Southern Leyte
Region 9 Zamboanga del Sur
Region 10 Camiguin Misamis Occidental Lanao del Norte
Region 11 Davao del Norte Davao del Sur
Region 12 Cotabato Sarangani South Cotabato Sultan Kudarat
CARAGA Agusan del Norte Agusan del Sur Surigao del Norte Surigao del Sur
CLUSTER 4 (Very Vulnerable)
CAR Apayao
Region 6 Capiz
Region 7 Negros Oriental
Region 9 Zamboanga del Norte
Region 10 Bukidnon
ARMM Lanao del Sur Maguindanao Basilan
CLUSTER 5 (Very, Very Vulnerable)
Region 5 Masbate
ARMM Sulu Tawi-Tawi
6 Babies weighing less than 2.5 kilograms at birth are categorized among those with low birth weights.
2003 2005 2008
Underweight Pregnant Women 27%
Underweight Lactating Women 11% 14% 13%
survival and health. Though there are several seem-ingly indirect factors that affect newborns, the most important of these are maternal conditions that pose risks to the infant: the mother’s age at fi rst pregnancy (greater risk before 20 years or after 35 years of age)
Source: 2003, 2005, and 2008 National Nutrition Survey

Winning the Numbers, Losing the War: The Other MDG Report 2010 81
(see Figure 4), child spacing (less than 3 years since last birth), the mother’s poor nutritional status and history of illness.
Government policy, programs, and servicesIn the past 10 years, the Department of Health
(DOH) implemented various health interventions to combat infant and under-fi ve mortality. These include improving infant and young child feeding practices (e.g., breastfeeding and complementary feeding from six months onwards, providing immunization and food supplements, and ensuring neonatal and maternal care.
Infant and young child feeding practicesThe National Policy and Plan of Action on Infant
and Young Child Feeding (IYCF) (2005-2010) was a breakthrough in child health initiatives with breastfeed-ing as the core campaign. The plan centers on ensuring and strengthening the implementation of existing poli-cies on breastfeeding, revitalizing nationwide advocacy and campaigns, and introducing breastfeeding comple-mentary feeding practices.
The IYCF also pushes for measures that would en-able working mothers to continue breastfeeding. In line with this, and facilitated with DOH’s help, a coalition was established to monitor the implementation of the Milk Code as well as the other breastfeeding policies. It counteracts the persistent moves of milk companies to push their products, which could potentially derail breastfeeding campaigns.
BreastfeedingA number of breastfeeding policies and programs
are in place: (a) the Mother Baby Friendly Hospital Ini-tiative, mandating all hospitals to fully protect, promote and support breastfeeding and rooming-in practices; b)
Figure 4. Infant and Under-fi ve Mortality according to Mother’s Age
the Milk Code (Executive Order No. 51), promoting and protecting breastfeeding by prohibiting the market-ing and provision of breast milk supplements and sub-stitutes in health facilities, as well as ensuring the proper use these substitutes through adequate information; and c) the Rooming-In and Breastfeeding Act (Republic Act 7600), ensuring a conducive breastfeeding environment upon birth. This enabling policy environment has led to the establishment of breastfeeding-friendly settings: workplace, health facilities, public places (i.e. shopping malls) and within communities.
Despite the proliferation of policies on breast-feeding, breastfeeding prevalence has not signifi cantly gained ground. Worse, exclusive breastfeeding de-creased from 37% in 1998 to 34% in 2003, then remained at 34 percent up to the present (see Table 6). Exclusive breastfeeding still falls signifi cantly below the government target of 80 percent. Exclusive breastfeed-ing of infants up to six months maximizes the benefi ts of immunity and nutrition. Improving breastfeeding and complementary feeding of Filipino infants and young children could prevent 16,000 deaths, primar-ily from diarrhea, pneumonia, neonatal sepsis and hypothermia.
Table 6. Breastfeeding Prevalence
Source: 1998, 2003, and 2008 National Demographic Health Survey
1998 2003 2008
Breastfed 88% 87% 88%
Exclusive Breastfeeding of children aged 4-5 months 37% 34% 34%
In 2003, only 16 percent of newborns were exclu-sively breastfed for four to fi ve months of age, while 13 percent were never breastfed at all. Data for 2008 shows a slight decrease in non-breastfed children which was down to 12 percent.
Supplementation of breastfeeding with other liquids and foods occurs too early. Among infants less than six months old, almost a third (30 percent) were found to have been given water, other liquids and food in addition to breast milk. Offi cial 2003 data also shows that 4 out of every 10 infants were fed formula milk.
Because breastmilk is more readily accessible and requires no fi nancial costs, it is more prevalent amongst women who live in rural areas (92 percent), with no education (92 percent), of the poorest quintile (94

82 SOCIAL WATCH PHILIPPINES
percent), who gave birth at home (91 percent) and were assisted by a hilot, a traditional birthing attendant (92 percent). It is in the poorest and least developed regions such as Bicol and the Cordillera Administrative Region where children are more likely to be breastfed (95 and 94 percent, respectively). Children from the more urbanized regions such as CALABARZON and NCR exhibited less breastfeeding prevalence at 77 percent and 80 percent, respectively.
High IMR and U5MR in the rural areas, however, stress the need to ensure other basic health requirements in the more disadvantaged regions such as easily acces-sible public health facilities and services and nutrition programs, to maximize and sustain the benefi ts from breastfeeding.
Causes of non-breastfeedingDespite the well-documented benefi ts of breast-
feeding, more privileged women living in urban areas and who have closer access to health delivery services are not practicing breastfeeding. This scenario may be a consequence of more women joining formal waged production and exercising greater autonomy and choice. Breastfeeding can also be daunting in work environments that are male-dominated and insensi-tive to gender-differentiated needs, such as those of lactating women. The rampant and aggressive adver-tising of formula milk promising healthier, smarter and happier children also have a dampening effect on breastfeeding.
The effects of sexism in culture, such as the objec-tifi cation of women’s breasts in media and advertising as solely for (men’s) pleasure cannot be discounted. Using the breast as a source of milk may not be perceived as glamorous and, in effect unconsciously associated with poverty.
Complementary feedingChildren’s physiological and behavioral develop-
ment are at a critical stage from birth to two years of age. For their needs to be met, it is recommended that children be exclusively breastfed from birth to six months of age, and that complementary foods should only be introduced at six months of age. Frequent and on-demand breastfeeding should be continued until the child reaches the age of two years or beyond. As the child gets older and/or is no longer breastfed, the amount and variety of complementary foods should gradually increase.
Between 1998 and 2008, 55 percent of children ages 6-23 months were found to have been fed accord-ing to the recommended IYCF practices. Nearly all children of age 6-23 months (95 percent) were breastfed or given milk products, 4 out of 5 were given the rec-ommended number of food groups (79 percent), while 7 out of 10 were fed at least the minimum number of times per day (65 percent).
Breastfed children were more likely than non-breastfed children to be fed according to the recom-mended IYCF practices in terms of frequency of feeding. Four out of every fi ve (81 percent) breastfed children age 6-23 months were fed at least the mini-mum number of times per day, compared with 48 percent of non-breastfed children.
Feeding the recommended number of food groups is the same for both breastfed and non-breastfed chil-dren; 79 percent of both breastfed and non-breastfed children received the recommended number of food groups (that is, three or more food groups for breastfed children and four or more food groups for non-breast-fed children).
For breastfed children, adherence to appropriate feeding practices does not vary by urban-rural residence and mother’s education, but it does vary by wealth quintile, with children in wealthier households (middle to highest quintiles) receiving more appropriate feeding than children in poorer households (lowest and second quintiles).
Among non-breastfed children, those living in urban areas, whose mothers attended college, and belong to wealthier households, were more likely to receive appropriate feeding than other non-breastfed children. This directly correlates children’s health with economic status.
Certainly, households can be informed about nutritious food they can prepare at minimal costs. However, nutritious food alone does not a healthy child make. Children of wealthier households also have more access to other essentials such as immu-nization and regular check-ups by health practitio-ners, not to mention having been born to mothers with possibly less physically taxing livelihoods and most likely, more resources to spend on their general well-being. The issues involved are also too complex and linked with other socio-cultural and economic factors to be simply addressed with pro-viding information on more affordable and healthy food alternatives.

Winning the Numbers, Losing the War: The Other MDG Report 2010 83
Instant, comfort, and status foodsFaster-paced lifestyles and choices constrained by
fi nancial limitations are only some of the factors for the tendency of Filipino households to consume more instant, comfort, and/or status types of food such as preservative-laden noodles and canned goods. Early exposure to so called “junk food” and “fast foods” in-still bad eating habits at a young age, which children carry into their adult years. Aggressive and unregulated marketing, claiming health benefi ts of these processed foods, further fuels the drive for their consumption. It does not help that the government agencies themselves resort to mass dissemination of processed food among impoverished communities, especially in the aftermath of disaster events.
Micronutrient supplementation programThe micronutrient supplementation program of
the DOH contributes to reducing IMR and U5MR through measures aimed at preventing and control-ling micronutrient defi ciencies. This targets children from poorer households who do not have access to nutritious food.
To decrease child and maternal mortality, the DOH adopted a life cycle approach in public health. DOH programs now attend to the needs from concep-tion until death.
The micronutrient supplementation program focuses on VADD and iron defi ciency anemia for both infants and their mothers. The trend in the distribution of vitamin A supplements to children has barely moved. In 1998, 72 percent of children under fi ve years of age received supplements. There was a small increase to 76 percent in 2003 after which there has been no further improvement – also 76% in 2008.
Expanded program on immunizationThe expanded program on immunization (EPI)
and micronutrient supplementation adds to the various programs currently being implemented to contribute to reducing child mortality. The EPI aims to achieve universal immunization against seven common child-hood diseases: tuberculosis, poliomyelitis, diphtheria, pertussiss, tetanus, measles, and hepatitis B. Measles in particular, was targeted with the 1998 launch by the DOH of the Measles Elimination Campaign.
Although in place since 1979, EPI has not achieved the goal of universal coverage. This was a commitment made in 1986 when the country adopted
the Universal Child Immunization Goal, and vowed to (a) insure Full Immunized Child coverage of at least 90 percent in all provinces and cities; (b) eliminate measles by 2008; and (c) eliminate neonatal tetanus in the same year.
The data shows the inability of the EPI and mi-cronutrient program to provide vaccination and food supplements to all children. For more than a decade, over 30 percent of children were not immunized and did not receive supplements. This number has more or less remained the same, which means that a substantial number of children grow up unprotected from deadly childhood illnesses. These children who missed out on life-saving vaccinations and supplements may be the very children in child mortality fi gures, as both rates remained the same. In both programs of immunization and micro-nutrient supplementation, the higher the coverage, the lower the number of deaths among children.
Maternal, neonatal, child health, and nutrition After years of planning, the DOH implemented
the Maternal, Neonatal and Child Health and Nutri-tion (MNCHN) strategy in 2008 with the aim of rapidly reducing high maternal and child mortality rates. The MNCHN strategy institutes child survival strategies, delivery service packages, and continuum care across the life cycle stages. From various stakehold-ers coming together, women’s health teams have been created to expedite referrals, transportation and access to emergency obstetric care. More importantly, the MNCHN strategy addresses the stumbling blocks in increasing the modern contraceptive prevalence rate; antenatal care visits (at least four); skilled birth atten-dance and facility-based births; and the prevalence of fully immunized children.
The gradual transformation of health care facili-ties to provide emergency obstetric and neonatal care, benefi t both mothers and newborns that face birth complications. The absence of this service is known to increase the risk of mortality.
Focus on newbornsRenewed focus on neonatal health and mortality,
alongside implementation of the MNCHN strategy shows the DOH’s commitment to reducing child and maternal mortality.
Alarming data on neonatal mortality prompted the DOH to enact the Essential Newborn Care (ENC) pro-tocol. Complementing the MNCHN strategy, the ENC

84 SOCIAL WATCH PHILIPPINES
protocol is another comprehensive strategy seeking to improve the health of the newborn through interven-tions before and after delivery. A manual guiding the health workers and medical practitioners in providing evidence-based essential newborn care gives particular focus on the fi rst few hours of life of the newborn.
The protocol guidelines categorize procedures into time-bound, non time-bound and unnecessary procedures. Time bound interventions should be rou-tinely performed fi rst. They include immediate drying, skin-to-skin contact followed by clamping of the cord after 1 to 3 minutes, non-separation of the newborn from the mother and breastfeeding initiation. Non time-bound interventions range from immunizations, eye care, Vitamin K administration, weighing and washing. The protocol also highlights unnecessary, but commonly practiced, procedures such as routine suctioning, routine separation from mothers of new-borns for observation, administration of prelacteals like glucose water or formula, and footprinting.
Analyzing government initiativesFour presidents – Aquino, Ramos, Estrada and
Macapagal-Arroyo - had the power, the mandate, and the opportunity to eradicate under-fi ve and infant deaths from 1990 to 2008. Public spending, however, showed no prioritization for health needs. National budgets consis-tently allocated minuscule amounts for the health sector. In the past 20 years, various campaigns on immunization, supplements and other child health interventions were also initiated, but with short-lived success and impact.
Only those with money (i.e., the rich) can fully pay for out-of -pocket payments and often they have generous health insurance. The near-poor and the lower middle classes can become impoverished to meet out–of-pocket payments for health care. (But) the very poor don’t even have pockets.
— Dr. Alberto Romualdez, Former Secretary of the Department of Health, and Dean, Graduate School of Health Sciences
Pamantasan ng Lungsod ng Maynila
Health fi nancingThe health budget has always been too low to pro-
vide universal quality health coverage and allow access by the whole population. Even with the Millennium Development Goals mainstreamed into the Medium Term Philippine Development Plan, the appropriations for health have remained severely inadequate.
The child health programs as well as the MNCHN all fall under public health. Public health services tend to deteriorate with chronic budget defi cits and the decline in government spending. From 1998-2010, the DOH share in the total national government spending decreased from 79 percent in 1998-2005 to 69 percent in 2006-2010.
In terms of GDP share, the DOH expenditure dropped signifi cantly from 0.41 percent of GDP in 1998 to 0.17 percent in 2006 then rose slightly to 0.19 percent of GDP in 2007-2008. From recent data, it is now at 0.30 percent (2009-2010), though this is still below the international health fi nancing standard of 5 percent of GDP. What is worrisome is that throughout the last decade, allocations for health did not improve at all.
The minimal resources of the DOH are further divided into four groups – policy advice, regulatory services, public health and hospital services. From 1998 to 2008, allocations for hospitals amounted to 60-70 percent of the DOH budget, while public health only received 10-20 percent. Increases in the last two years brought the public health budget to 31 percent, close to the 39 percent allocation to hospitals. This renewed priority given to public health may be due to the in-creasing urgency to meet the fi nancial requirements necessary to achieve the MDGs for health.
Resources allocated to the MDGs have been low from the very beginning. This decade-long drought on resources for achieving the MDGs particularly on health has widened the gap, making the targets even more diffi cult to reach in the remaining fi ve years before the 2015 deadline. The resource gap based on the “low cost” assumption on key public health interventions is estimated as follows (see Table 7):
• Php 15.5 billion for 2011 (0.17 percent of GDP or 63 percent of the DOH budget for 2010)
• Php 5.3 billion for 2012 (0.06 percent of GDP or 21 percent of the DOH budget 2010)
• Php 6.4 billion for 2013 (0.06 percent of GDP or 26 percent of the DOH budget for 2010)
However, the new direction of the DOH address-ing maternal and neonatal mortality through the imple-mentation of the MNCHN policy offers new hope. Implemented only in 2008, the policy involves comple-tion of the basic and the comprehensive emergency care units within the next 2 – 3 years, with positive impacts expected to surface in the next 5-10 years.

Winning the Numbers, Losing the War: The Other MDG Report 2010 85
Table 7. Low Cost Resource Gap Assumption on Health (in million pesos)
Low cost resource gap assumption 2010 2011 2012 2013 2014 2015
Expanded Program on Immunization: increase from 91% in 2010 to 95% in 2015
445 476 509 544 582 622
Micronutrient Supplementation: 100% coverage 85.0 88.1 91.2 94.4 97.6 100.8
BEmONC/CEmONC training 32.9 34.2 35.6 14.0 14.5 15.1
BEmONC/CEmONC facilities upgrading: 100% of deliveries are facility-based 6,975.0 6,975.0
Total Public Health interventions 3,006.7 15,466.2 5,270.2 6,421.9 6,175.0 6,043.1Source: 2010 DOH Multi-Year Spending Plan
These estimates project some improvement in the implementation of the delivery of public health services by avoiding wastage of resources. They also show at-tempts at pro-poor targeting in the delivery of several public health programs (namely, through micronutrient supplementation, reproductive health and management of children’s illnesses). Non-poor households will have to self-fi nance these services. Estimates for the Basic Emergency Obstetric and Neonatal Care (BEmONC) and Comprehensive Emergency Obstetric and Neona-tal Care (CEmONC) services further seem to assume that instead of just one year (2010), the upgrading of identifi ed facilities and the training of personnel in these facilities will be staggered over two years (2011 and 2012).
Conclusions and RecommendationsIn the Philippines, children lose out by default
to enjoying the non-derogable right to life because of unmet state obligations already subscribed to, even be-fore the MDGs, notably the International Convention on the Rights of the Child. That this right is restricted for Filipino children of economically marginalized households and communities makes the gap even more marked.
Interventions to reduce the IMR and the U5MR suffer further from want of making tight links with neonatal and maternal conditions. Newborn survival is inextricably linked to the health of the mother. No-where is this more evident than an even higher risk of death to newborns and infants whose mothers die in childbirth. Glaring inadequacies in women’s reproduc-tive health requirements should thus be a pre-requisite to carrying out any interventions aimed at reducing mortality among infants and children.
Signifi cant amounts of time, resources and op-portunities have already gone into attempts over the last decade to achieve MDG4, but there remains much ground to cover in the few remaining years before the 2015 deadline. Were the existing programs fully imple-mented and made accessible to the most marginalized and excluded, progress would be felt by those who need it the most.
The rise of Benigno Aquino III to the presidency has raised hopes among people of concrete improve-ments in their lives. Among his promises are the provi-sion of universal health care within three years’ time and the reform of the health insurance system to achieve universal coverage. Guaranteeing adequate resources for health would be a concrete, and urgently needed step in this direction, along with ensuring more effi cient and responsive ways of implementing the following in the next fi ve years:
1. Universalizing the coverage of existing immu-nization, food supplement, infant and young child feeding programs;
2. Ensuring enforcement of breastfeeding laws on marketing and rooming-in;
3. Increasing the public health budget to meet the global standard of fi ve percent of GDP, and securing resources for fi lling the gaps in the implementation of emergency obstetric care services and facilities;
4. Funding and implementing the development of a health demographic standard to monitor and document infant and child morbidity and mortality among Muslim populations, indigenous peoples, youth and adolescent, and other high risk sectors, to come up with well-targeted policies and programs; and,

86 SOCIAL WATCH PHILIPPINES
5. Revamping the health insurance system to ensure universal health coverage, reduce out-of-pocket health expenses, and to institute a progressive payment system subsidizing the less economically advantaged in society.
A critical key to achieving these is ensuring fi nanc-ing and other forms of resources for health. If debt repayments continue to be the top priority of public spending, the government is at the onset already bound to fail in fulfi lling its commitment to the international health standard of allotting fi ve percent of GDP to health. The MDGs, with MDG 4 in particular, would add to an already growing list of unfunded mandates that at best enhance the policy and legal environment for development goals but do little to improve people’s lives on the ground.
Seeking well-resourced mandates has gained more urgency in the light of new obstacles in reducing child
mortality. Disasters triggered by climate change deepen pre-existing inequitable conditions, thereby increas-ing the intensity of adverse impacts on the health and well-being of the vulnerable and marginalized, such as women and children.
References
DOH. 2010. Multi-Year Spending Plan.
Field Health Service Information System. 2000 and 2006.
National Demographic Health Survey. 1998, 2003, and 2008
National Demographic Survey. 1990 and 1993.
NNC. 2006. Briefi ng Kit. www.nnc.gov.ph.
National Nutrition Survey. 1998, 2003, and 2008.
Romualdez, A. Former Secretary of the Department of Health, and Dean, Graduate School of Health Sciences Pamantasan ng Lungsod ng Maynila.
UNICEF. 2009. State of the World’s Children 2009 report. United Nations Children’s Fund.

Winning the Numbers, Losing the War: The Other MDG Report 2010 87
Improve Maternal Health:
A move towards universalizing health care
Summary
T here is a movement in numbers but too insignifi cant. Pregnant women
continue to die of preventable causes.
The most vulnerable women have been identifi ed over the past
years. We know where they are. Their regions down to their provinces have been
located. Approaches and strategies have been thought out and the technology to
prevent maternal death is known to all the medical and economic technocrats working on this. So
why is there no dramatic decline in mortality rates? Where are the women? Why don’t we hear their
outrage?
By MERCEDES FABROS

88 SOCIAL WATCH PHILIPPINES
Universalizing health careAs we ponder on our assessment, an interesting
development has been the inclusion of universal health care as a priority agenda of our new President Benigno S. (Noynoy) Aquino. It is an opportune time for us women, and all stakeholders, to face the challenge and make sure that the new administration seriously pursues the agenda. High maternal mortality is symptomatic of a weak and inequitable health system.
Enduring features of the health landscape
Health and life are so inextricably linked that these rights have been recognized and enshrined in the Philip-pine Constitution and in all human rights conventions. Notwithstanding this recognition, government support and investment in health have been, for the most part, negligible, most notably in the past decade. Hence, prac-tically more than half of the total health costs have been out-of-pocket expenditures.
Realities paint a dismal landscape of the health situa-tion in our country, and point to inequity as the enduring problem of the health system: inequities in access to and availment of health care services which result in grossly unequal health outcomes. The rich have longer life expec-tancies, have fewer children, and have greater chances of surviving illness and disease, while the poor have shorter life spans, beget more children than they wish, and can hardly cope with the high cost of services. For them, getting sick is tantamount to a catastrophic event, which further sinks them into poverty.
Such disparities are refl ected in all aspects of the health system: fragmented health services, mal-distribution of health facilities and workforce, low public fi nancing and high out-of-pocket payments, low salaries of health per-sonnel, and highly specialized medical training vis-à-vis inadequate primary health care.
To address these inequities, recommendations to reform the health system are directed towards Universal Health Care (UHC). Universalizing health care is a major step in addressing and sustaining efforts of reduc-ing maternal mortality. This will ensure that no one is left behind.
However, transforming the health system through UHC will have to equally join hands with addressing the root causes of poverty and women’s discrimination and subordination. Otherwise, universal health care will only be a bottomless pit.
Status and trend of MDG 5: ten years of accumulated failure
After ten years, of the eight goals that the Philip-pines committed to achieve by 2015, the Millennium Development Goal 5 (MDG 5): Improving Maternal Health remains to be the least likely to be met (see Table 1).
The MDG 5 indicators - maternal mortality ratio (MMR) and proportion of births attended by skilled health personnel - have either stagnated over the past decade or have incrementally increased but are still too insignificant to achieve the 2015 target.
Table 1: MDG 5 Indicators Achievement Status
Source: 1993 National Demographic Survey; 2006 Family Planning Survey;1998, 2003, and 2008 National Demographic Health Survey*DOH targets for 2010 as part of MNCHN policy
MDG 5 Indicator 1993 1998 2003 2006 2008 2010 DOH
target* 2015 target Status
Maternal Mortality Ratio 209 172 - 162 - - 52 Low
Access to Skilled Birth Attendants - 56% 60% - 63% 80% 100% Low
Facility-Based Births* 28% 34% 38% - 44% 80% 100% Low
At least 1 Antenatal Care Visit - 86% 91% - 91% - - Still
At least 4 ANC visits - 77% 70% - 77% 80% 100% Still
ANC by Skilled Health Practitioner - 83% 86% - 88% - - Still
Contraceptive Prevalence Rate 40% 47% 49% 51% 51% - 80% Low still
Modern CPR* 25% 28% 33% 36% 34% 60% 100% Low still
Unmet Need for Family Planning - 20% 17% 16% 22% - 0% Still
Adolescent Birth Rate - - - - 26% - - No data
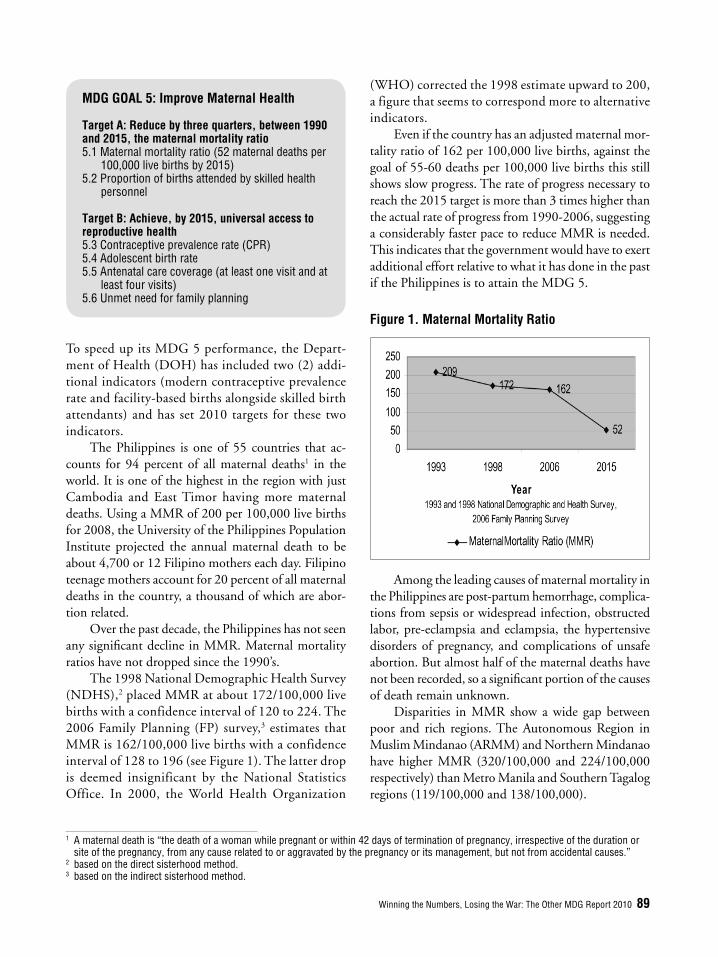
Winning the Numbers, Losing the War: The Other MDG Report 2010 89
MDG GOAL 5: Improve Maternal Health
Target A: Reduce by three quarters, between 1990 and 2015, the maternal mortality ratio5.1 Maternal mortality ratio (52 maternal deaths per
100,000 live births by 2015)5.2 Proportion of births attended by skilled health
personnel
Target B: Achieve, by 2015, universal access to reproductive health5.3 Contraceptive prevalence rate (CPR)5.4 Adolescent birth rate5.5 Antenatal care coverage (at least one visit and at
least four visits)5.6 Unmet need for family planning
To speed up its MDG 5 performance, the Depart-ment of Health (DOH) has included two (2) addi-tional indicators (modern contraceptive prevalence rate and facility-based births alongside skilled birth attendants) and has set 2010 targets for these two indicators.
The Philippines is one of 55 countries that ac-counts for 94 percent of all maternal deaths1 in the world. It is one of the highest in the region with just Cambodia and East Timor having more maternal deaths. Using a MMR of 200 per 100,000 live births for 2008, the University of the Philippines Population Institute projected the annual maternal death to be about 4,700 or 12 Filipino mothers each day. Filipino teenage mothers account for 20 percent of all maternal deaths in the country, a thousand of which are abor-tion related.
Over the past decade, the Philippines has not seen any signifi cant decline in MMR. Maternal mortality ratios have not dropped since the 1990’s.
The 1998 National Demographic Health Survey (NDHS),2 placed MMR at about 172/100,000 live births with a confidence interval of 120 to 224. The 2006 Family Planning (FP) survey,3 estimates that MMR is 162/100,000 live births with a confidence interval of 128 to 196 (see Figure 1). The latter drop is deemed insignificant by the National Statistics Office. In 2000, the World Health Organization
1 A maternal death is “the death of a woman while pregnant or within 42 days of termination of pregnancy, irrespective of the duration or site of the pregnancy, from any cause related to or aggravated by the pregnancy or its management, but not from accidental causes.”
2 based on the direct sisterhood method.3 based on the indirect sisterhood method.
(WHO) corrected the 1998 estimate upward to 200, a figure that seems to correspond more to alternative indicators.
Even if the country has an adjusted maternal mor-tality ratio of 162 per 100,000 live births, against the goal of 55-60 deaths per 100,000 live births this still shows slow progress. The rate of progress necessary to reach the 2015 target is more than 3 times higher than the actual rate of progress from 1990-2006, suggesting a considerably faster pace to reduce MMR is needed. This indicates that the government would have to exert additional effort relative to what it has done in the past if the Philippines is to attain the MDG 5.
Figure 1. Maternal Mortality Ratio
Among the leading causes of maternal mortality in the Philippines are post-partum hemorrhage, complica-tions from sepsis or widespread infection, obstructed labor, pre-eclampsia and eclampsia, the hypertensive disorders of pregnancy, and complications of unsafe abortion. But almost half of the maternal deaths have not been recorded, so a signifi cant portion of the causes of death remain unknown.
Disparities in MMR show a wide gap between poor and rich regions. The Autonomous Region in Muslim Mindanao (ARMM) and Northern Mindanao have higher MMR (320/100,000 and 224/100,000 respectively) than Metro Manila and Southern Tagalog regions (119/100,000 and 138/100,000).

90 SOCIAL WATCH PHILIPPINES
Progress of work in improving maternal health care in the Philippines: policies and programs
During the last decade, the Philippines put new knowledge into action to improve health care services and respond to the pressing issue of maternal mortality. These efforts were not without pitfalls and controversies but the issue remains for the government to scale up its actions to realize the MDG 5.
For rapid maternal and neonatal mortality reduc-tions, the DOH on September 2008 mandated the implementation of an integrated Maternal, Neonatal and Child Health and Nutrition Strategy (MNCHN). All pregnancies are considered at risk and thus ‘takes into consideration the three major pillars in reducing maternal mortality and morbidity, namely, emergency obstetric care, skilled birth attendants and family planning. The Philippines has taken a health system strengthening approach (HSS) to tackling MDGs 4 and 5. Maternal and child health services in the Philip-pines are implemented not through vertical programs, but through the existing financing and organiza-tional mechanisms covering the Department of Health (DOH). In addition, there are ongoing innovative pilot programs such as: the pay-for-performance for barangay health workers to encourage more facility-based deliver-ies; the Sponsored Program, the PhilHealth Maternity Care Package, and more recently, the Conditional Cash Transfer Program (Pantawid Pamilyang Pilipino Pro-gram or the 4Ps) to address the demand-side barriers to the use of maternal and child health services.
Despite the presence of many instruments to comprehensively tackle MDGs 4 and 5, somehow these instruments are not working synergistically.
From a risk approach to an emergency obstetric care approach
For rapid maternal mortality reduction, the DOH shifted its approach from a risk approach to an Emer-gency Obstetric Care (EmOC) approach. The risk ap-proach is based on the identifi cation, within the total population of pregnant women, of those with a high risk of complications. It has been assumed that high-risk mothers can be identifi ed during prenatal visits. However, studies have shown that more than 80% of maternal deaths were due to complications for which no antenatal screening was possible: puerperal sepsis,
postpartum hemorrhage, and shock. These complica-tions cannot be predicted or prevented, except those resulting from unsafe induced abortion. Several studies have also shown that the antenatal care’s screening and predictive values are poor and have no direct value in the prevention of maternal death.
Therefore, all pregnant women are at risk of acquir-ing a life-threatening complication at any time during pregnancy, at delivery, or in the postpartum period. This is the main consideration in the emergency obstetric care approach Therefore, all pregnant women should have access – at any time, day or night – to health facilities that provide EmOC, a package of critical health services, which when provided immediately and competently can save women’s lives.
About 85 percent of all maternal deaths are due to direct complications that require emergency obstet-rics care. Emergency obstetric care has three essential elements: a skilled attendant at delivery; access to emergency obstetric care in case of complications; and a functioning health referral system in place to allow the unimpeded fl ow of services to any pregnant woman who needs them at any place and at any time.
Field data shows another picture:While the Philippine government shows progress
in reaching the targets for MDG 5 through programs and policies, fi eld data proves otherwise. Looking at the trend of maternal deaths over the years, the indicator on maternal health status is disturbing. MMR went down to 172 deaths in 1998 from a 1993 baseline fi gure of 209 deaths.4 Though the decrease continued, it was at a sharply diminishing rate, and in 2006 had only reached 162 deaths,5 still far from the target of 52 deaths per 100,000 live births by 2015. Because of this, the Philippines Midterm Development Goal report (2007) admitted that the country is lagging behind and is experiencing diffi culty in achieving MDG 5.
The struggle for improving maternal health in the country is challenging especially when not all people benefi t. The National Commission on Indigenous Peoples (NCIP) admitted that indigenous communi-ties are hardly reached by medical benefi ts and services. These include indigenous women living in remote and inaccessible areas that prevent them from getting suffi cient and quality health services. It is estimated
4 1993 and 1998 National Demographic and Health Survey (NDHS)5 2006 Family Planning Survey
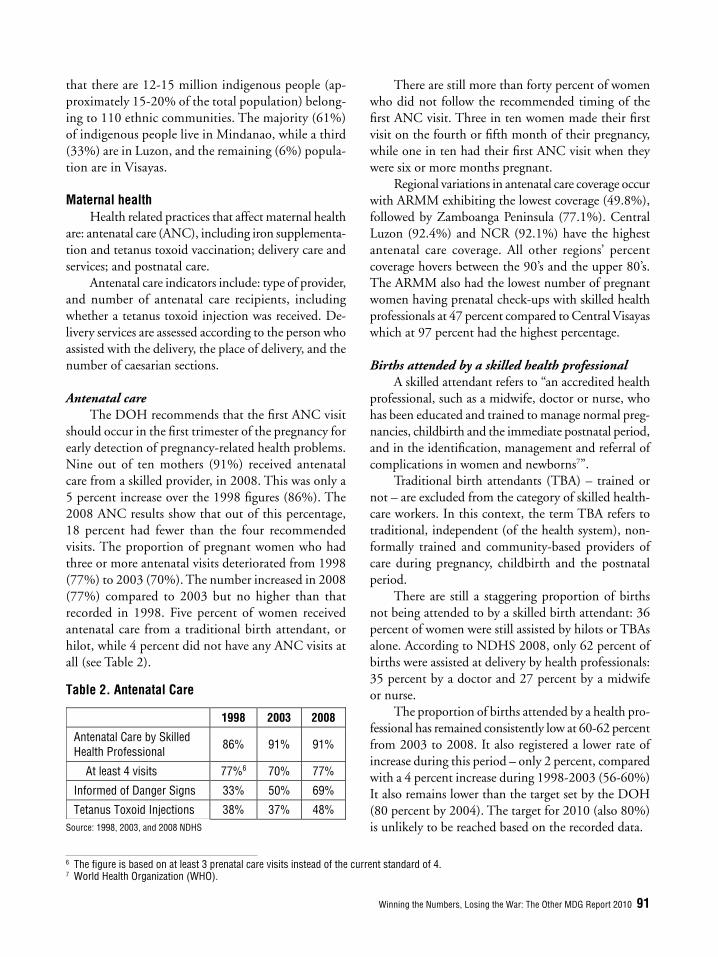
Winning the Numbers, Losing the War: The Other MDG Report 2010 91
that there are 12-15 million indigenous people (ap-proximately 15-20% of the total population) belong-ing to 110 ethnic communities. The majority (61%) of indigenous people live in Mindanao, while a third (33%) are in Luzon, and the remaining (6%) popula-tion are in Visayas.
Maternal healthHealth related practices that affect maternal health
are: antenatal care (ANC), including iron supplementa-tion and tetanus toxoid vaccination; delivery care and services; and postnatal care.
Antenatal care indicators include: type of provider, and number of antenatal care recipients, including whether a tetanus toxoid injection was received. De-livery services are assessed according to the person who assisted with the delivery, the place of delivery, and the number of caesarian sections.
Antenatal care The DOH recommends that the fi rst ANC visit
should occur in the fi rst trimester of the pregnancy for early detection of pregnancy-related health problems. Nine out of ten mothers (91%) received antenatal care from a skilled provider, in 2008. This was only a 5 percent increase over the 1998 fi gures (86%). The 2008 ANC results show that out of this percentage, 18 percent had fewer than the four recommended visits. The proportion of pregnant women who had three or more antenatal visits deteriorated from 1998 (77%) to 2003 (70%). The number increased in 2008 (77%) compared to 2003 but no higher than that recorded in 1998. Five percent of women received antenatal care from a traditional birth attendant, or hilot, while 4 percent did not have any ANC visits at all (see Table 2).
There are still more than forty percent of women who did not follow the recommended timing of the fi rst ANC visit. Three in ten women made their fi rst visit on the fourth or fi fth month of their pregnancy, while one in ten had their fi rst ANC visit when they were six or more months pregnant.
Regional variations in antenatal care coverage occur with ARMM exhibiting the lowest coverage (49.8%), followed by Zamboanga Peninsula (77.1%). Central Luzon (92.4%) and NCR (92.1%) have the highest antenatal care coverage. All other regions’ percent coverage hovers between the 90’s and the upper 80’s. The ARMM also had the lowest number of pregnant women having prenatal check-ups with skilled health professionals at 47 percent compared to Central Visayas which at 97 percent had the highest percentage.
Births attended by a skilled health professionalA skilled attendant refers to “an accredited health
professional, such as a midwife, doctor or nurse, who has been educated and trained to manage normal preg-nancies, childbirth and the immediate postnatal period, and in the identifi cation, management and referral of complications in women and newborns7”.
Traditional birth attendants (TBA) – trained or not – are excluded from the category of skilled health-care workers. In this context, the term TBA refers to traditional, independent (of the health system), non-formally trained and community-based providers of care during pregnancy, childbirth and the postnatal period.
There are still a staggering proportion of births not being attended to by a skilled birth attendant: 36 percent of women were still assisted by hilots or TBAs alone. According to NDHS 2008, only 62 percent of births were assisted at delivery by health professionals: 35 percent by a doctor and 27 percent by a midwife or nurse.
The proportion of births attended by a health pro-fessional has remained consistently low at 60-62 percent from 2003 to 2008. It also registered a lower rate of increase during this period – only 2 percent, compared with a 4 percent increase during 1998-2003 (56-60%) It also remains lower than the target set by the DOH (80 percent by 2004). The target for 2010 (also 80%) is unlikely to be reached based on the recorded data.Source: 1998, 2003, and 2008 NDHS
6 The fi gure is based on at least 3 prenatal care visits instead of the current standard of 4. 7 World Health Organization (WHO).
1998 2003 2008
Antenatal Care by Skilled Health Professional 86% 91% 91%
At least 4 visits 77%6 70% 77%
Informed of Danger Signs 33% 50% 69%
Tetanus Toxoid Injections 38% 37% 48%
Table 2. Antenatal Care

92 SOCIAL WATCH PHILIPPINES
There are large regional disparities in the use of skilled birth attendants. In urban areas, 78 percent of births are attended by skilled professionals, compared with 48 percent of births in rural areas. Eighty-seven percent of deliveries in NCR are assisted by health pro-fessionals (57 percent by a doctor and 30 percent by a midwife or nurse). In contrast, 80 percent of births in ARMM are assisted by a hilot, and only 19 percent of deliveries assisted by a skilled attendant. Interestingly, 12 percent of births in CAR are assisted by a relative or friend and 1 percent are delivered with no assistance (see Figure 2).
Many areas in our country have yet to see a skilled attendant. Women for the longest time have depended on TBAs and would pass on this custom to their daughters.
Many women prefer delivery with TBAs because they are more considerate of their needs and comfort, and are also easier to summon and are willing to visit them even in the middle of the night.
However, it has been recognized that having a skilled attendant during every birth is crucial to reduc-ing maternal death, and this is an essential element of the EmOC strategy. But, the overall effectiveness of skilled attendants depends on their ability to access health facilities equipped to provide EmOC. Until that happens we will not be able to reduce the number of maternal deaths in this country.
Figure 2. Use of Skilled Birth Attendants within the Philippines and for Select Asian Countries
Source: WHO, NDHS 2008Note: A skilled birth attendant is an accredited health professional including midwife, doctor and nurse.
The push for facility based delivery to prevent maternal deaths
Proper medical attention and hygienic conditions during delivery can reduce the risks of complications and infections that may cause the death or serious illness of the mother and the newborn. Hence, an important component of the effort to reduce the health risks is to increase the proportion of babies delivered in a safe and clean environment and under the supervision of health professionals. More importantly, emergency intervention needs to be easily within reach, assuming facilities are well equipped.
Only 44 percent of births in the Philippines are delivered in a health facility (see Table 3); 27 percent in a public health facility and 18 percent in a private health facility. More than half (56 percent) of births take place at home. These figures show an increase in the proportion of births occurring in a health facility from 38 percent in 2003 to 44 percent
Table 3. Facility-Based and Skilled Health Professionals-Attended Births
Source: 1998, 2003, and 2008 National Demographic Health Survey
1998 2003 2008
Facility-Based 34% 38% 44%
Skilled Health Professionals At least 4 visits
56% 77%
60% 70%
62% 77%

Winning the Numbers, Losing the War: The Other MDG Report 2010 93
in 2008, and a decline in the percentage of births delivered at home from 61 percent in 2003 and 56 percent in 2008.
Across regions, delivery in a health facility is most common in NCR (69 percent). In fi ve regions, at least 70 percent of births occurred at home: ARMM (85%), SOCCSKSARGEN (77%), MIMAROPA (73%), Zamboanga Peninsula (71%), and Cagayan Valley (70%) (see Figure 3).
The DOH target of increasing the percentage of skilled birth attendants and facility-based delivery to 80 percent by 20108 and 100% by 2015 may not be
Figure 3. Births delivered in a health facility and by skilled health professionals (%)
Source: 2008 National Demographic Health Survey
8 This is one of the Department of Health programs, Maternal, Neonatal and Child Health and Nutrition (MNCHN) targets for 2010 which aims to achieve 100 percent skilled birth attendants and facility-based births by 2015.
Table 4. Place of Delivery 2003-2008, NDHS (2003, 2008)
achieved, as the proportion of births delivered in a health facility increased only at a rate of 1 percent per year (34% - 44% from 1998-2008).
Delivery in a health facility is improving far too slowly. Between 2003 and 2008, the percentage of women in the lowest income quintile delivering in a health facility increased from only 10 percent to 13 percent (3% change in 5 years). For women in the high-est income quintiles, the increase was almost 7 percent (77% to 83.9%). The overall percentage of deliveries taking place in a health facility increased from 37 to 44 percent (see Table 4).

94 SOCIAL WATCH PHILIPPINES
In terms of postnatal care, 77 percent of women had a postnatal checkup within two days after giving birth and 14 percent of the women received a postnatal check-up 3 to 41 days after delivery. Health profession-als provide postnatal care to 60 percent of mothers. At the same time, a substantial proportion of mothers (31 percent) receive postnatal care from a traditional birth attendant. Health professionals are more likely to provide postnatal care to mothers of fi rst-order births, mothers in urban areas, mothers with college degree or higher educational attainment, and mothers in the highest income quintile.
Achieve, by 2015, Universal Access to Reproductive Health Total fertility rate
Many Filipino women are having more children than they want. Currently, the average total number of children a Filipino woman has during her repro-ductive years is 3.3, one child higher than the desired number of 2.4. There is large variation in fertility rates with women in the highest income quintile at 1.9 compared with 5.2 for women in the lowest in-come quintile.9 Similar disparities are seen between fertility and education. Women with a college degree or higher educational attainment have 2.3 children, about half that of women with only elementary edu-cation at 4.5.
On women’s fertility preference, 54 percent of married women aged between15-49 years do not want another child and an additional 9 percent are already sterilized. Meanwhile, 19 percent of married women want to have another child but would rather wait two or more years. Thus, 82 percent of married women want to either space their births or limit children altogether. The ideal number of children for all women and those who are currently married is 2.8 and 3.1 respectively, slightly lower than the 2003 NDHS fi gure of 3.0 for all women and 3.2 children for currently married women.
Contraceptive prevalence rateA critical assessment of risk, and one that affects
women’s fertility, is the adult lifetime risk of maternal death.10 This is a function of both the likelihood of surviving a single pregnancy and the number of preg-nancies an average woman has. In the Philippines,
the lifetime risk of maternal death is 1 in 120 i.e. 1 woman in every 120 faces the risk of maternal death in the course of her lifetime. To reduce the lifetime risk, efforts can be directed towards either lowering the number of pregnancies or improving the chances of survival among pregnant women. Family planning programs help prevent maternal deaths mainly through reducing the number of pregnancies.
The importance of family planning to the lives of women cannot be emphasized enough. Women’s access to effective contraception would avert 30 percent of maternal deaths, 90 percent of abortion-related deaths and disabilities, and 20 percent of child deaths.
At least 90 percent among married women have heard of the pill, male condoms, injectables, and female sterilization. On average, married women know eight methods of family planning. However, contraceptive use is low and has remained fairly stagnant over the last 5 years.
The NDHS in 2008, revealed that the contra-ceptive prevalence rate (CPR) or the proportion of women using any FP method is 51 percent whether traditional (16.7%) or modern (34%) (see Figure 4). This figure is still far from the target rate of 80 percent for 2010. Half of married women and 70 percent of all women of reproductive age still don’t use any method at all.
The portion of all married women of reproduc-tive age using modern methods barely increased by 6 percent from 1998 to 2008, while the use of traditional methods decreased by less than 2 percent, which pro-duced a minimal rise in CPR of less than 5 percent. In 2006, younger married women (15 to 19 years) use contraceptives less (23.3%) compared to older women 35 to 39 years of age (58.2%). The oldest age group (45 to 49 years) was twice more likely to use contraceptive than the adolescent married women.
Poor and less educated women from rural areas, particularly those who live in ARMM and other poor regions are more unlikely to use family planning methods. Contraceptive use ranges from a low of 15 percent of married women in ARMM to a high of 60 percent in Davao.
As to the source of contraceptives, government facilities provide contraceptive methods to 46 percent of users, while 51 percent obtain their method from
9 NDHS. 2008.10 the probability that a 15-year-old female will die eventually from a maternal cause.

Winning the Numbers, Losing the War: The Other MDG Report 2010 95
Source: 1993 National Demographic Survey, 2006 Family Planning Survey1998, 2003, and 2008 National Demographic Health Survey
Figure 4. Trend in Contraceptive Prevalence Rate (CPR) through the years
private medical sources. The most common single source of contraceptive methods is the pharmacy, which supplies 40 percent of users of modern meth-ods.
The most widely used method is the pill (16%) followed by, female sterilization (9%), and condom (2.3%). Natural family planning methods - rhythm (6%), Lactational Amenorrhea Method (LAM) and other methods (1%) are the least preferred. Long-term contraceptive methods such as sterilization and IUD are preferred by older women, while pills and injectables are more popular to younger women.
The Philippines has one of the most appallingly low rates of male contraception in Asia: condom users as a proportion of all contraception users is very low at 1.6 percent while male sterilization is even lower at 0.1 percent. This is nowhere near the desired ideal of having both men and women share equal responsibility over sexual and reproductive health decisions.
These trends indicate the need to actively pro-mote family planning most especially for low-income households. Over 50% of women do not have access to contraceptives and family planning methods. Without access to family planning services, the actual number of children of poor families generally exceeds the desired family size and thus they are exposed to the risks that accompany pregnancy.
Only 67 percent of all births in the Philippines are planned. The rest are either miss-timed or unwanted. Fifty-four percent of married women do not want an additional child but 49 percent of them are not using any form of family planning method.
Unmet need for family planningWomen who intend to space or limit births but
are not using family planning methods have an unmet need. The unmet need for family planning was 22.3 percent in 2008, representing an increase of fi ve percent from the 2003 fi gure of 17.0 percent (see Table 5).
Among the regions, the unmet need was highest in ARMM (33%), and lowest in the Davao Peninsula (15%). It is slightly higher in rural areas (24 percent) than in urban areas (21 percent). Also, the older the woman (36 percent among women aged 15-19 com-pared to 18 percent among women aged 45-49), the more educated (college attainment), and wealthier she is, the lower the unmet need.
According to the 2006 Allan Guttmacher study, 41 percent of unwanted pregnancies, and 17 percent of miss-timed pregnancies resulted in induced abor-tions.
Table 5. Unmet Need for Family Planning
Source: 1998, 2003, and 2008 NDHS
1998 2003 2008
Unmet need for family planning 19.8% 17.0% 22.3%
Total demand for family planning 69% 73%
Total Fertility Rate 3.7 3.5 3.3
Total Wanted Fertility Rate 2.7 2.5 2.4
Unplanned pregnancy 45% 44% 36%
Unwanted pregnancy 18% 20% 16%
Mistimed pregnancy 27% 24% 20%

96 SOCIAL WATCH PHILIPPINES
AbortionWorldwide abortion rates have declined because
unintended pregnancy rates are down in all regions of the developing world. Yet, abortion rates in the Philip-pines are still relatively high and continue to increase in some areas.
In the Philippines, abortion is illegal and prohibited under all circumstances. There is no exception, not even for victims of rape or to save the life of the mother. Twenty percent of maternal deaths are due to unsafe abortions, and two-thirds of Filipino women attempted induced abortion. Unsafe abortion is the 4th leading cause of maternal death. It is estimated, by the 2006 Allan Guttmacher report that more than half a million Filipino women desperately resort to unsafe abortion, exposing them to grave risks to health and life.
The majority of women who experienced abor-tion, are married, Catholic, and poor. The reasons why women resort to abortion are the following: economic cost of raising a child (72%); they have enough children (54%); and that the pregnancy occurred too soon after their last one (57%). In 2008, adolescent pregnancy accounted for 17 percent of an estimated 560,000 induced abortions.
The rigid anti-abortion stance by religious conserva-tives has been used to fuel an aggressive misinformation campaign which equates family planning modern methods with abortion. Sadly, this thinking found support from the previous national leadership and some local executives, thus compromising if not denying women’s access to much needed reproductive health services in their daily life.
Adolescent birth ratePrevalence of pre-marital sex among the young
people is another concern raised by the Young Adult Fertility and Sexuality Survey (YAFSS).11 The report indicated report that there was an increase in the overall prevalence of pre-marital sexual activity from 18 (1994) to 23 (2002) percent among the young people 15-19 years of age.
Due to the involvement of young people in risky sexual behavior coupled with reduced use of contracep-tives, adolescents, especially the females, tend to experi-ence reproductive health problems. The 2008 NDHS results showed that 8 percent of women 15-19 years of age had begun bearing children and the majority of
them were poor and from the rural areas. Other studies show that 46 percent of abortion attempts occur among young women of which 30 percent are attempted by women aged 20-24, and 16 percent by teenagers aged 15-19.12 Teenage pregnancies account for 17 percent of induced abortion cases.
Although our youth are having their sexual debut at increasingly younger ages, they do so without suf-fi cient knowledge on reproductive health, particularly the consequences of early and unprotected sex. Curious and eager to know more about sex, they seek informa-tion from unreliable sources like their peers and por-nographic materials, unable as they are to get that from socialization agents like their family or school. Worse, some of them learn about sex from actual experience, without fully knowing how one could get pregnant or contract sexually transmitted diseases. Access to accurate and appropriate information and services on many aspects of sexual behavior, reproductive health, and sexuality is needed by our adolescent and youth.
However, offi cials of the Catholic Church have strongly opposed the inclusion of sex education in the curriculum of public schools, arguing that by doing so would arouse young people’s curiosity about sex, encourage them to try premarital sex, and promote their promiscuity.
Financing gapsPublic spending on health in the Philippines is
below the level of other comparable income countries, even though adequate public fi nancing is promoted as the most effective health fi nancing mechanism to pro-mote equity. In 2007, the Philippines spent 6.8 percent of government expenditures on health compared with the average of 9.9 percent of government expenditures for the East Asia Region (see Figures 5 and 6).
Increases in public spending on health in the last few years have mainly taken place at the central govern-ment level, including the expanded DOH public health program for LGUs. Local government spending has stagnated in real terms over the last decade, which has important equity implications for the poor. As a share of total LGU spending, the contribution for health declined from 12 percent in 2002 to 9.5 percent in 2007. Cities and towns are spending less, with only 7.5 percent and 7.7 percent respectively, of their total
11 based on YAFSS data from 1994-2002.12 Cabigon and Singh. 2005.

Winning the Numbers, Losing the War: The Other MDG Report 2010 97
Figure 5. Public Spending on Health as a percent of GDP in Selected Comparator (1995-2007)
Figure 6. Public and Private health spending in the Philippines, 1995-2008
2006 expenditures going to the health sector. Since the Internal Revenue Allocation (IRA) and intergov-ernmental fi scal systems do not fully refl ect the fi scal capacity and need, many LGUs in reality have very limited fi scal space to fi nance any expenditure whether in health or other sectors.
However, the most worrisome trend in national government health sector spending is the sharp drop in real per capita DOH spending on public health by 22% yearly from 1998-2006. Real per capita DOH spending on public health went down from Php 40 in 1999 to Php 7 in 2006 before rising to Php 11 in 2007-2008 and Php 51 in 2009-2010. Public health services tend to deteriorate in accordance with the decline in government spending.
High out-of-pocket expenditure.Out-of-pocket (OOP) payments for health services
are increasing in the Philippines. From more than 54.3 percent of the total health expenditure of Php 234.3
billion, only 26.3 percent came from government (13.0% National and 13.3% local government units) with the Philippine Health Social Insurance at a poor 8.5 percent. Half of this or around Php 117 billion went to purchasing pharmaceuticals. The percentage of household expenditures is increasing. Recent NDHS data shows that economic barriers as a reason for households deciding not to seek care still constitutes a signifi cant factor for utilization of health services.
The country’s total health expenditure showed improvements from 2005 to 2007, but at decelerating growth rates both at current and constant prices, the total outlay for health went up from Php 198.4 billion in 2005 to Php 234.3 in 2007, registering a growth rate of 9.1 percent in 2006 and 8.3 percent in 2007.
Discounting the effect of infl ation, total health expenditure grew at only 4.6 percent in 2006 and even slower at 4.0 percent the following year. When consid-ered on a per capita basis, these growth rates translate to miniscule increases in per capita health spending of Php14 in 2006 and Php11 in 2007.
The level of health expenditure in 2005 to 2007 was within the target of 3 to 4 percent of GNP set as part of the National Objectives for health 2005-2010. However, the ratio exhibited a decreasing trend from 3.4 percent in 2005 to 3.2 percent in 2005 to 3.2 percent in 2007.
Pinoy households continued to bear the heaviest burden in terms of spending for their health needs as private out-of-pocket surpassed the 50 percent mark in health expenditure share in 2006, reaching 54.3 percent in 2007. Private households thus contributed and esti-mated Php 97.6 billion to the total health expenditure in 2005 and Php127.3 billion in 2007.
Government came in a far second in health spend-ing contribution, with the national government and the local government units (LGUs) footing almost equal shares of 13.0 percent and 13.3 percent in 2007, respectively. It is worth noting that the LGUs spent more than the national government in 2006 and 2007. Total government expenditure on health care goods and services increased from Php 58.5 billion in 2005 to Php 61.5 billion in 2007, registering an annual growth of only 2.6 percent.
Health expenditure from social insurance barely grew from Php 19.4 billion in 2005 to nearly Php 20.0 billion in 2007, indicating an average annual growth of only 1.6 percent. Thus, instead of picking up as targeted, the social insurance share in health spending

98 SOCIAL WATCH PHILIPPINES
went down from 9.8 percent in 2005 to only 8.5 two years later.
Poor households largely rely on public hospitals, whose quality of care is problematic and patient re-sponsiveness is low. Consumer surveys conducted in 2005 and 2006 indicated that people chose private hospitals over public ones since they perceived the latter as providing better quality care. Due to fi nanc-ing barriers, however, poor people do not have access to private hospitals, creating inequity in access to care. Public hospitals (DOH and LGU) suffer from many problems, including inadequate fi nancing, poor allocation of resources, lack of quality benchmarks and standards, and limited accountability. Access to good quality primary care is also uneven, and when available, people often bypass the primary level to seek care in hospitals, as there is no effective referral system. Global experience shows that high utiliza-tion of good quality primary health care services is equity-enhancing.
Although largely perceived by the public as pro-viding good quality care, available information shows that the quality of care in private hospitals is mixed. The Philippines has private health care facilities that are accredited by international organizations such as Joint Commission International. At the same time, there exist many small private facilities, including some that serve the poor, where the quality of care is uneven and unregulated.
The threat of climate change
The threat of climate change is now gaining mo-mentum and likewise posing great burdens to women. Climate change is manifested in the increase of extreme weather conditions such as, droughts, storms or fl oods, and developing countries like the Philippines will likely experience greater adverse impacts. These impacts will vary not only across the region but also between gen-erations, income groups and occupations as well as between women and men.
Climate change poses different impacts on women and this includes their health. Rising temperature will cause increase of malaria transmission. Pregnant women are more physiologically attractive to mosquitoes than non-pregnant women.13 The same study found that there is an increased incidence of pregnancy eclampsia during climatic conditions characterized by low tem-
perature, high humidity, or high precipitation, with an increased incidence especially during the fi rst few months of the rainy seasons which infl uence agricul-tural produce. Being dependent on their lands and resources, drought or excessive rainfall would severely diminish or cause the extinction of their traditional food and medicinal sources. Similarly, climate change mitigation and adaptation initiatives implemented on the same land and resources they are tilling, without taking into consideration local traditions and practices, would make them more vulnerable to changes that may further aggravate their health condition.
Why there has been no significant decline in maternal mortality: hindering factors
Poor women face a higher risk of dying from preg-nancy related causes simply because they lack access to the existing knowledge, technology and services that can save their lives. High maternal mortality and morbidity rates are symptomatic of a weak and inequitable health system in which health facilities are unaffordable, out of reach, under equipped or simply non-existent. Such a system also tends to impose user fees on women and ask them to bring their own supplies, for labor and delivery, to the hospital.
Problems in accessing health careMany factors can prevent women from getting
medical advice or treatment for themselves when they are sick. Information on such factors is important in understanding and addressing the barriers women may face in seeking care during pregnancy and at the time of delivery. In the 2008 NDHS, women were asked what hinders them in obtaining medical advice or treatment when they are sick.
The problem cited most often was lack of capacity to pay. The charging of fees for attendance at antenatal care and for the use of midwives has discouraged many women from using these services, as they lack the fi nan-cial resources needed. Moreover, mothers cite the high cost of delivery in a facility as a reason why they decided to deliver at home. Findings also reveal that the high cost of transportation going to the hospital and food for the caregiver/watchers during the mother’s entire stay in the hospital, discouraged facility-based deliveries. Financial considerations constrain women’s effective access to critical services during pregnancy, particularly before and after childbirth (see Table 6).
13 WHO. 2009.

Winning the Numbers, Losing the War: The Other MDG Report 2010 99
Source: NSO, MACRO. 2008. NDHS.
Table 6: Maternal Services by Wealth Index, 2008 NDHS
There are large income-related disparities in the uti-lization of health services. Poor women are consistently unable to access maternal and reproductive health services. The women in the highest quintile are about 9 times more likely to have a medical doctor assist them during delivery and are 37 times more likely to deliver in a private facility than women in the lowest quintiles (see Table 6).
Another gauge of poor women’s inability to gain effective access to life-saving services is the low percent-age of women, about 1.3 percent, who had delivered by caesarean section (C-section). This fi gure is way below the 5-15 percent range based on the proportion of complications requiring C-sections among a group of women giving birth. Below 5 percent would indicate women are dying or suffering from a disability because they are not receiving treatment; above 15 percent may indicate that women are receiving C-sections for rea-sons other than those strictly required by their medical condition or fetal indications. Apart from C- sections, poor women are not able to access other services even if these were available.
The rate of caesarian operations is also an indica-tor of access to essential obstetric care. One in ten live births (10 percent) were delivered by C-section, which
QUINTILES 1. Assistance during delivery Lowest Second Middle Fourth Highest Medical doctor 9.4 24.4 34.5 55 77.1 Nurse 0.7 2.1 2.4 1.7 0.7 Midwife 15.6 29.1 38.9 29.3 16.6 Hilot 71.4 42.8 23.7 13.6 5.1 Relatives, friends, others 2.3 1.3 0.4 0.1 0.3
No one 0.4 0.2 0.0 0.0 0.0
2. Place of delivery Lowest Second Middle Fourth Highest Government hospital 11.5 26.9 33 39.0 29.4 Government health center Private facility 1.5 7.1 15.3 29.7 54.5 Home 86.8 65.5 51.5 30.9 15.8 Other 0.2 0.6 0.2 0.4 0.2 3. Delivered by C-section 1.3 5.1 7.3 15.5 27.7 4. Number of births 1,686 1,460 1,219 1,114 880 5. Current use of contraceptives (any method) 40.8 52.7 54.0 55.8 50.0
14 NSO, ORC Macro, 2004.
is an increase from the proportion reported in the 2003 NDHS (7 percent).14 The occurrence of caesar-ian operations varies across regions, from 2.7 percent in ARMM to 16.3 percent in CALABARZON. The proportion of deliveries by C-section in CALABAR-ZON has increased seven percentage points, from 10 percent in 2003.
The data in Table 6 shows that the use of any FP method increases with increasing wealth index quintile from 37 percent for women in the poorest quintile to 54 percent for those in the fourth quintile. Interestingly, it declines to 51 percent for women in the wealthiest quintile.
It also highlights the relationship between birth intervals and the mother’s economic status. It reports that the mother’s economic status has a positive as-sociation with birth intervals. Women in the poorest quintile have the shortest interval, while those in the wealthier quintiles have the longest (29 and 34 to 35 months, respectively).
Accessibility to health centers and information on maternal health and facilities and/or services remains a challenge in improving maternal health especially in the rural areas of the country. A report in 1990, then again in 2009, stated that women in rural areas have to travel
100 SOCIAL WATCH PHILIPPINES
longer to health care centers in contrast with women in town centers. Areas are diffi cult to access due to the geographical landscape of the country. In areas where public transportation is available, the trips are often long, infrequent and costly. The barriers affect access patterns for both routine and emergency care.
More than 80 percent of women in the Zambo-anga Peninsula, CARAGA, and Central Visayas cited concerns on the availability of health care personnel, supplies and medicines as serious problems in getting health care services.
Apart from observed lapses by the government in providing obstetric services, some traditional beliefs hinder positive achievements on maternal health in the country. Among these are the prevalent beliefs that pregnancy is a natural occurrence and not a condition posing risks; and the belief that the death of a mother is fated and not because of the lack of suffi cient medical care. Dying in pregnancy and delivery is still considered ‘in the nature of things’ (isang paa nasa buhay at isang paa nasa hukay).
Data also reveals that decision to seek care from health facilities is often made only when the delivery has become diffi cult or when complications arise.
Barriers because we are womenFocusing purely on a health perspective without
a gender analysis of the issue, means that the reasons women do not access these services may not be identi-fi ed and therefore addressed.
Poor women consistently are unable to access services, information, supplies, and facilities that could prevent maternal death.
The services are inaccessible not only because often they cannot afford treatment but because as women, they do not have the time or the social support (women’s mobility, getting permission to go for treatment, not wanting to go alone, no companion, childcare support) to utilize the service.
Home deliveries provide women with a sense of privacy and comfort, as the woman is not forced to lie on a delivery table with her genitals publicly exposed. Moreover the family does not need to worry about child care support during home deliveries, unlike dur-ing facility-based delivery when the father and/or other family members are forced to leave the children at home to take care of the mother and her newborn.
However, the barrier is often that the women lack the decision making power to choose to use available services. Women’s decision and assertion is therefore a vital factor in accessing services.
Besides the problems of geographic location or economic access, indigenous approaches and respect for tradition is critical in situations like childbirth. Indigenous women have preference for traditional midwives or birth attendants. The preference emanates from familiarity of the other in terms of values, beliefs and background. The feeling of respect and under-standing is there in terms of the manner of delivery wherein indigenous women signifi cantly become part of the cultural heritage of the community. The need for those who provide health care and other services to indigenous peoples may need to be trained in the relevant culture.
In dealing with impoverished areas not reached by obstetric services, the ADB surmised that “provision of maternal health care in remote areas will involve a higher cost per person than in more accessible areas. Nevertheless, improving maternal health should be an integral component of national programs on equity grounds.15 The ADB reveals that a strategy that will likely have high impact on maternal health care is a judicious combination of traditional and modern ap-proaches to maternal care.
Addressing under-utilization of health services.The quality and access of government health
services are the most pressing issues from the point of view of women. Even with upgraded EmOC facilities and presence of skilled attendants, increased utilization is not ensured. EmOC does not operate in a vacuum; instead it is embedded in the health system. Therefore, there is a need to review the health system practices and behaviors that prevent utilization of services. The perception of the community on the health system, and how they feel when they go to the health center, contributes to their unwillingness to deliver in a health facility. There is a need to understand and address the true bottleneck of service under-utilization.
Women, when queried on problems of utilization of health services in a study “What Women Want In Terms of Quality Health Services” replied: Absence or inadequate health service facilities, discriminatory attitudes of health providers and insuffi cient personal resources combined to create a low level of utilization
15 ADB. 2007.

Winning the Numbers, Losing the War: The Other MDG Report 2010 101
and a low level of satisfaction with these services.More than any other facet of health services, good
interpersonal relations were emphasized time and again as an important factor in the poor women’s continued use of a health service. Services that were inadequate - meager facilities, insuffi cient medical supplies and limited personnel - were as critical an issue as health pro-viders who did not treat them with dignity and respect. Women responded that they felt degraded and widely exposed in an assembly line-like delivery system.
The disjointed and disconnected health serviceWith high antenatal care coverage, MMR should
have been dropping since the mid-90’s if risk-screen-ing and prediction were effective in reducing maternal deaths. Yet, MMR in this country has not declined signifi cantly in the past decade. The gap among the indicators show the failure of the government to further connect the women to the health delivery system, as well as to provide the services needed.
Antenatal care does have other purposes. It could serve as the locus for the delivery of other services such as tetanus toxoid immunizations and informa-tion on the danger signs of pregnancy and the benefi ts of birth preparedness. It could also be a conduit for the distribution of contraceptives and impregnated mosquito nets.
Given such high attendance rates in antenatal care clinics, policy makers and program managers ought to exploit and maximize the opportunities that such rates present. What is interesting is that despite the relatively high antenatal care performance women still are not assisted by skilled birth attendants, nor do they give birth in health facilities. In an ideal health system, the MDG 5 indicators particularly those of ANC, facil-ity-based births and access to skilled birth attendants should support and complement each other.
Moreover, if strong linkages between antenatal care and EmOC are established, e.g., through practical ways such as promoting FP, talking with skilled attendants, identifying danger signs, making birth plans, then women will at least have a chance of surviving the com-plications that arise during pregnancy and childbirth.
Administrative orders lack coherence and synergism resulting in weak or absent policies and programs that are crucial to reducing maternal death.
It seems that health-related administrative orders were done arbitrarily, giving a strong sense of disjoint-edness. There is a policy on natural FP, separate from
a policy on the FP program; a safe motherhood policy, separate from the reproductive health policy; a policy on the prevention and management of complication of abortion, separate from all other policies. There is no coherent whole. There is no synergism.
The slow progress in contraceptive prevalence rate stems mainly from two policies implemented during the previous Arroyo administration. First, with the Natural FP Program, AO No.132, S.2004, the national government focused its FP policies and resources on natural family planning only. This stems from the pressure exerted by the national government to align its FP policies with the Catholic Church’s stand on contraception giving rise to Natural Family Planning as a “distinct, discrete personality all its own and as separate from the existing FP program”. Notwithstand-ing, the government, through the POPCOM, has sent a strong signal to LGUs and the public at large that natural FP is its de facto policy. The DOH is tentative in its position towards artifi cial contraception and has virtually shied away from it. Much more crucial than these implementation problems is the question of the effectiveness of natural FP methods. Studies to date have shown confl icting results.
This resulted in splitting the natural and artifi cial FP methods into two separate programs, separate bud-get lines as well as to two cadres of health workers who promote natural and artifi cial FP methods separately. This split in turn has resulted in problematic opera-tional issues such as the costs of funding two cadres of health workers and the fostering of unhealthy competi-tion for clients between natural and artifi cial FP health workers. Anecdotal evidence shows that confusion arises among clients as to the effectiveness and appropriate-ness of the methods they should use.
This schizophrenic scenario is set against the backdrop of two important events: the national government’s delegation to the LGUs of preparing and implementing FP programs and the USAID gradual phasing-out of donated contraceptive commodities at the end of 2008. The withdrawal of USAID funding threatened the ability of the government, particularly poor municipalities, to meet its contraceptive needs.
For the past forty years, the bulk of the country’s total requirements for family planning commodities have been fi nanced by external donors. U.S. Agency for International Development (USAID) was the largest contributor, shouldering 80 percent (annual average of US$ 3,000,000 for the past 36 years).

102 SOCIAL WATCH PHILIPPINES
However, USAID, with the concurrence of the Philippine government, decided to withdraw and gradually phase-out donations of FP commodities. The phasing-down of donated contraceptives started in 2004 and completed in 2008. In 2004, the supplies of condoms gradually tapered down until they eventually ran out, pill donations completely phased-out in 2007, and injectables, in 2008.
In 2004, POPCOM projected the phasing-out will affect an estimated 4.6 million women of reproductive age who use modern methods of contraception. It will also affect another 2.3 million women who are currently not using modern methods but reported their intent to use. Further, some 18.8 million young Filipinos (15 to 27 years of age) who have had a premarital sex experience are likewise going to be affected by the phase-down.
Contraceptive Self-Reliance Strategy, AO No.158, s. 2004.
In response to the decision of donors to phase out donated contraceptives, the Department of Health is-sued AO No.158, S.2004, Guidelines on the Manage-ment of Donated Commodities under the Contraceptive Self-Reliance Strategy (the second policy implemented during the previous Arroyo administration implicated for the slow progress in contraceptive prevalence rate). CSR is an attempt on the part of government to put in place a set of measures that would ensure continued use and increase of contraception and other FP methods to eventually eliminate unmet need.
In addition, the CSR strategy aims to reduce public sector dependency and increase local government units and private sector participation. In turn, this would en-able the government to focus on public family planning services and supplies for the poor, and move those who can afford it to the private sector.
The Contraceptive Self-Reliance Program (DOH AO 158 2004) states that the Government shall act as guarantor of last resort assuring that contraceptives re-main available for current users who depend on donated supply. After 6 years, principally, the government failed to fi ll in the gap caused by the withdrawal of USAID supplies. It refused to spend for modern contraceptives. The government, in the face of opposition from the Catholic Church, has taken the position that it would not use its funds to purchase contraception. Worse, it even impounded the Php 2 billion budget allocation for family planning in the 2008 General Appropriations Act. By default, the government’s position goes against the spirit and intent of RH approach.
Managing the complications of abortion in health facilities is a medico-legal case.
As abortion is illegal in the Philippines, the Post Management of Abortion Complication (PMAC) policy is the next best effort that the DOH could do. Implementation of this policy, however, faces severe challenges. In the fi rst place, post-abortion cases are considered “medico-legal” and obligate the attending health staff to report these to the police or the desig-nated authorities. Thus, there is a tendency for health staff to refuse to manage these women in need. If, on the other hand, health staff takes on these cases, they deliberately miss-classify them as either medical or sur-gical cases or consciously make omissions that suggest induced abortions. Once again, they obviate the need to fi le forms with the police. Data on post-abortion cases are therefore diffi cult to fi nd in health facilities.
Reproductive Health Bill
There is a lack of a clearly pro-poor reproduc-tive health policy. While the national policy on the reproductive health (RH Bill) has been languishing in legislative debates for two decades now, to date there are 51 local ordinances, including 4 provincial laws (Aurora, Sulu, Ifugao, Mountain Province) in support of reproductive health service provision and LGUs have been taking advantage of performance grants in part for providing family planning services. However, performance is patchy in a policy environment which varies arbitrarily from LGU to LGU and supply is subject to political and other whims.
Responsibility relegated to the LGU The responsibility of crafting, funding and
implementing basic services including reproductive and family planning programs has been relegated to the LGUs. Thus, we are witness to uneven reproduc-tive and family planning policies and programs across LGUs. Emergency obstetric care services are either not functioning properly or non-existent in most poor areas. Note that these areas are the greatest contributor to maternal mortality.
The DOH supported the provision of FP services and contraceptives of LGUs, and has worked with LGUs on how to operationalize the Contraceptive Self Reliance guidelines. Budget has been allocated since 2007 for capacitating LGUs on their reproduc-tive health services including the provision of family planning.

Winning the Numbers, Losing the War: The Other MDG Report 2010 103
Although the delivery of public health services is largely devolved to LGUs in accordance to the provi-sion of the Local Government Code, however, the good nature of public health services suggests that the central government cannot fully abdicate its role in this subsector despite devolution.
PhilHealth SupportPhilHealth has approved the inclusion of Mater-
nity Health Package as an outpatient service in 2001, after years of covering only inpatient care. However, it has not included in its package of benefi ts oral con-traceptives and injectables. Oral contraceptives and injectibles listed in the Philippine National Drug formulary, however, are compensable when prescribed but only during hospital confi nement. To respond to this problem, LGUs may use capitation funds to pro-cure oral contraceptives for the use of their enrolled indigent member.
Family planning contraceptives have never been included as essential drugs. According to a study by the Philippine Population Management Program, 46 percent of family planning expenditures are still out-of-pocket.
Conclusions and Recommendations “Women are not dying because of diseases we cannot treat. They are dying because societies have yet to make the decision that their lives are worth saving” (Dr Mahmoud Fathalla)
Despite the fact that technical solutions to most of the problems associated with mortality and morbidity in pregnancy and childbirth are well-known, 4,700 women still die due to complications developed during pregnancy and childbirth every year. With the Safe Motherhood initiative of 2005 and the MNCHN which was launched in 2008, the Philippine government shows progress in attaining MDG 5 through programs and policies, but field data proves otherwise. Health outcomes (total fertil-ity rate, CPR, and unmet need) have not significantly improved. Adolescent births and unsafe abortions have not diminished.
Since most obstetric complications cannot be predicted or prevented, except those that result from unsafe induced abortions, all pregnant women are at risk of acquiring a life-threatening complication and they must have access – at any time, day or night – to health facilities that provide life-saving emergency ob-
stetric care. Access to this package of critical services is sorely lacking, especially for poor women.
Women continue to die from the complica-tions of unsafe abortion. Given that contraceptive commodities are unavailable and unaffordable, un-wanted pregnancies remain to be a problem in this country where abortion is illegal and where services that terminate a pregnancy are non-existent. Thus, women resort to illicit abortions and run the risk of acquiring life-threatening complications. Until such time that contraceptive commodities and FP services will be made much more available and accessible than they are now; and until such time that women are provided quality-post abortion care, this country will not lower its maternal mortality ratios.
Over all government spending on health still re-mains low. The signifi cant increase in attention to RH and maternal death issues in terms of greater awareness, better internal cohesion, and high-level engagement underscores the need to ensure that investments must be made. And investments must be directed towards solutions that are technically seen as essential to reduc-ing maternal mortality. At the minimum, this would include improved access to quality family planning services, skilled birth attendance, emergency obstetric care, and postnatal care for mothers and newborns
But central to making these services accessible is addressing inequities in a functioning health system. Dr Alberto Romualdez and Dr Ernesto Domingo who drew up recommendations to reform the health system towards Universal Health Care state:
“This means that every Filipino should have ac-cess to high quality healthcare that is effi cient, acces-sible, equitably distributed, adequately funded, fairly fi nanced, and directed in conjunction with an informed and empowered public. The overarching philosophy is that access to services is based on needs and not based on the capability to pay.”
“There should be one standard care for all, regard-less of their capacity to pay. Every citizen is all entitled to quality health services and packages that are available. Equity refers to both horizontal and vertical equity. For those with equal health needs, they have equal access to the health care of the same quality. Similarly, there should also be equal access to health care across the different social and economic classes.”
Beyond these, what is needed is the sustained com-mitment and strong political will of the government to ensure that strong systems and services are in place.

104 SOCIAL WATCH PHILIPPINES
Most of the maternal mortality of the last decade could have been prevented with a coordinated set of ac-tions, suffi cient resources, strong leadership and politi-cal will. For a variety of reasons, maternal health has not emerged as a political priority, and even though there is a growing shared understanding on the solution it has not been framed in a way that has been able to generate political commitment and subsequent action.
Policy reforms are never easy as they entail drastic changes in entrenched political power relationships and vested interests. Good institutions and policies don’t occur overnight but rather evolve slowly. A strong-willed and well-intentioned national leader is the key. Or a discerning and enlightened citizens can induce a change in the leadership to a reform-minded leader.
Box 1. Safe Motherhood: a brief history of the global movement 1947-2002
Ratifi ed by 177 states, the Convention of the Elimina-tion of Discrimination Against Women is the principal legal instrument addressing women’s rights, among them, the right to life-saving services during pregnancy and child-birth. Article 12 states:
States Parties shall take all appropriate measures to eliminate discrimination against women in the fi eld of health care in order to ensure, on a basis of equality of men and women, access to health care services, including those related to FP.
Notwithstanding the provisions of paragraph I of this article, States Parties shall ensure to women appropriate services in connection with pregnancy, confi nement and the post-natal period, granting free services where neces-sary, as well as adequate nutrition during pregnancy and lactation.
Elaborating further on Article 12, General Recom-mendation 24 urges states to eliminate discrimination in women’s access to health care. The Committee notes that:
“…it is the duty of States parties to ensure women’s right to safe motherhood and emergency obstetric services and they should allocate to these services the maximum extent of available resources.”
To ensure that these rights move towards their pro-gressive realization, policies and programs must promote evidence-based and focused interventions to reduce mater-nal mortality and morbidity and give priority to vulnerable groups such as poor and indigenous women.
Within this framework of women’s rights, the occur-rence of women dying during pregnancy and childbirth egregiously stands out.
Maternal deaths are not like any other deaths. Preg-nancy is not a disease but a physiologic process that only women experience. Women will continue to bear children and will continue to require access to skilled care and life-
saving obstetric services. Failure to provide such care and services therefore constitutes discrimination because only women face this risk.
This framework, therefore, allows the translation of human rights from abstractions to concrete applications. Human rights, after all, embody needs, presuppose re-sponsibilities, and delineate accountabilities.
A woman’s and a man’s right to a wide range of FP services, for instance, presupposes government’s responsibility to provide such services. A woman’s right to emergency obstetric care presupposes a government’s responsibility to ensure that she has access to these life-saving services. And a woman’s right to information and education on FP and the danger signs of pregnancy presupposes a government’s responsibility to make sure that not only does she have the correct information but that she is indeed able to act on it.
The Government of the Philippines, supported by the international community and development partners, is thus duty-bound to provide FP and life-saving emergency obstetric care to women who need them. Central to making these services accessible is a functioning health system. Beyond these, what is needed is the sustained commitment and strong political will of the government, international agencies, and development partners to ensure that strong systems and evidence-based services are in place.
Maternal deaths are not like any other deaths. Preg-nancy is not a disease but a physiologic process that only women experience. Women will continue to bear children and will continue to require access to skilled care and life-saving obstetric services. Failure to provide such care and services therefore constitutes discrimination because only women face this risk.
About Zahr, Carla. 2003. Safe Motherhood: a brief history of the global movement 1947-2002. In Rodeck, C. (ed) 2003. Pregnancy: Reducing maternal death and disability 2003; 67: 13-25.
We should bring the campaign to our people. Let this be the political project of the women.
As such, the following are the doable measures for the government to focus on in order to ensure safe and joyful childbirth for all women:
1. Achieve Universal Health Care as promised within the next three years, shift the relative weight of public spending from tertiary ser-vices that cater to the affl uent to basic services and public health that benefi t the poor;
2. Reform and strengthen the National Health Insurance Program (NHIP) so that it keeps to its mission of achieving social solidarity and equity. Revamp the Philippine Health Insurance Corporation to ensure full cover-

Winning the Numbers, Losing the War: The Other MDG Report 2010 105
age for all Filipinos, particularly that of the maternity care package by including coverage for all pregnancies;
3. Steadily expand the revenue base toward raising health spending to 5%-of-GDP; and
4. Make the Reproductive Health Bill a prior-ity of the Aquino administration to insulate Family Planning and Reproductive Health services from political trade-offs and religious control.
But at this time, what is urgently needed is a con-vergence of efforts to ensure that women go through pregnancy and delivery safely. EmOC and FP services have to be in place; health systems must be functioning and revitalized; and universal health care must start to be realized. If the DOH is able to do this resolutely and single-mindedly, the Philippines can achieve the target in 2015. This is the race that can be won.
But much, much more, partner with the organized women. For after all, we are the number one stakehold-ers of MDG 5. Together let this be our political project. So that beyond the anonymity of numbers and statistics
that have to be reported to the United Nations, are the faces of our mothers, sisters, daughters and friends. Then for sure no one is left behind. For if maternal death is preventable, one death is just too many. This is the race that should be and must be won.
Let us now report to our sisters…to establish or revitalize health systems that can provide EmOC and FP services.
References:
ADB. 2007.Cabigon and Singh. 2005.DOH targets for 2010 as part of MNCHN policy. Family Planning Survey. 2006.Guttmacher, A. 2006.National Demographic Health Survey. 1993, 1998, 2003, and
2008. National Demographic Survey. 1993.Philippines Midterm Development Goal. 2007.WHO. 2009.Zahr, C. 2003. Safe Motherhood: a brief history of the global
movement 1947-2002. In Rodeck, C. (ed) 2003. Pregnancy: Reducing maternal death and disability 2003; 67: 13-25.


The rising challenge of HIV/AIDS and other diseases
Winning the Numbers, Losing the War: The Other MDG Report 2010 107
Summary
P rogress in MDG 6 is very problematic. Of particular concern is the
alarming trend in HIV cases. There have been improvements in address-
ing malaria and tuberculosis (TB) but total prevention and cure are
still far on the horizon. The rapid rise in reported HIV/AIDS cases was attributed
by the offi cial report1 to poor prevention combined with increased risky behavior,
high level of misconceptions about HIV/AIDS transmission, and poor attitude on use of protection.
The decline in morbidity and mortality rates for both malaria and TB was due to improvements in the
government control programs. Probability of achievement was put at low to medium for HIV/AIDS
and high in all indicators of malaria and TB.
But like other MDG health concerns (infant and maternal mortality rates), combating infectious
diseases depends a lot on the progress of poverty eradication and environmental restoration and build-
ing our adaptive capacity to climate change.
1 ‘Philippines Fourth Progress Report on the Millennium Development Goals (MDGs).’ Third Draft, July 2010 (n.p.).
By MEDICAL ACTION GROUP
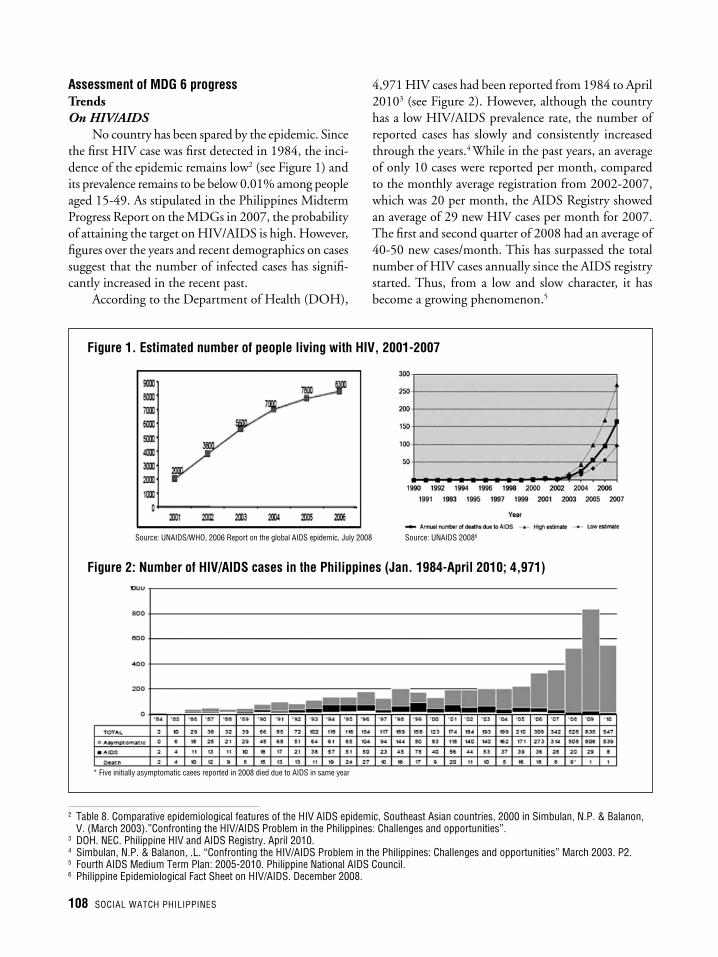
108 SOCIAL WATCH PHILIPPINES
Assessment of MDG 6 progressTrendsOn HIV/AIDS
No country has been spared by the epidemic. Since the fi rst HIV case was fi rst detected in 1984, the inci-dence of the epidemic remains low2 (see Figure 1) and its prevalence remains to be below 0.01% among people aged 15-49. As stipulated in the Philippines Midterm Progress Report on the MDGs in 2007, the probability of attaining the target on HIV/AIDS is high. However, fi gures over the years and recent demographics on cases suggest that the number of infected cases has signifi -cantly increased in the recent past.
According to the Department of Health (DOH),
4,971 HIV cases had been reported from 1984 to April 20103 (see Figure 2). However, although the country has a low HIV/AIDS prevalence rate, the number of reported cases has slowly and consistently increased through the years.4 While in the past years, an average of only 10 cases were reported per month, compared to the monthly average registration from 2002-2007, which was 20 per month, the AIDS Registry showed an average of 29 new HIV cases per month for 2007. The fi rst and second quarter of 2008 had an average of 40-50 new cases/month. This has surpassed the total number of HIV cases annually since the AIDS registry started. Thus, from a low and slow character, it has become a growing phenomenon.5
2 Table 8. Comparative epidemiological features of the HIV AIDS epidemic, Southeast Asian countries, 2000 in Simbulan, N.P. & Balanon, V. (March 2003).”Confronting the HIV/AIDS Problem in the Philippines: Challenges and opportunities”.
3 DOH. NEC. Philippine HIV and AIDS Registry. April 2010.4 Simbulan, N.P. & Balanon, .L. “Confronting the HIV/AIDS Problem in the Philippines: Challenges and opportunities” March 2003. P2.5 Fourth AIDS Medium Term Plan: 2005-2010. Philippine National AIDS Council. 6 Philippine Epidemiological Fact Sheet on HIV/AIDS. December 2008.
Figure 1. Estimated number of people living with HIV, 2001-2007
Figure 2: Number of HIV/AIDS cases in the Philippines (Jan. 1984-April 2010; 4,971)
Source: UNAIDS 20086Source: UNAIDS/WHO, 2006 Report on the global AIDS epidemic, July 2008
* Five initially asymptomatic caees reported in 2008 died due to AIDS in same year

Winning the Numbers, Losing the War: The Other MDG Report 2010 109
Sexual transmission remains to be the most com-mon mode of HIV transmission in the Philippines (see Table 1). A total of 164 returning overseas Filipino workers (OFWs) were reported to be infected with HIV in 2009. This is the highest number since 1984 but accounts for only 18% of all individuals reported in that year. In 2007, OFWs comprised 31% of all newly diagnosed individuals reported in the country.
The rising proportion of infected OFW’s is indicative of the lack or absence of active surveillance and moni-toring in their group. The majority of persons living with HIV belong to the young adults and the working group (see Figure 3). However, current statistics could just be a mask concealing the hidden identity of the epidemic in the country as it does not necessarily refl ect the true prevalence of infection since it merely relies
Table 1: Comparative trend in the mode of HIV transmission from 1984-2009
Source: Country report of the Philippines January 2008-December 2009. PNAC.
Figure 3: Male and female with HIV cases by age-group
Modes of Transmission 2009 2008 2007 2006 Cumulative (1984-2009)
Unsafe sexual contact 804 (96.29) 502 (95.08%) 320 (93.6%) 300 (97.1%) 3,994 (90.28%) Male-Male Sex 336 (41.79%) 215 (42.83%) 107 (33.4%) 81 (27.0%) 1,171 (29.32%) Male-Female Sex 216 (26.87%) 160 (31.87%) 139 (43.4%) 193 (64.3%) 2,214 (55.43%) Bisexual contact 252 (31.34%) 127 (25.3%) 74 (23.1%) 26 (8.7%) 609 (15.25%)
Sharing of the infected needles (among IDU) 0 1 (0.19%) 0 0 8 (0.18%)
Mother-to-Child 2 (0.24%) 2 (0.38%) 8 (2.3%) 4 (1.3%) 49 (1.11%) Contaminated Blood Products 0 0 0 0 19 (0.42%) Contaminated Needle Prick Injuries 0 0 0 0 3 (0.07%)
No Data on Mode of Transmission 29 23 14 5 351
Total 835 528 342 309 4,424
Source: DOH-NEC

110 SOCIAL WATCH PHILIPPINES
7 “ARMM doctors alarmed by unreported HIV-AIDS cases”, February 10, 2010. Philippine Daily Inquirer. 8 Moving forward with the Millennium Development Goals: May pera pa ba? Social Watch Philippines.2006.9 Simbulan, N. P. & Balanon, V., March 2003.
on the passive surveillance and reporting mechanism currently being carried out. The government could never be complacent with the unreported cases. In 2009, there were four cases of female OFWs in the Autonomous Region in Muslim Mindanao (ARMM) with AIDS.7 Voluntary reporting among those who are infected with the virus is problematic because of the stigma and discrimination that go with the disease. The Filipino’s conservative culture, family sensitivity and fear of being ostracized are among the factors which discourage people to go for the voluntary HIV-antibody test.
Though vulnerable sectors had been targeted and specifi ed in the operational plans of the government in the Fourth AMTP, it failed to include the indigenous people’s sector which accounts for about 20 percent of the total population. The result is exclusion from the data which is often the basis for program development and delivery of services.
The extent of the effect of HIV/AIDS has an inevitable negative economic effect. High rates of AIDS-related diseases could reduce the value of hu-man capital.8 In the Philippines, the impact of HIV and AIDS has generally been negligible. Its passive and latent character had minimal macroeconomic impact in the country’s economy. However, its impact is most seriously felt by persons living with HIV/AIDS (PWHAs) and their families.9
The low prevalence of the epidemic in the country compared to other neighboring countries in the Asia Pacifi c region should not lead the government to believe that this character of the epidemic will continue and to remain complacent. Several key factors are present that could transform the current state of HIV/AIDS into an alarming situation and an explosive epidemic. These include the increasing population mobility as exemplifi ed by the increasing number of Overseas Filipino Workers (OFWs) who are infected with HIV, the thriving sex industry in the country – whether com-mercial or casual sex particularly amongst young people, high rates of sexually transmitted infections (STIs) in vulnerable sub-populations and their inadequate access to treatment, low and incorrect condom use and the invisibility of those infected.
Responses It was said that the early response of the country
towards the issues and concerns posed by the HIV and AIDS builds the strong foundation of the country’s AIDS programs. Since the fi rst case was reported in 1984, the government undertook immediate measures regarding the HIV and AIDS concern. In 1987, the AIDS Registry was put in place which enabled the monitoring of the disease. However, the passive nature of the program was limited in nature since it only cap-tured those individuals who submitted themselves for testing. In 1995, the Philippine National AIDS Council (PNAC) was created and tasked with developing a national strategy for the prevention and control of the disease in the country. Its most noted accomplishment was the creation and passage of the fi rst AIDS law in Asia – the Philippine HIV/AIDS Prevention and Control Act of 1998 (RA 8504). However, though the law is committed to integrating HIV prevention in education in various levels, in practice many girls and young women report receiving no education on sexual and reproductive health or HIV and AIDS in schools. Where such efforts do exist, the information is sometimes inaccurate and the teachers lack the confi -dence and skills to properly discuss it. Furthermore, sex education in the country is not institutionalized.
Locally, the responses to HIV/AIDS have the same key elements and strategies similar to that of the
It is worth to take note that since the majority of the people living with HIV in the country are in their prime working years, too often, and because of the extended nature of Filipino family, it is the elderly population or grandparents left to take care of the rest of the family, particularly the children when the parents of the latter become infected and eventually die of AIDS. Taking care of their orphaned grandchildren and in addition to their old age condition and failing health, add additional burden on them as they now have to look for economic sustenance for the entire family.

Winning the Numbers, Losing the War: The Other MDG Report 2010 111
national response. Since health was devolved in the country, the Department of the Interior and Local Government (DILG), in response to the HIV problem issued a Memorandum Circular in 1999 which man-dated the local government units (LGUs) to develop and implement programs and policies in consonance with the RA 8504. In general, local response to the epidemic has been limited and diffused. There were weaknesses in communication, coordination and coop-eration between the different LGUs in mustering efforts to combat the epidemic. This has further worsened with the devolution of the country’s health programs and internal problems, and confl icts within the LGUs like too much politicking.10
The counterparts and initiatives from various non-government organizations, local and international, have contributed much to the battle against the HIV epi-demic particularly on prevention and control focusing on information, education and communication among youth/adolescent and women sectors. However, some sectors are highly marginalized by receiving minimal attention from both the government and NGOs. Most notable among them are the injecting drug users or drug dependents and males having sex with males who account for the growing risk groups infected with HIV.10 Despite CSOs being one of the pillars of the country’s action against HIV, their sustainability is highly dependent on international and donor agencies making some of the projects donor-driven.
Financing and expendituresThe allocation for public health interventions is
necessary and critical in achieving the MDGs. However, it is a fact that health has been under prioritized as shown by the less than 3.5 percent share for the health sector in the Gross Domestic Product (GDP) in spite of the government’s proclamations of its commitment. The annual budget allocation, in line with the DOH’s; the local government unit’s fund; and various bilateral and international donors; fi nance the national preven-tion and control program of the epidemic.
However, since the budget for HIV and AIDS pro-grams is not exclusive from the DOH’s meager annual allocation, it competes with other programs. Based on the Operational Plan of the AMTP-IV (4th AMTP),
10 Simbulan, N.P.11 Philippines Country Review 2008 – AIDS Data Hub
Figure 4. Distribution of expenditures by spending category, Philippines 2006
From 2000 to 2007, the average total spending for AIDS was about Php 311 million (or approximately US$ 7,407,407). Domestic spending averaged Php 63 million (US$ 1,500,000) per year, while spending from external sources averaged Php 223 million (US$ 5,186,046). Greater than half of total spending is from external sources. In terms of spending by activity, prevention initiatives remain the highest followed by programme support costs, and treatment and care activities. (see Figure 4)
the fi nancial requirements for 2007 and 2008 was about Php 849million (US$ 20,214,286). Given the average total spending of about Php 311million (US$ 7,407,407) per year, there is a funding gap of about Php 227million (US$ 5,404,762) or Php 113.5million (US$ 2,702,381) per year.11
All in all, achievement of the HIV and AIDS target goal was generally ranked highly probable by the gov-ernment. However, several points must be considered regarding the assessment. First, there was an increase in the prevalence rate between 1999 and 2001. Though this is not often shown in the statistics since most of the time, accumulated cases from its fi rst detection in 1984 is combined with the fi gures in 2005. Another consid-

112 SOCIAL WATCH PHILIPPINES
eration is the high probability that the epidemic has a huge potential to explode. And lastly, the limited or the diminishing resources allocated by the government and other stakeholders could hamper the implementation of necessary programs to fully achieve the goal.
MalariaAbout 3 percent of the population in the Southeast
Asian region dies annually of malaria.12 Accordingly, half of the global community is at risk of malaria.
Malaria is a mosquito-borne disease that has been eradicated in North America, Europe and Russia, but still prevalent in Africa, Central and South America, the Middle East, the Indian subcontinent, and Southeast Asia including the Philippines. The country has been listed by the World Health Organization (WHO)
As shown in Figures 5 & 6, the global community has all the means and resources to prevent the emergence of new HIV/AIDS cases, reduce HIV related illnesses and death and mitigate the epidemic’s effects across various societies.
Figure 5. Total annual resources available for AIDS,1986-2007
Figure 6. Philippine Report of AIDS spending, 2005-2006
Source: 2008 Report on the Global AIDS Epidemic. UNAIDS
among the ten (10) malaria endemic countries in the Western Pacifi c Region. In the Philippines, 57 of the 79 provinces are malaria endemic13 (see Figures 7 & 8). However, 90 percent of cases are only found in 25 provinces.14 Only Cebu, Leyte and Catanduanes are malaria-free. In 2008, DOH declared six more provinces malaria-free, bringing the total to 22 out of 81 provinces. The provinces of Marinduque, Sorsogon, and Albay in Luzon; Eastern and Western Samar in the Visayas; and Surigao del Norte in Mindanao were de-clared malaria-free after having had no reported indig-enous cases for fi ve consecutive years. In 2006, Benguet, Cavite and Masbate were classifi ed malaria-free. The 13 other provinces were pronounced free of the disease in 1999, and remain so today.15 Malaria is a mirror of poverty in the Philippines. The areas where the disease
12 “MDG International Assessment 2010. UNDP.13 Philippine Malaria Country Profi le. 2008.14 Villanueva & Santiago. 2006. Combat HIV/AIDS, malaria and other diseases. 15 IRIN Website.

Winning the Numbers, Losing the War: The Other MDG Report 2010 113
Figure 7. Frequency distribution of reported malaria cases 1991-2001
is prevalent are among the most impoverished in the country where accessibility and availability of health information and services remains elusive, as most of them are in the rural and hard to reach areas.
The ADB report indicated that malaria is no lon-ger a serious health problem and no longer a leading cause of death in the country.16 In a separate article, malaria cases were said to have been decreasing since the 1990’s.17 However, recorded fi gures tell otherwise with an increasing trend from 1999 (see Figure 9 & Table 2). In 2006, the number of malaria cases was estimated to be 124,152 cases.18
Luzon46%
Mindanao53%
Visayas1%
Figure 8: Geographical distribution of malaria cases 2001-2005
16 ADB Report Chapter 5.17 Gonzales, E. Malaria in the Philippines. MB. March 29, 2010.18 WHO, World Malaria Report 2009 in GlobalHealthfacts.org.
Figure 9. Reported malaria by type and quality, 2004.
Source: Philippine Country Profi le 2004

114 SOCIAL WATCH PHILIPPINES
Table 2: Reported Malaria Cases19
1999 2000 2001 2002 2003
Philippines 37,061 36,596 34,787 37,005 43,644
Table 3: Reported Malaria deaths21
1999 2000 2001 2002
Philippines 755 536 439 71
Although it is no longer the leading cause of morbidity in the country, malaria is still a major public health threat. In 2006, malaria was the 9th cause of morbidity with a 27.6 rate per 100,000 population.20 In 2006, there were 222 deaths reported due to malaria. However, malaria national surveil-lance mechanisms vary differently in its quality and completeness thus giving little information on the real picture of the malaria burden in the country. Tables 3 & 4 show that the epidemic, in estimated average, declined for the past years in the country. However, aggregated data in the sub-national and regional level present another story. While some have made progress as evidenced by the decrease in reported cases, other provinces continue to have reported malaria incidence (see Figure 8).
Table 4. Malaria Morbidity and Mortality Rates
19 http://apps.who.int/globalatlas/dataQuery/reportData.asp?rptType=1 20 2006 FHSIS Report Health Status Statistics.21 Loc cit.22 “May pera pa ba?” Social Watch Philippines. 2006.
Source: Department of Health (DOH)
Year Morbidity Rate (per 100,000)
Mortality Rate (per 100,000)
1990 123 1.5
1995 86 0.9
1998 72 0.8
2005 55 0.17
2007 27.5 0.08
2008 24 0.06
Sustained comprehensive malaria control is cen-tral in achieving this particular MDG. The Philippine government, through DOH, implements the Malaria
Control Program (MCP). The DOH continues to implement the MCP using a multi-stakeholder ap-proach that is engaging the local government units, the civil society and the communities at risk. It is through the MCP that the government was able to generate funds and resources for its malaria control activities seeking the assistance of international donors – primarily, the Global Fund and the Roll Back Ma-laria Projects. However, these resources were mainly spent on training and capacity building leaving fund defi ciencies for the purchase of drugs, diagnostics and insecticides.
Furthermore, for the government to be able to halt and reverse the effect of malaria by 2015, it requires an estimated budgetary support of Php 1.727 billion yearly.22 The DOH, in its 2005 report which identified the available and needed funding for its programs for malaria and TB, indicated that from the presented budget above, only 21.65 percent is being financed through the national budget (1.11percent) while 20.54 percent is being financed by various overseas development assistance (ODA) programs. Clearly, there is a funding gap of Php 1.353 billion or 78.35 percent of total annual funding requirement. For the 2005 to 2015 Malaria MDG operations, the amount of Php 18.997 billion is required (see Table 5). However, the available fund is only Php 4.113 billion. Hence, the pro-jected 11- year financing gap for malaria alone is Php 14.884 billion – bigger than the entire annual budget of the agency (see Table 6).
Among others, educating the Philippine com-munities, particularly the indigenous peoples of the hinterlands, on the prevention of malaria remains a greater challenge in the implementation of the gov-ernment program. For instance, the belief among the Ata-Manobo in Davao del Norte ethnic areas is that malaria comes from the food or the leaves of certain

Winning the Numbers, Losing the War: The Other MDG Report 2010 115
Table 5. Annual estimated cost for programs and projects to fi ght Malaria23
trees.24 Traditional beliefs, considering the diverse cul-tures of the indigenous peoples of the country, should be taken into account in the development of interven-tion programs.
TuberculosisThe global burden of TB
According to the World Health Organization (WHO), tuberculosis kills 1.7 million people annually, most often in their prime and productive years25 and mostly in developing countries. From the 8.3 million
MDGs Programs and Projects Total Cost (P)
DOH Funding (P)
ODA Assistance (P)
Budget Gap (?) (P)
Treatment of Cases 9,217,687 0 9,217,687 0
Prophylaxis for Pregnant Women and Visitors
1,109,180,000 0 41,676,536 1,067,503,464
Laboratory Supplies 1,395,600 0 1,395,600 246,000,000
Insecticide Impregnated Mosquito nets 410,000,000 0 164,000,000 246,000,000
Indoor Residual Spraying 35,000,000 0 601,384 34,398,616
Capability Building, Research, TA, Equipments, etc.
162,309,683 19,200,000 137,509,683 5,600,000
Total 1,727,102,970 19,200,000 137,509,683 1,353,502,080 Source: DoH, 2005
Table 6. DOH Annual Budget 1993-2003
Year Annual Budget (Billions)
2003 9,900,000,000.00
2002 11,420,000,000.00
2001 9,260,000,000.00
2000 10,740,000,000.00
1999 11,300,000,000.00
1998 13,059,476,000.00
1997 11,020,083,000.00
1996 9,301,912,000.00
1995 8,647,889,000.00
1994 7,418,233,000.00
1993 7,262,829,000.00 Source: DOH
23 Ibid.24 IRIN website 25 Global Tuberculosis Control: A short update to the 2009 report. WHO 2009.26 What will it take to achieve the Millennium Development Goals?: An international assessment.UNDP. 2010.
reported cases in 2000, the UNDP reported that there was a global increase of 1 million new cases of TB in 2008 with the Asian region having the highest incidence accounting for 55 percent of new cases followed by the Sub-Saharan region.26
The Philippines ranks ninth on the list of 22 high-burden TB countries in the world, according to the WHO’s Global TB Report 2009. After China, it had the second highest number of cases in the WHO Western Pacifi c Region in 2007 (see Figure 10).
Figure 10: Estimated TB incidence rates, 2008
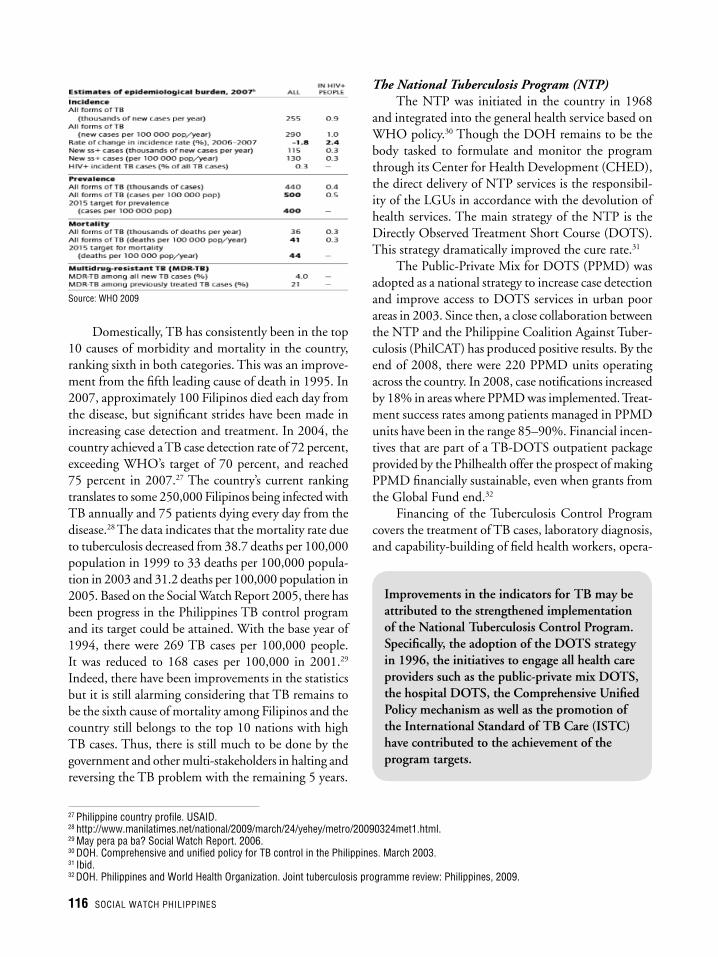
116 SOCIAL WATCH PHILIPPINES
Source: WHO 2009
Domestically, TB has consistently been in the top 10 causes of morbidity and mortality in the country, ranking sixth in both categories. This was an improve-ment from the fi fth leading cause of death in 1995. In 2007, approximately 100 Filipinos died each day from the disease, but signifi cant strides have been made in increasing case detection and treatment. In 2004, the country achieved a TB case detection rate of 72 percent, exceeding WHO’s target of 70 percent, and reached 75 percent in 2007.27 The country’s current ranking translates to some 250,000 Filipinos being infected with TB annually and 75 patients dying every day from the disease.28 The data indicates that the mortality rate due to tuberculosis decreased from 38.7 deaths per 100,000 population in 1999 to 33 deaths per 100,000 popula-tion in 2003 and 31.2 deaths per 100,000 population in 2005. Based on the Social Watch Report 2005, there has been progress in the Philippines TB control program and its target could be attained. With the base year of 1994, there were 269 TB cases per 100,000 people. It was reduced to 168 cases per 100,000 in 2001.29 Indeed, there have been improvements in the statistics but it is still alarming considering that TB remains to be the sixth cause of mortality among Filipinos and the country still belongs to the top 10 nations with high TB cases. Thus, there is still much to be done by the government and other multi-stakeholders in halting and reversing the TB problem with the remaining 5 years.
The National Tuberculosis Program (NTP)The NTP was initiated in the country in 1968
and integrated into the general health service based on WHO policy.30 Though the DOH remains to be the body tasked to formulate and monitor the program through its Center for Health Development (CHED), the direct delivery of NTP services is the responsibil-ity of the LGUs in accordance with the devolution of health services. The main strategy of the NTP is the Directly Observed Treatment Short Course (DOTS). This strategy dramatically improved the cure rate.31
The Public-Private Mix for DOTS (PPMD) was adopted as a national strategy to increase case detection and improve access to DOTS services in urban poor areas in 2003. Since then, a close collaboration between the NTP and the Philippine Coalition Against Tuber-culosis (PhilCAT) has produced positive results. By the end of 2008, there were 220 PPMD units operating across the country. In 2008, case notifi cations increased by 18% in areas where PPMD was implemented. Treat-ment success rates among patients managed in PPMD units have been in the range 85–90%. Financial incen-tives that are part of a TB-DOTS outpatient package provided by the Philhealth offer the prospect of making PPMD fi nancially sustainable, even when grants from the Global Fund end.32
Financing of the Tuberculosis Control Program covers the treatment of TB cases, laboratory diagnosis, and capability-building of fi eld health workers, opera-
27 Philippine country profi le. USAID.28 http://www.manilatimes.net/national/2009/march/24/yehey/metro/20090324met1.html.29 May pera pa ba? Social Watch Report. 2006. 30 DOH. Comprehensive and unifi ed policy for TB control in the Philippines. March 2003. 31 Ibid. 32 DOH. Philippines and World Health Organization. Joint tuberculosis programme review: Philippines, 2009.
Improvements in the indicators for TB may be attributed to the strengthened implementation of the National Tuberculosis Control Program. Specifi cally, the adoption of the DOTS strategy in 1996, the initiatives to engage all health care providers such as the public-private mix DOTS, the hospital DOTS, the Comprehensive Unifi ed Policy mechanism as well as the promotion of the International Standard of TB Care (ISTC) have contributed to the achievement of the program targets.

Winning the Numbers, Losing the War: The Other MDG Report 2010 117
tion of Public-Private Mix Department (PPMD) units, advocacy, monitoring and evaluation and other operat-ing expenses. In summary, an annual amount of Php 606.877 million is needed to fi nance the programs and projects to combat TB in the Philippines. Only Php 428.077 million is provided by DOH and ODA.33 A to-tal gap of about Php 178.8 million per year, or roughly Php 1.967 billion for the 2005 to 2015 operations, is still required to fi nance TB control.
The fi nancing gap in the full implementation of an effective TB program is only one among the require-ments that have to be fulfi lled. Similar factors have been enumerated such as chronic staff shortages, inadequate fi nancial resources, poor laboratory capacity, low ac-cess to quality care, and fl awed links between service providers in the public and private sector. The USAID had added that the social stigma that TB creates and the health seeking-behavior also limit the effi cacy of TB program implementation success.
Conclusions and RecommendationsHIV/AIDS
The two decades of HIV and AIDS initiatives and concerted efforts in the Philippines which were carried out by various sectors and stakeholders, both State and the non-state actors, have produced lessons and valu-able realizations that could serve as guideposts for the remaining years in the achievement of the MDGs. It should be stressed that HIV/AIDS is a development problem which poses a grave threat not only to a person’s health but to the country’s over all develop-ment. The government should adopt the rights-based approach in its programmatic response to HIV and AIDS since violations of human rights are risk factors to HIV.34 With the remaining fi ve years, intervention should consider the following:
1) Education is the best prevention. Because there is no cure for AIDS, prevention is critical and is the most cost-effective means of addressing the epi-demic.34 Empowerment of the people, particularly, the young and the women, through education and access to accurate and adequate information and services is an effective tool of preventing HIV transmission. This principle can be achieved through the institutional-ization of sexual and reproductive health programs intended for the youth, a member of the high- risk
group in the spread of the disease. This should include the incorporation of HIV prevention in the national school curricula and the creation of national guidelines that will facilitate their access to available services. Rec-ognizing their right as an individual who could make their own decisions, parental consent stipulated in the RA 8054 should not serve as a pre-requisite.
2) Ensure sustainability of fi nancing. Indeed, though money alone does not guarantee a long term victory over the epidemic, a comprehensive HIV/AIDS strategy cannot be sustained without a stable and ad-equate funding.
3) Strengthen Pre-departure Orientation Semi-nar (PDOS) extended to departing OFW’s with the incorporation of human rights orientation, HIV/AIDS education and ways of avoiding high-risk behaviors/practices. Raising the level of knowledge and under-standing of OFW’s on human rights particularly in the context of the Convention on the Protection of the Rights of all Migrant Workers and Members of their Families can help reduce their vulnerability to acquir-ing sexually transmitted infections (STI) including HIV/AIDS. Knowledge what their rights are as OFW’s, and the available complaint mechanisms and structures they can utilize when their rights are threatened and/or violated, will surely contribute in encouraging them to take action and defending their rights.
4) Raise the capability of local government units (LGUs) and national government agencies in the application of the rights-based approach in the various aspects of HIV/AIDS work and response. The rights-based approach is a process anchored on the principles of health and human rights. Mainstreaming the framework among local government units and other national agencies will greatly contribute in capacitat-ing State agents in developing policies, programs and services that more effectively and effi ciently address the HIV/AIDS problem and its root causes.
Malaria1. Ensure the availability of anti-malarial drugs/
medicines and the treatment of malaria patients.2. Conduct massive health education programs
and campaigns on malaria in malaria endemic areas of the country. The health education programs should give particular emphasis on the prevention and control
33 DOH 2005.34 Simbulan, N.P.
118 SOCIAL WATCH PHILIPPINES
aspects of the disease. Communities should be made aware of how environmental conditions contribute to the spread and persistence of the disease and how they can actively participate in the elimination of the dis-ease through effective environmental control measures adapted by the community.
3. Conduct a rapid assessment of the Malaria Control Program (MCP) in order to identify its strengths, gaps and weaknesses, and institute the neces-sary changes/adjustments in its implementation.
4. Institute reliable monitoring and docu-mentation mechanisms and systems in all malaria endemic areas of the country to be able to develop appropriate and culturally-sensitive intervention programs especially in communities populated by indigenous peoples.
5. Ensure the availability of suffi cient anti-malarial drugs/medicines in basic public health facilities particularly in the endemic areas of the country to sustain medication/treatment of those with malaria.
Tuberculosis1. Implement the DOH initiatives of Family
Package to cover children with primary complex and address the TB patient/s in every Filipino family.
2. Ensure the availability and sustainability of the DOTS program by involving the LGUs in ad-dressing TB cases.
3. Conduct a rapid assessment of the National TB Control Program, including the DOTS and PPMD strategies to be able to identify the strengths, gaps and weaknesses of the program and its implemen-tation. Institute the necessary changes/adjustments in the program. The effectiveness of DOTS should be gauged not only with the number of cases treated or cured in the community in a particular timeframe, but also with the number and rate of relapse cases. There is a need to evaluate the DOTS which primarily focuses on the biomedical and behavioral dimensions of the disease in the context of the broader societal environment of those infected and affected by the disease.
4. Institute a system of monitoring the imple-mentation of the NTC program
5. Intensify the information campaign on TB to raise public awareness on the disease and how to prevent and cure it, and control its spread. Develop IEC materials which are gender-sensitive, instructive, simple and with illustrations or drawings. These IEC materials should be made available in public health facilities particularly in areas/communities where there is a high incidence of TB.
6. Evaluate the extent and character of the problem on multi-drug resistance cases in order to effectively address the problem.
References
ADB Report Chapter 5.DOH. March 2003. Comprehensive and unifi ed policy for TB
control in the Philippines. DOH. 2009. Philippines and World Health Organization. Joint
tuberculosis programme review: Philippines.DOH. NEC. April 2010. Philippine HIV and AIDS Registry. FHSIS Report Health Status Statistics. 2006.Fourth AIDS Medium Term Plan: 2005-2010. Philippine National
AIDS Council.Gonzales, E. March 29, 2010. Malaria in the Philippines. MB. IRIN Website.Philippine Daily Inquirer. February 10, 2010. “ARMM doctors
alarmed by unreported HIV-AIDS cases”. “Philippines Fourth Progress Report on the Millennium Develop-
ment Goals (MDGs).” Third Draft, July 2010 (n.p.).Philippine Malaria Country Profi le. 2008.Philippines Midterm Progress Report on the MDGs. 2007.PNAC. 2010. Country report of the Philippines January 2008-De-
cember 2009. Simbulan, N.P. & Balanon, L. March 2003. “Confronting the HIV/
AIDS Problem in the Philippines: Challenges and opportunities” P2.
Social Watch Philippines. 2006. Moving forward with the Millen-nium Development Goals: May pera pa ba?
UNAIDS/WHO. 2008 Report on the global AIDS epidemic. July 2008.
UNDP. 2010. What will it take to achieve the Millennium Develop-ment Goals? An international assessment.
USAID. Philippine country profi le. Villanueva & Santiago. 2006. Combat HIV/AIDS, malaria and other
diseases. WHO 2009. Global Tuberculosis Control: A short update to the
2009 report. WHO, World Malaria Report 2009 in GlobalHealth-facts.org.

Not much time, but not without optionsA review of the Philippines’ progress on achieving the MDG on environment sustainability
Winning the Numbers, Losing the War: The Other MDG Report 2010 119
By JONATHAN D. RONQUILLO, RACHAEL O. MORALA AND REAGAN A. GABRIEL
Summary
O nly fi ve years remain before the deadline set to achieve the Millennium
Development Goals (MDGs). What does this mean?
Five years left to change a development path from one that dis-
regards the carrying capacity of the environment to one that recognizes the need
to address issues on the environment and natural resources especially in the face of
climate change, an urgent national development issue. Five years left to arrest the continued deterio-
ration of our ecosystems and increased pressure on our dwindling biodiversity. Five years left to make
concrete steps to ensure environmental sustainability, beyond what MDG 7 prescribes.

120 SOCIAL WATCH PHILIPPINES
Unwittingly, the fi rst ten years (2001-2010) of the MDGs fall within the former administration of Gloria Macapagal Arroyo. This period saw various national, regional and international conferences and commitments for the environment such as the UN millennium project and high-level conferences, United Nations Framework Convention on Climate Change (UNFCCC) conferences such as Conference of Parties (COP) 7 to COP 15, from Marrakesh to Copenhagen.
It was in these same ten years, however, that the country’s vulnerability to extreme weather events was ex-posed. For the ten year period the Philippines experienced various natural disasters affecting more than 28 million people with damages amounting to more than US $1.7 billion (see Table 1). It should be noted that these fi gures account for 83 percent of affected Filipinos and 60 percent in economic damages resulting from natural disasters in the last 20 years.
In a recent joint study conducted by the Philippine government, citizens’ groups, private sector, multilateral and bilateral development partners, the two (2) storms that hit the country in 2009 (Ondoy and Pepeng) severely affected 9.3 million people while estimated economic dam-ages and losses reached US$ 4.38 billion.1
Poverty and environmental degradation are in-terconnected. Livelihoods are mainly dependent on the utilization of natural resources. Ironically, resource poor
fi sherfolks, farmers, and indigenous communities, with marginal access to and control over resources, while at same time facing dwindling income due to depleted natural resources, are the very ones at the forefront of the vulnerable sectors as climate change, the biggest threat multiplier, looms.
While there are marked improvements in the specifi c targets related to MDG 7, the government must be care-ful in haphazardly concluding that the Philippines is well on track to achieving environmental sustainability. Especially considering that the MDGs are a set of mini-malist goals and MDG 7 in particular is not informed of the grave effects of climate change. The Philippines is a middle-income country where 14 million Pinoys already have internet access, there is no reason why it should not achieve the MDG targets.
Beyond the numbers and statistics, which paint a sup-posedly rosy picture for the country’s environment, there is a need for the government and other stakeholders to more objectively assess the impacts of our development track along with the policies and programs that were instituted as well as public fi nancing for the environment sector in the past MDG decade.
In this way both the government and non-government development stakeholders will have a more objective basis in developing a low-carbon, climate-sensitive development path—a clearer path for environment sustainability.
1 Typhoons Ondoy and Pepeng: Post Disaster Needs Assessment; November 2009.
Table 1: Top 12 Storms from 2001 to 2010 (sorted by number of total affected people and by economic damage cost)
Storms Date No Total Affected Damage (000 US$)
Ondoy 28/09/2009 4,901,763 237,489 Frank 21/06/2008 4,785,460 284,694 Pepeng 2/10/2009 4,478,491 591,996 Milenyo 27/09/2006 3,842,406 113,000 Reming 30/11/2006 2,562,517 66,400 Florita 28/06/2002 2,278,386 10,437 Feria 07/2001 1,902,654 68,565 Cosme 18/05/2008 1,496,668 99,174 Nanang 8/11/2001 1,060,147 6,000 Marce 25/08/2004 1,058,849 3,342 Henry 2/8/2006 1,037,886 135,000 Winnie 29/11/2004 1,018,965 78,200
Sources: Top 10 List of Natural Disasters from “EM-DAT: The OFDA/CRED International Disaster Database www.em-dat.net - Université Catholique de Louvain - Brussels - Belgium”. Names of storms from the Philippine Atmospheric Geophysical and Astronomical Services Administration (PAGASA).

Winning the Numbers, Losing the War: The Other MDG Report 2010 121
Questions and more questions on the official indicators
The National Economic Development Authority (NEDA) is currently undertaking a review process that seeks to determine the Philippines’ progress in terms of achieving the MDG’s. Specifi c to MDG 7 and the four (4) targets within the goal (see Table 2), the draft
report is optimistic about the country’s progress. This section of the paper presents results of the content analysis of the draft progress report as well as raises ad-ditional considerations that can help in more accurately understanding the state of our country’s environment and our status in terms of achieving environment sustainability.
Table 2: MDG 7 Targets and Offi cial Indicators
Source: Draft 4th Philippine Progress Report
Targets Indicators Status (from 4th Progress Report)
7.A: Integrate the principles of sustainable development into country policies and programs and reverse the loss of environmental resources
Since the right to a clean and healthy environment is enshrined in the 1987 Philippine Constitution, sustainable development would likely be achieved.
7.B: Reduce biodiversity loss, achieving, by 2010, a significant reduction in the rate of loss
Proportion of land area covered by forest
Official indicators state that the rate of deforestation has decreased and subsequently forest cover has increased. As of 2003, forest cover is at 7.2 million hectares or 24% of the total land area of the country
Ratio of area protected to maintain biological diversity to surface area
From 2006 to 2007, protected areas increased by 4, with a 19,800 hectare-area increase.
Energy use (kg oil equivalent) per $1 GDP (PPP)
(no data from report)
Carbon dioxide emissions (per capita) and consumption of ozone-depleting CFCs (ODP tons)
As of 2007, annual consumption of CFCs dropped to 143 metric tons from 603 metric tons in 2006 or a drop of 76.3%.
Proportion of population using solid fuels
(no data from report)
7.C: Halve, by 2015, the proportion of people without sustainable access to safe drinking water and basic sanitation
Proportion of population with sustainable access to improved water source, urban and rural
The proportion of population with clean and safe sources of water supply increased from 73.8% in 1991 to 81.5% in 2007 The probability of attaining the 86.9% target is high.
Proportion of urban population with access to improved sanitation
The proportion of population with access to sanitary toilet facilities increased from 71.8% in 1991 to 87.9% in 2007 The 85.9% target for access to sanitary toilet facilities has already been achieved.
7.D: By 2020, to have achieved a significant improvement in the lives of at least 100 million slum dwellers
Proportion of households with access to secure tenure (owned or rented)
Population living in slums with lack of access to sanitary toilet – 7.45% Population living in slums with lack of access to safe water – 10.87% Population living in makeshift housing – 1.94% Informal settlers – 5.42%

122 SOCIAL WATCH PHILIPPINES
Forestry There is a need to harmonize varying methodolo-
gies, systems and defi nitions of forests and forest cover to objectively determine baseline forestry data. The DENR forest cover estimates are based on the Food and Agriculture Organization (FAO) defi nition of forests which includes primary and semi-natural forests, productive and protective plantations and production areas.2 Consequently, offi cial indicators used in the draft MDG progress report do not take into account forest utilization. It does not distinguish whether forest growth is for “core-reserve” forest, production areas or even plantation forests.
An alternative defi nition, one that is more refl ec-tive of the need to protect our forests, is presented by the Ad Hoc Technical Expert Group on Forest Biological Diversity (AHTEG) of the Convention on Bio-Diversity. Forests are defi ned as “a functional ecosystem unit which should be conserved, used sus-tainably, and the benefi ts derived from it should be shared equitably.”
Establishing a clear baseline is critical, considering that the overall Philippine Greenhouse Gas (GHG) inventory contained in the Philippines Second National Communication3 (SNC) registered an astounding 81 percent decrease. This is, according to the SNC, mainly because of an equally fantastic ‘increase in the amount of emissions sequestered by the LUCF sector’, even offsetting combined increases in energy, agriculture and waste sectors. This comes as a surprise considering that the Philippines’ Initial National Communication in 1999 conservatively projected an increase in emis-sions from 100,738 ktons CO
2-eq in 1994 to 195,091
ktons CO2-eq in 2008 or an annual growth rate of
4.8% over 14 years.The much-touted newly forested areas really fall
under the Mining Forest Program of the DENR-MGB, a permutation of the “Adopt-a-Mountain Program”. Mining companies, with permits from the government, are actually mandated to reforest under the Mining Act of 1995. These newly-forested areas are in fact produc-
tion areas where access and rights are exclusive to the mining companies.
According to Alyansa Tigil Mina (ATM),4 the National Minerals Action Plan (NMAP) - part of the government’s mining industry revitalization program, lists priority mine sites for development that will encroach on almost 53 percent of ancestral domains of indigenous tribes and about 60 percent of protected areas. This means, that in effect, for-est reserves within ancestral domains and protected areas are converted to production forests which will eventually be cut.
The shift in the nature of the country’s forest cover from core reserve forests to production forests is also reinforced by the tenurial instruments issued by government. Areas covered by Integrated Forest Management Agreements (IFMA) and Industrial Tree Plantation Lease Agreements (ITPLA) have increased from 615,000 hectares in 2001 to 833,000 hectares in 2007. Over 5 million hectares have been covered by IFMA’s/ITPLA’s from 2001 to 2007.5 Community organizations and citizens’ groups have long criticized these forest tenurial instruments mainly because they tend to be permits directed for forest production ac-tivities instead of forest management and protection initiatives. Affected areas, mostly indigenous commu-nities, have also raised questions on these instruments’ disregard for communal and ancestral domain rights. Furthermore, there is also a need to assess the extent of protected areas that were excluded or dis-established to give way for energy development projects such as biofuels.
There is a need to present data that disaggregates forest cover data across types of forest utilization. There are indications that while forest production areas are increasing our reserve forest areas are dwindling. In this case, the increase in forest cover will be short term since trees within production areas are meant to be ‘harvested’ eventually, and long term environmental sustainability is compromised since our reserve forests are not effectively protected.
2 Global Forest Resource Assessment Update 2005: Terms and Defi nitions, FAO, 2004. 3 Enabling Activity for the Preparation of the Philippines’ Second National Communication on Climate Change to the UNFCCC. DENR,
UNDP, GEF. 2009.4 The Alyansa Tigil Mina (ATM) is a coalition of organizations and groups who have decided to collectively challenge the aggressive promo-
tion of large-scale mining in the Philippines. Composed of Non-Government Organizations, People’s Organizations, Church groups and academic institutions, the ATM is both an advocacy group and a people’s movement, working in solidarity to protect Filipino communities and natural resources that are threatened by large-scale mining operations.
5 DENR-FMB Forestry Statistics – Integrated Forest Management Agreement/Industrial Tree Plantation Lease Agreement (IFMA/ITPLA), Tree Farm And Agroforestry Farm Leases: 1977-2007.

Winning the Numbers, Losing the War: The Other MDG Report 2010 123
Biodiversity As of 2005, the Philippines is still listed as one of
the 25 biodiversity hotspots in the world according to Conservation International (see Figure 1).
According to the Philippine Clearing House Mechanism for Biodiversity, there are 234 protected areas (PA’s) under the National Integrated Protected Areas System (NIPAS) covering a total area of about 5,234 million hectares as of 2008. The offi cial indica-tors in the MDG progress report cite a 19,800 hectare increase in the PA’s covered. It also reported a signifi cant increase in plant species that are under the threatened species list of protected wildlife.
The two indicators cited in the progress report are actually inconsistent. If protected areas are increasing in coverage, why then are the number of threatened species increasing. The reason behind declaring pro-tected areas is to arrest the massive deterioration of biodiversity within these areas. This inconsistency actually indicates that protected area coverage only occurs on paper and minimal actual or even effective protection happens.
The Protected Area Management Board (PAMB) is the mechanism where area management plans, protection programs and activities are developed and implemented. Functional and effective PAMB’s determine the success of protection programs and activities within the protected areas. Data from the
Figure 1: Biodiversity Hotspots
DENR-PAWB show that a little over 150 PAMB’s have been established.. Among those that have been established, many of the PAMB’s are dysfunctional and are not convening largely due to non- allocation of and non- release of budgets from the Integrated Protected Area Fund.
A more accurate picture of the biodiversity situa-tion in the country, therefore, should not rely on the declarations establishing protected areas. It is neces-sary to ascertain whether protection activities within the established protected areas are actually and ef-fectively undertaken. Monitoring the performance of the PAMB’s gives us a more precise indication of the country’s situation in terms of biodiversity.
Coastal resources According to the 2005 Environment Monitor of
the World Bank that focused on the Philippine Coastal Resources, “the present status of coastal ecosystems in the Philippines is a cause for alarm. Almost all Philippine coral reefs are at risk due to the impact of human activi-ties, and only 4 to 5 percent remain in excellent condition. More than 70 percent of the nation’s mangrove forests have been converted to aquaculture, logged, or reclaimed for other uses. Half of the seagrass beds have either been lost or severely degraded, and the rate of degradation is increasing. Beaches and foreshore areas are under increasing pressures from rapid population growth and uncontrolled develop-

124 SOCIAL WATCH PHILIPPINES
ment, which leads to erosion, sedimentation, and water quality problems.”
The report also detailed the impacts of declining fi sh stock on resource poor fi sherfolks and communities that rely heavily on these resources for their livelihood. These communities remain at the margins of having access to and control over coastal resources. A poi-gnant reality considering the key roles played by these communities on community-based coastal resource management initiatives.
Water and sanitation (WATSAN) Offi cial data as of 2007 states that 82.9 percent
of Philippine households are with access to safe drink-ing water while 88.4 percent are with sanitary toilets. According to the draft 4th Philippine Progress Report, “the probability of attaining the 2015 MDG target to ensure that 86.9 percent of the population will have ac-cess to safe water is high. Furthermore, the 85.9 percent target for access to sanitary toilet facilities has already been achieved.”
There are data gaps related to access to water that need clarifi cation. In 2003, the DILG identifi ed 189 waterless municipalities.6 In 2009, the DILG Offi ce of Project Development Services (OPDS) listed 273 wa-terless municipalities that have not yet been reached by former PGMA’s priority program on water. This shows an increasing number of municipalities in the country that do not have access to safe drinking water.
While the offi cial numbers look good, the remain-ing 15.3 million Filipino households without access to safe drinking water and the 10.1 million Filipino households without access to sanitary toilets are, in fact, among the poorest of the poor who are supposedly the priority targets of the MDG’s.
The increase in water supply coverage is a result mostly of private sector initiatives with little or no government support. In this situation, areas that are considered not fi nancially lucrative, where the poor-est of the poor are located, get the least investment and are not targeted for priority coverage. Ideally, this should be an arena for government intervention which, however, has been limited since this is not a priority government program.
The indicators on water focus more on coverage (output) with little mention about initiatives at devel-oping and improving availability of water at the source.
While the MDG’s only call for the expansion of coverage, initiatives at the source such as watershed management must also be taken into account. This is considering that as of 2009, only 5 out of the 596 water bodies are still with watershed areas, according to DENR’s Inven-tory of Classifi ed Water Bodies. Also, the specifi c target and indicator on water only focus on the demand from households, bigger pressure in terms of water resource comes from the demands of agriculture and industries. These should also be taken into account.
Slum dwellers/Informal settlers Offi cial indicators report a decreasing trend in the
proportions of population lacking access to safe water, sanitary toilet facilities, and living in makeshift hous-ing, from 1991 to 2006. There are counter indications, however, that threaten the achievements identifi ed for this particular target in the MDG progress report.
The number of informal settlers is increasing. Also, the proportion of urban population living in slums is also expected to increase from 2007 to 2010. This is largely attributed to the displacement of fami-lies resulting from tropical storm Ondoy and typhoon Pepeng which devastated Metro Manila in 2009. As well as to the country’s rapid population growth of 2.04 percent, the highest average growth rate in South East Asia.
The growing inequity within urban areas and cit-ies coupled with the apparent vulnerability of urban poor communities, especially women and children, to climate change are not refl ected in the offi cial indica-tors on access to water, sanitation and decent housing, which are in fact survival indicators.
Beyond these survival indicators, government must equally give importance to building sustainable cities based on the equal rights to the city framework as en-shrined in the Habitat Agenda. This entails a) mapping the risks and vulnerabilities of cities to climatic and geologic events such as fl oods, sea level rise, landslides and earthquakes; b) providing sustainable livelihood and employment opportunities; and, c) providing accessible and green technology, infrastructure, trans-portation and communications.
The development pace of urban areas and cities must be slowed down. Business-as-usual urbanization must be reconsidered. This is a must if the government wants to deliver its commitments, not just on the
6 Ronquillo, J.D. and Morala, R.O., P. 12, Environmental Insecurity: The Cost of Mis-Governance, 2007.

Winning the Numbers, Losing the War: The Other MDG Report 2010 125
MDG’s, but more importantly, on building sustain-able human settlements within inclusive and greener cities.
Air quality Offi cial indicators report that the consumption of
Ozone Depleting Substances (ODS) has signifi cantly decreased from 2000 to 2007. But this is expected since the Philippines is neither a major producer nor importer of ODS.
The more telling indicator on air quality deals with maintaining acceptable levels and the monitoring of Total Suspended Particulates (TSP).
According to the DENR-EMB Report on the 10th Year anniversary of the Clean Air Act in 2009, the National TSP Ambient Air Quality (see Figure 2) has improved from 2004 to 2008 but is still above the an-nual guideline value which has been set at 90 ug/Ncm. The report also details the three major sources of air pollution (see Figure 3): 1) mobile sources (vehicle emissions) accounting for 65 percent; 2) stationary sources (factories and industries) accounting for 21 percent; and, 3) area sources (dumpsites and landfi lls) accounting for 14 percent.
Still, there is a need to review the data reported by the DENR-EMB. With the bulk of air pollution coming from vehicle emissions, there is a need to assess the enforcement and regulatory mechanisms of vehicle emission testing, given that there are reports on the prevalence of non-compliance, red tape and corrup-tion. On stationary sources such as factories and other industries, the Continuous Environment Monitoring System (CEMS) has been adopted. However, compli-ance is hinged on the fair and accurate self-monitoring of industries. Checks implemented by the DENR are scheduled and announced.7 These practices compro-mise the accuracy of the DENR-EMB report.
Another way to monitor the status of air quality in the country is by tracking the establishment of and performance of airshed governing boards. As part of the National Air Quality Improvement Framework and National Air Quality Control Action Plan, DENR has designated 18 airsheds (see Table 3) in the Philippines, 13 of which are located in key urban cities and 5 are regional geothermal airsheds.
As stated in the Clean Air Act, to effectively govern and draw-up plans, a multi-sectoral Airshed Governing
Figure 2: National TSP Ambient Air Quality Trend (2004-2008)
Source: DENR-EMB Report on the Clean Air 10 Conference
Figure 3: National Emission Inventory, 2006
Source: DENR-EMB Report on the Clean Air 10 Conference
6 Contained in DENR Administrative Order 2007-22.
Board is supposed to be set-up in each of these airsheds convened by the Secretary of the DENR and composed of the Governor, Mayors, NGOs, POs and private sector representatives. However, there are diffi culties in convening these boards because of lack of quorum and lack of budget, as the DENR-EMB Report on the Clean Air 10 Conference points out.
Such was the case of the Metro Cebu Airshed Board that started plans to convene as early as 2002 but was only able to actually convene last January 20, 2009, ten years after the passage of the Clean Air Act.

126 SOCIAL WATCH PHILIPPINES
Table 3: Designated Airsheds
Regular Airsheds Geothermal Airsheds
1. Metro Manila Airshed (NCR, Regions III & IVA) 2. Northeastern Pangasinan (Region I) 3. Metro Tugegarao (Region II) 4. Baco, Naujan, Calapan (Region IVB) 5. Naga City (Region V) 6. Metro Iloilo (Region VI) 7. Metro Cebu (Region VII) 8. Zamboanga City (Region IX) 9. Cagayan de Oro (Region X) 10. Davao City (Region XI) 11. Agusan del Norte-Butuan City (Region XII) 12. South Cotabato (Region XIII) 13. BLIST: Baguio, La Trinidad, Itogon, Sablan, Tuba (CAR)
1. Southern Negros Geothermal (Region VI) 2. Bacod-Manito Geothermal (Region VIII) 3. Leyte Geothermal (Region VIII) 4. North Cotabato Geothermal (Region XII) 5. Makiling-Banahaw Geothermal (Region IVA)
Source: DENR-EMB Report on the Clean Air 10 Conference
If Airshed Boards are not convened, air quality improvement and monitoring plans cannot be fi nal-ized and submitted for funding from the Air Quality Management Fund (AQMF), a special account in the National Treasury administered by the DENR for Air Quality improvement projects. According to the DENR, from 2002 to March 2009, the AQMF has reached Php 229,147,894.30 and that these funds were unused by the Airshed Boards.
Lost decade for MDG 7Given the assessment points related to the offi cial
indicators presented in the MDG Progress report as discussed above, it is diffi cult to share the optimism presented in the 4th Philippine MDG Progress report particularly in terms of achieving the MDG targets on environmental sustainability. A broader and more substantial investigation of facts, and actual ‘on the ground’ realities, point to the more disquieting condi-tion of our environment.
In a recent study by Germanwatch,8 the Philip-pines was ranked eighth among all countries in terms of vulnerability to climate change. This fact alone exposes the fl ailing condition of our environment. Un-derlying the country’s vulnerability to extreme weather events is the reality that we have taken for granted the nurturing of our soils, forests, seas, coasts and urban communities.
What could have been a decade of restoring the health of our natural resources, of developing the re-
silient capacity of both our rural and urban communi-ties, of climate proofi ng our environment was lost to non-prioritization, weak implementation of policies, and lack of support. The discussions below further elucidates on the fragile status of our environment resulting from environment related policies, programs and fi nancing issues.
Status and progress of the environment in terms of the 3 P’s: Policies, Programs and “Pondo” (Funds)On environmental policies and programs
The Philippines is one of the most over-legislated countries, more so when it comes to environmental laws. There are legislations covering the green, brown and blue environments. To date, the Philippines has over 100 environment-related legislations, several of which were enacted under former PGMA’s term and include the following:
1. National Caves and Cave Resources Manage-ment and Protection Act of 2001;
2. Wildlife Resources Conservation and Protec-tion Act of 2001;
3. Mt. Kanla-on Natural Park (MKNP) Act of 2001;
4. Philippine Plant Variety Protection Act of 2002;
5. Clean Water Act of 2004;6. National Environmental Awareness and Edu-
cation Act of 2008;7. Climate Change Act of 2009;
8 Harmeling, Sven. Global Climate Risk Index 2010. December 2009.

Winning the Numbers, Losing the War: The Other MDG Report 2010 127
8. Organic Agriculture Act of 2010;9. Disaster Risk Reduction and Management Act
of 2010; and,10. R.A. 10067 Establishing the Tubbataha Reefs
as Protected Areas under the NIPAS.The past 10 years were admittedly marked with
landmark environment-related legislations. In addi-tion, the former PGMA administration has also issued various Executive Orders, most recent of which were issuances on the adoption of integrated coastal manage-ment and the Coral Triangle initiative.
Still, policy-action inconsistencies and gaps re-main.
Maximizing mineral resources as drivers of growth
Growth and pump priming of economic develop-ment were clearly the priorities set by the 2004-2010 MTPDP. It views the natural resources sector as under-utilized. A glaring inconsistency with the baseline being put forward by citizens group’s that the exhaustion of the country’s environment and natural resources has reached its peak carrying capacity, even as early as the Philippine Agenda 21 processes. While the 2004-2010 MTPDP recognized the relation of rural poverty and mismanagement of natural resources and prescribed directions for conservation efforts, the general tone of its policy and program directions are more inclined to-wards maximizing the potentials of our natural resource base as drivers for growth.
Concretely, this is expressed in the MTPDP’s thrust to revitalize and put in full swing initiatives on mining. Increased employment opportunities and economic gains are hinged on the promise of heightened investments in mining. According to the DENR-MGB, the industry has employed a total of 996,000 persons and total investments amount to US$ 2.8 billion from 2004-2010. According to former DENR Sec. Horacio Ramos, the contribution of the mining and quarrying sector to the country’s gross domestic product (GDP) signifi cantly increased to Php 100.5 billion or 1.30 percent of GDP in 2009, as compared with Php 21.6 billion or 0.6 percent of total GDP in 2000.
Big numbers, but the question on whether these promising numbers in fact contribute to the country’s sustainable development, remains.
Habito9 stated: “Forward linkages are likewise weak, with a forward linkage index of 0.82 indicating forward linkages are also well below the average across industries. This is no surprise, given that much of the industry’s output is exported in primary form (e.g., as raw mineral ore), with little further processing within the country. Thus, even as mining advocates like to argue that the products of mining fi nd their way into most products we use in our daily lives, these forward linkages are not occurring within the Philippines at this time. The direction for us is clear: We need to have more domestic processing and value-adding of mining output to widen the domestic linkages of the sector. Only then could growth in the sector be more inclusive. Until then, the fabulous wealth to be had from mining would line very few pockets.”
The solid push to revitalize the mining industry is also evident in the various executive orders aimed at de-restricting foreign investments and ensuring execu-tive prerogative in the industry, to the detriment of other promised ‘green initiatives’. The so-called green jobs in fact refer to persons employed in the mining industry.
Green jobs must be on more sustainable pro-grams such as forest wardens for reforestation within CBFM areas, bantay dagat (sea wardens) for CBCRM initiatives, and organic agriculture practitioners and farmers.
The former PGMA administration was undoubt-edly effective in pushing for the revitalization of the mining industry. In fact, former Pres. Arroyo was con-ferred the fi rst ‘Ang Minero’ Award by the Philippine Mine Safety and Environment Association (PMSEA) for her “unparalleled leadership and support in bring-ing enlightenment to government agencies and private companies to review and align their ways alongside the principles of sustainability and responsible mining, opening the door to equitable growth and enlightened investment.” To illustrate the obvious inconsistency in former PGMA’s pro-mining for environment sustain-ability policy stance, the ‘Ang Minero’ award was given to her at the Testimonial organized by the DENR for President Arroyo dubbed as ‘Sustainable Development in Natural Resources: The Arroyo Administration Natural Resources Legacy.’
Equally alarming is the increasing small-scale mining activities. These are causing more damage to
9 Habito, Cielito. Is Mining Growth Inclusive? Philippine Daily Inquirer. June 6, 2010.

128 SOCIAL WATCH PHILIPPINES
the environment since small-scale mining activities happen under the radar because management, from granting of permits to monitoring environmental safety standards, are lodged with the Governor-led Provincial Mining Regulatory Board and not with the DENR. Investors, who are avoiding the prying eyes of environment advocates and cutting on red-tape start-up costs, are also increasing investments in small-scale mining. These activities undermine the original intent of the small-scale mining law that supposedly prescribes preferential rights and use and access by the immediate communities in a particular small-scale mine site.
Mining as an extractive industry has taken its toll on the environment with many areas even covering ancestral domain, watersheds and forest areas. The concept of sustainable mining is a myth, as shown by mining-related disasters such as the Marcopper Mine in Marinduque, Rapu-Rapu in Albay, Placer in Surigao del Norte, Masara in Compostela Valley and Itogon, Benguet among others.
To permit and protect: DENR’s mandateThe dual role of DENR as the protector of our
environment and natural resources and the granting of permits and licenses to exploit the same environ-ment and natural resources has long been criticized. Unfortunately, the DENR has been more effi cient in the latter.
This was most evident when an immediate past Secretary of DENR, Mike Defensor Chair of NiHao Mining and Geograce Mining Corp. inked a multi-million dollar mining deal that was witnessed by no less than former President Arroyo.
Forest production versus forest protectionThese policy and program directions also rebound
to the departments. The DENR has clearly been more focused on its mining revitalization program than its other programs. It has also been more active in grant-ing forest tenurial instruments such as the IFMA and ITPLA, often criticized for being more inclined to forest production instead of protection activities, and reforestation programs including Community Based Forest Management (CBFM).
Energy mix-up The DOE, while recognizing the country’s poten-
tial for renewable energy (RE) in the Philippine Energy Plan, is still more inclined to implement programs based
on non-renewable energy. RE projects remain at pilot stages and only account for a small percentage in the Philippines energy mix. In contrast, non-renewable energy projects such as exploration and grant contracts for coal and oil are currently at full swing and remain the principal source of RP’s energy.
The promise of green revolution The DA is still biased on chemical intensive agri-
cultural practices and still pushes for increased chemi-cal fertilizer and pesticide use to increase agricultural productivity. While there are initiatives on organic agriculture, these remain at pilot stages and are in fact geared more towards balanced fertilization.
The DA’s framework of simultaneously promoting biotechnology, genetic modifi cation and engineering and sustainable agriculture is a myth of co-existence.
Rent seeking in natural resources The most glaring form of rent seeking in the
Philippines comes in the form of permits, licenses, contracts and other fi nancially rewarding concessions. This is especially true when it comes to natural resources and projects related to it. It is also in this sector where the interplay and role of Philippine corporations as dummies are more vivid. This is aggravated by the perennial ineffi cient enforcement and corruption in implementing safeguards related to environmental protection. Supposed stringent requirements for per-mits and licenses can be ‘expedited’ at ‘packaged rates’ such as steps in securing Environmental Compliance Certifi cates (ECCs), Free, Prior and Informed Consent (FPICs) and other mandatory requirements.
What’s the score of our environment, really?Updating and fi lling-in the gaps of the baseline
data of the Philippine environment has not been a priority for the past 10 years. Offi cial data tends to be outdated and often based on modeling and interpola-tions. Allocations for research and baseline gathering remain low and are often foregone in favor of concerns that are more urgent and in-line with the current priori-ties of the government.
This puts to the fore the urgency of enacting the national land and water use plan bill. Updating and fi nishing the mapping and delineation of forests must also be prioritized. Government must also invest in baseline updating for disaster risk reduction such as the geo-hazard maps prepared by the Mines and Geo-

Winning the Numbers, Losing the War: The Other MDG Report 2010 129
science Bureau (MGB) but funded by the Australian Government. In addition, these geo-hazard maps must be incorporated with existing geologic maps as input in determining priority sites for mining beyond economic viability.
Incoherent, inconsistent and plagued with policy action gaps are the characteristics of former PGMA’s environment-related policy and program directions from 2001-2010. In the span of almost ten years, en-vironment initiatives were ‘business as usual’ even in the face of climate change.
On fi nancing for the environment From 2002 to 2010, fi nancing for the environ-
ment has been consistent with the former PGMA administration’s policy and program directions but inconsistent with the goal of ensuring environmental sustainability.
Table 4: Share of DENR Budget to GAA
*Reenacted Budget; Source: 2002-2010 GAA
*Reenacted Budget; Source: 2002-2010 GAA
Table 5: Share of MGB to DENR Budget
FY Total MGB Total DENR % of MGB to DENR
2002 409,487,000 6,530,852,000 6.27
2003 389,617,000 4,972,931,000 7.83
2004* 389,617,000 4,972,931,000 7.83
2005 402,451,000 5,511,256,000 7.30
2006* 402,451,000 5,511,256,000 7.30
2007 542,353,000 7,110,820,000 7.63
2008 545,984,000 8,117,844,000 6.73
2009 630,077,000 12,391,130,000 5.08
2010 542,522,000 12,190,629,000 4.45
FY Total DENR Total GAA % of DENR to GAA
2002 6,530,852,000 554,008,751,000 1.18
2003 4,972,931,000 561,907,000,000 0.89
2004* 4,972,931,000 561,907,000,000 0.89
2005 5,511,256,000 597,663,400,000 0.92
2006* 5,511,256,000 597,663,400,000 0.92
2007 7,110,820,000 819,162,469,000 0.87
2008 8,117,844,000 1,066,179,857,000 0.76
2009 12,391,130,000 1,170,318,753,000 1.06
2010 12,190,629,000 1,304,406,400,000 0.93
Since 2002, allocations to the environment and natural resources sector remained at 1 percent or less of the total General Appropriations Act (GAA) (see Table 4).
Funding allocation for the implementation of the Mining Act has been consistent since 2002. A total of almost Php 4.3 billion has been allocated to MGB where operations for the implementation of the Mining Act are lodged. This takes up an average of 6.7 percent of DENR’s total annual budget (see Table 5).
In contrast, funding allocations for protected areas, biodiversity conservation, reforestation and implemen-tation of environmental laws such as the Clean Air Act, Solid Waste Management Act among others, are either erratic, low or completely without allocations and con-tinue to be a low priority since 2002. A total of only Php 2.3 billion has been allocated for protected areas and wildlife management under PAWB from 2002-2010.

130 SOCIAL WATCH PHILIPPINES
This takes up only 3.4 percent of DENR’s total annual budget (see Table 6).
To cap it all, allocations for much needed environ-mental initiatives such as protected areas, biodiversity conservation and reforestation that are included in the GAA are not released or impounded by the Offi ce of
the President (see Table 7). For 2009 alone, impounded allocations totaled Php 1.1 billion.10 The much touted Php 1 billion budget for reforestation dubbed by the government as the biggest single year allocation from the regular budget in the history of forestry was not released.
Table 6: Share of PAWB to DENR Budget
FY Total PAWB Total DENR % of PAWB to DENR
2002 183,306,000 6,530,852,000 2.81
2003 178,228,000 4,972,931,000 3.58
2004* 178,228,000 4,972,931,000 3.58
2005 204,646,000 5,511,256,000 3.71
2006* 204,646,000 5,511,256,000 3.71
2007 207,698,000 7,110,820,000 2.92
2008 240,027,000 8,117,844,000 2.96
2009 479,555,000 12,391,130,000 3.87
2010 474,795,000 12,190,629,000 3.89 *Reenacted Budget; Source: 2002-2010 GAA
Table 7: List of Impounded Funds in the 2009 GAA
Particulars Total Budget (GAA)
Amount Released
Variance Total Budget less Amount Released
Development and rehabilitation of the Mt. Apo National Park 15,000,000 992,000 14,008,000
Pawikan Conservation Project 20,000,000 2,115,000 17,885,000 Tamaraw Conservation Project 20,000,000 - - Development and Rehabilitation of Tubbataha Reef 20,000,000 - -
Development and Rehabilitation of Apo Reef 20,000,000 - -
Development and Rehabilitation of Mts. Banahaw and San Cristobal 15,000,000 - -
Development and Rehabilitation of Mt. Kitanglad 10,000,000 - -
Development and Rehabilitation of Northern Negros National Park 15,000,000 - -
Development and Rehabilitation of Central Cebu National Park 15,000,000 - -
SUB-TOTAL 150,000,000 3,107,000 146,893,000 Comprehensive Livelihood and Emergency Employment Program for Reforestation (CLEEP) 1,000,000,000 - -
TOTAL IMPOUNDED FUNDS 1,146,893,000
10 La Liga Policy Institute, Financing Climate Change Actions: A Must for the 2010 Budget, 2009.
Source: La Liga ABI-ENVI Budget Tracking

Winning the Numbers, Losing the War: The Other MDG Report 2010 131
Problems and gapsIncoherent and climate insensitive state policies on the environment
The current MTPDP is the most glaring policy inconsistency with regard to ensuring environmental sustainability. It prescribes a business-as-usual atti-tude in environment and natural resources manage-ment. It is clearly uninformed of the realities and challenges of climate change. It views the state of natural resources as under-utilized and as such maxi-mizes potentials particularly of mineral resources for growth, without regard to calls for a slow-down in mining operations or even to lessons from environ-ment-related disasters.
The 10-year former PGMA administration has enacted landmark environmental legislations but follow-through actions were evidently lacking, most critical of which is ensuring budget allocations for these legislations.
If there is anything consistent with the former PGMA administration’s policies, these are the marching orders given by the former President on her SONAs, they were all consistent with her push for growth but inconsistent with environmental sustainability.
Growing policy-action gap Talk is cheap, but actions and inactions that con-
tribute to environmental insecurity comes at a hefty price, lives lost, livelihoods threatened and communities and families displaced and impoverished.
The multitude of policies and the interlocking di-rectorate of institutional arrangements and implement-ing mechanisms of government are not evident in the state of our environment and natural resources.
Misplaced and climate insensitive fi nancing priorities
Since 2007, the Alternative Budget Initiative-Envi-ronment Cluster (ABI-ENVI) led by the La Liga Policy Institute has been advocating for a ‘greener’ General Appropriations Act (GAA). It noted that since 2001, allocations for the environment and natural resources sector remained at less than 1 percent of the total GAA, way below the levels allocated by our neighbor-ing countries, way below what is expected to provide a minimum gain for environmental sustainability, and way below the priority list of government.
A closer look at the GAA from 2002 to 2010 reveals the low priority given to the environment and
natural resources sector particularly items on refores-tation, protected areas and biodiversity conservation that receive minimal allocations. It also reveals the real priorities of government aimed at maximizing natural resources as drivers of growth given the consistent allocations given to activities to revitalize the mining industry.
In its 2009 and 2010 budget advocacy, the ABI-ENVI pushed for bigger budget allocations directed at climate change adaptation and mitigation initiatives around the following priorities:
1. Disaster response and risk reduction;2. Renewable/sustainable energy systems; 3. Biodiversity, sustainable agriculture, fi sheries
and forestry; 4. Clean and green industrial technology; and,5. Ecological waste management.These priorities were aimed at establishing in-roads
to make the GAA climate sensitive. While substantial alternative budget proposals were adopted in the GAA, much needs to be done in order to achieve a climate sensitive budget.
The issue of impounded funds is also of serious concern. The Php 1.1 billion impounded funds for 2009 alone, mostly covering alternative budget propos-als adopted in the GAA, highlights the need for citizens groups such as the ABI-ENVI to track actual releases of allocated funds. It also highlights the need for govern-ment to improve spaces for engagement in the whole budget process, from department-level budgeting, to congressional proceedings up to tracking of disburse-ments of GAA budget items.
Lack of reliable, updated and accessible state of the environment baseline
Reliable, updated and accessible information on the condition of our environment is crucial for a sound policy, program and fi nance formulation and planning. If we are to effectively infl uence government to adopt a climate sensitive ‘3 Ps’, we must have a well-grounded baseline to begin with.
This is most urgent in the face of climate change. Effective disaster risk reduction initiatives must be in-formed of the current state of our environment. While baseline information generated by the private sector is of big help, the government must take the lead in investing in building a comprehensive database on the environment, preferably using IT-based platforms that are already available.

132 SOCIAL WATCH PHILIPPINES
Untapped potentials and lack of support to LGU initiatives
The top-down approach is still the prevalent char-acter of initiatives on the environment and natural re-sources sector. National government agencies are given numerous other tasks that often relegate environment concerns to the bottom of their priority list. Conse-quently, resources and implementing mechanisms are tied-up at the national level and LGUs are treated as benefi ciaries instead of partners.
LGUs are at the forefront of environment-related challenges such as climate-related disasters. Given the limited fi nancial and technical support provided by the national government to LGUs, mostly at the reac-tion end such as the calamity fund, more and more LGUs are building their capacities for innovative local government approaches. These include mitigation and adaptation initiatives such as renewable energy, natural resources management, sustainable/organic agriculture and ecological waste management.
Conclusions and RecommendationsPush for climate sensitive ‘3 Ps’: Policies, Programs and “Pondo”
We must be able to effectively engage the incoming government in crafting a new MTPDP. For the next MTPDP to be climate sensitive, it must go beyond mere achievement of the MDG’s. It must be able to recognize climate change as an urgent national devel-opment issue that needs to be integrated in the overall government ‘3 Ps’.
Consequently, we must be able to effectively en-gage the national government agencies involved in the environment and natural resources sector in formulat-ing their respective priority programs and budgets.
Finally, we must be able to infl uence the budget process by building on previous gains and creating more spaces for citizen participation.
Professionalize the enforcement, regulation and monitoring of policies on the environment
Clearly, the Philippines is not wanting on environ-ment policies. Effective enforcement, regulation and monitoring of such policies is severely lacking mainly due to the customary rent seeking culture that breeds in the system of securing permits, licenses and concessions to exploit our natural resources.
Professional management of these policies founded on fairness, transparency and accountability should be
the norm instead of political accommodation, patron-age and transactional politics. If the government can be as effective in enforcing these policies as much as they have been in enacting them, substantial reforms for the environment will have a better chance.
Update the Philippine environment baselineGovernment must invest in a comprehensive
updating of our baseline environment condition using current available technology. We need to know the up to date status of our ecosystems in order to make the necessary recommendations for the government’s “3Ps”. Apart from knowing the vulnerable areas, an updated baseline can provide key inputs for climate change adaptation and mitigation initiatives.
Increase support to LGU cluster approachto environment sustainability
The national government must increase its support to LGU clusters. These are contiguous LGUs forming a cluster geared towards co-equally and collectively managing and formulating plans for their natural re-sources that in the end will benefi t their respective constituencies.
LGU cluster initiatives have greater chances of suc-cess since check and balance is inherent among co-equal local chief executives. In addition, since ecosystems are contiguous, the scale of natural resources management will also have a greater impact than initiatives cover-ing a single town. A campaign against illegal fi shing for example, will have less of an impact if only 1 town will implement it while 4 of its nearby towns condone illegal fi shing.
Pursue public-private partnerships Public-private partnerships have been effective in
environment-related projects, especially in terms of providing much needed human, technical, fi nancial, and research and development requirements. Partner-ship with the private sector, however, should not be limited to businesses but should include recognition of the role of non-government organizations, people’s and citizens’ organizations.
At the same time, there is a need to strike a balance between profi t and service in these types of projects. This is where the roles of government and private part-ners must be clarifi ed. In water projects for example, while private partners can be effective in terms of ex-panding coverage to potential profi t areas, government
Winning the Numbers, Losing the War: The Other MDG Report 2010 133
must be able to provide for non-profi t areas where the poorest sectors are. Also, government must take the lead in sustainable management of resources such as watersheds in this case.
Separate the protection from permit granting functions of the DENR
Considering that the DENR has long been criti-cized for its dual function of protector and granter of permits for the environment and since it has been more effective in the latter, a separate agency or office must seriously be considered. Instead of an added bureaucracy, this step can be viewed as streamlining and rationalization of functions. In terms of additional costs, the government can em-ploy the performance and outcome-based budgeting to rationalize costs.
Make environmental pollution information public
What is the status of our forests, rivers, seas and air? What pollutes or destroy our ecosystems? Who are the polluters in our country? Information on these questions must be made available to the public through the web. This of course presumes that the environment baseline data has already been updated and enforcement of policies has been professionalized.
Apart from contributing to public awareness on environment issues, making the information public can also exert pressure to non-complying polluters as well as erring public offi cials.
Prosecute an iconic environmental criminal To set the tone and deliver the message that the
next administration will mean business in taking the necessary steps for environmental sustainability, it must prosecute, using all available legal remedies including the recently approved ‘writ of kalikasan’, a well-known, well-entrenched individual or corporation that has blatantly violated environment policies.
References
ADB. April 2009. The Economics of Climate Change in Southeast Asia: A Regional Review.
Alyansa Tigil Mina. Frequently Asked Questions. www.alyansa-tigilmina.net.
Archival, N. D. Airshed Governing Board: The Cebu Experience. PowerPoint Presentation. 2009.
Atienza, J. L. Revitalizing Philippine Mining: From Policy to Prac-tice. PowerPoint Presentation. February 2008.
Cammack, D. R. December 2007. Overseas Development Institute. Understanding the Political Economy of Climate Change is Vital to Tackling It.
Christine, K. I. 2010. Environmental Performance Index. Conservation International. Biodiversity Hotspots. www.biodiver-
sityhotspots.org. Department of Budget and Management. 2010. General Appropria-
tions Act.2002-2010. www.dbm.gov.ph. DENR Administrative Order (DAO) No. 2007- 22. July 2007. Guide-
lines on the Requirements for Continuous Emission Monitoring Systems (CEMS) and other acceptable protocols, ‘Thereby modifying and clarifying certain provisions of Section 5, Rule X of DAO 2000-81 and other related provisions.
DENR. Ensuring a “Greener” Legacy for Filipinos. www.denr.gov.ph.
DENR Administrative Order (DAO) No. 8. 2004. Revised Chemical Control Order for Ozone Depleting Substances (ODS).
DENR Sec. Ramos cites gains in natural resources management under Arroyo administration. www.denr.gov.ph. DENR. Down-loaded June 11, 2010.
DENR-EMB. 2009. Ten Years of Clean Air Act Implementation. PowerPoint Presentation.
DENR-FMB. Integrated Forest Management Agreement/Industrial Tree Plantation Lease Agreement (IFMA/ITPLA). Tree Farm and Agroforestry Farm Leases: 1977-2007. Philippine Forestry Statistics. http://forestry.denr.gov.ph.
DENR-MGB. July 2005. Priority Mineral Development Projects in the Philippines. PowerPoint Presentation.
DENR-PAWB. List of Proclaimed Protected Areas under NIPAS. www.pawb.gov.ph.
DENR, UNDP and ACB. 2009. The 4th National Report to the Convention on Biological Diversity.
DENR, UNDP, GEF. 2009. Enabling Activity for the Preparation of the Philippines’ Second National Communication on Climate Change to the UNFCCC.
DILG Offi ce of Project Development Services. Statistics. Millen-nium Development Goals Achievement Fund. www.mdgfund.org/country/Philippines.
DOH. 2004 – 2008. Annual Reports. National Epidemiology Center. Field Health Services Information System.
EM-DAT: The OFDA/CRED International Disaster Database - Université Catholique de Louvain - Brussels - Belgium. www.em-dat.net.
Forest and Mountain Biodiversity: Overview. Philippine Clearing House Mechanism for Biodiversity. http://chmphl.98labs.com.
Habito, Cielito. June 6, 2010. Is Mining Growth Inclusive? Philip-pine Daily Inquirer.
La Liga Policy Institute – Alternative Budget Initiative Environment Cluster. 2009. Financing Climate Change Actions: A Must for the 2010 Budget.
La Liga Policy Institute – Alternative Budget Initiative Environ-ment Cluster. September 2009. Institutional Arrangements for Disaster Risk Management in the Philippines.
Medium Term Philippine Development Plan (MTPDP). 2004-2010.NEDA. June 2010. Second draft. Philippines Fourth Progress
Report on the Millennium Development Goals (MDGs). Unpub-lished.
Offi ce of the President-Climate Change Commission. 2010-2022. National Framework Strategy on Climate Change.

134 SOCIAL WATCH PHILIPPINES
Oposa, A. A. 1996. Legal Marketing of Environmental Law: The Phil-ippine Experience. Paper presented during the Fourth Internation-al Conference on Environmental Compliance and Enforcement.
PAGASA – DOST Service Institutes. http://kidlat.pagasa.dost.gov.ph/cab/statfram.htm.
Philippine National Government in support of the Kapit-Bisig Laban sa Kahirapan. July 2007. Waterless Municipalities. A Convergence Project
R.A. 7942. The Philippine Mining Act of 1995.Ramos, H. C. June 2008. Update on the Mining Revitalization
Program of the Philippines. Powerpoint Presentation. Ronquillo, J.D. and Morala, R.O. 2007. Environmental Insecurity:
The Cost of Mis-Governance.
Serrano, I. R. October 2005. Slowing Down, Coming Together. The Digital Filipino Stats Report. www.digitalfi lipino.com. UNDP. 2004. Common Country Assessment. UN Habitat. The Habitat Agenda Goals and Principles, Commit-
ments and the Global Plan of Action. http://www.unhabitat.org/declarations/habitat_agenda.htm.
UN Habitat. March 2010. World Urban Forum 5. The Right to the City. Bridging the Urban Divide.
Villarin, J.T., Loyzaga, A.Y. and La Viña, A.G.M. (et. al.). July 2008. In the Eye of the Perfect Storm: What the Philippines should do about climate change. Working Paper.
World Bank. December 2005.Philippines Environment Monitor 2005. Coastal and Marine Resource Management.

Trade, debt and aid:
MDG retardants
Winning the Numbers, Losing the War: The Other MDG Report 2010 135
Summary
T he Millennium Development Goal (MDG) 8, bannered as “Global
Partnership for Development” on trade, debt and aid, is universally
viewed as essential to the attainment of all eight goals. Yet this remains
as one of the most problematic areas that may spell the country’s failure to keep its
MDG promises by 2015. Reported improvements in access by the poor to cheaper
essential drugs and the ever-expanding information and communications technology (ICT) have yet
to make their impact felt in overall real poverty reduction.
Unlike other millennium development goals, MDG 8 has no quantitative measures
that are available for quick progress assessment. They are more descriptive rather than
By JESSICA REYES-CANTOS
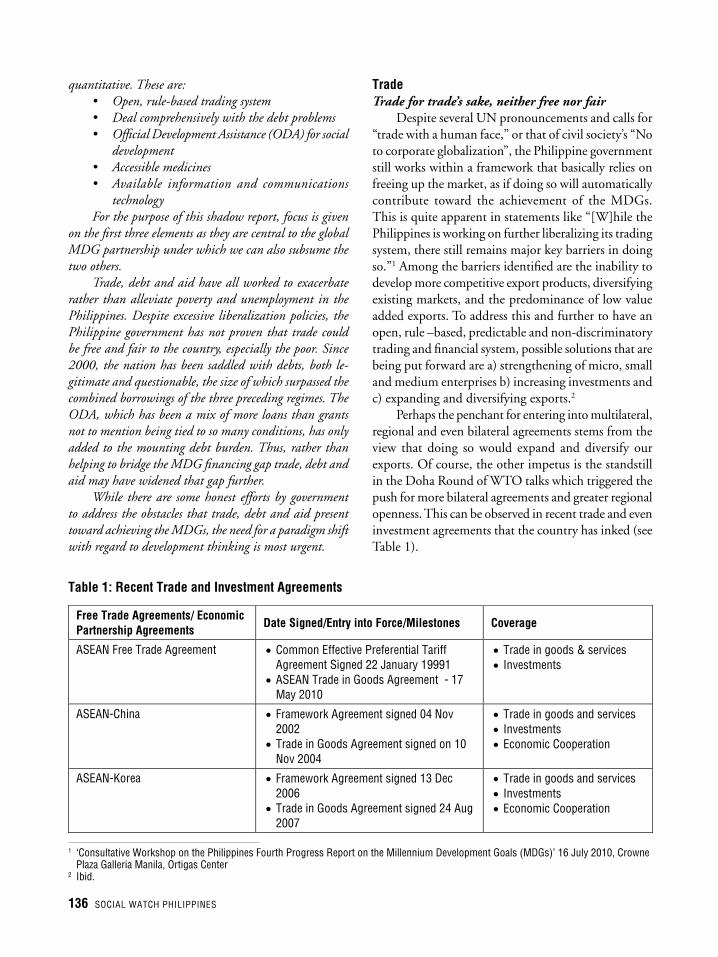
136 SOCIAL WATCH PHILIPPINES
quantitative. These are:• Open, rule-based trading system• Deal comprehensively with the debt problems• Offi cial Development Assistance (ODA) for social
development• Accessible medicines• Available information and communications
technologyFor the purpose of this shadow report, focus is given
on the fi rst three elements as they are central to the global MDG partnership under which we can also subsume the two others.
Trade, debt and aid have all worked to exacerbate rather than alleviate poverty and unemployment in the Philippines. Despite excessive liberalization policies, the Philippine government has not proven that trade could be free and fair to the country, especially the poor. Since 2000, the nation has been saddled with debts, both le-gitimate and questionable, the size of which surpassed the combined borrowings of the three preceding regimes. The ODA, which has been a mix of more loans than grants not to mention being tied to so many conditions, has only added to the mounting debt burden. Thus, rather than helping to bridge the MDG fi nancing gap trade, debt and aid may have widened that gap further.
While there are some honest efforts by government to address the obstacles that trade, debt and aid present toward achieving the MDGs, the need for a paradigm shift with regard to development thinking is most urgent.
TradeTrade for trade’s sake, neither free nor fair
Despite several UN pronouncements and calls for “trade with a human face,” or that of civil society’s “No to corporate globalization”, the Philippine government still works within a framework that basically relies on freeing up the market, as if doing so will automatically contribute toward the achievement of the MDGs. This is quite apparent in statements like “[W]hile the Philippines is working on further liberalizing its trading system, there still remains major key barriers in doing so.”1 Among the barriers identifi ed are the inability to develop more competitive export products, diversifying existing markets, and the predominance of low value added exports. To address this and further to have an open, rule –based, predictable and non-discriminatory trading and fi nancial system, possible solutions that are being put forward are a) strengthening of micro, small and medium enterprises b) increasing investments and c) expanding and diversifying exports.2
Perhaps the penchant for entering into multilateral, regional and even bilateral agreements stems from the view that doing so would expand and diversify our exports. Of course, the other impetus is the standstill in the Doha Round of WTO talks which triggered the push for more bilateral agreements and greater regional openness. This can be observed in recent trade and even investment agreements that the country has inked (see Table 1).
1 ‘Consultative Workshop on the Philippines Fourth Progress Report on the Millennium Development Goals (MDGs)’ 16 July 2010, Crowne Plaza Galleria Manila, Ortigas Center
2 Ibid.
Free Trade Agreements/ Economic Partnership Agreements Date Signed/Entry into Force/Milestones Coverage
ASEAN Free Trade Agreement Common Effective Preferential Tariff Agreement Signed 22 January 19991 ASEAN Trade in Goods Agreement - 17 May 2010
Trade in goods & services Investments
ASEAN-China Framework Agreement signed 04 Nov 2002 Trade in Goods Agreement signed on 10 Nov 2004
Trade in goods and services Investments Economic Cooperation
ASEAN-Korea Framework Agreement signed 13 Dec 2006 Trade in Goods Agreement signed 24 Aug 2007
Trade in goods and services Investments Economic Cooperation
Table 1: Recent Trade and Investment Agreements

Winning the Numbers, Losing the War: The Other MDG Report 2010 137
Table 1. Recent Trade and Investment Agreements (continuation)
Free Trade Agreements/ Economic Partnership Agreements Date Signed/Entry into Force/Milestones Coverage
ASEAN-Australia-New Zealand Agreement signed 27 Feb 2009 Zero for zero arrangement for some auto and auto parts
Trade in goods and services Investments Economic cooperation Intellectual property Electronic commerce Competition
Japan-Philippines Economic Partnership Agreement (JPEPA)
Signed in 9 Sep 2006 Entered into force on 11 Dec 2008.
Trade in goods and services Investments Economic cooperation
ASEAN-Japan CEPA ASEAN members signed the Trade in Goods Agreement on 12 April 2008
Trade in goods Economic cooperation Being negotiated: Trade in services Investments
ASEAN-India ASEAN members signed the Trade in Goods Agreement on 12 April 2008
Trade in goods Economic cooperation Being negotiated: Trade in services Investments
EU-RP Partnership Cooperation Agreement
Signed 25 June 2010 Covers political, justice, migration, disaster risk reduction among others * on trade and investment, including investment, Sanitary and Phytosanitary (SPS), Technical Barriers to Trade (TBT), customs and trade facilitation, as well as Intellectual Property Rights (IPR)
Sources: Department of Trade and Industry, Bureau of International Trade Relations; Department of Foreign Affairs, various newspaper articles
Table 2. Balance of Trade
Source: National Statistical Coordination Board http://www.nscb.gov.ph/secstat/d_trade.asp
Year US$ million
2001 - 907 2002 -4028 2003 -4239 2004 -4359 2005 -6164 2006 -4364 2007 -5048 2008 -7669 2009 -4656 2010 -2308 (Jan.-Mar.)
What is ironic is that despite our greater openness with tariffs, brought down way ahead of our commit-ments to the General Agreement on Tariffs and Trade-World Trade Organization (GATT-WTO) and way below that of our Asian neighbors, our trade balance has continuously deteriorated (see Table 2).
This means that our trading partners are able to bring in more goods into our country compared to the amount of goods that the Philippines could export into their markets. Simple as it looks, it has devastating effects on our economy.
First is the loss of jobs due to the easier access of imported goods into the domestic market that directly compete against our local manufacturers and agricul-tural produce. Workers in our local car industry, some

138 SOCIAL WATCH PHILIPPINES
75,000 of them, are directly threatened by lower-priced ‘JPEPA’ cars. The fl ood of cheap vegetables and shoes from China threatened our farmers in Benguet and wreaked havoc in Marikina’s shoe industry. In 1994 there were 513 registered manufacturers in Marikina. This fi gure has gone down to just 145 of late. An Ibon report revealed that “more than 600,000 shoe workers lose their jobs every year and average production has dwindled from 105,000 pairs of shoes a year in 1994 to 42,000 pairs in 20033.”
Second, local industries are being killed. We no longer have a garments and textile sector. Our poul-try sector is being swamped even just by the WTO’s minimum access volume. And you can no longer see Ilocos garlic in ordinary wet markets. Most of them are from Taiwan.
Third, our country was transformed from a net food exporter into a net food importing country and of late, earned the distinction of being the world’s number one rice importer. In short, our food security is seriously in question.
Fourth, we are not able to capitalize on the sup-posed market access that our goods and services should enjoy. Of the nearly 100 nurses and 200 caregivers that were deployed in Japan, only one passed the language exam and will eventually be hired. Even if given lower tariff rates, our agriculture goods are still being met by stringent sanitary and phytosanitary measures. Phil-export President Mr. Sergio Ortiz-Luis admitted that many agricultural product exporters were still struggling to meet safety standards.4
It is no wonder then that no less than the United States and the European Union have “expressed concern over the Philippines bilateral trade deal with Japan”, saying it puts the country at a disadvantage versus its richer East Asian trade partner.”5 Further, a former Arroyo fi nance secretary admitted that “[T]here’s an uneven implementation of trade liberalization, which was to our disadvantage.” While he speculated that consumers might have benefi ted from the tariff liber-alization, he acknowledged that “it has killed so many local industries.”6
DebtDealing comprehensively with the debt problem
Even by the government’s admission, the public sector debt remains a burden. For the past two decades, it has hovered around 50 percent of the country’s Gross Domestic Product. As of May this year (2010), it stands at Php 4.55 trillion with projections that it will reach Php 5 trillion by the end of the year. What has become a trend in recent years is that public domestic debt, now at Php 2.6 trillion, has grown bigger compared to public foreign debt of Php 1.9 trillion. Still foreign currency-denominated contingent liabilities stands at a whopping Php 504 billion (see Table 3).
3 Ibon, “Liberalization and the Demise of the Local Shoe Industry,” Vol. 5, No 44, 11-17 Dec 2005.4 “Trade deal biased in favor of Japan?” BusinessWorld, 4 July 2010 http://www.bworldonline.com/main/content.php?id=13675 5 Ibid.6 “Government Loses P120 billion in Tariff Cuts,” Eric Boras, Business World, 20 Oct 2003 as cited in “Reaching the Philippines’ MDG Targets: Why Policy Paradigms Matter” by Walden Bello, Presentation at the PLCP Conference, Crowne Plaza Galleria, 17 Aug 2010.7 Bangko Sentral ng Pilipinas. http://www.bsp.gov.ph/statistics/keystat/ofw.htm
Table 3. Public Sector Debt as of May 10, 2010 (in million pesos)
Source: Bureau of Treasury as cited in http://www.nscb.gov.ph/sdds/nsdp.asp
Debt service as a percentage of exports of goods and services has substantially decreased from 27.2 per-cent in 1990 to 9.6 percent in 2008. What may have brought it down were not vibrant export earnings but remittances of overseas Filipino workers (OFWs) which reached US$ 17.3 billion last year.7
The debt problem as a major fi scal constraint
The following bare facts are beyond question.One, public sector debt is still a huge burden;Two, debt servicing eats up 20 to 25 percent of
the national budget at the expense of important MDG-
Central Government Debt Latest Previous Domestic Debt 2,583,717 2,548,143
Short term 574,836 579,118 Medium term 809,364 789,294 Long term 1,199,517 1,179,731
Foreign Debt 1,970,468 1,888,337 Debt Guaranteed by Central Government 616,435 603,829
Domestic 112,454 121,516 Foreign 503,981 482,313 Total 4,554,185 4,436,480
Winning the Numbers, Losing the War: The Other MDG Report 2010 139
related social spending;Three, illegitimate debts, which could have quali-
fi ed for debt cancellation, are securitized or already fully paid. On the other hand, the government has become hesitant to take action with the few ones where the government has a strong case, like the faulty Austrian incinerators, despite openness for negotiations and even cancellation from the Austrian government. Akbayan Representative Walden Bello could only surmise that government fears that in some way, it could set a prec-edent that would involve other debt cancellation and affect the country’s credit rating.
Four, the shift to domestic borrowing, though pru-dent especially at a time when foreign borrowing rates are high, might crowd out private sector investments. Topped with an unwieldy tax effort and poor revenue collection, it can be a formula for implosion.
One other issue with regard to public debt that is worth mentioning is the so-called ‘Peace Bonds’ that benefi ted one NGO, the CODE-NGO, which caused uproar within civil society itself. It earned Php 1.4 bil-lion from the sale of bonds that are maturing in October 2011. Whether or not the proceeds were used for noble intentions, harsh criticisms were thrown on the entire scheme as it was shown that CODE-NGO used its political capital to corner the deal and get sweeteners like tax exemptions on the side.8 The maturing bonds will be part of the debt that the government will be paying next year.
Emergence of climate debtOf late, supposed assistance to disaster-stricken
countries has come in, not in the form of grants but of loans. This has raised objections especially among NGO’s doing climate change campaigning. As Oxfam’s Senior Policy Advisor Antonio Hill suc-cinctly puts it, “[A]t a time of economic emergency, when several poor countries are slashing critical health and education budgets to avoid a debt crisis, rich countries are considering saddling them with climate debt for a situation they did not cause and are worst affected by.”9
In the Philippines, World Bank has committed funding in the form of loans to help in the rehabilitation
of areas affected by tropical storm Ketsana (Ondoy) and typhoon Parma (Pepeng).
“This loan, while benefi cial to ongoing rehabili-tation efforts, will in the long-term bury the country in more debt. These typhoons are extreme weather events and typify climate change impacts that loom to increase in number and worsen in severity in the next fi ve years,” Oxfam Philippines Spokesperson, Kalayaan Pulido-Constantino said.10
Recent studies, including that of the Asian Devel-opment Bank reveals that the Philippines is considered the most vulnerable country to climate change in Southeast Asia.
Government solutions fall short of civil society calls
The government’s approach to the debt problem does not at all touch the debt issue. In its own MDG report, its menu of approaches are limited to the fol-lowing:
One, improving tax and revenue collection and their effi ciency;
Two, improving effi ciency in government spend-ing; and
Three, transparency in government spending.
The Congress and the Executive Branch have turned a deaf ear on common calls of civil society among which are:
1) A comprehensive debt audit that examines all past borrowings especially those of private sec-tor debts that were absorbed by the national government.
2) A repudiation of illegitimate debts3) A moratorium on debt payments including a
freeze in interest rates4) A debt-for-MDG swap
With regard to the climate debt, international campaign work is being launched to make developed countries pay for the damage that they have caused to the environment based on the “polluters pay principle”, together with a renewed call for a fi nancial transactions tax. Whilst this is on-going a bill is being worked out
8 “A case of impermissible rent-seeking,” Action for Economic Reforms, January 20029 “Oxfam warns of climate debt with WB climate aid,” by Abigail Kwok, INQUIRER.net , First Posted 16:32:00 06/01/2010 http://newsinfo.
inquirer.net/breakingnews/nation/view/20100601-273267/Oxfam-warns-of-climate-debt-with-WB-climate-aid10 Ibid.

140 SOCIAL WATCH PHILIPPINES
in Congress for an adaptation fund to mandate fund-ing modalities that, unlike other fi nancial agencies, will allow developing countries to avoid having to go through ineffi cient, bureaucratic and conditionality-heavy multilateral fi nancing from institutions such as the World Bank. It is aimed to raise adaptive capacities of vulnerable communities.11
Aid
Aid for social development is a non-issue. In fact, it should immediately lead to MDG fi nancing. However, even government reports admit that the infrastructure sector consistently received the highest amount of loans while Governance, Institutions, Public Safety and Di-saster Management sectors had the least amounts from 1990 to 2007 (see Figure 1).
Issues regarding Offi cial Development AssistanceTied aid and aid for trade
This has been an age-old issue which has yet to see any real solution. We have seen this in almost every
Figure 1. ODA loans per sector, 1990-2009 (NEDA Report)
JICA, ADB, WB and IMF loan. The issues range from simple identifi cation of consultants and sources of raw materials to outright sector reform programs, such as that of power and water.
With the problems that accompanied the slow down in the liberalization program of developing coun-tries after their accession in the GATT-WTO, there came another permutation of tied aid: that of ‘aid-for-trade’. The menu of trade-related activities that can be fi nanced through aid is actually benefi cial to developing countries – workers’ skills enhancement, modernizing customs systems, ports and agriculture infrastructure and export diversifi cation among others. In fact, these may even be viewed as MDG-enhancing projects. As such, these are welcomed by least developed countries, especially those in Africa.
Yet, for the Philippines, some of the projects that seemingly get fi nancing through aid for trade are more along the lines of trade facilitation – ensuring that customs rules adhere to WTO rules to the letter, and hence a WTO-aligned customs modernization bill is
11 “Climate Finance Chaos: A Finance Agenda for Urgent Climate Action in the Philippines” Climate Action Policy Brief Institute for Climate and Sustainable Cities (ICSC), July 2010. The full report can be downloaded from http://ejeepney.org and http://oxfamphilippines.word-press.com

Winning the Numbers, Losing the War: The Other MDG Report 2010 141
being proposed in Congress. But more worrisome is the conditionality that somehow coerces countries to liberalize outside the formal WTO negotiations in order to get their much-needed fi nancing.12
The China invasion
Professor Eduardo Tadem of the UP Asian Center commented, “China’s emergence as a new player in foreign development assistance introduces a new di-mension to the global context of ODA.” While most of us are familiar with botched National Broadband Network-Zhong Xing Telecommunication Equipment Company Ltd., (NBN-ZTE) deal which involved bor-rowing from China and benefi ting a Chinese company (ZTE) in a government telecommunications project, there are other deals made by the Department of Agriculture entitled the RP-China Memorandum of Understanding that involved setting aside 1.24 mil-lion hectares of land for the agricultural use of Chinese companies for bio-ethanol, sorghum, corn, rice, and cassava, among others. This was supposed to translate into some Php 10 billion worth of investments from China. At the same time, China committed to provide US$ 2 billion worth of ODA projects yearly from 2007 to 2009.13 While this might be viewed as fi lling the gap left by the Organization for Economic Co-operation and Development (OECD) and the US in terms of ODA-fi nancing, the terms and conditions laid down by China, coupled with the many questionable deals done during the previous Arroyo administration calls for greater vigilance among civil society organizations and transparency mechanisms within the government’s ODA acquisition processes.
Cost overrunsAs of December 2008, NEDA reported that cost
overruns for 29 ODA-funded projects totaled Php 43.32 billion. Reasons identifi ed for the over budget spending are civil works costs escalation, foreign cur-rency fl uctuations, and land acquisition among others.14 Again, caution must be taken to ensure that such cost escalations are really justifi able and not just whimsi-cally-done adjustments.
12“Scaling up aid for trade: How to support poor countries to trade their way out of poverty,” Oxfam Briefi ng Note. 15 November 2005.13 “Development down the drain: The Crisis of Offi cial Development Assistance to the Philippines,” by Eduardo C. Tadem, Financing
for Development: Finance or Penance for the Poor, Mobilizing Resources for the MDGs: The Five-Year Review of Financing for Development, Social Watch Philippines, 2008.
14 “ODA cost overruns hit P14B” by Cai U. Ordinario, Business Mirror, 2 July 2009, http://www.businessmirror.com.ph/home/top-news/12607-oda-cost-overruns-hit-p14b.html.
Conclusions and RecommendationsGenuine global partnership in the context of
achieving the MDGs is yet to happen. Global and regional proposals that are practical and doable are plentiful and come from various stakeholders. As we move towards 2015, it would be a pity if all these initia-tives simply end up as sound and fury. Perhaps beyond partnerships, we also need global political will. Further recommendations are detailed below.
An MDG-sensitive trade policyClearly, there is a need to go beyond the view that
trade is simply about greater openness and building and marketing competitive products. Trade should create meaningful jobs, not destroy them, and it should promote industrialization and food security, not relegate the country to perpetual dependence on imports. It should pave the way for an integration of our agriculture, industrial and service sectors, not economic disintegration. Above all, it should pave the way towards sustainable development that addresses poverty. Specifi c measures to achieve this are listed below:
• A national industrialization plan. Civil society organizations, for so many years now, have been calling on the government to put together a national agro-industrialization plan that will guide the country’s trade and invest-ments policies, but to no avail. As of now, what we have are enclaves of economic zones each offering better investment terms, duty-free importation of raw materials, strike-free and union-free industrial areas, completely detached from the rest of the economy, and, worse, distorting whatever rationality remains of our tariff structure.
• A stop to the creation of new ecozones and free ports. Until we have crafted a national indus-trialization plan through a broad consultative process the government must put a stop to the creation of new eco-zones and freeports.
• Creation of a Trade Representative Offi ce. There are more than 40 trade and investment

142 SOCIAL WATCH PHILIPPINES
agreements that the country has entered into yet, it can be clearly observed that within the WTO negotiations and the JPEPA processes, no singular entity can be held accountable for the outcomes of these negotiations. The country enters into a hodge-podge of agree-ments, likened to a bowl of spaghetti, where no overriding framework for entering into negotiations guides the negotiators. Worse, people’s organizations and even Congress are kept in the dark during the whole process. People who will be negatively affected by such agreements are seldom consulted and on ratifi -cation or accession, are just asked to grin and bear it. On the other hand, Congress, which is similarly left in the dark are told that upon the Executive’s signing, it is already fait accompli and the institution will just have to enact new laws or repeal old ones to align our statutes to the new agreements.
As early as the 12th Congress, a proposal to address such disjoint in trade negotiations was already being pushed. It is hoped that under the new administration, civil society will see the realization of such a proposal.
• A review of all bilateral and regional trade and investment agreements. It is appalling that so many new agreements have entered into force immediately after the WTO talks, called the ‘Doha Round’, stalled. While most of us got doused with the JPEPA debates, seven other agreements were being quietly negotiated with their implications not yet fully appreci-ated by the public. As such, calls for a review of all these agreements are but proper. Let us put a unifi ed rhyme and reason behind all of these agreements.
• Putting up our defenses by having high prod-uct standards akin to the EU’s. As our tariffs have substantially gone down, there must be conscious effort to fortify our borders with strict product standards as perhaps a last line of defense for the infl ux of cheap, poor quality imports.
Again, an MDG-sensitive debt policyThe common yet unheeded calls of civil society
with regard to debt remain, as achieving the MDGs become precarious not just for poor countries, but middle-income countries as well.
Countries belonging to the so-called highly-in-debted poor countries (HIPC) are considered qualifi ed for multilateral debt reduction initiative (MDRI). Yet, there are a lot of middle income countries like the Philippines and Indonesia which are off-track in their MDGs as a result of their huge debt burden.
It is time to do away with the traditional debt ratios that create an illusion that a country has the capacity to sustainably service its debt and at the same time develop.
The UNDP and the UN DESA (Department of Economics and Social Affairs) have been undertaking activities with regard to addressing the MDG needs of a country while providing debt relief. One of those that found resonance among civil society organizations is the UN institution’s position to give debt relief to countries where government revenues cannot meet MDG fi nancing needs.15
Ways forward on ODACivil society can openly support recommenda-
tions coming from the Executive which are essentially the following:
• Strengthen the selection process of loan-funded programs and projects to minimize corruption and increase transparency; and
• Strengthen adherence to the Paris Declaration. The Paris Declaration on aid effectiveness is an
agreement among countries to continue to increase efforts in harmonization, alignment and managing aid for results with a set of actions and indicators that can be effectively monitored. These include:
Ownership - Developing countries set their own strategies for poverty reduction, improve their institutions and tackle corruption.
Alignment - Donor countries align behind these objectives and use local systems.
Harmonization - Donor countries coordinate, simpli-fy procedures and share information to avoid duplication.
15 “Possibilities of Debt Reduction for MDG Financing: Philippines and Indonesia,” by Joseph Anthony Y. Lim, Financing for Development: Finance or Penance for the Poor, Mobilizing Resources for the MDGs: The Five-Year Review of Financing for Development, Social Watch Philippines, 2008.

Winning the Numbers, Losing the War: The Other MDG Report 2010 143
Results - Developing countries and donors shift focus to development results and results get measured.
Mutual Accountability - Donors and partners are accountable for development results.16
Further recommendations include:• Where to put development assistance? Con-
sidering the uncertainty and limits of ODA fl ows in this period of global economic crisis, we propose that in the next 5 or 6 years (until 2015) its use be prioritized:
a) For social protection and for covering MDG gaps (from the current 30% level to at least 50%): this is meant not only as an additional support for the attainment of the MDGs, but principally to prevent the further expansion of poverty during these diffi cult times;
b) For food and agri-development (from the cur-rent 3% to at least 10%), in the function of food security; and
c) In infrastructure investment, to prioritize ba-sic infrastructure in the rural areas where the majority of the Asian poor still live.
It should be emphasized, as has been consistently done in all climate negotiations, that assistance to ad-dress the effects of climate change must be separate from and additional to the current ODA commitments for fi nancing the MDGs.
• Strengthening and institutionalizing the role of civil society. We welcome the advance made in Accra on ‘democratic ownership’ and ‘inclusive partnership’ – particularly the rec-ognition of the necessary role of civil society groups. There is a need to institutionalize this role in the processes and offi cial structures of development and aid, both in the donor and the recipient countries. Such institutionaliza-tion will not only enhance ‘ownership’ of the development projects and processes, but also ensures greater transparency and accountability in the use and management of aid.
• An ASEAN/ASEM ‘localized’ Aid Effective-ness Regime. At the Asian People’s Forum in Bangkok, we proposed to the 7th ASEAN Summit that the ASEAN forge a collective system of rules on how ODA will be availed of, used, and managed in the region. This will
in effect “localize” the Paris Declaration prin-ciples to the situation and needs of the ASEAN countries. More importantly, it will add teeth to the enforcement of country commitments in the Paris Declaration and Accra, and ‘of-fi cialize’ a ‘regional peer-to-peer approach’ to aid effectiveness.
References
Action for Economic Reforms. January 2002. “A case of impermissible rent-seeking.”
Bangko Sentral ng Pilipinas. http://www.bsp.gov.ph/statistics/keystat/ofw.htm
Boras, E. Business World. 20 Oct 2003. “Government Loses P120 billion in Tariff Cuts,” as cited in “Reaching the Philippines’ MDG Targets: Why Policy Paradigms Matter” by Walden Bello, Presentation at the PLCP Conference, Crowne Plaza Galleria, 17 Aug 2010.
Bureau of Treasury as cited in http://www.nscb.gov.ph/sdds/nsdp.aspBusinessWorld. 4 July 2010. “Trade deal biased in favor
of Japan?” http://www.bworldonline.com/main/content.php?id=13675
Consultative Workshop on the Philippines Fourth Progress Report on the Millennium Development Goals (MDGs). 16 July 2010. Crowne Plaza Galleria Manila, Ortigas Center
http://www.oecd.org/document/18/0,3343,en_2649_3236398_35401554_1_1_1_1,00.html
Ibon. Dec 2005. “Liberalization and the Demise of the Local Shoe Industry,” Vol 5, No 44, 11-17.
Institute for Climate and Sustainable Cities (ICSC). July 2010. “Climate Finance Chaos: A Finance Agenda for Urgent Climate Action in the Philippines” Climate Action Policy Brief. The full report can be downloaded from http://ejeepney.org and http://oxfamphilippines.wordpress.com
Kwok, A. Philippine Daily Inquirer. 6th January 2010. “Oxfam warns of climate debt with WB climate aid,” by Abigail Kwok, INQUIRER.net. http://newsinfo.inquirer.net/breakingnews/nation/view/20100601-273267/Oxfam-warns-of-climate-debt-with-WB-climate-aid
Lim, J. A. Y. 2008. “Possibilities of Debt Reduction for MDG Financing: Philippines and Indonesia,” cited in Financing for Development: Finance or Penance for the Poor, Mobilizing Resources for the MDGs: The Five-Year Review of Financing for Development, Social Watch Philippines, 2008.
National Statistical Coordination Board http://www.nscb.gov.ph/secstat/d_trade.asp
Ordinario, C. U. 2 July 2009. “ODA cost overruns hit P14B”. Business Mirror. http://www.businessmirror.com.ph/home/top-news/12607-oda-cost-overruns-hit-p14b.html
Oxfam Briefi ng Note. 15 November 2005. “Scaling up aid for trade: How to support poor countries to trade their way out of poverty.”
Tadem, E. C. “Development down the drain: The Crisis of Offi cial Development Assistance to the Philippines” cited in Social Watch Philippines. 2008. Financing for Development: Finance or Penance for the Poor, Mobilizing Resources for the MDGs: The Five-Year Review of Financing for Development.
16 http://www.oecd.org/document/18/0,3343,en_2649_3236398_35401554_1_1_1_1,00.html


The Bangsamoro outlook onthe Millennium Development Goals
Winning the Numbers, Losing the War: The Other MDG Report 2010 145
Summary
T his report tackles the poverty situation of Mindanao, Philippines, in relation to the Millen-
nium Development Goals (MDGs) with specifi c focus on the Moro (Muslim) population,
especially in the Autonomous Region in Muslim Mindanao. However, the Mindanao
situation is a very complex situation and there is a need to present the historical factors and underly-
ing issues surrounding how Mindanao and the Moros in particular became so poor and neglected in
spite of the fact that it is the fi rst nation in this part of the archipelago. Data from independent and
previous studies are presented in this report which point out that poverty in Mindanao is higher when
compared to the national level. It is also a fact that the Autonomous Region in Muslim Mindanao
(ARMM) has the highest rate of poverty incidence in the country.
By JOLLY S. LAIS
146 SOCIAL WATCH PHILIPPINES
1 Offi cial statistics from the National Statistical Coordination Board (NSCB).2 2006 Offi cial Poverty Statistics (FIES, NSO).3 Pacturan, J. 2004. Rural enterprises for poverty reduction and human security.
Mindanao situationMindanao is the second largest island in the coun-
try at 94,630 square kilometers, and is the eighth most populous island in the world. The island of Mindanao is larger than 125 countries worldwide, including the Netherlands, Austria, Portugal, Czech Republic, Hun-gary, Taiwan and Ireland. Mindanao is surrounded by seas: the Sulu Sea to the west, the Philippine Sea to the east, and the Celebes Sea to the south which are rich in marine life and aquatic resources. Of all the islands of the Philippines, Mindanao shows the greatest variety of physiographic development and is home to over 20 million settlers (Christians), Moros and Lumads. As a result of the minoritization process however, which was implemented from the Commonwealth period up to the present, Christians form the majority of the population, with Muslims approximately just more than 20% of the population (mostly on the southern part of the island); 5% of which are affi liated with other religions. It must be noted that in 1903 during the creation of Moro Province by the Americans, 76% of the Mindanao population were Moros, and more than 20% were Lumads. The na-tive Moros (Muslim) and Lumads (indigenous people or non-Muslim groups) of Mindanao have a culture that is different from the main culture of the Philippines. Today, the island group is further divided into six regions, which are further subdivided into 25 provinces.
Mindanao is known as the ‘land of promise’ due to its rich agricultural lands which was the primary consideration of land grants then given to settlers from Luzon and the Visayas. Mindanao has promis-ing natural and mineral resources. It was believed that the mineral deposits all over the island which include gold, silver, bronze, copper, chrome, chromite, oil, and many others can relieve the country from its ballooning foreign debt. Given these resources, the eight targets of the Millennium Development Goals can easily be achieved. Mindanao had a developed economy that was established during strategic trading activity with China and other Asian countries especially during the evolu-tion and incumbency of the Sultanates of Maguindanao and Sulu dating back to 14th century. But how is it that the historically developed civilization in this part of the archipelago, way back in 14th century, is now home to the poorest regions in the Philippines?
Mindanao is the center of the Moro struggle for the right to self-determination – a people’s struggle to end inequality and poverty. Dozens of legislated land grants were given to settlers from Luzon and the Visayas, from the American period up to the late seventies. These deliberate land grants dramatically systematized the roads to poverty for the Moro and Lumads. Decreased land holdings of the Moros and Lumads subsequently resulted to decreased agricultural outputs. Most agricul-tural colonies that were set up through these land grants were exploited by the settlers. The entry of Visayan and Luzon-based oligarch and multi-national corporations that acquired vast tracts of agricultural lands opened up other large scale exploration and exploitation of Mindanao resources in the name of national interest and development. Obviously, Mindanao became the ‘milking cow’ of the non-Mindanaons.
To better understand the situation it is important to review some historical accounts. Kindly refer to Appendix A – The Bangsamoro Outlook on MDGs – Brief Moro History, and Appendix B – Are the Moros Filipinos?
Moro poverty situationThe Autonomous Region in Muslim Mindanao
(ARMM), the poorest region located in the Mind-anao Island of the Philippines, is composed of all the Philippines’ predominantly Muslim provinces, namely: Basilan, Lanao del Sur, Maguindanao, Sulu and Tawi-Tawi, and the Islamic City of Marawi. ARMM is also the poorest region in the country with more than half its families classifi ed as poor.1 Poverty incidence in ARMM, reached 61.8 percent in 2006, a 9 percent increase from 2003’s 52.8 percent.2
ARMM is the only region in the Philippines that has its own government created under Republic Act 6734 and Republic Act 9054 as a result of the Final Peace Agreement between the Government of the Republic of the Philippines (GRP) and the Moro Na-tional Liberation Front (MNLF) in 1996. Everyone was hopeful that with the implementation of the Agreement that development would pour into the 13 identifi ed poorest provinces.
In 2004 Jerry Pacturan noted:3
• The poverty situation and underdevelopment

Winning the Numbers, Losing the War: The Other MDG Report 2010 147
in confl ict affected-areas in ARMM and other provinces in Mindanao is quite disturbing as recent fi gures would show. The World Bank in one of its publications confi rmed that the is-land provinces of ARMM have highest poverty levels in the entire country. Even non-ARMM provinces had distressing fi gures as well.
• Indicators on health are also not encouraging. ARMM has only 29% of its population hav-ing access to potable water supply. Figure 1 illustrates that among the bottom 5 provinces in the Philippines with low access to safe drink-ing water, three of them are from the ARMM namely Tawi-Tawi, Lanao del Sur and Sulu.
• Access to family planning services is also very low among the ARMM provinces. The bot-tom 5 provinces in the country in terms of low family planning access are all in ARMM comprising Tawi-Tawi, Lanao del Sur, Sulu, Basilan and Maguindanao (see Figure 2).
• In terms of access to sanitary toilets, Sulu (20.8%) and Tawi-Tawi (11.6%), both from ARMM, reported the least percentage of fami-lies with sanitary toilets (see Figure 3).
• The state of education is also lamentable4
Cohort survival rate at the elementary educa-tion level for School Year 2001-2002 was low especially in Western (45.51%) and Central Mindanao (56.45%) regions and the ARMM (33.96%) (see Table 1).
Offi cial government statistics also showed that regions from Mindanao were also among the country’s poorest. All the fi ve regions from Mindanao—Zambo-anga Peninsula, Northern Mindanao, Davao Region, SOCCSKSARGEN, CARAGA, and the Autonomous Region in Muslim Mindanao (ARMM) are among the country’s top 10 poorest regions in 2003 and 2006. In 2006, the top two poorest regions were from Mind-anao—ARMM and CARAGA. Poverty incidence in ARMM and CARAGA were at 55.3 percent and 45.5 percent, respectively. The fi gure for ARMM means that more than half of its families are classifi ed as poor.
While other regions in Mindanao are enjoying support for agricultural development, which is a main source of livelihood, ARMM still lags behind even in the availment of irrigation systems. According to the Bureau of Agricultural Statistics, ARMM received very
Figure 1. Families with Access to Safe Drinking Water, Province: October 1999
Source: National Statistics Offi ce, Annual Poverty Indicators Survey
Figure 2. Families with Access to Family Planning Services, Province: October 1999
Source: National Statistics Offi ce, Annual Poverty Indicators Survey
Figure 3. Families with Own Sanitary Toilet, Province: October 1999
Source: National Statistics Offi ce, Annual Poverty Indicators Survey
4 Llanto, J. F. 2008. Mindanao Still Poorest Island in Nearly A Decade. abs-cbnNEWS.com/Newsbreak.

148 SOCIAL WATCH PHILIPPINES
Table 1.Cohort Survival Rate by Region, SY 1990-1991 – SY 2001-2002/1
Source: NSCB, 2000 Philippine Statistical Yearbook. Tables 10.5 & 10.6
minimal support for irrigation systems compared to the other fi ve regions in Mindanao. The Department of Public Works and Highways does not have ARMM infrastructure records in its offi cial website such as how many farm to market roads were built if there were any. In 2007, Mindanao Economic Development Council (MEDCO), an agency under the Offi ce of the Presi-dent, reported that from the more than 24% increase in Mindanao foreign trade, ARMM got only a 0.0003% share. MEDCO is now replaced by MinDA or Mind-anao Economic Development Authority, a Mindanao equivalent of NEDA (see Figure 4).
Figure 4. Regional Distribution of Export Earnings (Mindanao Regions) January-December 2007
Source of beat date: NDO-Central Offi ceProcessed by MEDCo
National Anti-Poverty Commission assistant sec-retary Dolores De Quiros-Castillo said that the volatile peace and order situation in Muslim Mindanao and
the lack of infrastructure in CARAGA were the major causes of high poverty incidence in the regions. “The confl ict [in ARMM] has displaced many families and poverty alleviation is diffi cult if you have a lot of dis-placed families,” Castillo said.
Violence against Moros aggravate the poverty situation
There were at least 120,000 documented casualties during the Armed Confl icts between Moro revolution-ary forces and the Philippine military from the 1960’s to 1996. In 2009 alone, at least 700,000 people were displaced in Maguindanao, Lanao Del Sur, Zamboanga Sibugay, Basilan, Sulu and Lanao Del Norte. There were countless cases of abductions, missing people, and other forms of human rights violations.
Destruction of houses and households, includ-ing farm outputs and animals, cost millions of pesos. Massive dislocation of livelihood and economic ac-tivities has aggravated the poverty condition of the residents. According to Eduardo Ermita, Executive Secretary of the former President Gloria Macapagal Arroyo, the Government of the Republic of the Philippines spent around Php 73 billion in military operations in 26 years (1970-1996) or an average of 40% of the Armed Forces of the Philippines (AFP) budget annually.

Winning the Numbers, Losing the War: The Other MDG Report 2010 149
Documented displacement
AnalysisThe Philippine policy towards attaining genuine
peace and economic development in the Moro areas, particularly ARMM, remains within the old Philippine policy paradigm which is still undermining the right to self-determination of the Moro people. Attempts of providing development projects in the area are just part of the “carrot and stick” policy of the state. The central issue to eradicate poverty and inequality is to resolve the governance system. A governance system that works needs to be consistent with the long established, tradi-tional governance system being successfully practiced by constituents and communities.
The failed Memorandum of Agreement on Ances-tral Domain (MOA-AD) between the GRP and Moro Islamic Liberation Front (MILF) could have been a jump-start of genuine economic development within ARMM given the 75%-25% sharing of resources in fa-vor of the Bangsamoro Juridical Entity (BJE). This shar-ing scheme could have resulted in more resources and funding for poverty alleviation programs and projects. Another basic and fundamental issue that was resolved between the GRP and MILF was the recognition of the Moro identity by the Philippine government. To many, this is a positive step forward given the historical injustices infl icted against the Moro people.
The Autonomous Region in Muslim Mindanao (ARMM), which is composed of fi ve (5) provinces and was the result of GRP-MNLF Peace Agreement in 1996, has not been effective. The present MNLF leadership, which has splintered into many factions, can
hardly deliver the needed push for development, much less on governance. The track record for ARMM so far has been zero. In 2008 alone, ARMM had at least a Php 8 billion budget which is equivalent only to the annual budget of Makati City. Eighty three (83%) percent of this went to administrative costs that included salaries and personnel services. The remaining seventeen per-cent (17%) of the annual budget went to the delivery of basic social services. According to an INCITEGOV study (2007), 95.2% of the regional budget is still controlled by national government. INCITEGOV states, “Only a negligible 4% (of ARMM funds)…is completely within the control of the ARMM regional government.” The World Bank Joint Social Assessment (2005) concludes that “the ARMM has no more real or practical autonomy in deciding on the level and allocation of funds intended for its politically distinct mandate than other non-autonomous administrative agencies of national government”; Indeed, the ARMM is manifested but has had dismal poverty alleviation performance in the eight targets of the Millennium Development Goals (see Table 2).
ARMM also has only a meager share from ODA and other funding facilities from the international donor community. As a confl ict-torn area, ARMM receives less major development assistance from the ODA funding window. Other reasons include regional bias along with a standing exclusion policy. The present set-up of the ARMM fund sources, being dependent on the priority offi ce of the president, cannot sustain the poverty alleviation programs in the region. The

150 SOCIAL WATCH PHILIPPINES
MTPDP has not gained momentum to effect major economic changes in ARMM.
The approximately 40% of the AFP annual budget spent on war in Mindanao in the last 26 years (1970-1996) could have built thousands of farm to market roads, classrooms, clinics, irrigation systems and other socio-economic infrastructure to uplift the poverty condition of the populace.
From the analysis of Clarence Henderson, there is a fundamental disconnect between Filipino élites and the poor. The political leadership in the Philip-pines has always been drawn from those élites, and those politicians have traditionally played the role of patrons and benefactors, relying on the pork barrel and personal/family funds (often acquired through corruption) to essentially buy votes. The core principle of democracy – that representatives should be drawn from those they represent and advocate for the true interests of their constituents – has not been operative. Philippine Presidents in particular have been drawn from the ranks of the wealthy and privileged. How can they relate to what it means to be poor or hungry? Even if their heart’s in the right place (which is not all that common), well-photographed visits to squatter settlements are not the answer. Former President Glo-ria Macapagal Arroyo for instance, always highlighted fi ghting poverty as a key policy emphasis. In her State-of-the-Nation (SONA) address on July 22nd, 2002, she emphasized the so-called “rolling stores” - trucks
loaded with subsidized rice, sugar, and canned meat that ply the streets of Manila - as a sterling example of her administration’s anti-poverty programs. The only problem was her remarks dismayed knowledgeable economists, given that few poor people ever get access to the trucks and only 5% of the nations’ poor live in Metro Manila. But real poverty alleviation programs where they are most needed - say in rural Mindanao - would lack the publicity opportunities of the rolling stores on Manila streets. True anti-poverty programs take a long time to bear fruit, and the politically-driven nature of Philippine government sector programs al-most ensures that the emphasis will continue to be on quick fi xes or interventions that provide high visibility and political payoffs.
The poverty and inequality prevailing in the Moro areas, in the Autonomous Region in Muslim Mindanao and those outside ARMM, has been brought about by historical injustices and discrimination imposed through blueprint subjugation against the Moro people. This has been aggravated by the Philippine government’s deliberate policy paradigm of exclusion and assimilation as refl ected in its legislations and programs over the past decades providing a token governance system which was fl awed by patronage politics and myopic fi scal economy resulting in a quagmire of poverty for the Moros.
The data in Table 2 summarizes the dismal MDG indicators in the Autonomous Region in Muslim Mind-anao.
Table 2. Comparison of ARMM to National performance on MDG indicators
Millennium Development Goals ARMM Philippines
Target Baseline*
Current Baseline Current
1: Eradicate Extreme Poverty and Hunger
Proportion of population below poverty threshold
28.0% 56.0% (1991)
61.6% (2006)
45.3% (1991)
32.9% (2006)
Proportion of population below food threshold
15.2% 30.5% (1991)
27.5% (2005)
24.3% (1991)
14.6% (2006)
Proportion of vulnerable employment
86.2% (2008)
Prevalence of underweight children under five years of age
15.7% 31.3% (1990)
28.8% (2008)
34.5% (1990)
26.2% (2008)
Proportion of households with per capita intake below 100% dietary energy requirement
31.2% 62.4% (1993)
64.2% (2003)
69.4% (1993)
56.9% (2003)

Winning the Numbers, Losing the War: The Other MDG Report 2010 151
Table 2. Comparison of ARMM to National performance on MDG indicators (continuation)
Millennium Development Goals ARMM Philippines
Target Baseline*
Current Baseline Current
2: Achieve Universal Primary Education
Elementary education net enrolment rate
100.0% 77.1% 99.9% 84.6% (1990)
85.1% (2008)
Elementary education cohort survival rate
100.0% 37.8% 40.8% 69.7% (1990)
75.4% (2008)
Elementary education completion rate
100.0% 37.5% 64.2% (1990)
73.3% (2008)
3: Promote Gender Equality And Empower Women
Ratio of girls to boys in elementary education
100.0 104.1 (1993)
105.8 (2005)
1.0 (1996)
1.0 (2008)
Ratio of girls to boys in secondary education
100.0 102.2 (1993)
121.6 (2005)
1.1 (1996)
1.1 (2008)
4: Reduce Child Mortality
Infant mortality rate 18.3 55.0 (1998)
56.0 (2008)
57.0 (1990)
24.9 (2008)
Under-five mortality rate 27.7 83.0 (1998)
94.0 (2008)
80.0 (1990)
33.5 (2008)
Proportion of 1 year-old children immunized against measles
77.9 (1990)
82.7 (2007)
5: Improve Maternal Health
Maternal mortality ratio 209 (1990)
162 (2006)
Births assisted by Skilled Birth Attendants
58.8 (1990)
72.9 (2007)
Births in a Health Facility 14.0%
Contraceptive prevalence rate 40.0% (1993)
50.7% (2008)
6: Combat HIV/Aids, Malaria and Other Diseases
Number of new HIV/AIDS reported cases
Number of population aged 14-24 with HIV
Malaria morbidity rate
Malaria mortality rate
Tuberculosis treatment success rate
89.0% (2007)
7: Ensure Environmental Sustainability
Proportion of population with access to safe water
35.1% (2006)
73.0% (1990)
84.1% (2008)
Proportion of population with access to sanitary toilet facilities
48.1% 67.6% (1990)
83.8% (2008)
*Baseline and current data year vary per indicator.Sources: 2000 and 2006 NSCB; 1998 and 2008 NNS, FNRI; 2008-2009 Department of Education; 2008 NDHS; 2007 DOH; 2006 FIES, NSO

152 SOCIAL WATCH PHILIPPINES
5 http://www.undp.org.ph/?link=news&news_id=238&fa=1
Seven provinces in Mindanao, almost all of them confl ict areas, are among the top 10 where the quality of life is the worst in the Philippines, the latest human de-velopment report on the country showed. Sulu ranked lowest in the human development index (HDI), fol-lowed by Tawi-Tawi, Maguindanao, Basilan, and Lanao del Sur. Sarangani ranked seventh and Zamboanga del Norte ranked ninth. Experts said that because of the armed confl ict in the southern provinces, thousands of displaced families are unable to access basic services. “The policy challenge is to stop war, but the whole mili-tary approach is not the correct approach,” said Toby Monsod, an economics professor at the University of the Philippines and principal author of the 2008/2009 Philippine Human Development Report. The poor quality of life in these provinces is almost at the same level as in poor African countries like Nigeria, Ghana, Mauritania, and Senegal, and confl ict-ridden countries like Pakistan and Myanmar, according to a comparison of HDI’s made by the United Nations Development Programme (UNDP).5
Conclusions and RecommendationsProspects for the attainment of MDGs in the
Moro (Muslim) areas are both political and economic interventions:
A. An effective governance system shall be in place
For genuine and long-term development to succeed and eradicate to poverty, there should be a negotiated peace settlement of the Moro question for the right to self-determination. The GRP should pursue peace talks with Moro Islamic Liberation Front (MILF). Review and refi nement of the GRP-MNLF FPA should continue. Unity of MILF and MNLF is an important element in developing the genuine governance system which expresses the Moro people’s right to self-determination. There should be an ele-ment of democratic process in developing the coveted genuine and workable governance system. Patronage politics presently being practiced by the Philippine traditional politics will be a bane in coming up with genuine governance system.
Specifi c recommendations include:a. Stop the war in Mindanao together with the
Peaceful settlement of the Bangsamoro ques-
tion for the right to self-determinationb. Provision of a comprehensive program for live-
lihood and indemnifi cation of the internally displaced persons (IDPs), who are victims of
the confl ict.c. Massive human rights education and capac-
ity-building initiatives should be provided to confl ict areas. Organize community-based human rights watch bodies with contemporary and appropriate technology in the human rights violation reporting, monitoring and lobbying.
d. Establishment of the Commission on Human Rights (CHR) in the Autonomous Region in
Muslim Mindanao. Provide the CHR with prosecutory powers as at present it is only
investigative in character.e. Recognizing loopholes in the electoral practices
as a primary source of electoral fraud, electoral reform should take place through:– Massive citizen-voters education in the
grassroots communities throughout Min-danao
– Institutionalization of election monitoring and fraud deterrence activities
f. Develop legislation on good governance, trans-parency, and accountability in the performance of public duty
B. Full and unbiased Philippine Government support
In the next fi ve (5) years and onwards beyond 2015, at least 30% of the annual national budget should go to Mindanao. At least three-fold worth of efforts and resources should be undertaken in Moro areas to keep the MDGs target on track. Specifi cally, additional funds for ARMM to fund MDG-focused programs and projects should be established. The government should review its ODA priority areas to include Mindanao, especially ARMM. Assistance packages that are doable in the next fi ve years should also be prioritized. This is a very timely period to test the fulfi llment promises for development of the new President of the Philippine administration.
Specifi c recommendations include:a. The development budget for Mindanao shall
be equivalent to percentage of Mindanao GDP

Winning the Numbers, Losing the War: The Other MDG Report 2010 153
in terms of infrastructure and public invest-ments (soft and hard)
b. Mindanao should receive 30% of the annual Offi cial Development Assistance (ODA).
c. Passage of an Anti-Discrimination Bill. d. Investors in Mindanao should employ 80%
of personnel from workers of Mindanao in origin, 60% of the 80% shall come from the Bangsamoro and Lumad peoples. Staff devel-opment trainings shall be provided free by the investors for the purpose.
e. Establishment of Regional Anti-Poverty Commission in the Autonomous Region in Muslim Mindanao with a budget allocation equivalent to 30% of the annual ARMM budget. The Regional Commission’s budget however shall not be part of the ARMM budget. The ARMM Regional Anti-Poverty Commission shall be composed of four Com-missioners and a Chairperson appointed by the President of the Republic of the Philip-pines upon the recommendation of main-stream Mindanao civil society organizations. The need to urgently address the worsening poverty situation and the highest illiteracy rate along with the nutritional requirements and reproductive health in the Autonomous Region in Muslim Mindanao (ARMM) is imperative. Criteria for the Regional Anti-Poverty Commission budget allocation shall be the following:– 25% goes to poverty eradication pro-
gram– 25% goes to primary education including
the Madrasah education – 20% goes to nutrition and reproductive
health– 10% goes to gender & women empower-
ment initiatives– 10% goes to environment protection– 10% goes to AIDS/HIV education and
partnership for developmentf. Increase public investments in basic health,
education, biodiversity, sanitation and liveli-hood to adequately provide for affordable and quality services
g. Passage of a bill that ensures the provision of reproductive health education and services for all Filipinos. The Philippines has one of the
highest maternal mortality rates in the world: 10 women die each day due to complications from pregnancy and childbirth. However, any legislation or policy promoting birth control will be opposed.
h. Legislate measures to incorporate funding for Madrasah education and informal education
programs in the education budget. Expand the Alternative Learning System (ALS) to make it more relevant and accessible to some 11.6 mil-lion out-of-school children and youth, and to address the functional literacy needs of adults especially in ARMM and other poor egions and provinces in Mindanao. Such programs will help address the increasing number of drop-outs from the formal education system.
(The national average for drop-out rates in the elementary level increased from 9.82% for academic year 2004-2005 to 10.57 % for aca-demic year 2005-2006, while that in secondary level rose from 11.30% to 15.81% during the same period. The ARMM has much higher drop-out rates considering that the ARMM region has the highest illiteracy rate among regions.
i. Support legislative measures for the establish-ment of the Lanao Lake Development Author-ity whose mandate among others will be the protection and preservation of Lake Lanao.
j. There is a need for the government to fully develop ARMM’s agricultural sector and supporting infrastructure through clear cut legislations.
k. Develop a targeted yet comprehensive work-force development initiative for Out-of-School Youth (OSY), supported by public/private sector partnerships, to include the following components:• An alternative learning system to provide
basic functional competencies, equivalent to a high school certifi cate
• Focused technical vocational education and training to acquire government certi-fi ed competencies
• Opportunities for employment of Bangsamoro & Lumads pro-ratio with the percentage of the population in the localities with participating businesses in Mindanao

154 SOCIAL WATCH PHILIPPINES
a. Lobby for the crafting of laws and ordinances that will employ propor-tionately
• Supervised facility for micro fi nancing available for youth and small-scale busi-ness ventures
l. Suspension of Expanded Value-Added Tax.
C. Ending the National OppressionEnding the National Oppression against the
Moro people is ending poverty and inequality. The Right to Self-determination in the form of a genuine governance system as a political paradigm to end the National Oppression should translate into a workable form to be considered as a concrete rallying tool of the Moro masses given the historical facts. The dynamics of the 13 Moro ethno-linguistic tribes shall exceed their ethnicity. Broad Moro mass movement shall be stakeholders of any gains from the negotiating tables and from other gains under the democratic window of Philippine political leadership.
Unless a workable governance system is in place, that will subsequently end the national oppression, the claim and struggle for sovereignty of the Moro people’s will remained a challenge of the Moro generations
ahead within the Philippine political system and in the international arena. The unquestionable historical claim for sovereignty, which is consistent with international laws and documents, is a solid ground for the Moro struggle for the Right to Self-determination against historical injustices, discrimination and poverty.
References
Department of Education. 2008-2009.DOH. 2007.INCITEGOV. 2007. Study. Llanto, J. F. 2008. Mindanao Still Poorest Island in Nearly A
Decade. abs-cbnNEWS.com/Newsbreak.Mindanao Economic Development Council (MEDCO). 2007 Foreign
Trade Report.Monsod, T. 2009. Philippine Human Development Report
2008/2009. (principal author)NDHS. 2008.NNS & FNRI. 1998NNS & FNRI. 2008NSCB. 2000. Philippine Statistical Yearbook. Tables 10.5 & 10.6NSCB. 2006. Poverty StatisticsNSO. 2006. Offi cial Poverty Statistics – FIES.Pacturan, J. 2004. Rural enterprises for poverty reduction and
human security. United Nations Development Programme (UNDP). Comparison of
HDIs. http://www.undp.org.ph/?link=news&news_id=238&fa=1 World Bank. 2005. Joint Social Assessment.
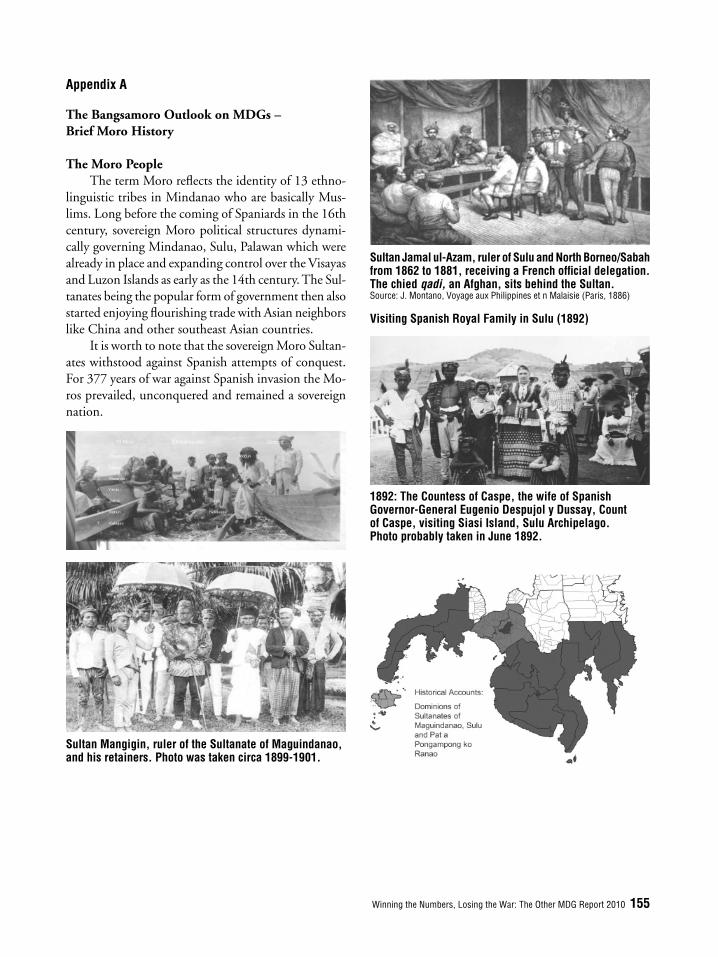
Winning the Numbers, Losing the War: The Other MDG Report 2010 155
Appendix A
The Bangsamoro Outlook on MDGs – Brief Moro History
The Moro PeopleThe term Moro refl ects the identity of 13 ethno-
linguistic tribes in Mindanao who are basically Mus-lims. Long before the coming of Spaniards in the 16th century, sovereign Moro political structures dynami-cally governing Mindanao, Sulu, Palawan which were already in place and expanding control over the Visayas and Luzon Islands as early as the 14th century. The Sul-tanates being the popular form of government then also started enjoying fl ourishing trade with Asian neighbors like China and other southeast Asian countries.
It is worth to note that the sovereign Moro Sultan-ates withstood against Spanish attempts of conquest. For 377 years of war against Spanish invasion the Mo-ros prevailed, unconquered and remained a sovereign nation.
Sultan Mangigin, ruler of the Sultanate of Maguindanao, and his retainers. Photo was taken circa 1899-1901.
Sultan Jamal ul-Azam, ruler of Sulu and North Borneo/Sabah from 1862 to 1881, receiving a French offi cial delegation. The chied qadi, an Afghan, sits behind the Sultan.Source: J. Montano, Voyage aux Philippines et n Malaisie (Paris, 1886)
Visiting Spanish Royal Family in Sulu (1892)
1892: The Countess of Caspe, the wife of Spanish Governor-General Eugenio Despujol y Dussay, Count of Caspe, visiting Siasi Island, Sulu Archipelago. Photo probably taken in June 1892.

156 SOCIAL WATCH PHILIPPINES
Moro situation after the Treaty of ParisThe Bangsamoro homeland (Mindanao, Sulu and
Palawan) was illegally annexed in the US$ 20,000.00 Treaty of Paris buy out between the US and Spain in 1898 through a mock battle in Manila. Several his-torical archives showed proof of evidence including the details of communications between Commissioners of the Spanish and American Commissions working to realize the treaty of peace in 1898.
Showcasing the manipulation of the US and Philippines neo-colonial regimes after the Treaty of Paris, political and social exclusion/inclusion were imposed through the US rubber stamped Philippine Legislature. These neo-colonial policies opened up the fl oodgate of migration. Infl ux of settlers from Northern and Central Philippines to Mindanao has resulted to the minoritization, exploitation and dis-crimination against the Moros and Lumads which to this day forms part of the National Oppression of the Philippine state.
Filipino leaders’ policy during the American and Commonwealth Period is refl ected in the words of Philippine Commonwealth President Manuel Luis Quezon who said “Unless we fully opened up, pro-tected and settled, and thus made use of this great, rich, only partly developed island, some other nation might someday try to move in and make it their own. For the past twenty years, continued and successful efforts to colonize Mindanao from the north have been undertaken.”
The colonization or minoritization program was undertaken through invalidation of all landholdings of Moros and indigenous peoples under Philippine Bill of 1902, Sec. 84. Land Laws during the American and Commonwealth period included:
1. Land Registration Act (Act No. 496) of No-vember 1902
2. Act No. 718 April 1903– made void land grants from Moro sultans
or datus or chiefs of any non Christian tribe when made without government authority or consent
3. Public Land Act 926– all lands not registered under Act 496 are
declared public lands, which may be Ac-quired by homestead, purchase and lease
How land is granted under these laws:
Land Law Christians and US Citizens
Moro and non-Christians
(Tribes)
Public Land Act 16 hectares 16 hectares
Act No. 2874 24 hectares 10 hectares
Commonwealth Act No. 41
16 hectares 4 hectares
Series of land grants in Mindanao to settlers from Luzon and Visayas:
a. Act No. 2254 (1913), Agricultural Colonies Act creating agri-colonies in Cotabato Valley; Act No. 2280 (1914) creating agricultural colony in Momungan (Balo-i), Lanao; Act No. 2206 (1919) authorizing provincial boards to manage colonies (Zamboanga opened Lamitan, Sulu opened Tawi-Tawi, Bukidnon opened Marilog, Cotabato opened Salunayan & Maganoy); Resettlement done by Interisland Migration Division (1919-1930) of the Bureau of Labor (opened Kapalong, Guiangga, Tagum, Lupon and Baganga in Davao, Labangan in Zamboanga; Lamitan in Basilan; Cabadbaran in Butuan; Buenavista in Agusan; Momungan and Kapatagan valley in Lanao; brought in more settlers to Pikit and Pagalungan);
b. Act No. 4197 Quirino-Recto Colonization Act / Organic Charter of Organized Land Settle-ment (1935); Act No. 441 Creating National Land Settlement Administration (NLSA) (opened Koronadal Valley and Ala Valley in Cotabato, and Mallig plains in Isabela); Rice and Corn Production Administration (RCPA) created in 1949 to promote rice and corn production (opened Buluan in Cotabato and Maramag-Wao in Bukidnon-Lanao border); 1951, Land Settlement Development Cor-poration (LASEDECO) (opened Tacurong, Isulan, Bagumbayan, Part of Buluan, Sultan sa Barongis, Ampatuan); 1951, Economic De-velopment Corps (EDCOR) for captured and surrendered Huks (opened Arevalo in Sapad, Lanao del Norte; Genio in Alamada, Gallego
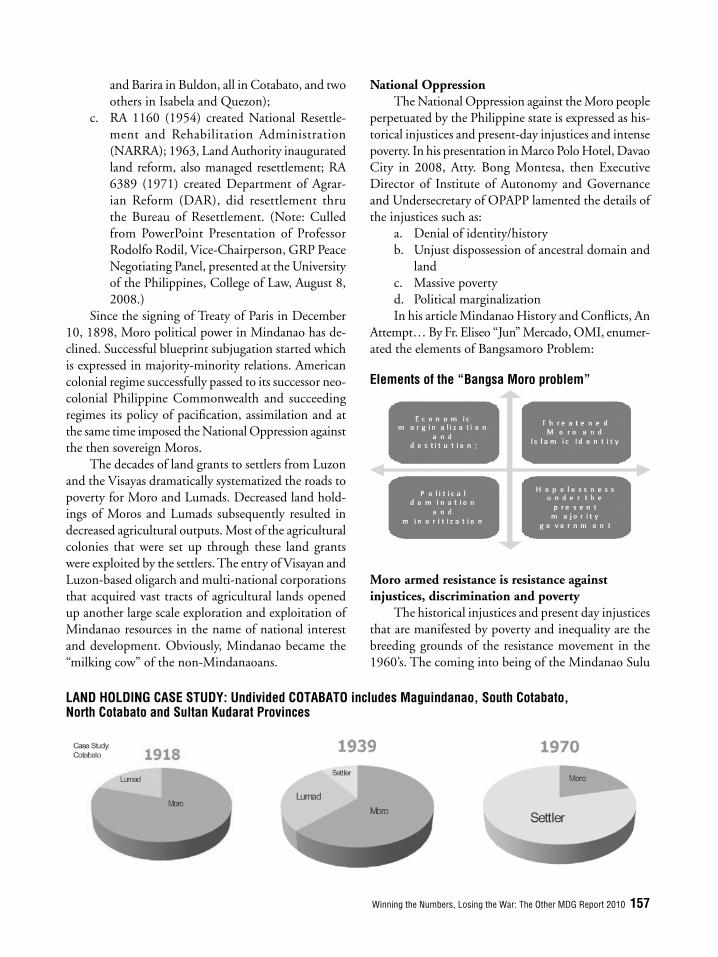
Winning the Numbers, Losing the War: The Other MDG Report 2010 157
and Barira in Buldon, all in Cotabato, and two others in Isabela and Quezon);
c. RA 1160 (1954) created National Resettle-ment and Rehabilitation Administration (NARRA); 1963, Land Authority inaugurated land reform, also managed resettlement; RA 6389 (1971) created Department of Agrar-ian Reform (DAR), did resettlement thru the Bureau of Resettlement. (Note: Culled from PowerPoint Presentation of Professor Rodolfo Rodil, Vice-Chairperson, GRP Peace Negotiating Panel, presented at the University of the Philippines, College of Law, August 8, 2008.)
Since the signing of Treaty of Paris in December 10, 1898, Moro political power in Mindanao has de-clined. Successful blueprint subjugation started which is expressed in majority-minority relations. American colonial regime successfully passed to its successor neo-colonial Philippine Commonwealth and succeeding regimes its policy of pacifi cation, assimilation and at the same time imposed the National Oppression against the then sovereign Moros.
The decades of land grants to settlers from Luzon and the Visayas dramatically systematized the roads to poverty for Moro and Lumads. Decreased land hold-ings of Moros and Lumads subsequently resulted in decreased agricultural outputs. Most of the agricultural colonies that were set up through these land grants were exploited by the settlers. The entry of Visayan and Luzon-based oligarch and multi-national corporations that acquired vast tracts of agricultural lands opened up another large scale exploration and exploitation of Mindanao resources in the name of national interest and development. Obviously, Mindanao became the “milking cow” of the non-Mindanaoans.
LAND HOLDING CASE STUDY: Undivided COTABATO includes Maguindanao, South Cotabato, North Cotabato and Sultan Kudarat Provinces
National OppressionThe National Oppression against the Moro people
perpetuated by the Philippine state is expressed as his-torical injustices and present-day injustices and intense poverty. In his presentation in Marco Polo Hotel, Davao City in 2008, Atty. Bong Montesa, then Executive Director of Institute of Autonomy and Governance and Undersecretary of OPAPP lamented the details of the injustices such as:
a. Denial of identity/history b. Unjust dispossession of ancestral domain and
landc. Massive poverty d. Political marginalization In his article Mindanao History and Confl icts, An
Attempt… By Fr. Eliseo “Jun” Mercado, OMI, enumer-ated the elements of Bangsamoro Problem:
Elements of the “Bangsa Moro problem”
Moro armed resistance is resistance against injustices, discrimination and poverty
The historical injustices and present day injustices that are manifested by poverty and inequality are the breeding grounds of the resistance movement in the 1960’s. The coming into being of the Mindanao Sulu

158 SOCIAL WATCH PHILIPPINES
and Palawan movement and Mindanao Independent Movement lead by Moro politicians such as Sen. Sali-pada Pendatun and Cong. Rashid Lucman respectively is an assertion of the Moro people’s right to self-deter-mination to end injustices, political marginalization and poverty. These movements gained strength and prominence when they founded the Moro National Liberation Front (MNLF) lead by the University of the Philippines Professor Nur Misuari. Later in 1978, the Moro Islamic Liberation Front (MILF) was es-tablished lead by Moro religious icon Ustadz Hashim Salamat. Both the MNLF and MILF had engaged in full blown wars against the Philippine government not because these revolutionary forces wanted to seize po-litical power from the Philippine state but because the struggle is a legitimate expression of the Moro people’s resistance against decades of injustices, discrimination and poverty.
Philippine state policy towards armed resistanceThe Philippine government implemented a multi-
faceted framework in dealing with the armed resistance of the Moro revolutionaries. After the completion of the resettlement program of bringing an infl ux of migrants from the North and Central Philippines to Mindanao that subsequently made the migrants the majority of the population compared to native Mindanaons such as the Moros and Lumads, violence and confl icts over land ownership occurred. Vigilantes and para-military groups were organized and the ensuing cycle of land confl icts have been under the guise of religious (Muslim & Christian) divides.
Militarization The intensity of violence in Mindanao is also a
blessing in disguise in favor of the former military strongman Ferdinand Marcos who placed the entire country under Martial Law in 1972. Pacifi cation and assimilation processes continue to wreck havoc against the now minority Moros and Lumads. While Marcos did his best through Martial Law, Cory Aquino opened up a “democratic window” but still pursued the Low Intensity Confl ict in dealing with the armed resistance. Her successor Fidel Ramos championed his maximum tolerance deeply rooted in his Westpointer way of counter-insurgency tactics. Joseph Estrada declared an “all-out war” policy and Gloria Arroyo just continued what Estrada started even to the extent of putting into jail the MNLF leader Nur Misuari. Militarization
brings in endless confl icts and aggravates poverty in the region.
Peace negotiationsFormer military strongman Ferdinand Marcos
inked the Tripoli Agreement in 1976 ending the inten-sive war between the Moro National Liberation Front (MNLF) and the GRP. Brokered by Libya through the auspices of Organizations of Islamic Conference (OIC) which MNLF is a member, the negotiation underwent major ups and downs due to the vague-ness of the provisions of the Tripoli Agreement. Cory Aquino did her own Jeddah Accord with the MNLF as part of her ‘democratic space’ following her victory that toppled the military dictator Ferdinand Marcos. The Jeddah Accord has resulted in no major impact but did douse the militancy of the revolution in the process. Fidel Ramos reaped the fruits of Cory Aquino posturing that weakened the militancy of the MNLF and brought the aging MNLF head Nur Misuari into signing the GRP-MNLF Final Peace Agreement in 1996. In 1997, peace negotiations also started between the GRP and Moro Islamic Liberation Front (MILF) under the Moro religious icon Hashim Salamat. The negotiation which was not made transparent and claimed of consultations from within Mindanao, pro-duced the Memorandum of Agreement of Ancestral Domain (MOA-AD),crafted and initialed by both the GRP and MILF, but was later junked by the Philip-pine Supreme Court.
To date, review and continued refi nement of the GRP-MNLF Final Peace Agreement is underway for the implementation of the Second Phase of the Agreement. The GRP-MNLF signed the MoU in Tripoli, Libya, on March 20, 2010, and inked another peace deal on May 30, 2010 in Surabaya, Indonesia, for the Bangsam-oro Development Assistance Fund or BDAF, with an initial Php 100 million allocation from the President’s contingency plan. BDAF’s creation (Executive Order No. 872 by former PGMA) was recommended by the tripartite review of the 1996 fi nal peace agreement to implement an economic catch-up plan. Will this be honored by the latest Philippine president? That we have yet to know.
On June 3, 2010, the GRP and MILF signed the Declaration of Continuity for Peace Negotiation which is still being brokered by the Malaysian government with additional members of the International Monitor-ing Team such as the European Union as Coordinator

Winning the Numbers, Losing the War: The Other MDG Report 2010 159
of the Humanitarian, Rehabilitation and Development Component and Norway as the member of Security Component. These are in addition to the International Contact Group (ICG) – the United Kingdom, Japan and Turkey.
Development InterventionsMassive development projects were introduced in
Mindanao, from the Commonwealth period upto the height of migration of settlers to Mindanao, basically to develop agricultural lands. This is where the phrase “Land of Promise” cropped up. It’s a government promise to the settlers which resulted in the granting of vast tracts of lands all over Mindanao. Road networks were engineered along with airports and seaports and other infrastructures primarily to serve the investments brought into the area. Employment opportunities brought by these investments were not enjoyed by the locals (Moros & Lumads). It was the labor force coming from the settlers that were tapped and thus promoted a second wave of migrants.
The GRP-MNLF FPA in 1996 provided a win-
dow for the much needed development in the 13 identifi ed provinces in Mindanao. However, projects implemented in the Zones of Peace and Development (ZSOPAD) areas do not have an impact on the targeted beneficiaries. The second phase of the Agreement implementation that resulted in the creation of the present Autonomous Region in Muslim Mindanao (ARMM), failed to deliver the badly needed reparation and basic social services in the Moro communities in the fi ve Muslim-dominated provinces.
There are hopefully rehabilitation and develop-ment projects that will take place as a result of the GRP-MILF talks, but such projects might not be that all possible within the next fi ve years, the target date of the Millennium Development Goals.
Today, the quest for genuine peace and develop-ment in Mindanao areas remains a legitimate aspira-tion of all Mindanaons. Prospects for the Bangsamoro genuine right to self-determination under the new Aquino administration whether it will follow the same path with its predecessors or not, are still to be realized.

160 SOCIAL WATCH PHILIPPINES
Appendix B
Are the Moros Filipinos?Mohd. Musib M. Buat
No. They are not ‘Filipinos’ but they are ‘Philip-pine Citizens’ by operation of law. And how did that happen? It’s a long story. But fi rst let me narrate its historical antecedents before I will talk about the issue on ‘Citizenship’.
Historical antecedentsThe Moros were once free and independent people
under the suzerainty of their sultanates with a defi nite territory or homeland as recognized under various treaties with foreign powers like Spain, Great Britain, Germany and the Netherlands. The Moro sultanates, kingdoms and principalities at the time were known as karajaan or kadatuan (negeri in Malay), endowed with all the elements of a nation-state in the modern legal sense. They conducted foreign trade and commerce and diplomatic relations and entered into treaties of peace and amity, trade and commercial relations with their Asian neighbors as well as various European powers.
The most signifi cant of these treaties entered into by the Moro rulers or suzerains with Spain were the Sultan Qudarat-Lopez Treaty of 1645 and 1648, and the Rajah Bungso-Lopez Treaty of 1646, defi ning and demarcating the respective dominions of the sultanates of Maguindanao-Buayan and Sulu and the colonial possessions of Spain over the Visayas and Luzon. These treaties were honored by Spain until the last days of their colonial rule over the Visayas and Luzon. The so-called “Moro Wars” between the Moros and Spain were better known as ‘wars of supremacy’ between the two nations over the control and collection of tributes on the native inhabitants of the Islands of Visayas and Luzon, accord-ing to the Muslim historian Dr. Cesar Adib Majul (in Muslims in the Philippines, Quezon City, 1973).
The Royal Decree of July 30, 1860 decreed by Queen Isballa II of Spain and the Royal Decree of July 15, 1896 and the Maura law of 1893 that provided organization of municipal governments excluded the Moro territories of Mindanao, Sulu and Palawan. The latter Spanish decrees merely proposed for the estab-lishment of politico-military governments in occupied territories of Mindanao, Sulu and Palawan, excepting the territorial dominions of the Sultanates of Mindanao and Sulu. The last signifi cant treaty entered into by the
Spanish colonial government and the Sultanate of Sulu was the Sulu-Spain Treaty of 1878 which was more a treaty of peace and amity between Sulu and Spain and for the Sulu Sultan recognizing the protection of Spain against any foreign aggression. It was more of a protectorate relationship between Spain and Sulu, and not a territorial possession on the part of Spain over the dominions of Sulu.
The last agreement or treaty entered between the Sultanate of Maguindanao and Rajah Buayan realms with Spain in 1888 was the ‘Act of Conciliation between Spanish sovereign King Alfonso XIII and the Royal Houses of Maguindanao and Buayan,’ represented by Rajah Putri, Queen Regent of Maguindanao (Datu Ut-to’s wife) and by Datu Utto himself, representing Rajah Buayan, to end the war between Spain and Buayan. Like the Sulu-Spain Treaty of 1878, it was a treaty of peace and amity and not capitulation or surrender on the part Datu Uttu of Buayan and his Moro datu allies.
But how did the Moros lose their freedom and sovereign independence? They lost it through deceit and misrepresentation and not by conquest by any foreign power, nor by capitulation or surrender. Spain shamelessly and immorally included the Bangsamoro territories in the cession of the Philippine Islands un-der the Treaty of Paris of December 10, 1898 to the United States. US President William McKinley who had entertained serious doubts as to the sovereignty of Spain over the Sulu Sultanate had promptly directed that a formal agreement be made with the Sulu Sultan on the basis of the Sulu-Spain treaty of 1878. The agreement entered into between Sulu Sultan Jamal ul-Kiram II and US Brig. General Bates is known as the Kiram-Bates Treaty of August 20, 1889 that later became very controversial. The Sulu Sultan and his royal datus maintained that it was a treaty of peace and friendship, the former merely accepted and ac-knowledged the protection of the American fl ag while the United States military authorities claimed that it was a tacit recognition by the Sulu ruler and his datus of the sovereignty of the United States over the Sulu dominions and dependencies.
No agreements were entered into by the US authorities with the Moro suzerains and leaders of Mindanao. The Moro leaders in the mainland, except some of the datus and sultans of the Lake Lanao region (Ranaw) who viewed with suspicion the Americans as not different from their hated enemies – the Span-iards, relied on the promises of the American offi cials
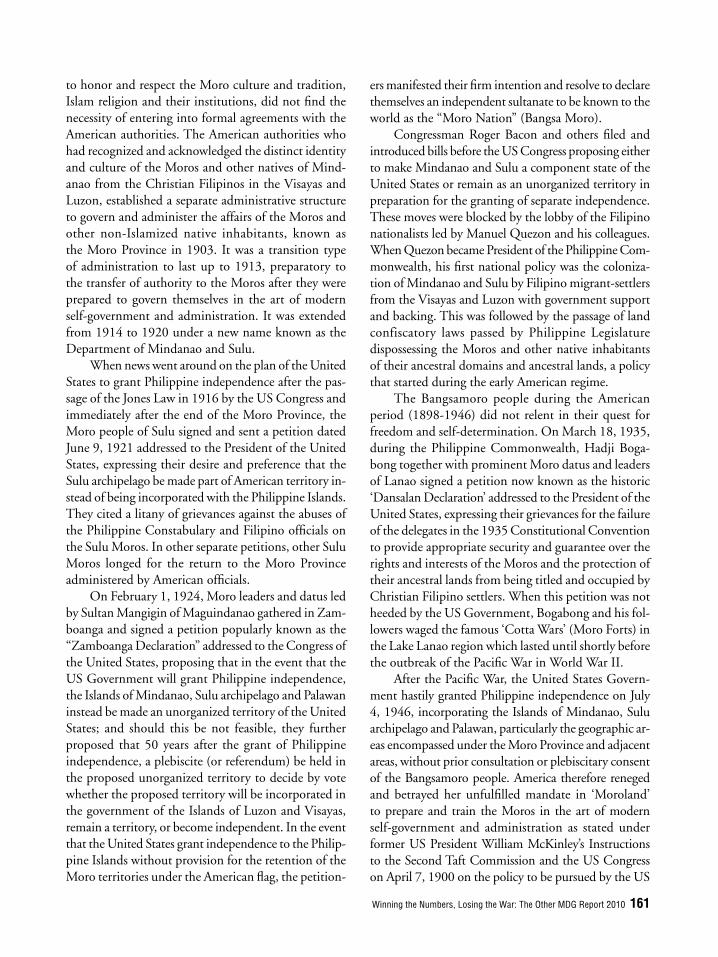
Winning the Numbers, Losing the War: The Other MDG Report 2010 161
to honor and respect the Moro culture and tradition, Islam religion and their institutions, did not fi nd the necessity of entering into formal agreements with the American authorities. The American authorities who had recognized and acknowledged the distinct identity and culture of the Moros and other natives of Mind-anao from the Christian Filipinos in the Visayas and Luzon, established a separate administrative structure to govern and administer the affairs of the Moros and other non-Islamized native inhabitants, known as the Moro Province in 1903. It was a transition type of administration to last up to 1913, preparatory to the transfer of authority to the Moros after they were prepared to govern themselves in the art of modern self-government and administration. It was extended from 1914 to 1920 under a new name known as the Department of Mindanao and Sulu.
When news went around on the plan of the United States to grant Philippine independence after the pas-sage of the Jones Law in 1916 by the US Congress and immediately after the end of the Moro Province, the Moro people of Sulu signed and sent a petition dated June 9, 1921 addressed to the President of the United States, expressing their desire and preference that the Sulu archipelago be made part of American territory in-stead of being incorporated with the Philippine Islands. They cited a litany of grievances against the abuses of the Philippine Constabulary and Filipino offi cials on the Sulu Moros. In other separate petitions, other Sulu Moros longed for the return to the Moro Province administered by American offi cials.
On February 1, 1924, Moro leaders and datus led by Sultan Mangigin of Maguindanao gathered in Zam-boanga and signed a petition popularly known as the “Zamboanga Declaration” addressed to the Congress of the United States, proposing that in the event that the US Government will grant Philippine independence, the Islands of Mindanao, Sulu archipelago and Palawan instead be made an unorganized territory of the United States; and should this be not feasible, they further proposed that 50 years after the grant of Philippine independence, a plebiscite (or referendum) be held in the proposed unorganized territory to decide by vote whether the proposed territory will be incorporated in the government of the Islands of Luzon and Visayas, remain a territory, or become independent. In the event that the United States grant independence to the Philip-pine Islands without provision for the retention of the Moro territories under the American fl ag, the petition-
ers manifested their fi rm intention and resolve to declare themselves an independent sultanate to be known to the world as the “Moro Nation” (Bangsa Moro).
Congressman Roger Bacon and others fi led and introduced bills before the US Congress proposing either to make Mindanao and Sulu a component state of the United States or remain as an unorganized territory in preparation for the granting of separate independence. These moves were blocked by the lobby of the Filipino nationalists led by Manuel Quezon and his colleagues. When Quezon became President of the Philippine Com-monwealth, his fi rst national policy was the coloniza-tion of Mindanao and Sulu by Filipino migrant-settlers from the Visayas and Luzon with government support and backing. This was followed by the passage of land confiscatory laws passed by Philippine Legislature dispossessing the Moros and other native inhabitants of their ancestral domains and ancestral lands, a policy that started during the early American regime.
The Bangsamoro people during the American period (1898-1946) did not relent in their quest for freedom and self-determination. On March 18, 1935, during the Philippine Commonwealth, Hadji Boga-bong together with prominent Moro datus and leaders of Lanao signed a petition now known as the historic ‘Dansalan Declaration’ addressed to the President of the United States, expressing their grievances for the failure of the delegates in the 1935 Constitutional Convention to provide appropriate security and guarantee over the rights and interests of the Moros and the protection of their ancestral lands from being titled and occupied by Christian Filipino settlers. When this petition was not heeded by the US Government, Bogabong and his fol-lowers waged the famous ‘Cotta Wars’ (Moro Forts) in the Lake Lanao region which lasted until shortly before the outbreak of the Pacifi c War in World War II.
After the Pacifi c War, the United States Govern-ment hastily granted Philippine independence on July 4, 1946, incorporating the Islands of Mindanao, Sulu archipelago and Palawan, particularly the geographic ar-eas encompassed under the Moro Province and adjacent areas, without prior consultation or plebiscitary consent of the Bangsamoro people. America therefore reneged and betrayed her unfulfi lled mandate in ‘Moroland’ to prepare and train the Moros in the art of modern self-government and administration as stated under former US President William McKinley’s Instructions to the Second Taft Commission and the US Congress on April 7, 1900 on the policy to be pursued by the US
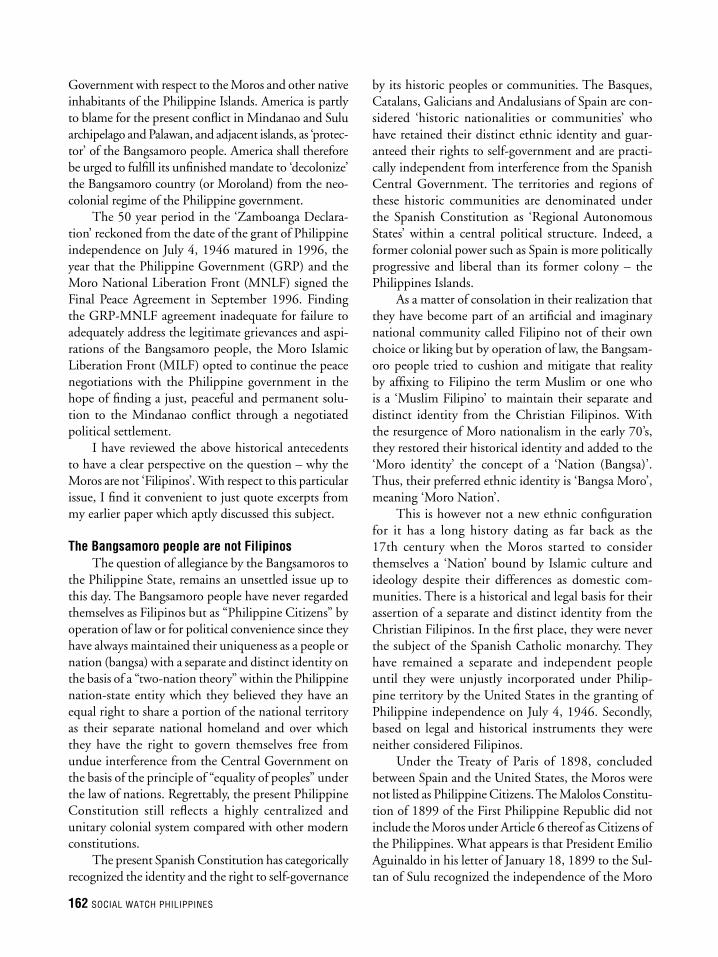
162 SOCIAL WATCH PHILIPPINES
Government with respect to the Moros and other native inhabitants of the Philippine Islands. America is partly to blame for the present confl ict in Mindanao and Sulu archipelago and Palawan, and adjacent islands, as ‘protec-tor’ of the Bangsamoro people. America shall therefore be urged to fulfi ll its unfi nished mandate to ‘decolonize’ the Bangsamoro country (or Moroland) from the neo-colonial regime of the Philippine government.
The 50 year period in the ‘Zamboanga Declara-tion’ reckoned from the date of the grant of Philippine independence on July 4, 1946 matured in 1996, the year that the Philippine Government (GRP) and the Moro National Liberation Front (MNLF) signed the Final Peace Agreement in September 1996. Finding the GRP-MNLF agreement inadequate for failure to adequately address the legitimate grievances and aspi-rations of the Bangsamoro people, the Moro Islamic Liberation Front (MILF) opted to continue the peace negotiations with the Philippine government in the hope of fi nding a just, peaceful and permanent solu-tion to the Mindanao confl ict through a negotiated political settlement.
I have reviewed the above historical antecedents to have a clear perspective on the question – why the Moros are not ‘Filipinos’. With respect to this particular issue, I fi nd it convenient to just quote excerpts from my earlier paper which aptly discussed this subject.
The Bangsamoro people are not FilipinosThe question of allegiance by the Bangsamoros to
the Philippine State, remains an unsettled issue up to this day. The Bangsamoro people have never regarded themselves as Filipinos but as “Philippine Citizens” by operation of law or for political convenience since they have always maintained their uniqueness as a people or nation (bangsa) with a separate and distinct identity on the basis of a “two-nation theory” within the Philippine nation-state entity which they believed they have an equal right to share a portion of the national territory as their separate national homeland and over which they have the right to govern themselves free from undue interference from the Central Government on the basis of the principle of “equality of peoples” under the law of nations. Regrettably, the present Philippine Constitution still refl ects a highly centralized and unitary colonial system compared with other modern constitutions.
The present Spanish Constitution has categorically recognized the identity and the right to self-governance
by its historic peoples or communities. The Basques, Catalans, Galicians and Andalusians of Spain are con-sidered ‘historic nationalities or communities’ who have retained their distinct ethnic identity and guar-anteed their rights to self-government and are practi-cally independent from interference from the Spanish Central Government. The territories and regions of these historic communities are denominated under the Spanish Constitution as ‘Regional Autonomous States’ within a central political structure. Indeed, a former colonial power such as Spain is more politically progressive and liberal than its former colony – the Philippines Islands.
As a matter of consolation in their realization that they have become part of an artifi cial and imaginary national community called Filipino not of their own choice or liking but by operation of law, the Bangsam-oro people tried to cushion and mitigate that reality by affi xing to Filipino the term Muslim or one who is a ‘Muslim Filipino’ to maintain their separate and distinct identity from the Christian Filipinos. With the resurgence of Moro nationalism in the early 70’s, they restored their historical identity and added to the ‘Moro identity’ the concept of a ‘Nation (Bangsa)’. Thus, their preferred ethnic identity is ‘Bangsa Moro’, meaning ‘Moro Nation’.
This is however not a new ethnic confi guration for it has a long history dating as far back as the 17th century when the Moros started to consider themselves a ‘Nation’ bound by Islamic culture and ideology despite their differences as domestic com-munities. There is a historical and legal basis for their assertion of a separate and distinct identity from the Christian Filipinos. In the fi rst place, they were never the subject of the Spanish Catholic monarchy. They have remained a separate and independent people until they were unjustly incorporated under Philip-pine territory by the United States in the granting of Philippine independence on July 4, 1946. Secondly, based on legal and historical instruments they were neither considered Filipinos.
Under the Treaty of Paris of 1898, concluded between Spain and the United States, the Moros were not listed as Philippine Citizens. The Malolos Constitu-tion of 1899 of the First Philippine Republic did not include the Moros under Article 6 thereof as Citizens of the Philippines. What appears is that President Emilio Aguinaldo in his letter of January 18, 1899 to the Sul-tan of Sulu recognized the independence of the Moro

Winning the Numbers, Losing the War: The Other MDG Report 2010 163
people and offered them “bonds of fraternal unity” and “solidarity on the bases of absolute respect for the beliefs and traditions of the Moros”.. The Philippine Bill of 1902 passed by the U.S. Congress defi nes Philippine Citizens as ‘all inhabitants of the Philippine Islands who were subjects of Spain, their children and descendants’. The Moros were never subjects of Spain.
The Jones Law of 1916 passed by the U.S. Con-gress similarly defi ned Philippine Citizens as former subjects of Spain. It, however, contained a proviso which provides that, except by law the existence of Philippine Citizenship shall be provided by the Phil-ippine Legislature which was a legal contingency. The 1935 Constitution may have extended Philippine Citizenship to the Moros in ambiguous terms when it provided that Philippine Citizenship covers: 1) Those who are citizens of the Philippine Islands at the time of the adoption of the Constitution; 2) Those born of foreign parents who before the adoption of this Con-stitution were elected to public offi ce; 3) Those whose fathers and mothers are Citizens of the Philippines; and 4) by naturalization.
Although the Bangsamoro people may have been extended Philippine Citizenship, either by implication or by operation of law, the question of allegiance re-mains disputed and unsettled because the Moros until now have been asserting their separate national identity as Bangsa Moros and they could hardly accept being identifi ed as Filipino for not having been the subject of the Spanish Catholic monarchy, nor Moroland a colony of Spain. One of the main general concepts which the Peace Negotiating Parties have reached a consensus point was the MILF Position during the 7th Exploratory Talks held in Kuala Lumpur, Malaysia on April 18-20, 2005, is the general principle that:
“It is the birthright of all Moros and other in-digenous peoples of Mindanao to identify themselves and be accepted as ‘Bangsa Moros’. The Bangsamoro people refers to those who have been designated as natives or are identifi ed descendants of those original inhabitants of Mindanao and its adjacent islands in-cluding Palawan and the Sulu archipelago at the time of conquest or colonization whether mixed or of full native blood. Spouses and their descendants are classi-fi ed as Bangsamoro.”
Upon suggestion by the GRP Peace Panel which the MILF Peace Panel concurred, the Indigenous peoples are given the ‘freedom of choice’ whether or not they wish to identify themselves as ‘Bangsamoros’.
Except for a few, the majority of the Indigenous peoples accept being identifi ed as ‘Bangsamoros’. The Bangsamoro identity is the parallel of Malaysia’s ‘Bu-miputra’ which meant ‘children of the soil’, an ethnic confi guration encompassing all Malays, Sabahans and Sarawakians as owners of all Federal lands of Malaysia, excluding the Chinese migrants. On top of this, the ‘Bumis’ are granted special privileges in both economic and political life, such as education, employment, medi-cal services, housing, award of government contracts and business opportunities over those of the Chinese migrants and Indians.
The Bangsamoro identity is based on ethnic or cul-tural nationalism by a group of people seeking selfhood or nationhood which was usurped from them. They have now come of age and they now assert to restore that lost freedom via decolonization and through their col-lective right to self-determination under international law and norms, treaties and conventions. Indeed, the usurpation of the Bangsamoro political sovereignty and territorial integrity are the two major injustices and legitimate grievances that constitute the main root causes of the Mindanao confl ict and of the Bangsamoro problem. The Moros who had successfully defended and preserved their freedom and independence from the aggression of various foreign powers, have become a ‘hostage nation’ to a post-world war fabricated neo-colonial regime – the Republic of the Philippines. (cf. Joseph Fallon).
The Bangsamoro dilemma is not without a formula or solution. ‘Ethnic nationalism’ or the ‘politics of sub-nationalism’ is a worldwide phenomenon of the post-world war era because former colonial powers realigned the historical borders of historic nations, peoples and communities making them ‘hostage nations’ by newly fabricated post-colonial states contrary to their own free will and consent. The United Nations came up with the lists of colonized peoples for ‘decolonization’ under the ‘trusteeship program’. However, many of these hostage nations, nationalities and peoples were unlisted for decolonization, among them are the Bangsamoro people of Mindanao, Sulu Archipelago and Palawan and adjacent islands.
Legal scholars and political authorities point out that “[Until] recently, most efforts to resolve sover-eignty-based confl icts have faltered due to the limited legal and political tools available to policy makers. The two most applicable principles, sovereignty and self-determination have been reduced to little more than

164 SOCIAL WATCH PHILIPPINES
legal and political shields behind which states and sub-state entities justify their actions.” However, “[While] these two basic principles of international law may sometimes be reconciled to create a lasting settlement of a sovereignty-based confl ict, more frequently they are a recipe for political gridlock and violence.” In view of this dilemma, recent state practice developed as ‘evi-denced by a growing creativity among states and policy makers which has led to the emergence of a more elastic approach to resolving sovereignty-based confl icts…the seeds of which can be found in a number of recent peace proposals and peace agreements, can be termed ‘earned sovereignty’. (cf. Paul R. Williams, et. al.).
For a group entitled to a right to collectively deter-mine its political destiny, the Bangsamoro people appro-priately falls within the UNESCO Experts’ defi nition of ‘people’ ‘as individuals who relate to one another and not just on the level of individual association but also based upon a shared consciousness, and possibly with institutions that express their identity. The indicative characteristics in defi ning ‘people’ according to the UNESCO are: “(a) a common historical tradition; (b) religious or ethnic identity; (c) cultural homogeneity; (d) linguistic unity; (e) religious or ideological affi nity; (f) territorial connection; and (g) common economic life.”. The Bangsamoro people possess suffi cient or most if not all of the above distinctive identity or characteristics as a ‘people’ endowed with the collective right to self-determination.
In order to reconcile the opposing principles of state sovereignty and the equally recognized principle of the right to self-determination, the government and the MILF Peace negotiating panels came up with a new and novel formula. And what is this new formula?
The MOA-AD is a new formula in conflict resolution
The Memorandum of Agreement on Ancestral Domain (MOA-AD) is an elegant document and a new formula designed to resolve historical injustices, one of which is ‘injustice to the ‘Moro identity’. The Bangsamoro struggle for freedom and defense of home-land for more than 300 years against colonial Spain is not well recognized and acknowledged by the domi-nant Christian majority. The Moros equally deserve recognition of their separate and distinct identity as ‘Bangsamoro’, not that they wish to secede or establish a separate independent state. They equally fought for this land known as Philippine Islands. They are simply invoking a ‘two-nation’ theory which means two or
more nations may co-exist in the same territory and as in other plural societies.
This is precisely, why the MOA-AD has contained the concept of ‘associative relations’ between the proposed Bangsamoro Juridical Entity (BJE) and the Central Government or akin to that of ‘federacy’ under a unitary system. The proposed BJE as a political entity is ‘in-between’ the range more advanced than ‘enhanced autonomy’ but short of being a full ‘free associated state’ as understood in current political theory and practice. At most, it has the status of a ‘sub-state’, (or a ‘conditional state’, or at least a ‘quasi-state’). It could later become a component federal state with residual powers, if ever the Philippines decides to amend or revise the Philippine Constitution and shifts to a federal form of government.
The ‘associative relationship’ between the proposed BJE and the Central government is a concept not the same as the ‘Free Associated State’ similar to those of Marshall Islands, Mariana and Pulau who are in ‘free association’ with the United States as the latter’s former trust territories. The BJE may be designed to have some features with that of Cook Island or even Puerto Rico but not exactly parallel and its fi nal confi gura-tion or designation is still subject to further discussion during the formal negotiation of the Comprehensive Peace Compact, and may not be immediately fully implemented but will still undergo a transition period for capacity and institution building preparatory to its exercise of self-governance while being gradually devolved with ‘shared powers and authority ‘ from the parent state (Central government) under the concept of ‘shared sovereignty’.
On top of this, it is still further subject to any necessary changes in the legal framework to make it fully operational as a juridical entity. The objections to this concept are all speculative and unfounded for fear of the ‘unknown’ and an obvious manifestation of an ‘anti-Moro bias and prejudice’. If the Filipinos don’t like and care for the Moros, why not allow them to chart their own separate ways to become independent? But if, indeed, the dominant Filipino majority do care and love the Moros, give them what they deserve! With the declaration of the MOA-AD as unconstitutional by the Supreme Court, the Bangsamoro people are compelled to seek redress from other international forums or revert to their original position of aspiring for independence by whatever means, including under international law and diplomacy.

Winning the Numbers, Losing the War: The Other MDG Report 2010 165
UPDATED OFFICIAL LIST OF MDG INDICATORS after the 2007 revision1
All indicators should be disaggregated by sex and urban/rural as far as possible.
1 In 2007, the UN General Assembly adopted four new targets and ten indicators.2 For monitoring country poverty trends, indicators based on national poverty lines should be used, where available.
Millennium Development Goals (MDGs)
Goals and Targets (from the Millennium Declaration) Indicators for monitoring progress
Goal 1: Eradicate extreme poverty and hunger
Target 1.A: Halve, between 1990 and 2015, the proportion of people whose income is less than one dollar a day
1.1 Proportion of population below $1 (PPP) per day1 1.2 Poverty gap ratio 1.3 Share of poorest quintile in national consumption
Target 1.B: Achieve full and productive employment and decent work for all, including women and young people
1.4 Growth rate of GDP per person employed 1.5 Employment-to-population ratio 1.6 Proportion of employed people living below $1 (PPP)
per day 1.7 Proportion of own-account and contributing family
workers in total employment Target 1.C: Halve, between 1990 and 2015, the proportion of people who suffer from hunger
1.8 Prevalence of underweight children under-five years of age
1.9 Proportion of population below minimum level of dietary energy consumption
Goal 2: Achieve universal primary education
Target 2.A: Ensure that, by 2015, children everywhere, boys and girls alike, will be able to complete a full course of primary schooling
2.1 Net enrolment ratio in primary education 2.2 Proportion of pupils starting grade 1 who reach last
grade of primary 2.3 Literacy rate of 15-24 year-olds, women and men
Goal 3: Promote gender equality and empower women
Target 3.A: Eliminate gender disparity in primary and secondary education, preferably by 2005, and in all levels of education no later than 2015
3.1 Ratios of girls to boys in primary, secondary and tertiary education
3.2 Share of women in wage employment in the non-agricultural sector
3.3 Proportion of seats held by women in national parliament
Goal 4: Reduce child mortality
Target 4.A: Reduce by two-thirds, between 1990 and 2015, the under-five mortality rate
4.1 Under-five mortality rate 4.2 Infant mortality rate 4.3 Proportion of 1 year-old children immunised against
measles

166 SOCIAL WATCH PHILIPPINES
3 The actual proportion of people living in slums is measured by a proxy, represented by the urban population living in households with at least one of the four characteristics: (a) lack of access to improved water supply; (b) lack of access to improved sanitation; (c) over-crowding (3 or more persons per room); and (d) dwellings made of non-durable material.
Goals and Targets (from the Millennium Declaration) Indicators for monitoring progress
Goal 5: Improve maternal health
Target 5.A: Reduce by three quarters, between 1990 and 2015, the maternal mortality ratio
5.1 Maternal mortality ratio 5.2 Proportion of births attended by skilled health personnel
Target 5.B: Achieve, by 2015, universal access to reproductive health
5.3 Contraceptive prevalence rate 5.4 Adolescent birth rate 5.5 Antenatal care coverage (at least one visit and at least
four visits) 5.6 Unmet need for family planning
Goal 6: Combat HIV/AIDS, malaria and other diseases
Target 6.A: Have halted by 2015 and begun to reverse the spread of HIV/AIDS
6.1 HIV prevalence among population aged 15-24 years 6.2 Condom use at last high-risk sex 6.3 Proportion of population aged 15-24 years with
comprehensive correct knowledge of HIV/AIDS 6.4 Ratio of school attendance of orphans to school
attendance of non-orphans aged 10-14 years Target 6.B: Achieve, by 2010, universal access to treatment for HIV/AIDS for all those who need it
6.5 Proportion of population with advanced HIV infection with access to antiretroviral drugs
Target 6.C: Have halted by 2015 and begun to reverse the incidence of malaria and other major diseases
6.6 Incidence and death rates associated with malaria 6.7 Proportion of children under 5 sleeping under
insecticide-treated bednets and Proportion of children under 5 with fever who are treated with appropriate anti-malarial drugs
6.8 Incidence, prevalence and death rates associated with tuberculosis
6.9 Proportion of tuberculosis cases detected and cured under directly observed treatment short course
Goal 7: Ensure environmental sustainability
Target 7.A: Integrate the principles of sustainable development into country policies and programmes and reverse the loss of environmental resources
7.1 Proportion of land area covered by forest 7.2 CO2 emissions, total, per capita and per $1 GDP
(PPP), and consumption of ozone-depleting substances
7.3 Proportion of fish stocks within safe biological limits 7.4 Proportion of total water resources used
Target 7.B: Reduce biodiversity loss, achieving, by 2010, a significant reduction in the rate of loss
7.5 Proportion of terrestrial and marine areas protected 7.6 Proportion of species threatened with extinction
Target 7.C: Halve, by 2015, the proportion of people without sustainable access to safe drinking water and basic sanitation
7.7 Proportion of population using an improved drinking water source
7.8 Proportion of population using an improved sanitation facility
Target 7.D: By 2020, to have achieved a significant improvement in the lives of at least 100 million slum dwellers
7.9 Proportion of urban population living in slums3

Winning the Numbers, Losing the War: The Other MDG Report 2010 167
The Millennium Development Goals and targets come from the Millennium Declaration, signed by 189 countries, including 147 heads of State and Government, in September 2000 and from further agreement by member states at the 2005 World Summit (Resolution adopted by the General Assembly). The goals and targets are interrelated and should be seen as a whole. They represent a partnership between the developed countries and the developing countries “to create an environment - at the national and global levels alike – which is conducive to development and the elimination of poverty”.
Goals and Targets (from the Millennium Declaration) Indicators for monitoring progress
Goal 8: Develop a global partnership for development
Target 8.A: Develop further an open, rule-based, predictable, non-discriminatory trading and financial system Includes a commitment to good governance, development and poverty reduction – both nationally and internationally Target 8.B: Address the special needs of the least developed countries Includes: tariff and quota free access for the least developed countries' exports; enhanced programme of debt relief for heavily indebted poor countries (HIPC) and cancellation of official bilateral debt; and more generous ODA for countries committed to poverty reduction Target 8.C: Address the special needs of landlocked developing countries and small island developing States (through the Programme of Action for the Sustainable Development of Small Island Developing States and the outcome of the twenty-second special session of the General Assembly) Target 8.D: Deal comprehensively with the debt problems of developing countries through national and international measures in order to make debt sustainable in the long term
Some of the indicators listed below are monitored separately for the least developed countries (LDCs), Africa, landlocked developing countries and small island developing States. Official development assistance (ODA) 8.1 Net ODA, total and to the least developed countries,
as percentage of OECD/DAC donors’ gross national income
8.2 Proportion of total bilateral, sector-allocable ODA of OECD/DAC donors to basic social services (basic education, primary health care, nutrition, safe water and sanitation)
8.3 Proportion of bilateral official development assistance of OECD/DAC donors that is untied
8.4 ODA received in landlocked developing countries as a proportion of their gross national incomes
8.5 ODA received in small island developing States as a proportion of their gross national incomes
Market access 8.6 Proportion of total developed country imports (by
value and excluding arms) from developing countries and least developed countries, admitted free of duty
8.7 Average tariffs imposed by developed countries on agricultural products and textiles and clothing from developing countries
8.8 Agricultural support estimate for OECD countries as a percentage of their gross domestic product
8.9 Proportion of ODA provided to help build trade capacity Debt sustainability 8.10 Total number of countries that have reached their
HIPC decision points and number that have reached their HIPC completion points (cumulative)
8.11 Debt relief committed under HIPC and MDRI Initiatives 8.12 Debt service as a percentage of exports of goods and
services Target 8.E: In cooperation with pharmaceutical companies, provide access to affordable essential drugs in developing countries
8.13 Proportion of population with access to affordable essential drugs on a sustainable basis
Target 8.F: In cooperation with the private sector, make available the benefits of new technologies, especially information and communications
8.14 Telephone lines per 100 population 8.15 Cellular subscribers per 100 population 8.16 Internet users per 100 population


