the origins and evolutionary history of feral apples in
TRANSCRIPT

The Origins and Evolutionary History of Feral Apples in Southern Ontario
by
Dane Cronin
A Thesis
presented to
The University of Guelph
In partial fulfilment of requirements for the degree of
Master of Science
in
Integrative Biology
Guelph, Ontario, Canada
© Dane Cronin, September, 2018

ABSTRACT
THE ORIGINS AND EVOLUTIONARY HISTORY OF FERAL APPLES IN SOUTHERN ONTARIO
Dane Cronin
University of Guelph, 2018
Advisor:
Professor Brian Husband
Feral populations of domesticated crops can establish through hybridization with native
relatives, or through recombination of known cultivars. The relative importance of these
two pathways is not known, especially for woody fruit crops. The goal of this study was
to examine the evolutionary origins of feral populations of Malus domestica (domestic
apple) in southern Ontario using a population genetics analysis. I characterized
genotypes of 467 feral apple trees along with 127 commercial cultivars, ornamental
crabapple cultivars and the native Malus coronaria, using 14 microsatellite markers. The
feral trees were composed of seven genetic subgroups that are distributed throughout
Ontario, and were associated with different commercial cultivars. The results suggest
that feral apples are not products of hybridization with native M. coronaria, rather they
have multiple origins, partly derived from early heritage cultivars. These lineages have
spread and coexist throughout Ontario, rather than being derived strictly from local
sources.

iii
ACKNOWLEDGEMENTS
Many thanks to Brian Husband for his help and guidance in seeing this thesis to
completion and for taking a chance on funding this research. You are an incredible
mentor and have been a beacon of positivity and encouragement for me throughout this
process. My thanks also go to Teresa Crease and Hafiz Maherali of my advisory
committee, who have provided excellent comments and advice for my research.
My special thanks go to Paul Kron, for his ever-present support that made
completing this thesis possible, as well as Candace Park and Sophia Stoltz, who
assisted me with both field and lab work during the summer of 2017. All three of you
had amazing enthusiasm and passion for the research that made for great memories,
which I will cherish forever. Thank you to all my Husband lab-mates, past and present,
who were always willing to listen and give suggestions to help further my research.
Special thanks to Dan Reardon, who gave me a tour of Norfolk County to identify
feral apple populations that he had come across in his travels. Thank you to Aron
Fazekas for assisting me with the microsatellite protocol. I would also like to thank and
acknowledge the following people for collecting reference samples for my research,
Sean Myles, Zoe Migicovsky, and Kendra Sauerteig from the Apple Biodiversity
Collection, Sara Martin from the Central Experimental Farm, and Beatrice Amyotte from
Vineland Research and Innovation Centre. Thank you to Matt Ordidge for allowing me
to use the dataset from the UK National Fruit Collection. Thank you to the following
apple orchard and nursery operators, Christina Stonehouse, Daryl Hunter, and Ken
Roth, who graciously provided me with leaf tissue from their collections.
Thank you to Brayden, Connor, Jason, Justin, Matt, Mel, Mitch, Ron, Tom, Tyler,
and the rest of the boys. I finally did it.
This thesis is dedicated to my mother, Sherry Cronin, and father, Paul Cronin,
who inspired me from an early age to value science and education, and who supported
my choices leading to this point in my life. Thank you.

iv
TABLE OF CONTENTS
Abstract ............................................................................................................................ii
Acknowledgements ......................................................................................................... iii
Table of Contents ............................................................................................................iv
List of Tables ...................................................................................................................vi
List of Figures ................................................................................................................ viii
List of Appendices ...........................................................................................................ix
The origins and evolutionary history of feral apples in southern Ontario ......................... 1
1 Introduction ............................................................................................................ 1
1.1 Research Goals ................................................................................................. 6
2 Methods ................................................................................................................... 7
2.1 Sampling ............................................................................................................ 7
2.2 Microsatellite Analysis ..................................................................................... 9
2.3 Editing the Dataset ........................................................................................ 10
2.4 Hybrid Identification ...................................................................................... 10
2.5 Genetic Diversity ........................................................................................... 12
2.6 Population Structure ..................................................................................... 13
2.7 Parentage Analysis ....................................................................................... 15
3 Results ................................................................................................................ 16
3.1 Hybrid Identification ...................................................................................... 16
3.2 Genetic Diversity: Feral Populations and Reference Cultivars ...................... 17
3.3 Inferred Genetic Groupings ........................................................................... 18
3.4 Genetic Diversity: Inferred Genetic Groupings .............................................. 20

v
3.5 Parentage Analysis ....................................................................................... 21
4 Discussion ........................................................................................................... 22
4.2 Patterns of Exo-Ferality ................................................................................ 22
4.3 Genetic Diversity and Patterns of Endo-Ferality ........................................... 23
4.4 Unexpected Relationships among Feral Trees and Reference Cultivars ...... 27
4.5 Parentage Analysis ....................................................................................... 28
5 Significance ......................................................................................................... 30
References .................................................................................................................... 33
Tables ........................................................................................................................... 43
Figures .......................................................................................................................... 60
Appendices ................................................................................................................... 66

vi
LIST OF TABLES
Table 1: List of Malus domestica (apple) orchards, located at the centre of each five-kilometer radius sampling plot, and their addresses across the five growing regions of southern Ontario. Furthermore, a list of nurseries from which reference cultivar and ornamental samples were collected from. ..................................................................... 43
Table 2: Percentage of the total Malus domestica acreage for the most common cultivars by apple growing region of Ontario in 2016. Other varieties not shown due to smaller acreage but grown in Ontario include: Braeburn, Cox’s Orange Pippin, Creston, Crimson Crisp, Cripps Pink, Elstar, Fortune, Goldrush, Granny Smith, Liberty, Lobo, Lodi, Macoun, Melba, Novaspy, Quinte, Rome, Roxbury Russet, Russet, Shizuka, Silken, Snow, Sunrise, Tolman Sweet, Transparent, Tydeman Red, Viking, Vista Bella, Wealthy, Winesap, and Zestar (Stevens, 2017). ........................................................... 44
Table 3: Descriptive information for 16 Microsatellite (SSR) loci used in the genetic analysis of feral and cultivated Malus domestica, the native crabapple, Malus coronaria, and ornamental Malus species. Linkage groups taken from papers of origin for each SSR locus. .................................................................................................................... 45
Table 4: List of Malus domestica cultivars removed from dataset after clonal assignment analysis using R plugin Polysat, with an assignment threshold of 0.15. The Note column specifies the reason for removal, in order, for each individual. ................. 46
Table 5: Distribution of Malus domestica cultivars across seven subgroups defined by STRUCTURE analysis. The 20 major cultivars grown in Ontario used in this study, any cultivars that were strongly assigned to their initial grouping, or their nested subgrouping are indicated by an X. Any cultivars that match a differently named cultivar from the UK National Fruit Collection are indicated in the note column. Q represents assignment coefficient of individual to a genetic cluster. Country of origin and century of origin data are from Amyote (2018), Volk & Henk (2016), National Fruit Collection (2015), Beach (1905), and Orange Pippin Ltd. (2018). ......................................................................... 47
Table 6: Measures of genetic diversity in Malus domestica for the overall dataset, feral individuals, and reference cultivars. NA: Number of alleles; H0: Observed heterozygosity; HE: Expected heterozygosity; NAE: Effective number of alleles. ........... 49
Table 7: Descriptive information for feral Malus domestica populations found within five sampling regions across southern Ontario. HE: Expected heterozygosity; H0: Observed heterozygosity; NAE: Effective number of alleles; AR: Allelic richness. ......................... 50
Table 8: Pairwise genetic differentiation values (Fst) between five populations of feral Malus domestica apples in southern Ontario. P-values are shown above the diagonal.51

vii
Table 9: Analysis of molecular variance (AMOVA) table for feral samples of Malus domestica corresponding to five sampling regions, and 20 sampling plots within the five regions. ......................................................................................................................... 51
Table 10: Counts of unique alleles observed in only one Malus domestica reference cultivar at each locus, and alleles observed in more than one M. domestica reference cultivar. .......................................................................................................................... 52
Table 11: Descriptive information for two major groups and seven subgroups of Malus domestica identified in STRUCTURE analyses, and the number of genotypes strongly assigned to each group/subgroup. HE: Expected heterozygosity; H0: Observed heterozygosity; NAe: Effective number of alleles; AR: Allelic richness. ......................... 53
Table 12: Differences in distributions of seven subgroups of feral Malus domestica among geographic regions using a Chi square analysis, with Pearson Chi-square values, likelihood ratios, and p-values. .......................................................................... 54
Table 13: Distributions of feral Malus domestica within seven subgroups among five sampling regions represented in a contingency table with an associated post-hoc z-test. ...................................................................................................................................... 54
Table 14: Bivariate analysis comparing proportion of feral Malus domestica individuals assigned to subgroup B1 to proportions of major commercial cultivar production in subgroup B1 in 2016, and 1966. ................................................................................... 55
Table 15: Analysis of molecular variance (AMOVA) table corresponding to two major groups and 7 subgroups of Malus domestica defined in the nested STRUCTURE analysis. ........................................................................................................................ 55
Table 16: Pairwise genetic differentiation values (Fst) between seven subgroups of cultivars and feral Malus domestica in southern Ontario defined by the nested STRUCTURE analysis. ................................................................................................. 56
Table 17: Inferred pedigrees for nine cultivars of Malus domestica whose pedigrees are fully or partially known, within a set of 103 diploid cultivars using 14 SSRs at 95% confidence with CERVUS software. .............................................................................. 57
Table 18: Inferred parental assignments for 47 feral offspring using 14 SSRs at the level of 95% and 80% confidence for comparison, using Cervus parentage analysis. .. 58
Table 19: Most common Malus domestica cultivar pairings for feral offspring inferred through parentage analysis at 95% confidence. ............................................................ 59

viii
LIST OF FIGURES
Figure 1: Distribution of major commercial Malus domestica production in southern Ontario represented by square grids, with red circles corresponding to approximate locations of 20 sampling plots (each 5-kilometer in radius) used for this study within five growing regions (1: Central Region; 2: Central-West Region; 3: East Region; 4 North Region; 5: West Region). The range of Malus coronaria populations within southern Ontario corresponds to the shaded sections of the map, with the black-lined open circle representing the location of rare Charitable Research Reserve, where a major population of M. coronaria is located. Original map taken and used with permission from Kron & Husband (2009). ................................................................................................ 60
Figure 2: STRUCTURE analysis of K = 3 with Malus domestica cultivars, Malus domestica feral individuals, Malus coronaria, and ornamental Malus reference material. Each vertical line represents the membership coefficients assigned to each individual. ...................................................................................................................................... 61
Figure 3: Nested STRUCTURE analysis of feral Malus domestica individuals and reference cultivars. A) STRUCTURE analysis of K = 2 divided into two clustering groups A and B. B) STRUCTURE analysis of K = 5 for group A, individuals arranged in the same order as Figure 3A. Subgroups arranged in order of A1 - A5, Admixed. C) STRUCTURE analysis of K = 2 for group B, individuals arranged in same order as Figure 3A. Subgroups arranged in order of B1, B2. ...................................................... 62
Figure 4: STRUCTURE analysis of K = 2 with Malus domestica cultivars, and five sampling regions of feral Malus domestica sampled across southern Ontario. Blue = Group A, Orange = Group B.......................................................................................... 63
Figure 5: Unweighted neighbor joining tree, showing the two major groupings of Malus domestica defined by STRUCTURE. The tree contains cultivar reference individuals and feral trees. Red = Group A; Blue = Group B. .......................................................... 64
Figure 6: Unweighted neighbor joining tree, showing the 7 subgroups of Malus domestica defined by STRUCTURE. The tree contains cultivar reference individuals and feral trees. .............................................................................................................. 65

ix
LIST OF APPENDICES
Appendix 1: List of heritage cultivar sources. .............................................................. 66
Appendix 2: DNA extraction protocol. .......................................................................... 68
Appendix 3: PCR protocol. .......................................................................................... 70

1
The origins and evolutionary history of feral apples in southern Ontario
1 Introduction
Plants have been taken from their native environments and been introduced by
humans to all parts of the world, and many have become naturalized in their new
environments (Myers & Bazely, 2003). Naturalized species are those that have self-
perpetuating populations capable of surviving over many generations without human
intervention (Richardson et al., 2000). Naturalized populations may establish close to
the original founding individuals, without necessarily invading other ecosystems. In
some cases, however, naturalized species can become invasive, producing offspring in
large numbers and establishing significant distances away from the parent plants
(greater than 100 m). Such species can spread rapidly and negatively affect native
species (Richardson et al., 2000). Understanding the process of naturalization is
important for anticipating when introduced species are likely to become established,
when they are at risk of becoming invasive, and in managing their impacts on native
taxa.
Domesticated species that become naturalized are referred to as feral. These
species, which are a subset of all naturalized species, have escaped cultivation and
establish, reproduce and persist in natural or semi-natural habitats (Bagavathiannan &
Van Acker, 2008). Human-mediated selection creates domesticated species, which
typically differ from their wild ancestors to different degrees (Breton et al., 2008), and
may even be maladapted to the non-cultivated environment. Nevertheless, many
domesticated species have escaped from cultivation. Of the 245 plant species listed as
invasive in Canada, 33 species have an agricultural crop origin (food, fodder, and fibre
use), and 73 have an ornamental or landscaping origin (CFIA, 2008). After escape, feral
populations can diverge genetically from their domesticated progenitors when they

2
experience different selective pressures in an uncultivated environment
(Bagavathiannan & Van Acker, 2008), a process referred to as de-domestication.
The nature and extent of domestication in a given species may affect the
likelihood of naturalization in a non-cultivated environment. Domesticated species may
be less likely to escape since, through the domestication process, they acquire suites of
traits that may reduce fitness in a non-cultivated environment (Bagavathiannan & Van
Acker, 2008). These traits can include lack of seed dormancy and a reduction in seed
dispersal (non-shattering), though these aren’t universal across domesticated species
(Warwick & Stewart, 2005). Alternatively, evidence on the genetic basis of
domestication suggests the impact of domestication on the likelihood of naturalization
may be minor. The domestication process in many crop species is thought to be
relatively short and involves a small number of tightly linked genes controlling
domestication traits (Warwick & Stewart, 2005). Therefore, the reverse process of de-
domestication could also occur with similar speed and lead to wild-type traits such as
prolonged seed dormancy and higher dispersal that allow for successful feral
establishment (Warwick & Stewart, 2005).
Some researchers argue that the rate of naturalization may actually be higher in
domesticated species than non-domesticated species, as there are far more secondary
releases than for species that are accidentally introduced (Kowarik, 2003). Secondary
releases refer to additional introductions of the domesticated species to the landscape
after its initial introduction to a region and can include cultivation itself, and accidental
transport of propagules via vehicles, goods, or people. These mechanisms increase the
chance of ferality by fostering population expansion (Kowarik, 2003). Despite these
contrasting effects, there is still little evidence showing which taxa are predisposed to
better respond to the naturalization process (Warwick & Stewart, 2005).
Two pathways have been proposed to explain how feral populations form: exo-
ferality and endo-ferality (Gressel, 2005). Exo-ferality refers to feral populations that are
derived from a domesticated species crossing with a wild relative, creating hybrid or
3
introgressed (repeated backcrossing) feral populations (Gressel, 2005). Wild relatives
can promote naturalization by contributing locally adapted genes that hasten the
adaptation of naturalized populations (Gressel, 2005). In addition, recurrent gene flow
between closely grown feral, crop, and wild populations (crop-feral-wild complexes) can
lead to feral populations with alleles that make them more competitive than the crop or
wild species through heterozygote advantage, leading to naturalization and possible
invasion (Breton et al., 2008). Endo-ferality refers to feral populations that are derived
exclusively from crosses between plants of the same domesticated species (Ellstrand et
al., 2010). Endo-feral populations fall on a continuum from those composed of known
cultivars, recombinants of known cultivars, and populations with new genetic variation
not found in known cultivars. Endo-feral plants may deviate from a domesticated state
(de-domestication) though domesticated traits may be retained if they confer a selective
advantage (Ellstrand et al., 2010). Endo-feral populations can also become invasive in
their new environments, either through rapid adaptive evolution or ecological
opportunism (Ellstrand et al., 2010). These two pathways encompass the ways that
domesticated plants can establish feral populations, and have been observed to varying
degrees.
In a review on ferality in crop species, feral populations in six of 13 species were
shown to have an exo-feral origin (Ellstrand et al., 2010). For example, the cultivated
beet, Beta vulgaris, hybridizes with related taxa, creating a weedy, feral derivative
(Ellstrand, 2003). Hybridization also occurs between cultivated and wild radishes,
resulting in hybrid feral swarms (Snow & Campbell, 2005). Common garden
experiments comparing cultivated radish (Raphanus sativus), its close relative wild
jointed charlock (Raphanus raphinistrum), and feral radish have shown that the feral
radish produces more fruit and seed per plant than its progenitors while also showing
significantly different phenotypes (Hegde et al., 2006). While there are several
examples of exo-ferality in nature, almost all involve short-lived crop species, and the
frequency of its occurrence in other taxa is still unknown.

4
According to Ellstrand et al. (2010), endo-ferality accounts for the origin of the
remaining seven crop species they investigated (Ellstrand et al., 2010). Endo-ferality
has been proposed as the pathway to ferality in species such as feral rye and feral rice
(Vaughan et al., 2005). Outcrossing between different crop cultivars has been
suggested as a possible explanation for feral establishment as it can generate a novel
array of phenotypes for selection to act upon (Ellstrand et al., 2010). Weedy feral rice
populations in Bhutan have been described as combinations of two different Oryza
sativa cultivars, and possess only alleles found in the parental cultivars (Ishikawa et al.,
2005). Inter-cultivar admixture (described in Ellstrand et al., 2010 as “exo-endo-ferality”;
but classified here as endo-ferality because it is within a crop species) appears to have
resulted in the emergence of shattering (dispersal of seed upon becoming ripe) in these
feral populations, a trait that promotes dispersal and self-propagation (Ishikawa et al.,
2005). Weedy rye in North America appears to have evolved directly from a number of
cultivars of cereal rye (Secale cereale) (Burger et al., 2006). Similar to cultivated rice,
cereal rye is non-shattering, while it’s endo-feral derivative has evolved the shattering
trait to allow for dispersal. While many studies have explored endo-ferality through an
ecological or agronomic lens, few have used genetic approaches to quantify whether
the variation in these feral plants has diverged from the standing variation found in their
domestic progenitors (Ellstrand et al., 2010).
Many studies of ferality focus on short-lived forb species that share certain
weediness traits, such as self-compatibility, rapid seedling growth, and short vegetative
phases (Warwick & Stewart, 2005). Relatively little research has explored ferality in
long-lived domesticated tree species. Such species do not typically display the traits
that are predicted to promote ferality, but ferality has still been observed in a number of
species such as Olea europaea, the European olive (Hamilton et al., 2011), and Pyrus
calleryana, the Callery pear (Culley & Hardiman, 2009). Some commercial fruit-crop and
nursery trees are self-incompatible, outcrossing species, and their cultivated
populations are comprised of cultivars with a variety of traits, which could influence the
establishment of feral populations. Cultivars of fruit crop species are bred for specific

5
traits such as increased yield, greater environmental tolerances, and increased
disease/pest resistance (Van Nocker & Gardiner, 2014). Since self-incompatible fruit
crop species require cross-pollination between cultivars to create viable offspring, the
seed will have some combination of traits from both cultivar parents. Crosses between
these cultivars can create endo-feral individuals that comprise potentially invasive
populations (Culley & Hardiman, 2009). Crosses between subspecies or cultivars within
certain species of trees can reduce the negative effects of founder populations and
genetic bottlenecks, and possibly facilitate adaptation in newly colonized environments
(Besnard et al., 2014). On the other hand, there are currently few tests of exo-ferality as
a major mechanism for naturalization in domesticated tree species.
Malus domestica, the domestic apple, represents a useful system for studying
the origins and evolutionary pathways to ferality. Malus domestica was introduced to
North America in the 16th century with the arrival of the first European settlers, and is
now grown as a cultivated fruit crop in orchards across the continent’s temperate
regions. There are thousands of M. domestica cultivars, which are propagated
vegetatively through grafting since they are self-incompatible (self-sterile). The domestic
apple is considered to be an example of crop genetic erosion, as the availability of
cultivars grown in commercial orchards has diminished significantly compared with what
was historically available due to changes in market demands and consumer tastes
(Cline et al., 2012; Volk & Henk, 2016). However, some heritage varieties can still be
found in orchards, as apple trees can live for over 100 years (Volk & Henk, 2016).
Malus domestica is naturalized within North America, with some evidence of established
feral populations within the growing regions of the commercial apple, allowing for
possible gene flow between feral and cultivated populations (Fewless, 2006; Kron &
Husband, 2009; Mohlenbrock, 2013; Stover & Marks, 1998). However, no study has
conducted an extensive survey of the genetic composition or origin of these feral
populations (Fewless, 2006; Mohlenbrock, 2013; Stover & Marks, 1998).
Due to the propensity for Malus species to hybridize with related species, it is
possible that feral populations are of hybrid origin (Gross et al., 2012). Malus coronaria,

6
the sweet crabapple, is a native relative of M. domestica, and is uncommon to common
across the Carolinian forest region. Malus domestica and M. coronaria are sympatric
through parts of southern Ontario with overlapping flowering periods, allowing for
possible hybridization and establishment of exo-feral populations (Kron & Husband,
2009). M. coronaria has a complex breeding system, and is capable of producing seed
through asexual (apomixis) and sexual reproduction (Kron & Husband, 2009). Hybrid
seeds have been detected where there are overlapping populations of M. domestica
and M. coronaria, although the percentage of seeds that germinate and survive to
adulthood appears to be low (Dickson et al. 2001; Kron & Husband, 2009). While the
extent of introgression between the two Malus species is not known, hybrid offspring
between crop and native congeners in other species have been shown to have higher
fitness in natural environments (Hegde et al., 2006), and greater genetic diversity that
can counteract the effects of a genetic bottleneck that occurs in many plant
introductions or in association with domestication (Besnard et al., 2014). Hybrid
offspring between M. domestica and M. coronaria could also have a similar selective
advantage, leading to feral population formation and proliferation.
1.1 Research Goals
The overall goal of this study is to examine the origins and evolutionary
mechanisms of ferality using a population genetic analysis of feral apple trees in
Ontario. I will address the following questions with this research: 1) do the genotypes of
feral apples show evidence of introgression with the native M. coronaria?; 2) how
genetically diverse are feral apple populations in southern Ontario relative to apple
cultivars?; 3) is there geographic variation in the genetic composition of feral
populations across southern Ontario and does it correspond to the diversity of locally
grown cultivars?; 4) and which cultivars are most closely related to feral apple
populations?
I test two competing hypotheses in the course of this research. First, I
hypothesize that feral apple populations form in association with hybridization between

7
M. domestica and its native relative (exo-ferality), M. coronaria, which may increase
genetic diversity and contribute traits that are suited for natural environments.
Alternatively, I hypothesize that feral M. domestica populations are formed from crosses
between a subset of available cultivars (endo-ferality), especially those that possess
traits best suited for natural environments. If exo-ferality is required for feral apple
populations to form, I predict that all feral populations should show evidence of
introgression with M. coronaria. If naturalized apples are established only through endo-
ferality, I predict that feral apple populations will contain alleles found only within
domestic apple cultivars. Furthermore, these alleles should be predominantly from
cultivars grown in Canada and possibly only within their respective local region of
southern Ontario. I also predict that feral apple populations will show a significant
reduction in genetic diversity relative to cultivated apples. This will correspond with a
small subset of cultivars that are more likely to produce offspring capable of achieving
ferality.
2 Methods
2.1 Sampling
My study was conducted across southern Ontario in five regions with a
concentration of commercial apple production: Central, Central-West, East, North, and
West regions (Table 1). These five regions contain a mosaic of farmland, woodlots, and
roadways, increasing the possibility of feral apple populations establishing along
roadways and abandoned pasture sites (Stover & Marks, 1998). Within each of the five
regions, four commercial domestic apple orchards were identified that are at least 10
km apart and established at least 20 years ago (Figure 1; Table 1). These criteria were
used to ensure that sampling occurred near mature orchards that have had a chance to
contribute to surrounding feral populations.

8
Thirty feral apple trees were located and sampled within a five-kilometer radius of
each orchard (hereafter referred to as a plot). Trees were haphazardly sampled along
roadways within the plot, without regard for age and size, so long as they were non-
cultivated and suspected to be of putative M. domestica origin. Young leaves adjacent
to shoot tips were sampled to maximize DNA quality (Semagn, 2014).
To generate a reference library of apple cultivars for comparison with feral
populations, I collected at least one leaf sample for all major cultivars grown in Ontario,
except the cultivar “Earligold”. These samples were collected from local orchards,
collections, and experimental farms (Table 1). There are 22 major apple cultivars grown
in commercial orchards in Ontario at present across 16,000 acres of land. A different
percentage composition of these cultivars is currently grown in each apple region of
Ontario (Ontario Apple Growers, 2016; Table 2). Historical records of the commercial
acreage grown in each region of Ontario over the past 50 years were accessed from the
Ontario Ministry of Agriculture, Food and Rural Affairs (OMAFRA) (Mailvaganam, 2013).
In addition to these current commercial cultivars, I used historical records to identify and
sample heritage cultivars, defined as cultivars grown in North America from 1600 to
1905 (Volk & Henk, 2016) and documented as having been grown in the past in Ontario
(Appendix 1). These trees were collected from heritage orchards and private collections
(Table 1). This material was used to determine if heritage cultivars contributed to
present day genetic diversity in feral populations.
To test for hybridization between M. domestica and native M. coronaria in the
formation of feral trees, M. coronaria reference individuals were sampled in each apple-
growing region where the species is expected to occur (Central, Central-West, East). In
total 44 M. coronaria were sampled: 11 from the Central region, 24 from the Central-
West region, and nine from the West region. Eleven of these M. coronaria samples
were located within feral sampling plots, with six from a single Central-West region
sampling plot, and five from two West region sampling plots (two and three samples
respectively). In addition, a reference group of 20 individuals comprising seven
ornamental Malus species (including six M. baccata individuals, two M. floribunda, one

9
M. robusta, two M. sargentii, two M. X purpurea, two M. sieboldii, one M. sierversii, one
M. toringoides and three individuals from unidentified ornamental Malus species) was
collected as reference material since these species are often grown in Ontario and may
also be contributing to feral apple populations.
2.2 Microsatellite Analysis
All trees were characterized genetically using microsatellite markers (SSRs).
SSRs are highly polymorphic segments of DNA that are co-dominantly inherited,
abundant, and conserved between closely related species, making them suitable for
testing genetic relatedness within and between species. Since M. domestica SSR
markers often have high allelic diversity, it’s relatively easy to distinguish first generation
hybrid individuals and cultivars (Hokanson et al. 1998).
DNA was extracted from all leaf samples with a Nucleospin ® Plant II extraction
kit (Machery-Nagel, 2013). The standard protocol was modified slightly to include
addition of 10 µl Proteinase K before incubation, increased incubation from 10 to 60
minutes, and decreased elution volumes to 50 µl (Appendix 2). DNA quality was
measured using a Nanodrop 8000 spectrophotometer. All DNA was diluted down to 10
ng/µl for use with Polymerase Chain Reaction (PCR).
Sixteen published SSR loci (Table 3) developed for M. domestica were used to
genetically characterize each tree following the methods of Urrestarazu et al. (2012),
who used four multiplexes with fluorescently tagged forward primers (6-FAM, NED,
PET, and VIC). SSR loci were amplified using polymerase chain reaction (PCR) and the
corresponding primers designed for each published SSR locus (Table 3). The same
PCR protocol was followed for all loci (Appendix 3), and annealing temperatures were
all set to 53℃. Successfully amplified samples were submitted to the Genomics Facility
at the University of Guelph for fragment analysis using an Applied BioSystems 3730
DNA Analyzer. PeakStudio was used to compare fragment sizes and score alleles in
each sample and at each locus (McCafferty, 2012). Alleles were scored as either being
present or absent in each individual. Two of the amplified SSR loci were not used in

10
further analysis (CH-Vf1, CH02C06) due to difficulties in scoring, as these primers
appear to be amplifying multiple loci, which cannot be distinguished.
2.3 Editing the Dataset
Prior to analysis, I tested for the presence of cultivars among putative feral trees,
for example, remnant trees from abandoned orchards. To confirm the genetic identity of
each M. domestica cultivar, I compared samples of each cultivar to replicates within my
dataset, when available, and to a dataset provided by the UK National Fruit Collection
(Fernandez-Fernandez, 2010). Once confirmed, all duplicates were removed from the
dataset. I then used the confirmed genotypes to test whether any of the sampled trees
were cultivars misidentified as feral trees and shared an identical genotype with a
commercial cultivar. Microsatellite data were imported to R using the package Polysat
and a pairwise distance matrix was produced by comparing the multi-locus genotypes
between all possible pairs of feral trees and cultivars using the Bruvo Distance function
as shown in the Polysat manual (Bruvo et al., 2004; Clark & Jasieniuk, 2011). The
pairwise distance matrix was then evaluated using the assignclones function and all
trees with a pairwise distance of 0.15 or less were classified as members of the same
genetic clone. The 0.15 cutoff was selected after preliminary tests and allows for
somatic mutations and genotyping errors to generate small differences among clones.
Any feral individuals that genetically matched a cultivar were removed from the dataset.
Finally, all genetically identical feral individuals were mapped to confirm their
geographical proximity, and to test whether the same tree was sampled multiple times
(e.g. multiple closely spaced stems arising from the same roots). If this was the case,
only one sample was kept in the dataset.
2.4 Hybrid Identification
To evaluate whether hybridization/introgression has occurred between M.
domestica and M. coronaria, I used the program STRUCTURE. The program uses a
Markov chain Monte Carlo (MCMC) clustering model that can infer population structure
using multi-locus genotypes (Pritchard et al., 2000). It assumes that populations are in

11
Hardy-Weinberg equilibrium and does not assume a particular mutation process. The
program identifies genetic clusters in the data and then probabilistically assigns
individuals to these inferred clusters. Any individuals that show evidence of admixture
(combinations of more than one cluster) are identified as hybrids (Coart et al., 2003).
STRUCTURE estimates each individual’s coefficient of relationship to a cluster, and
illustrates each individual’s coefficient of relationship as a vertical bar in a graphical
output. A coefficient of relationship between 0.1 and 0.9 is interpreted as a hybrid;
anything higher than 0.9 or lower than 0.1 is considered a ‘pure’ individual. This
STRUCTURE analysis included all putative feral trees, cultivar reference samples, 44
M. coronaria reference samples and the reference group of 19 individuals comprising
seven ornamental Malus species. To identify hybrid individuals, 10 independent runs of
K = 3 were used with 2.5 x 10⁵ burn-in MCMC iterations followed by 5 x 10⁵ sample
iterations using a modified admixture model. Three clusters were assumed a priori to
test for possible hybridization between M. coronaria, M. domestica and the seven
ornamental Malus species.
When samples sizes of sampled populations are highly unbalanced, STRUCTURE
has difficulty reliably assigning population frequencies, often merging small genetically
divergent populations together into one genetic cluster (Wang, 2017). To account for
this, an alternative “ancestry prior” was chosen for the hybridization analysis, and the
option ‘Separate alpha for each Population’ within STRUCTURE was used, to allow for
more accurate individual cluster assignments (Wang 2017). This option assumes
different alpha values for the K clusters, instead of assuming a single alpha value for all
K’s as in the default option, with alpha being the degree of admixture present (Pritchard
et al., 2000). To verify the accuracy of this alternative model, multiple random, balanced
subsamples were run using the default model and then individual assignments were
compared to the alternative model using the full dataset (Data not shown). Individual
assignments were consistent between the alternative and subsampled default model,
and therefore the full dataset was analyzed using the alternative model for the final
analysis.

12
Coding of alleles reflected the fact that Malus varies in ploidy, both between and
within species. Malus coronaria is typically tetraploid, while M. domestica is
predominantly diploid in nature, with a limited number of triploid cultivars. Since diploid,
triploid, and tetraploid genotypes were present in the dataset, I coded the data using the
recessive allele approach (Lepais et al., 2013; Stöck et al., 2010; Urrestarazu et al.,
2012). A triploid individual that has two observed alleles at one locus has ambiguity
about whether there are two copies present of one allele or the other. To account for
this, all individuals were coded to the level of the highest ploidy present in the dataset.
For example, if the highest ploidy present in the dataset was 4x, diploids were coded
with the third and fourth rows of their data as missing (-9), while triploids were coded
with their fourth row as missing. If necessary, for triploids and tetraploids, one of the
observed alleles at a locus was arbitrarily duplicated until the required ploidy was
reached.
2.5 Genetic Diversity
I used the multi-locus genotypic data generated from the SSRs to assess how
genetically diverse feral apple populations are in southern Ontario compared to the
reference cultivars. The following parameters were calculated for each sampling region
and the overall dataset per locus, including the reference cultivars: observed
heterozygosity (Ho), expected heterozygosity (HE), allelic richness (AR), effective
number of alleles (NAE), total number of alleles, and frequency of private alleles. Private
alleles are defined here as alleles only found in one sampling region, and are a useful
indicator of gene flow between populations (Slatkin, 1985). SPAGeDi version 1.5 was
used to measure these diversity statistics (Hardy & Vekemans, 2002). An AMOVA was
conducted using Arlequin (version 3.5) to determine the distribution of genetic variability
between and within sampling regions and plots (Excoffier & Lischer, 2010). Wright’s FST
was calculated using GenoDive to determine the magnitude of genetic differentiation
among regions for feral apples (Meirmans & Van Tienderen, 2004).

13
2.6 Population Structure
To examine the relationships between feral trees and known M. domestica
cultivars grown in Ontario, I used a nested STRUCTURE analysis. Since it was difficult
to distinguish between M. domestica x ornamental Malus hybrids and ornamental Malus
cultivars, some of which are known hybrids, I took a conservative filtering approach by
eliminating all individuals showing evidence of admixture between the two groups
(coefficient of relationship greater than 0.1).
Using STRUCTURE, I identified K genetic clusters in the dataset and assigned
feral individuals and reference cultivars to these clusters. The analysis was run using
the default admixture ancestry and correlated allele frequency models, with K = 1
through K = 10 clusters and 10 independent runs of each. Each run included 2.5 x 10⁵
burn-in MCMC iterations followed by 5 x 10⁵ sample iterations. The best number (K) of
clusters was determined using STRUCTURE Harvester. After determining the best K,
individuals were assigned to the clusters to which they have the highest coefficient of
relationship. Individuals showing high membership coefficients (Q ≥ 0.80) to one cluster
were considered to be strongly assigned to that cluster. The programs CLUMPP
(Jakobsson & Rosenberg, 2007) and DISTRUCT (Rosenberg, 2004) were used to align
independent runs obtained for the best K value and generate graphical outputs. A
nested STRUCTURE analysis was then performed because the strong asymmetric
assignment patterns from the first run indicated the groupings could contain
substructure (Pritchard et al., 2000). Therefore, a separate STRUCTURE analysis was
run using each of the original clusters to identify sub-clusters within each. Individuals
were assigned to the subgroupings for which they showed the highest membership
coefficient. Individuals assigned to one of K groupings were analyzed in a nested
STRUCTURE analysis, following the same protocols as before.
An AMOVA was conducted using Arlequin (version 3.5) to determine the
distribution of variation between and within groups and subgroups defined by the nested
STRUCTURE analysis (Excoffier & Lischer, 2010). The software GenoDive was used to

14
generate pairwise FST values between the K clusters defined by the nested
STRUCTURE analysis (Meirmans & Van Tienderen, 2004). To assist with visualization,
I created neighbour-joining trees, which were based on the dissimilarity values taken
from Polysat. One tree was produced to represent the two major groups and one to
represent the seven subgroups identified by the nested STRUCTURE analysis. Darwin
software was used to draw the trees and to define the groupings/subgroupings present
on the neighbor-joining trees (Perrier & Jacquemoud-Collet, 2006).
I used a chi-square test to test if the number of feral individuals assigned to each
subgroup differed among regions, the null hypothesis being that the distribution of feral
trees among subgroups is independent of region. The test was performed using the
cross-tabs function in SPSS. Any cells that contained less than a count of five were not
included in the analysis. A post-hoc z-test was performed to identify where significant
differences exist within the contingency table. I then compared the proportion of feral
trees making up a given subgroup in each region with the acreage of that subgroup
grown commercially in that region using a Pearson correlation (rp). This analysis was
conducted only for subgroups showing significant differences among regions (i.e.
Subgroup B1). Apple acreage by cultivar for each apple-growing region was compiled
from annual reports published by the Ontario Apple Growers (OAG). Cultivar acreage
for each subgroup was determined by placing cultivars into their subgroup defined by
the nested STRUCTURE analysis, and calculating the proportion of total acreage of
each subgroup grown within a region for the year 2016. This acreage data was
available only for the 20 major cultivars grown in Ontario. To determine if historic
commercial production is affecting current feral apple populations, this bivariate
correlation was repeated using acreage data for the year 1966 (Ontario Ministry of
Agriculture and Food, 1966). The Central-West and West proportions of feral trees had
to be condensed into one larger region for comparison with the 1966 data, since the
regional boundaries in 1966 were slightly different than present boundaries.

15
2.7 Parentage Analysis
The parentage of individual feral genotypes was examined by constructing
parent-offspring relationships between diploid cultivars and feral diploid genotypes,
respectively, using the program Cervus (Kalinowski et al. 2007). First, allele frequencies
were calculated for all feral and cultivar genotypes used in the analysis. Next, I ran an
upstream simulated parentage analysis in Cervus using the calculated allele
frequencies to estimate the resolving power of the 14 SSR loci, and to identify the
critical delta value at which the analysis is 95% confident a pair of cultivars are not the
parental genotypes. The analysis also incorporates estimates of parental candidate
genotypes contributing to each offspring genotype, and what proportion of those are
sampled and genotyped by the user. During this simulated parentage analysis, 100,000
offspring were simulated to give more reliable estimates of delta. I also assumed 1000
parental genotypes were possibly contributing to offspring genotypes, and that I had
genotyped 10% of these, to account for possible candidate parents that were not
sampled. The proportion of loci assumed to be incorrectly genotyped was 0.01, and any
individual with less than 7 genotyped loci wasn’t included in the analysis. Afterwards, a
parentage analysis using the real genotype data was performed and then compared to
the simulated analysis. Offspring genotypes analyzed in the parentage analysis
included all diploid feral and M. domestica cultivar genotypes, while all diploid M.
domestica reference cultivars were used as possible parent genotypes. Malus
domestica cultivar genotypes were included as offspring to verify the accuracy of the
analysis by comparing outputs to documented parentages. These analyses were limited
only to putative pairings of parental genotypes and one offspring, at the strict level of
95% confidence. Any parent-offspring relationships that possessed a delta value
greater than the threshold determined by the upstream analysis were considered
accurate. Finally, any parent-offspring relationships that mismatched at more than one
locus were not considered to be possible relationships.

16
3 Results
In total, DNA from 577 feral M. domestica trees, 161 M. domestica samples
representing 148 putative cultivars, 44 M. coronaria trees, and 19 samples from
ornamental Malus species were genotyped (Supplementary Data 1; Cronin, 2018). After
clonal assignment analysis, 34 M. domestica cultivar samples were removed from the
dataset because they genetically match other cultivars within the dataset (Table 4).
Twelve of those 34 were unexpected matches to a different cultivar and were likely
misidentified in sampling or mislabeled. The remaining 22 cultivar samples that were
removed were replicates that genetically matched another cultivar of the same putative
identity. One feral individual genetically matched the cultivar, “Red Delicious”, and was
removed from the dataset. Also, 34 feral individuals were removed from the dataset as
they genetically matched at least one other feral individual (also within 5 meters of each
other), implying certain trees were inadvertently double-sampled.
Three samples in the M. domestica reference set did not match another individual
previously identified as being a replicate sample, nor did they match any other genotype
from my dataset or the UK National Fruit Collection dataset (Fernandez-Fernandez,
2010), indicating they are cultivars of unknown identity. Four M. domestica reference
samples did not match another sample within my dataset, but did match a sample of
another name from the UK National Fruit Collection dataset (Table 5). These seven
samples were left in the dataset.
3.1 Hybrid Identification
Using an a priori expectation of K=3, the clusters defined by STRUCTURE
corresponded to the groupings M. coronaria, ornamental Malus, and any M. domestica
individuals. No feral individuals showed evidence of admixture with the M. coronaria
cluster. Within the feral samples, three (0.52%) individuals had strong assignment (Q ≥
0.90) to the ornamental Malus reference group, suggesting they were misidentified in
the field (one from the Central region, and two from the East region). A further 60
(10.4%) feral individuals displayed evidence of admixture between ornamental Malus

17
and M. domestica cultivars (0.10 < Q < 0.90). These 63 hybrid and misidentified feral
individuals were removed from the dataset and played no role in further analyses, as I
focused on inferring genetic structure for known M. domestica ferals (Figure 2).
Fourteen individuals were removed from the Central region, 13 from the Central-West,
eight from the East, three from the North, and 22 from the West region. A further four
feral individuals displayed some evidence of tetraploidy with four alleles at some loci.
They were deemed suspicious enough to warrant removal from further analyses, as
tetraploidy is extremely rare in M. domestica. Four Malus reference samples (M.
robusta, M. sieboldii, and two unidentified Malus species) displayed evidence of
admixture with M. domestica.
3.2 Genetic Diversity: Feral Populations and Reference Cultivars
The 476 feral M. domestica individuals had 208 alleles across 14 loci. The number
of alleles observed at each locus ranged from 11 to 20 (Table 6). The markers
CH01f02, and CH03d07 showed the highest number of alleles, while markers
CH01H10, GD147, and CH05f06 showed the least. The mean effective number of
alleles per locus was 5.59, and mean expected heterozygosity per locus among
populations was 0.801. Mean expected heterozygosity per locus ranged from 0.790 in
the Central-West region to 0.805 in the West region (Table 7). The mean effective
number of alleles per locus ranged from 5.33 in the Central-West region to 5.76 in the
East region. There were 37 private alleles observed in feral populations, while only 10
were observed in the cultivar references. Feral populations also displayed 31 private
alleles when compared to the ornamental Malus group. In total, 25 of the 476 feral
individuals (5.25%) displayed three alleles at one or more loci, and could not be used in
the parentage analysis.
Genetic differentiation between the five regions was very low (Table 8), suggesting
little or no population structure at the Ontario scale. All pairwise comparisons were
significant (p < 0.05), but the magnitude of the FST values was low, ranging from FST =
0.001 to FST = 0.003. According to the AMOVA, 0.25% of the variation could be

18
accounted for by differences among regions, 0.56% of variation existed among plots
within regions, and 99.19% of the variation occurred within sampling plots (Table 9).
Malus domestica reference cultivars, comprising 127 unique genotypes, had 181
alleles across 14 loci (Table 10). The number of alleles observed at each locus ranged
from 10 to 18 (Table 6). The marker CH03d07 showed the highest number of alleles,
while the markers CH01h10 and CH02c09 showed the least. The mean effective
number of alleles per locus was 5.81, and mean expected heterozygosity per locus for
the reference cultivars was 0.807. In total, 24 of 127 reference cultivars (18.9%)
displayed three alleles at one or more loci. Finally, two M. domestica reference cultivars
“Quaker Beauty” and “Rescue” displayed evidence of admixture with the ornamental
Malus species reference group (0.10 < Q < 0.90).
3.3 Inferred Genetic Groupings
STRUCTURE Harvester analysis identified K=2 genetic groups with the dataset
containing M. domestica feral trees and cultivars. Individuals were asymmetrically
assigned to the two clusters: 172 individuals were assigned to group A and 431 were
assigned to group B (Figure 3). The proportion of individuals strongly assigned (Q ≥
0.80) to either of the two inferred groups was 0.82; 78.5% of 173 individuals were
strongly assigned to Group A, while 84.7% were strongly assigned to Group B
(Supplementary Data 2; Cronin, 2018). After a nested STRUCTURE analysis was
performed to test for substructure in both groups, the two independent nested analyses
found K = 5 optimal subgroups for Group A and K = 2 subgroups for Group B, leading to
a total of 7 inferred subgroups. Only 22.7% of individuals were strongly assigned to their
respective subgroups (Table 11). In total, 27.3% of individuals could not be placed in
any of the subgroups, as they were unambiguously admixed with multiple subgroups (Q
< 0.50). Furthermore, only 31.6% of individuals were strongly assigned to subgroups B1
and B2.
Malus domestica reference cultivars were distributed unevenly between the two
groups defined by STRUCTURE (Figure 4). A total of 40 cultivars were assigned to

19
group A, with 34 being strongly assigned. A total of 87 cultivars were assigned to group
B, with 74 being strongly assigned (Table 5). Of the 34 cultivars strongly assigned to
group A, four were major cultivars (“Jersey Mac”, “Honeycrisp”, “Paulared”, and
“Jonamac”). None of the major cultivars were strongly assigned to their respective
subgroups within group A, and only five other cultivars were strongly assigned to a
subgroup. Subgroups A1, A2, and A3 had no major cultivars assigned to them, instead
they were made up of old heritage cultivars and feral individuals. A total of 19 cultivars
were strongly assigned to subgroup B1, with four of those being major cultivars. A total
of 15 cultivars were strongly assigned to subgroup B2, with nine of those being major
cultivars. It is difficult to find any biological or historic factors that account for the cultivar
clustering patterns observed for each group/subgroup (Table 5). One basic clustering
pattern that emerges is that all cultivars of Russian origin have been clustered into
group A, while group B is primarily made up of cultivars originating in the USA, Canada,
and western European countries. Group B also has four major cultivars (“Mcintosh”,
“Northern Spy”, “Red Delicious”, and “Golden Delicious”) that have high commercial
production (Table 2), and have been used in breeding programs for decades,
accounting for the parentage of many cultivars within group B (National Fruit Collection,
2015).
Subgroups of feral trees are not uniformly distributed (P <0.05) among regions
(Table 12). The post-hoc z-test indicates that these differences are primarily caused by
differentiation among regions for trees in subgroup B1. Almost all other subgroups were
uniformly distributed with respect to region of origin (Table 13). There was no correlation
between the proportion of feral individuals in subgroup B1 per region and the proportion
of subgroup B1 cultivars represented in commercial orchards (Table 14). Furthermore,
the bivariate comparison between the proportion of feral trees in subgroup B1 from each
region and the commercial production of cultivars subgroup B1 in 1966 showed no
correlation (Table 14).

20
3.4 Genetic Diversity: Inferred Genetic Groupings
For the dataset including 127 M. domestica cultivars and 476 M. domestica feral
individuals, the 14 amplified SSR loci exhibited 218 alleles (Table 6). The number of
alleles per locus varied from 11 (CH01h10, CH05f06) to 22 (Ch03d07), and averaged
15.6. Expected heterozygosity ranged among loci from 0.668 (CH01h10) to 0.897
(CH02c11) and averaged 0.803. Observed heterozygosity ranged among loci from
0.674 (CH01h10) to 0.899 (CH02c11) and averaged 0.815. Observed heterozygosity for
the major clusters defined by STRUCTURE was 0.855 for group A and 0.799 for group
B (Table 11). There were 11 private alleles observed in group A and 25 observed in
group B. The mean effective number of alleles per locus for group A was 5.7 and 5.2 for
group B. Mean observed heterozygosity per locus among the seven subgroups defined
by the nested STRUCTURE analysis ranged from 0.787 (subgroup B2) to 0.889
(subgroup A2). The effective number of alleles within subgroups ranged from 3.9
(subgroup A4) to 6.2 (subgroup A3).
AMOVA showed significant differences among groups and subgroups. For
example, 2.4% of genetic variation was accounted for by differences between groups A
and B (Table 15). Pairwise genetic differentiation between groups A and B was also
found to be relatively low (FST = 0.012). The unweighted neighbor-joining tree supported
this division of the data, with two genetic clusters being mostly separated on the tree
(Figure 5). AMOVA showed that 2.98% of genetic variation was accounted for by
differences among subgroups (Table 15), and the inferred subgroups were generally
supported by moderate pairwise genetic differentiation (Table 16). Population
differentiation was highest between subgroups A1 and A5 (FST = 0.052), and lowest
between subgroups B1 and B2 (FST = 0.006). The low genetic differentiation and low
percentage of individuals strongly assigned to subgroups B1 and B2 suggests these
subgroups are not very robust, and Group B may be genetically admixed. This is
supported by the neighbour-joining tree for the seven subgroups defined by the
STRUCTURE analysis, which shows that subgroups B1 and B2 are not as clearly
separated as are the subgroups from group A (Figure 6).

21
3.5 Parentage Analysis
The parentage analysis correctly inferred the parentage of six M. domestica
cultivars whose pedigree was known (Table 17). Three of these lineages had one
parent inferred as “McIntosh”, and two had one parent inferred as “Red Delicious”. The
parentage of two additional cultivars was correctly inferred where there was one parent
previously documented (“Lobo” – “McIntosh” and “McMahon”; “Wolf River” –
“Alexander” and “Westfield Seek-no-further”, with “McIntosh” and “Alexander”,
respectively, being previously identified). There was a mismatch between the parents
inferred in my analysis and the published pedigree for one cultivar (“Tydeman Red” –
“McIntosh” and “Akane”), with “Akane” not being documented in the published pedigree
(“Tydeman Red” – “McIntosh” and “Worcester Pearmain”).
Among 451 unique feral diploid genotypes, parents were identified with 95%
confidence from 103 possible cultivars for 47 different trees. The cultivar “Wealthy”
accounted for the most (N=13) parental assignments. The next most common cultivars
identified as parents were “Tolman Sweet”, with 12, and “Ben Davis” with nine. Eight
cultivars were identified as most likely parents for two feral trees, and 14 cultivars
accounted for one each (Table 18). The six most common cultivars assigned as parents
are considered heritage cultivars, and have little commercial presence in Ontario today.
The major cultivars grown in Ontario currently, accounted for 12.8% of parental
assignments. The feral genotypes whose parents could be identified spanned all
commercial regions in Ontario: 13 from the Central region, 13 from the Central-West
region, 17 from the East region, 20 from the North region, and 21 from the West region.
The most common combination of parental genotypes was “Wealthy” + “Tolman Sweet”,
with four observed pairings (Table 19). There were 404 feral individuals where parental
relationships could not be inferred by the analysis with 95% confidence.
When the parentage analysis was performed at the level of 80% confidence there
were 21 further feral trees whose parents could be identified (Table 18). Only two new
cultivars were identified as parental genotypes when this lower threshold was used.

22
“Tolman Sweet” had the highest number of parental assignments at this lower
threshold, and both “Northern Spy” and “McIntosh” increased their parental assignments
by seven each. Although this lower threshold of 80% confidence detected parentage
assignments for about 50% more feral trees, the false positive rate, or rate of detecting
the true parents was diminished considerably (Kalinowski et al. 2007). Therefore, the
results of using this threshold of confidence were not considered further.
4 Discussion
4.2 Patterns of Exo-Ferality
My results provide insights into the role of hybridization with native congeners in
the formation of feral populations. Based on the STRUCTURE analysis, no feral
individuals showed evidence of introgression/hybridization with the native M. coronaria.
This clearly shows that hybridization with native species is not contributing to the
naturalization of feral M. domestica in southern Ontario. While there is evidence of
hybrid seeds forming through M. domestica pollinating M. coronaria ovules, few if any
appear to mature to adulthood (Kron & Husband, 2009), suggesting hybrids may be
limited by factors affecting their establishment in natural environments. While this study
suggests there is no introgression of the M. coronaria genome into feral M. domestica, it
is still possible that the M. domestica genome has been incorporated into native
populations through rare backcrossing, or that M. domestica has indirectly affected
native reproductive rates. Malus domestica pollen could be flooding relatively
uncommon M. coronaria populations, creating inviable hybrid seeds, and reducing
native sexual fitness through demographic swamping (Prentis et al. 2007).
While there were no individuals that displayed evidence of introgression with
native congeners, 63 feral individuals showed evidence of introgression (0.10 < Q <
0.90) with introduced ornamental Malus. Further, three feral individuals were genetically
indistinguishable from the ornamental Malus group (Q ≥ 0.90), and most likely were

23
planted ornamentals and misidentified in the field. The reference set of ornamental
Malus samples is a small but diverse group, and it is therefore currently difficult to tell
with any certainty which Malus species are contributing directly to these feral
individuals. It is possible that these introgressed individuals are planted or feral
ornamental crabapples and not actually feral domestic apples, since some ornamental
crabapples are known to be products of hybridization with domestic apple (Volk et al.,
2015). In the future, a larger pool of genetic markers, and a larger sample of each
ornamental Malus species included in this study will be needed to resolve exactly which
species are contributing to a feral individual’s genome.
The incidence of hybrids with ornamental Malus was higher in the western region
than any other. This pattern could reflect a higher incidence of hybridization in this
region or a higher fitness of hybrids in the most southerly part of the province.
However, it is most likely associated with sampling errors. Compared to other regions,
feral trees were less abundant in the Western region, and I was less selective in
sampling feral individuals in this region, leading to possibly more misidentified trees.
Another factor that affected hybrid identification was the time of sampling in each
region. Sampling of the Central, Central West and West regions was undertaken earlier
in the spring, when leaves were young and had not yet fully expanded. This can lead to
difficulty in identifying species and distinguishing M. domestica from ornamental Malus.
At this point, the relatively low frequency of detected hybrids suggests the exo-feral
pathway does not play a significant role in the establishment of feral M. domestica
populations, but further genetic studies will need to explore the relationship between
feral populations and this diverse group of ornamental Malus species.
4.3 Genetic Diversity and Patterns of Endo-Ferality
Genetic diversity and expected heterozygosity in feral populations were quite high
(HE = 0.801), and the same as expected heterozygosity found in the cultivar reference
set (HE = 0.807). These high levels of heterozygosity suggest that feral M. domestica
populations are self-incompatible and outcrossing, though this has not been tested
24
directly. In contrast, the shrub Rubus occidentalis, and the tree Pinus resinosa, both
self-pollinating species, display much lower levels of heterozygosity (HE = 0.53 and HE =
0.508 respectively), which is reflective of their breeding systems (Dossett et al., 2012;
Boys et al., 2005). The high level of heterozygosity seen in feral populations is also
comparable to expected heterozygosity values observed in other studies on genetic
diversity in apple collections such as Urrestarazu et al. (2012) (HE = 0.82), Liang et al.
(2015) (HE = 0.81), and Lassois et al. (2016) (HE = 0.82). There have also been several
studies that have sampled trees of unknown genetic identities and compared them to a
reference database (Routson et al., 2009; Gross et al., 2018). While the main goal of
those studies was to identify heritage cultivars in old orchards, they also identified small
numbers of putative feral trees that were contributing to local genetic diversity. The
genetic diversity observed by Routson et al. (2009) and Gross et al. (2018) (HE = 0.75)
is slightly lower compared to the genetic diversity observed in the feral populations
sampled in this study (HE = 0.81).
Interestingly, there were 37 alleles in the feral populations that were not seen in
the cultivar reference set, even after removal of hybrids displaying introgression with
ornamental Malus. This suggests that the cultivar reference set used for this study
doesn’t fully capture the variation seen in locally grown cultivars, or that feral
populations are incorporating new genetic diversity either through introgression with
ornamental crabapple species or mutation. In plants, SSR mutation rates are quite high
in comparison to other genetic markers, and can vary from 10-6 to 10-2 mutations per
generation, making it plausible some of these private alleles have arisen through
mutation (Fischer et al., 2017). It is also possible these private alleles are present in
ornamental species not in the current reference group. It is likely that our reference
cultivar set does not account for all local M. domestica cultivars that have contributed to
feral genomes, that were never widely propagated, or have disappeared from name
registers and gene bank collections (Gross et al., 2018). A future research path would
be to expand the database of local heritage cultivars and ornamental Malus species for

25
comparison with feral populations, which could possibly account for these private
alleles.
My results provide insights into the endo-feral processes giving rise to feral apple
populations in southern Ontario. STRUCTURE identified two major genetic groups and
seven subgroups; M. domestica cultivars and feral individuals were both associated with
each group, suggesting feral populations in southern Ontario have multiple origins from
cultivars. At a minimum, feral apple populations have been derived from cultivars within
each of the seven subgroups, and there may be more origins within subgroups that are
not detectable in this analysis. In comparison to the inferred subgroups, genetic
differentiation among feral trees in the five sampling regions was low, but significant.
This suggests feral genetic diversity among geographic regions in Ontario is not entirely
uniform, possibly due to varying distributions of the genetic subgroups across the five
regions.
The composition of feral trees within separate subgroups differed geographically in
Ontario, suggesting local commercial growing patterns could play a role in establishing
feral populations. The chi square test showed that the largest difference in distribution
was associated with subgroup B1, and that the distribution of the other subgroups
across regions was uniform. This pattern may reflect the differences seen in cultivar
production among the different sampling regions and their ongoing and historic
contributions to feral populations. However, I found that both current (2016) and
historical (1966) commercial production differences among regions are having no
significant effect on the distribution of feral trees across southern Ontario within
subgroup B1 (Ontario Ministry of Agriculture and Food, 1966; Stevens, 2017). This
suggests that either local commercial production patterns do not influence the
establishment of certain subgroups of feral apples in the local landscape, or that current
feral composition is influenced by commercial production dating back even further than
records exist for. It is also possible that the geographic variation observed in subgroup
abundance may reflect fitness differences among subgroups in varying environments,
or random differences associated with the colonization history of certain regions.

26
Since I found no correlation between local commercial production and feral
populations, and there is low genetic differentiation among geographic regions, it is
possible that feral apple trees have spread as overlapping genetic lineages across the
regions of southern Ontario, comprising the two major groups and seven subgroups
within them. These lineages may be maintained through extensive dispersal and gene
flow among regions, as well as possible inputs from cultivated commercial varieties.
These lineages are only weakly differentiated, and there are probably high levels of
gene flow between them, as exhibited by few feral individuals being strongly assigned to
each subgroup. It remains to be seen if gene flow between lineages will reduce their
genetic differentiation over time, or if non-random mating is occurring that is keeping
them from homogenizing. This mating separation among lineages could be explained by
differences either in space (they may tend to occur in different microhabitats in a given
region) or in time (different flowering times between lineages).
The inferred groupings observed in my study are comparable to groupings
inferred using similar methodologies in other population genetic studies of M.
domestica. These studies also used a nested Bayesian procedure, first inferring the
uppermost level of population structure, and then inferring substructure within
(Urrestarazu et al., 2012; Liang et al., 2015). Liang et al. (2015) observed two major
groupings of 192 Italian apple cultivars, each with two subgroups. Urrestarazu et al.
(2012) found evidence for three major groupings using a much larger European dataset
of 1859 apple cultivars, which were then divided into eight inferred subgroups. The
three major groups generally aligned with region of origin, with cultivars from the
northern and southern regions of Europe being clustered into separate groupings
(Urrestarazu et al., 2012). In contrast to my study, pairwise genetic differentiation
among geographic regions in the European study was much higher (ranging from FST =
0.015 to FST = 0.042), possibly owing to the larger geographic scale of the study.
However, pairwise genetic differentiation among the eight inferred genetic subgroups
was generally comparable to my results, ranging from FST = 0.012 to FST = 0.087.
Similarly, to my study, most Russian cultivars in this European study were clustered into
27
a single grouping, as well as most cultivars from the UK being clustered into a single
grouping, albeit at a much larger scale and sample size (Urrestarazu et al., 2012).
Another study using a smaller cultivar dataset comprising many that were used in my
study inferred five putative cultivar clusters using a different clustering approach
(Amyotte, 2017). While there were fewer clusters than the seven subgroups I inferred,
they matched up well, and some subgroups could be combined to match the clusters
inferred by Amyotte (2017). As seen before, all Russian cultivars in this analysis were
clustered into one grouping (Amyotte, 2017). Small overlaps in cultivars used among
studies and differences in methodologies preclude a more detailed comparison of the
genetic groupings.
4.4 Unexpected Relationships among Feral Trees and Reference Cultivars
There were many unexpected matches in genetic identities among the different
reference cultivars used in this study. Some made sense, in that one sample may be a
somatic “sport" of another, but in other cases the matches may reflect misidentifications.
Some cultivars were found to be genetically indistinguishable from one another, such as
“Vinebrite” - “Red Delicious”, “Gala Red” - “Gala”, “Smoothee” - “Golden Delicious”, and
“Ben Davis” - “Gano”. This can be explained by the fact that one cultivar of each pair is
a “sport” of the other, which are cultivars that display phenotypic differences, but only
differ genetically through minor somatic mutations. Not being able to genetically
distinguish between “sports” is to be expected when using relatively few SSR loci, as
many “sports” are the result of one or two somatic mutations not present on the
amplified loci used in this study (Hokanson et al., 1998). In other cases, a cultivar that
resembled another was found to be misidentified after comparing its genotype with the
dataset provided by the UK National Fruit Collection (Fernandez-Fernandez, 2010). For
example, my “Jona Red” sample resembled the published genotype of “Jona Gold”,
suggesting the “Jona Red” sample was misidentified during collection or mislabelled.
There were 11 misidentified/mislabeled cultivars in my dataset, with three of these
genotypes not matching a cultivar within my dataset nor the dataset from the UK
National Fruit Collection. Finding redundant and misidentified genotypes in this

28
database was consistent with the observation that gene bank collections contain
grafting and curation errors at the rate of 5-10% (Sean Myles, personal communication,
October 28, 2017). This shows how important replicated genetic testing can be, and is
also a practical application for genetic libraries in curating heritage apple collections.
Two M. domestica cultivars were identified as being introgressed with ornamental
Malus: “Quaker Beauty” and “Rescue”. There are few references to “Quaker Beauty” in
the literature, but several sources identified it as a crabapple cultivar (Budd, 1902;
Górnaś et al. 2014). The “Rescue” cultivar was first developed in Saskatchewan in 1933
as a cold-hardy cross between a domestic apple and a crabapple (Vick, 1991). This
demonstrates the analysis was correct in classifying these as intermediates between
the ornamental Malus reference group and M. domestica reference cultivars.
4.5 Parentage Analysis
Based on the parentage analysis, the most commonly identified cultivar parents of
feral trees are heritage cultivars, defined as cultivars grown in North America from 1600
to 1905. An explanation for this could be that since Cervus uses allele frequencies to
calculate likelihoods, the parental genotypes identified may be biased towards cultivars
with rarer alleles, or cultivars that are more genetically divergent from the rest
(Kalinowski et al. 2007; Urrestarazu et al., 2012). For example, “Ben Davis”, one of the
most commonly identified parents in the analysis, had a copy of allele 252 at locus
CH02d08 that was observed in only one other cultivar. In contrast, there were 40 copies
of allele 252 observed in feral trees, with six of these feral trees being assigned as
offspring to “Ben Davis”, thus illustrating the influence rare alleles can have on the
output. Some cultivars and feral offspring may also possess common alleles at all loci,
and the number of loci needed to infer these relationships may be more than the 14
SSR loci used in this study (Kalinowski et al. 2007). The 404 feral trees whose parental
relationships could not be inferred could also possibly be recombinants of feral trees
already established in the wild. Alternatively, they could have parental relationships with
cultivars that were not included in the dataset used for this analysis.

29
The presence of genome from heritage cultivars indicates that some individuals
within feral populations may be older than expected (greater than 100 years), and
hence reflect the legacy of cultivars grown many years ago. “Ben Davis”, identified as
one of the most common feral parents, was one of the most popularly grown apples in
the Midwest region of the USA and southern New York during the 19th century (Beach,
1905). “Ben Davis” doesn’t have an extensive history of growth in southern Ontario as
many other heritage varieties do, but it’s possible that apples shipped from neighboring
regions such as New York made their way into the natural landscape and established
feral populations. With more time feral populations could incorporate the genomes of
modern cultivars through mating with trees within commercial orchards.
Finally, heritage varieties might be prevalent as parents of feral trees because they
confer fitness benefits to trees in the natural environment. Both “Wealthy” and “Tolman
Sweet”, which were identified as common parents of feral individuals, may be common
because of their exceptional hardiness in cold regions. “Wealthy” was first developed in
Minnesota in the 1860’s (National Fruit Collection, 2015), and is a very winter-hardy
variety (Ferree & Warrington, 2003) This cultivar was also one of the major cultivars
grown in Ontario until at least 1976, accounting for 1.28% of total apple production in
that year (Ontario Ministry of Agriculture and Food, 1976). “Tolman Sweet” is also
considered a hardy variety, and in the past, was grown as a rootstock for grafting
purposes (Beach, 1905). Shoots growing from rootstock could be contributing to feral
populations, however we were unable to test any rootstock varieties developed past the
1950’s. Interestingly, the greatest number of parent-pairs observed was between
“Wealthy” and “Tolman Sweet”. Perhaps offspring produced by the mating of two winter-
hardy varieties are more likely to establish in the natural landscape. Some combination
of historical production patterns, and cold-hardy fitness benefits is likely accounting for
the number of heritage varieties being observed as feral parents in the analysis.
From 103 total cultivars used, the parentage analysis was able to confirm
parentages with 95% confidence for only six cultivars whose pedigrees have already
been documented. The cultivar “Lobo” was identified here as having “Mcintosh” and

30
“Mcmahon” as parents, with “Mcintosh” being a previously documented parent.
“Mcmahon” is a little-known heritage variety alleged to originate in Wisconsin during the
1860’s (Allen, 2012). “Lobo” is known to be an offspring of “Mcintosh” (Ferree &
Warrington, 2003), and its date of introduction is well after “Mcmahon” was discovered,
lending this putative pedigree some historical support (Orange Pippin Ltd., 2018). There
is similar evidence for the cultivar “Wolf River”, originating in Wisconsin in 1875, which
has one previously documented parent “Alexander” (National Fruit Collection, 2015),
and “Westfield-seek-no-further” as newly inferred from the parentage analysis.
“Westfield-seek-no-further” is an apple purported to originate in Massachusetts in 1796,
therefore providing a historical basis for its relation to “Wolf River” (Beach, 1905). There
was a mismatch between the published pedigree and the pedigree inferred by the
analysis for the cultivar “Tydeman Red”. The inferred parents for “Tydeman Red” are
“Mcintosh” and “Akane”, while the published pedigree specifies “Mcintosh” and
“Worcester Pearmain”. “Worcester Pearmain” was not one of the cultivars tested in my
analysis, but is documented to be one of the parents to the “Akane” cultivar (Orange
Pippin Ltd., 2018). Furthermore, “Akane” originated in the 1930’s, after “Tydeman Red”
originated in 1929 (National Fruit Collection, 2015), and therefore the published
pedigree is more consistent with historical documentation than my results. Although the
parentage analysis incorrectly inferred one parent pair, the general reliability of it was
strong, and gave confidence in the analysis of feral parentages.
5 Significance
To my knowledge, this is the first attempt to examine the genetic composition of
feral apples and their relationship to commercially grown cultivars. Similar analyses
have been performed on other plant species, such as grape (De Andrés et al., 2012;
Ekhvaia et al., 2014), and the Callery pear (Culley & Hardiman, 2009). These studies
found genetic relationships between cultivars and wild samples easy to resolve due to
high divergence between wild and cultivated populations (De Andrés et al., 2012), and
relatively few cultivars contributing to feral populations (Culley & Hardiman, 2009). In

31
contrast, M. domestica is obligately outcrossing, and non-native to North America, with
feral populations having many recent cultivated origins. These factors have led to low
genetic divergence between feral populations and cultivated varieties, making
identifying genetic relationships between cultivars and feral populations difficult.
The results of my study have potential implications for both agricultural
sustainability and conservation biology within southern Ontario. This study is the first
attempt to document the abundance of feral apples in the natural landscape of southern
Ontario, and I found them to be prevalent in most regions. From an agricultural
perspective, these trees are important as they may harbor pests or disease that can
pose risks to commercial apple producers. Alternatively, they may serve as reserves for
wild bees, which can contribute to pollination in commercial orchards and reduce the
reliance on imported honey bee colonies. Although the parentage of many feral trees
remains unknown, results from the current parentage analysis suggests that certain
heritage cultivars contribute disproportionately to feral populations, which warrants
research into what biological factors are causing this uneven input. The SSRs used in
this study also provide a tool to identify heritage cultivars in collection and orchards that
were once commercially important, and now hold cultural and breeding value.
My research also has relevance for the ecological sustainability of agricultural
production, and the interactions between agricultural and natural ecosystems. My
research shows that hybridization between M. coronaria and M. domestica, and
introgression into feral populations was lower than expected, which suggests the
potential for gene escape from cultivated apple is limited; however, there could still be
demographic processes that have strong negative effects on the native congener.
Malus domestica pollen may be affecting reproductive rates in M. coronaria, by way of
inviable hybrid seeds and demographic swamping processes. The extent of this is
beyond the scope of this research and will require further attention to the reproductive
biology and population dynamics of the native Malus species. The extent to which
ornamental Malus species may be hybridizing with M. domestica outside of cultivation
or breeding, and the fitness effects these hybridization events have on feral apple

32
populations are also unclear. Collectively, this study is an important first step in
identifying feral apple populations, using a population genetics analysis to evaluate their
origins, and establishing their agricultural and environmental impacts in southern
Ontario.

33
REFERENCES
Allen, W. (2012, September 14). Honoring our Apple Elders. Retrieved June 6,
2018, from http://ediblemadison.com/articles/view/honoring-our-apple-
elders/c/full/
Amyotte, B. (2017). Genome wide mapping of fruit quality traits in apple (Doctoral
dissertation).
Bagavathiannan, M. V., & Van Acker, R. C. (2008). Crop ferality: implications for
novel trait confinement. Agriculture, Ecosystems & Environment, 127(1), 1-
6.
Beach, S. (1905). The Apples Of New York (Vol. 1). Albany, New York: J.B. Lyon
Company.
Besnard, G., Dupuy, J., Larter, M., Cuneo, P., Cooke, D., & Chikhi, L. (2014).
History of the invasive African olive tree in Australia and Hawaii: evidence
for sequential bottlenecks and hybridization with the Mediterranean
olive. Evolutionary applications, 7(2), 195-211.
Boys, J., Cherry, M., & Dayanandan, S. (2005). Microsatellite analysis reveals
genetically distinct populations of red pine (Pinus resinosa,
Pinaceae). American Journal of Botany, 92(5), 833-841.
Breton, C., Guerin, J., Ducatillion, C., Medail, F., Kull, C. A., & Berville, A. (2008).
Taming the wild and ‘wilding’the tame: tree breeding and dispersal in
Australia and the Mediterranean. Plant Science, 175(3), 197-205.
Bruvo, R., Michiels, N. K., D’Souza, T. G., & Schulenburg, H. (2004). A simple
method for the calculation of microsatellite genotype distances irrespective
of ploidy level. Molecular ecology, 13(7), 2101-2106.

34
Budd, J. L. (1902). American Horticultural Manual (Vol. 2). London: John Wiley &
Sons.
Burger, J. C., Lee, S. K. Y., & Ellstrand, N. C. (2006). Origin and genetic structure
of feral rye in the western United States. Molecular Ecology, 15(9), 2527-
2539.
CFIA. (2008, August 15). Invasive Alien Plants in Canada - Technical Report.
Retrieved October 28, 2016, from http://epe.lac-bac.gc.ca/100/206/301/cfia-
acia/2011-09-
21/www.inspection.gc.ca/english/plaveg/invenv/techrpt/techrese.shtml
Clark, L. V., & Jasieniuk, M. (2011). POLYSAT: an R package for polyploid
microsatellite analysis. Molecular Ecology Resources, 11(3), 562-566.
Cline, J. A., Neilsen, D., Neilsen, G., Brownlee, R., Norton, D., & Quamme, H.
(2012). Cold Hardiness of New Apple Cultivars of Commercial Importance
in Canada. Journal of the American Pomological Society, 66(4), 174-182.
Coart, E., Vekemans, X., Smulders, M. J., Wagner, I., Van Huylenbroeck, J., Van
Bockstaele, E., & Roldán‐ Ruiz, I. (2003). Genetic variation in the
endangered wild apple (Malus sylvestris (L.) Mill.) in Belgium as revealed by
amplified fragment length polymorphism and microsatellite
markers. Molecular ecology, 12(4), 845-857.
Cronin, Dane, 2018, "Supplemental data for "The Origins and Evolutionary
History of Feral Apples in Southern Ontario"",
https://doi.org/10.5683/SP2/94IIVP, Scholars Portal Dataverse, V1
Culley, T. M., & Hardiman, N. A. (2009). The role of intraspecific hybridization in
the evolution of invasiveness: a case study of the ornamental pear tree
Pyrus calleryana. Biological Invasions, 11(5), 1107-1119.

35
De Andrés, M. T., Benito, A., Perez‐ Rivera, G., Ocete, R., Lopez, M. A., Gaforio,
L., Munoz, G., Cabello, F., Martinez Zapatar, J.M., & Arroyo‐ Garcia, R.
(2012). Genetic diversity of wild grapevine populations in Spain and their
genetic relationships with cultivated grapevines. Molecular Ecology, 21(4),
800-816.
Dickson, E. E., Kresovich, S., & Weeden, N. F. (1991). Isozymes in North
American Malus (Rosaceae): hybridization and species
differentiation. Systematic Botany, 363-375.
Dossett, M., Bassil, N. V., Lewers, K. S., & Finn, C. E. (2012). Genetic diversity in
wild and cultivated black raspberry (Rubus occidentalis L.) evaluated by
simple sequence repeat markers. Genetic resources and crop
evolution, 59(8), 1849-1865.
Ekhvaia, J., Gurushidze, M., Blattner, F. R., & Akhalkatsi, M. (2014). Genetic
diversity of Vitis vinifera in Georgia: relationships between local cultivars
and wild grapevine, V. vinifera L. subsp. sylvestris. Genetic resources and
crop evolution, 61(8), 1507-1521.
Ellstrand, N. C. (2003). Dangerous liaisons?: when cultivated plants mate with
their wild relatives. JHU Press.
Ellstrand, N. C., Heredia, S. M., Leak‐ Garcia, J. A., Heraty, J. M., Burger, J. C.,
Yao, L., & Ridley, C. E. (2010). Crops gone wild: evolution of weeds and
invasives from domesticated ancestors. Evolutionary Applications, 3(5‐ 6),
494-504.
Excoffier, L., & H.E. L. Lischer (2010) Arlequin suite ver 3.5: A new series of
programs to perform population genetics analyses under Linux and
Windows. Molecular Ecology Resources. 10: 564-567.

36
Fernandez-Fernandez, F (2010). Fingerprinting the National apple and pear
collections. Final report of the Defra research project GC0140.
http://randd.defra.gov.uk/Document.aspx?Document=GC0140SID5Fingerpri
ntingFernandez.pdf
Ferree, D. C., & Warrington, I. J. (2003). Apples: botany, production, and uses.
CABI.
Fewless, G. (2006). Trees of Wisconsin: Malus pumila, apple. Retrieved October
22, 2016, from
https://www.uwgb.edu/biodiversity/herbarium/trees/malpum01.htm
Fischer, M. C., Rellstab, C., Leuzinger, M., Roumet, M., Gugerli, F., Shimizu, K.
K., Holderegger, R., & Widmer, A. (2017). Estimating genomic diversity and
population differentiation–an empirical comparison of microsatellite and
SNP variation in Arabidopsis halleri. BMC genomics, 18(1), 69.
Górnaś, P., Segliņa, D., Lācis, G., & Pugajeva, I. (2014). Dessert and crab apple
seeds as a promising and rich source of all four homologues of tocopherol
(α, β, γ and δ). LWT-Food Science and Technology, 59(1), 211-214.
Gressel, J. (Ed.). (2005). Crop ferality and volunteerism. CRC Press.
Gross, B. L., Henk, A. D., Forsline, P. L., Richards, C. M., & Volk, G. M. (2012).
Identification of interspecific hybrids among domesticated apple and its wild
relatives. Tree genetics & genomes, 8(6), 1223-1235.
Gross, B. L., Wedger, M. J., Martinez, M., Volk, G. M., & Hale, C. (2018).
Identification of unknown apple (Malus× domestica) cultivars demonstrates
the impact of local breeding program on cultivar diversity. Genetic
Resources and Crop Evolution, 1-11.

37
Hamilton, S. D., Minotti, T., O'Dwyer, C., & Brodie, G. (2011). A Case Study of
Feral Olive ('Olea europaea') Dispersal in Northern Victoria. Part I: Plant
Age and Growth Habit Characteristics. Plant Protection Quarterly, 26(1), 17.
Hardy OJ, Vekemans X (2002) SPAGeDi: a versatile computer program to
analyse spatial genetic structure at the individual or population
levels. Molecular Ecology Notes 2: 618-620.
Hegde, S. G., Nason, J. D., Clegg, J. M., & Ellstrand, N. C. (2006). The evolution
of California's wild radish has resulted in the extinction of its
progenitors. Evolution, 60(6), 1187-1197.
Hokanson, S. C., Szewc-McFadden, A. K., Lamboy, W. F., & McFerson, J. R.
(1998). Microsatellite (SSR) markers reveal genetic identities, genetic
diversity and relationships in a Malus× domestica Borkh. core subset
collection. Theoretical and Applied Genetics, 97(5-6), 671-683.
Ishikawa, R., Toki, N., Imai, K., Sato, Y. I., Yamagishi, H., Shimamoto, Y., &
Sato, T. (2005). Origin of weedy rice grown in Bhutan and the force of
genetic diversity. Genetic Resources and Crop Evolution, 52(4), 395-403.
Jakobsson, M., & Rosenberg, N. A. (2007). CLUMPP: a cluster matching and
permutation program for dealing with label switching and multimodality in
analysis of population structure. Bioinformatics, 23(14), 1801-1806.
Kalinowski, ST., Taper, ML., & Marshall, TC. (2007). Revising how the computer
program CERVUS accommodates genotyping error increases success in
paternity assignment. Molecular Ecology 16, 1099-1106.
Kowarik, I. (2003). Human agency in biological invasions: secondary releases
foster naturalisation and population expansion of alien plant
species. Biological Invasions, 5(4), 293-312.

38
Kron, P., & Husband, B. C. (2009). Hybridization and the reproductive pathways
mediating gene flow between native Malus coronaria and domestic apple,
M. domestica. Botany, 87(9), 864-874.
Lassois, L., Denancé, C., Ravon, E., Guyader, A., Guisnel, R., Hibrand-Saint-
Oyant, L., Poncet, C., Lasserre-Zuber, P., Feugey, L., & Durel, C. E. (2016).
Genetic diversity, population structure, parentage analysis, and construction
of core collections in the French apple germplasm based on SSR
markers. Plant molecular biology reporter, 34(4), 827-844.
Lepais, O., Muller, S. D., Saad-Limam, S. B., Benslama, M., Rhazi, L.,
Belouahem-Abed, D., Gammar, A.M., Ghrabi-Gammar, Z., & Bacles, C. F.
E. (2013). High genetic diversity and distinctiveness of rear-edge climate
relicts maintained by ancient tetraploidisation for Alnus glutinosa. PLoS
One, 8(9), e75029.
Liang, W., Dondini, L., De Franceschi, P., Paris, R., Sansavini, S., & Tartarini, S.
(2015). Genetic diversity, population structure and construction of a core
collection of apple cultivars from Italian germplasm. Plant Molecular Biology
Reporter, 33(3), 458-473.
Liebhard, R., Gianfranceschi, L., Koller, B., Ryder, C. D., Tarchini, R., Van de
Weg, E., & Gessler, C. (2002). Development and characterisation of 140
new microsatellites in apple (Malus x domestica Borkh.). Molecular
Breeding, 10(4), 217-241.
Machery-Nagel. (2013). Genomic DNA from plant. Düren, Germany: Machery-
Nagel.
Mailvaganam, S. (2013). Ontario Apple Production, Price and Farm Value by
Variety, 1994-2005. Retrieved November 20, 2016, from
http://www.omaf.gov.on.ca/english/stats/hort/applebyvariety.htm

39
McCafferty, J. (2012). PeakStudio. Retrieved January, 2018, from
https://fodorlab.uncc.edu/software/peakstudio
Meirmans, P.G., & P.H. Van Tienderen: (2004), GENOTYPE and GENODIVE:
two programs for the analysis of genetic diversity of asexual organisms,
Molecular Ecology Notes. 4 p.792-794.
Mohlenbrock, R. H. (2013). Vascular flora of Illinois: A field guide. SIU Press.
Myers, J. H., & Bazely, D. (2003). Ecology and control of introduced plants(Vol.
62). Cambridge University Press.
National Fruit Collection. (2015). Welcome to the National Fruit Collection.
Retrieved June 5, 2018, from
http://www.nationalfruitcollection.org.uk/index.php
Ontario Apple Growers. (2016). Ontario Apple Varieties. Retrieved October 11,
2016, from http://www.onapples.com/apple-varieties.php
Ontario Ministry of Agriculture and Food. (1966). Fruit Tree Census - Pt.3 -
Apples.
Ontario Ministry of Agriculture and Food. (1976). Fruit Tree Census - Pt.3 -
Apples.
Orange Pippin Ltd. (2018). Welcome to Orange Pippin. Retrieved June 5, 2018,
from https://www.orangepippin.com/
Perrier X., & Jacquemoud-Collet J.P. (2006). DARwin software
http://darwin.cirad.fr/
Prentis, P. J., White, E. M., Radford, I. J., Lowe, A. J., & Clarke, A. R. (2007).
Can hybridization cause local extinction: a case for demographic swamping

40
of the Australian native Senecio pinnatifolius by the invasive Senecio
madagascariensis? New Phytologist, 176(4), 902-912.
Pritchard, J. K., Stephens, M., & Donnelly, P. (2000). Inference of population
structure using multilocus genotype data. Genetics, 155(2), 945-959.
Richardson, D. M., Pyšek, P., Rejmánek, M., Barbour, M. G., Panetta, F. D., &
West, C. J. (2000). Naturalization and invasion of alien plants: concepts and
definitions. Diversity and distributions, 6(2), 93-107.
Rosenberg, N. A. (2004). DISTRUCT: a program for the graphical display of
population structure. Molecular Ecology Notes, 4(1), 137-138.
Routson, K. J., Reilley, A. A., Henk, A. D., & Volk, G. M. (2009). Identification of
historic apple trees in the Southwestern United States and implications for
conservation. HortScience, 44(3), 589-594.
Semagn, K. (2014). Leaf tissue sampling and DNA extraction
protocols. Molecular Plant Taxonomy: Methods and Protocols, 53-67.
Silfverberg-Dilworth, E., Matasci, C. L., Van de Weg, W. E., Van Kaauwen, M. P.
W., Walser, M., Kodde, L. P., Soglio, V., Gianfranceschi, L., Durel, C.E.,
Costa, F., Yamamoto, T., Koller, B., Gessler, C., & Patocchi, A. (2006).
Microsatellite markers spanning the apple (Malus x domestica Borkh.)
genome. Tree Genetics & Genomes, 2(4), 202-224.
Slatkin, M. (1985). Rare alleles as indicators of gene flow. Evolution, 53-65.
Snow, A. A., & Campbell, L. G. (2005). Can feral radishes become weeds. Crop
ferality and volunteerism, 193-208.
Stevens, C. (2017). Ontario Apple Growers Annual Report – Year ending
October 31st, 2017. Retrieved May 17, 2018, from

41
http://onapples.com/uploads/images/files/OAG%20Annual%20Report%202
017%20FINAL%20with%20Cover%20no%20FS.pdf
Stöck, M., Ustinova, J., Lamatsch, D. K., Schartl, M., Perrin, N., & Moritz, C.
(2010). A vertebrate reproductive system involving three ploidy levels:
hybrid origin of triploids in a contact zone of diploid and tetraploid Palearctic
green toads (Bufo viridis subgroup). Evolution, 64(4), 944-959.
Stover, M. E., & Marks, P. L. (1998). Successional vegetation on abandoned
cultivated and pastured land in Tompkins County, New York. Journal of the
Torrey Botanical Society, 150-164.
Urrestarazu, J., Miranda, C., Santesteban, L. G., & Royo, J. B. (2012). Genetic
diversity and structure of local apple cultivars from Northeastern Spain
assessed by microsatellite markers. Tree genetics & genomes, 8(6), 1163-
1180.
Van Nocker, S., & Gardiner, S. E. (2014). Breeding better cultivars, faster:
applications of new technologies for the rapid deployment of superior
horticultural tree crops. Horticulture Research, 1, 14022.
Vaughan, D. A., Sanchez, P. L., Ushiki, J., Kaga, A., Tomooka, N., & Gressel, J.
(2005). Asian rice and weedy rice-evolutionary perspectives. Crop ferality
and volunteerism, 257-277.
Vick, R. (1991). Edible Apples in Prairie Canada: Edible Apples to 1990: as
Grown in the Canadian Prairie Provinces (No. 21). Friends of the Garden,
U. of A. Devonian Botanic Garden.
Vinatzer, B. A., Patocchi, A., Tartarini, S., Gianfranceschi, L., Sansavini, S., &
Gessler, C. (2004). Isolation of two microsatellite markers from BAC clones
of the Vf scab resistance region and molecular characterization of scab‐
resistant accessions in Malus germplasm. Plant Breeding, 123(4), 321-326.

42
Volk, G. M., Chao, C. T., Norelli, J., Brown, S. K., Fazio, G., Peace, C.,
McFerson, J., Zhong, G.Y., & Bretting, P. (2015). The vulnerability of US
apple (Malus) genetic resources. Genetic Resources and Crop
Evolution, 62(5), 765-794.
Volk, G. M., & Henk, A. D. (2016). Historic American apple cultivars: Identification
and availability. Journal of the American Society for Horticultural
Science, 141(3), 292-301.
Wang, J. (2017). The computer program STRUCTURE for assigning individuals
to populations: easy to use but easier to misuse. Molecular ecology
resources, 17(5), 981-990.
Warwick, S. I., & Stewart, C. N. (2005). Crops come from wild plants: how
domestication, transgenes, and linkage together shape ferality. Crop ferality
and volunteerism, 9-30.

43
TABLES
Table 1: List of Malus domestica (apple) orchards, located at the centre of each
five-kilometer radius sampling plot, and their addresses across the five growing
regions of southern Ontario. Furthermore, a list of nurseries from which reference
cultivar and ornamental samples were collected from.
Region Orchard Name Address
Cleaver's Orchard 1319 Blueline Road, Simcoe, ON
The Cider Keg 1231 Hwy 24 East, Vittoria, ON
Frank E's RR#3, 1936 Regional Rd 4, Vanessa, ON
M&R Orchard 56830 Talbot Line, Tillsonburg, ON
Wagner Orchards 1222 Concession Road 8 West, Maidstone, ON
Greatview Orchards 8677 Talbot Trail, Blenheim, ON
The Fruit Wagon 793 County Rd 50, Harrow, ON
E&B Medel Orchards 1706 Rd 5 E, Ruthven, ON
Orchard Home Farm 235 Howell Rd, Saint George, ON
Lincoln Line Orchards RR 20, 2A0, 9764 Smithville Rd, Hannon
Carluke Orchards 2194 Shaver Rd, Ancaster, ON
Chudleigh's Farm 9528 Regional Rd 25, Milton, ON
Giffen's Country Market 55 Station St, Glen Huron, ON
T K Ferri Orchards 496415 Grey County Rd 2, Clarksburg, ON
Smith's Applez and Farm Market 470 The River Rd, Port Elgin, ON
Vail's Orchard 205654 ON-26, Meaford, ON
Campbell's Orchard 1633 County Rd 3, Carrying Place, ON
Cricklewood Farm 14952 County 2 Rd, Brighton, ON
Moore's Orchard 1497 Moore Orchard Road, Cobourg, ON
Archibald's Estate Winery 6275 Liberty St. N., Bowmanville, ON
Canadian Clonal Genebank Harrow, ON
Silvercreek Nursery 2343 Gerber Rd, Wellesley, ON
Dan Reardon's Orchard Ontario
Apple Biodiversity Collection Kentville, NS
Central Experimental Farm 960 Carling Ave, Ottawa, ON
Christina Stonehouse's Home Orchard Nova Scotia
Daryl Hunter's Home Orchard New Brunswick
Vineland Research and Innovation Centre 4890 Victoria Ave N, Lincoln, ON
Nurseries
North
East
Central
West
Central-West

44
Table 2: Percentage of the total Malus domestica acreage for the most common
cultivars by apple growing region of Ontario in 2016. Other varieties not shown
due to smaller acreage but grown in Ontario include: Braeburn, Cox’s Orange
Pippin, Creston, Crimson Crisp, Cripps Pink, Elstar, Fortune, Goldrush, Granny
Smith, Liberty, Lobo, Lodi, Macoun, Melba, Novaspy, Quinte, Rome, Roxbury
Russet, Russet, Shizuka, Silken, Snow, Sunrise, Tolman Sweet, Transparent,
Tydeman Red, Viking, Vista Bella, Wealthy, Winesap, and Zestar (Stevens,
2017).
Variety Name West Central-West North Central East
Jerseymac 0.34 0.00 1.54 0.26 0.06
Ginger Gold 2.11 0.77 0.22 1.18 0.97
Honeycrisp 8.45 8.20 7.45 9.44 15.05
Paulared 1.41 1.04 0.67 1.13 3.12
Crimson Crisp 0.00 0.05 2.04 0.41 0.28
Jonamac 1.34 0.03 0.15 0.21 0.00
Gala 15.82 16.58 3.56 19.38 22.83
Golden Delicious 10.62 3.39 0.17 6.51 1.50
Idared 3.45 2.83 6.15 1.18 2.19
Crispin/Mutsu 3.22 2.08 0.55 6.36 0.72
Jonagold 1.21 0.72 0.25 1.38 0.03
McIntosh 7.21 16.84 32.18 11.28 19.46
Empire 10.42 15.83 4.61 5.28 6.03
Red Delicous 11.09 10.97 2.09 12.87 9.49
Northern Spy 2.41 7.85 19.45 2.00 1.25
Ambrosia 10.92 6.03 4.71 6.62 6.96
Cortland 1.34 2.43 3.04 3.90 2.97
Spartan 0.37 1.01 3.66 0.92 1.47
Fuji 4.16 1.17 0.42 2.05 0.50
Golden Russet 0.47 0.08 0.37 0.41 0.78
Marshall Mac 0.20 0.35 0.05 0.26 0.47
Other 1.84 1.47 5.98 3.54 1.69
Mixed 1.37 0.19 0.12 3.38 1.94
Earligold 0.23 0.08 0.55 0.05 0.25
Total Percentage 100 100 100 100 100

45
Table 3: Descriptive information for 16 Microsatellite (SSR) loci used in the genetic analysis of feral and cultivated Malus
domestica, the native crabapple, Malus coronaria, and ornamental Malus species. Linkage groups taken from papers of
origin for each SSR locus.
Locus Linkage group
number
Size range (bp) Forward primer sequence
(5' - 3')
Reverse primer sequence
(5' - 3')
Paper of origin
Hi02c07 1 104-154 agagctacggggatccaaat gtttaagcatcccgattgaaagg Silfverberg-Dilworth et al. (2006)
CH-Vf1 1 133-188 atcaccaccagcagcaaag gtttcttcatacaaatcaaagcacaaccc Vinatzer et al. 2004
CH02c06 2 201-286 tgacgaaatccactactaatgca gtttgattgcgcgctttttaacat Liebhard et al. (2002)
GD12 3 150-200 ttgaggtgtttctcccattgga gtttcttctaacgaagccgccatttcttt Hokanson et al. (1998)
CH05f06 5 165-197 ttagatccggtcactctccact gttttggaggaagacgaagaagaaag Liebhard et al. (2002)
CH03d07 6 169-232 caaatcaatgcaaaactgtca gtttggcttctggccatgatttta Liebhard et al. (2002)
CH04e05 7 178-232 aggctaacagaaatgtggtttg gtttatggctcctattgccatcat Liebhard et al. (2002)
CH01h10 8 90-144 tgcaaagataggtagatatatgcca gtttaggagggattgtttgtgcac Liebhard et al. (2002)
CH01f03b 9 141-200 gagaagcaaatgcaaaaccc gtttctccccggctcctattctac Liebhard et al. (2002)
CH02c11 10 207-269 tgaaggcaatcactctgtgc gtttttccgagaatcctcttcgac Liebhard et al. (2002)
CH02d08 11 209-262 tccaaaatggcgtacctctc gtttgcagacactcactcactatctctc Liebhard et al. (2002)
CH01f02 12 163-227 accacattagagcagttgagg gtttctggtttgttttcctccagc Liebhard et al. (2002)
GD147 13 122-166 tcccgccatttctctgc gtttaaaccgctgctgctgaac Hokanson et al. (1998)
CH04c07 14 98-148 ggccttccatgtctcagaag gtttcctcatgccctccactaaca Liebhard et al. (2002)
CH02c09 15 227-261 ttatgtaccaactttgctaacctc gtttagaagcagcagaggaggatg Liebhard et al. (2002)
CH01h01 17 104-150 gaaagacttgcagtgggagc gtttggagtgggtttgagaaggtt Liebhard et al. (2002)
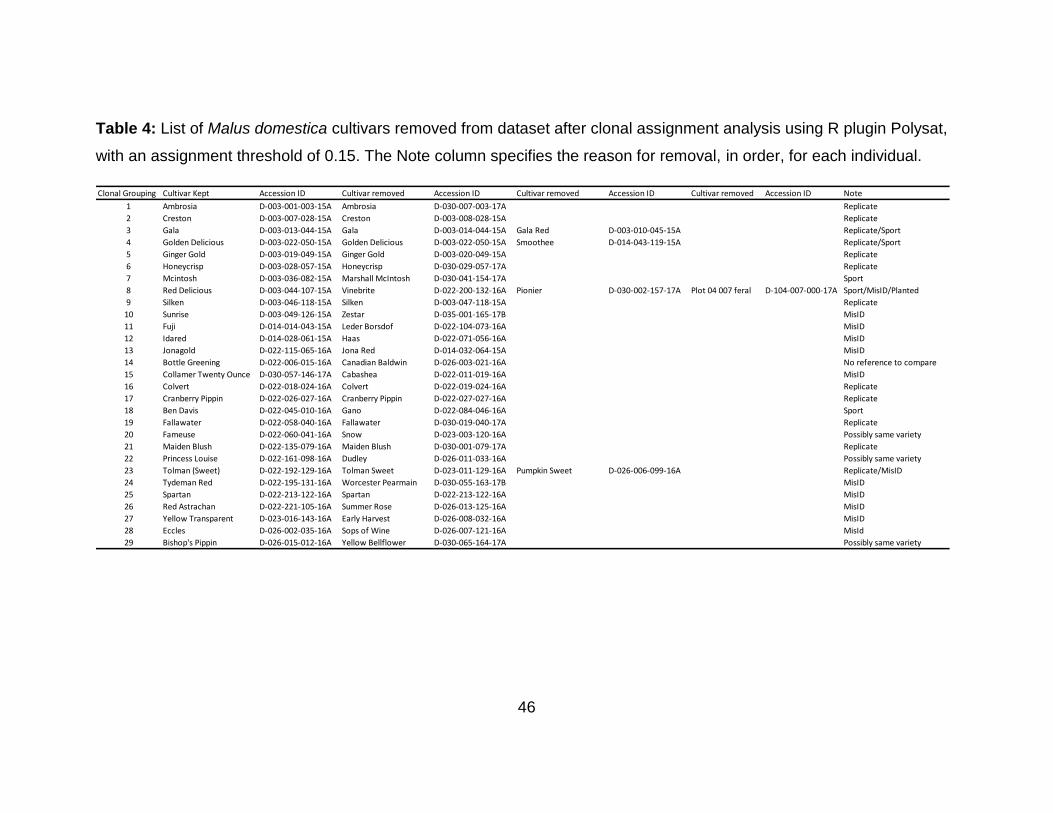
46
Table 4: List of Malus domestica cultivars removed from dataset after clonal assignment analysis using R plugin Polysat,
with an assignment threshold of 0.15. The Note column specifies the reason for removal, in order, for each individual.
Clonal Grouping Cultivar Kept Accession ID Cultivar removed Accession ID Cultivar removed Accession ID Cultivar removed Accession ID Note
1 Ambrosia D-003-001-003-15A Ambrosia D-030-007-003-17A Replicate
2 Creston D-003-007-028-15A Creston D-003-008-028-15A Replicate
3 Gala D-003-013-044-15A Gala D-003-014-044-15A Gala Red D-003-010-045-15A Replicate/Sport
4 Golden Delicious D-003-022-050-15A Golden Delicious D-003-022-050-15A Smoothee D-014-043-119-15A Replicate/Sport
5 Ginger Gold D-003-019-049-15A Ginger Gold D-003-020-049-15A Replicate
6 Honeycrisp D-003-028-057-15A Honeycrisp D-030-029-057-17A Replicate
7 Mcintosh D-003-036-082-15A Marshall McIntosh D-030-041-154-17A Sport
8 Red Delicious D-003-044-107-15A Vinebrite D-022-200-132-16A Pionier D-030-002-157-17A Plot 04 007 feral D-104-007-000-17A Sport/MisID/Planted
9 Silken D-003-046-118-15A Silken D-003-047-118-15A Replicate
10 Sunrise D-003-049-126-15A Zestar D-035-001-165-17B MisID
11 Fuji D-014-014-043-15A Leder Borsdof D-022-104-073-16A MisID
12 Idared D-014-028-061-15A Haas D-022-071-056-16A MisID
13 Jonagold D-022-115-065-16A Jona Red D-014-032-064-15A MisID
14 Bottle Greening D-022-006-015-16A Canadian Baldwin D-026-003-021-16A No reference to compare
15 Collamer Twenty Ounce D-030-057-146-17A Cabashea D-022-011-019-16A MisID
16 Colvert D-022-018-024-16A Colvert D-022-019-024-16A Replicate
17 Cranberry Pippin D-022-026-027-16A Cranberry Pippin D-022-027-027-16A Replicate
18 Ben Davis D-022-045-010-16A Gano D-022-084-046-16A Sport
19 Fallawater D-022-058-040-16A Fallawater D-030-019-040-17A Replicate
20 Fameuse D-022-060-041-16A Snow D-023-003-120-16A Possibly same variety
21 Maiden Blush D-022-135-079-16A Maiden Blush D-030-001-079-17A Replicate
22 Princess Louise D-022-161-098-16A Dudley D-026-011-033-16A Possibly same variety
23 Tolman (Sweet) D-022-192-129-16A Tolman Sweet D-023-011-129-16A Pumpkin Sweet D-026-006-099-16A Replicate/MisID
24 Tydeman Red D-022-195-131-16A Worcester Pearmain D-030-055-163-17B MisID
25 Spartan D-022-213-122-16A Spartan D-022-213-122-16A MisID
26 Red Astrachan D-022-221-105-16A Summer Rose D-026-013-125-16A MisID
27 Yellow Transparent D-023-016-143-16A Early Harvest D-026-008-032-16A MisID
28 Eccles D-026-002-035-16A Sops of Wine D-026-007-121-16A MisId
29 Bishop's Pippin D-026-015-012-16A Yellow Bellflower D-030-065-164-17A Possibly same variety

47
Table 5: Distribution of Malus domestica cultivars across seven subgroups
defined by STRUCTURE analysis. The 20 major cultivars grown in Ontario used
in this study, any cultivars that were strongly assigned to their initial grouping, or
their nested subgrouping are indicated by an X. Any cultivars that match a
differently named cultivar from the UK National Fruit Collection are indicated in
the note column. Q represents assignment coefficient of individual to a genetic
cluster. Country of origin and century of origin data are from Amyote (2018), Volk
& Henk (2016), National Fruit Collection (2015), Beach (1905), and Orange
Pippin Ltd. (2018).
Subgroup Cultivar Country of Origin Century of Origin ID Group Q ≥ 0.80? Subgroup Q ≥ 0.80? Major Cultivar Notes
Baldwin USA 1700's D-022-040-006-16A X
Bethel USA 1800's D-026-019-011-16A X
Bishop's Pippin USA 1800's D-026-015-012-16A X
Blenheim Orange UK 1700's D-030-047-013-17A X
Blue Pearmain USA 1800's D-022-005-014-16A X
Bough Sweet USA 1800's D-030-027-016-17A X X
Canada Red USA 1800's D-030-054-020-17A
Bottle Greening USA 1800's D-026-003-021-16A X X
Chenango (Strawberry) USA 1700's D-022-016-022-16A X
Collamer Twenty Ounce USA 1800's D-030-057-146-17A
Colvert USA 1800's D-022-018-024-16A X
Cox's Orange Pippin UK 1800's D-014-009-026-15A
Cranberry Pippin USA 1800's D-022-026-027-16A X
Creston Canada Late 1900's D-003-007-028-15A X X
Early Harvest USA 1800's D-030-033-032-17A X X
Early Joe USA 1800's D-030-048-034-17A X
Elstar Netherlands 1900's D-022-052-036-16A X X
Esopus Spitzenberg USA 1700's D-022-215-038-16A X
Fallawater USA 1800's D-022-058-040-16A X
Freedom USA 1900's D-022-077-042-16A
Gala New Zealand 1900's D-003-014-044-15A X X
Golden Delicious USA 1800's D-003-022-050-15A X X X
Goldrush USA Late 1900's D-014-027-052-15A X
Granny Smith Australia 1800's D-022-062-053-16A X
Gravenstein Denmark 1600's D-022-065-054-16A
Grime's Golden USA 1800's D-022-067-055-16A X
Hubbardston Nonesuch USA 1800's D-022-073-058-16A X
Idared USA 1900's D-014-028-061-15A X X
Jonagold USA 1900's D-022-115-065-16A X X X
Kentish Fillbasket UK 1800's D-022-095-069-16A
King (of Tompkin's County) USA 1800's D-022-098-071-16A X
Lady France 1600's D-023-022-072-16A X
Maiden Blush USA 1800's D-022-135-079-16A X X
Mann USA 1800's D-022-138-080-16A
Michelin France 1800's D-034-001-166-17A X
Mother USA 1800's D-030-028-144-17A X X
Mutsu (Crispin) Japan 1900's D-003-037-087-15A X X X
Newton Pippin USA 1700's D-022-190-089-16A X X
Northwestern Greening USA 1800's D-022-146-092-16A X X
Pear Gold Canada 1900's D-022-155-095-16A X X
Pewaukee USA 1800's D-030-036-096-17A X Matches ECPGR Lille
Pomme Grise Canada 1700's D-030-020-158-17A X
Primate USA 1800's D-022-158-097-16A X
Rambo-Red Summer D-030-035-159-17A X
Rhode Island Greening USA 1600's D-023-018-109-16A X
Ribston Pippin UK 1700's D-030-051-110-17A X
Rome Beauty USA 1800's D-022-232-111-16A X X
Roxbury Russet USA 1600's D-022-235-112-16A X
Salome USA 1800's D-026-001-114-16A X
Shizuka Japan 1900's D-030-064-161-17B X X
Silken Canada Late 1900's D-003-046-118-15A X
Sunrise Canada Late 1900's D-003-049-126-15A X X
Wagener USA 1700's D-022-236-134-16A X
Westfield Seek-no-further USA 1700's D-022-207-138-16A X
White Winter Calville France 1500's D-022-245-139-16A X
Winter Banana USA 1800's D-022-248-141-16A X X
B1

48
Table 5: Continued.
Subgroup Cultivar Country of Origin Century of Origin ID Group Q ≥ 0.80? Subgroup Q ≥ 0.80? Major Cultivar Notes
Ambrosia Canada Late 1900's D-003-001-003-15A X X
Baxter Canada 1800's D-030-062-009-17A X
Ben Davis USA 1800's D-022-045-010-16A X X
Braeburn New Zealand 1900's D-014-001-017-15A X X
Britegold Canada 1900's D-022-008-018-16A X
Canada Red USA 1800's D-022-013-020-16A X Matches ECPGR Newton Spitzenberg
Cortland USA 1800's D-022-021-025-16A X X X
Dawn Mac Canada 1900's D-022-028-030-16A X X
Empire USA 1900's D-022-055-037-16A X X X
Enterprise USA Late 1900's D-030-046-149-17A X
Fameuse Canada 1700's D-022-060-041-16A X
Fuji Japan 1900's D-014-014-043-15A X X X
Golden Russet UK 1700's D-014-026-051-15A X X X
Hume Canada 1900's D-022-075-059-16A X
Hurlbutt D-026-004-060-16A X
Irish Peach UK 1800's D-022-110-062-16A X Matches ECPGR Benoni
Macoun USA 1900's D-022-132-078-16A
Mcintosh Canada 1800's D-003-036-082-15A X XX Same genotpe as Marshall Mcintosh
Northern Spy USA 1800's D-022-143-091-16A X X X
Novaspy Canada Late 1900's D-030-053-155-17A X X
Ontario Canada 1800's D-022-152-094-16A X
Ralls Gennetting USA 1800's D-026-021-103-16A X MisID Unknown Variety
Red Delicious USA 1800's D-003-044-107-15A X X X
Roxbury Russet USA 1600's D-030-009-112-17B X
Saint Lawrence Canada 1800's D-022-197-113-16A X
Sandow Canada 1900's D-026-012-115-16A
Scarlett Pippin Canada 1800's D-022-206-116-16A X
Spartan Canada 1900's D-030-059-122-17A X X X
Stark USA 1800's D-022-218-124-16A X
Tolman Sweet USA 1800's D-023-011-129-16A X X
Winesap USA 1800's D-023-002-140-16A X X
Wealthy USA 1800's D-003-055-135-15A X X
Akane Japan 1900's D-022-031-001-16A X
Jonathan USA 1800's D-022-118-066-16A X
Kennedy's Pear-shaped D-022-092-068-16A
Lubsk Queen Russia 1800's D-022-129-077-16A X
Quaker Beauty Canada 1800's D-022-163-100-16A X
Rescue Canada 1900's D-022-229-108-16A X
Wolf River USA 1800's D-022-251-142-16A X
Sheep's Nose D-026-005-117-16A Matches ECPGR Katja
Gideon USA 1800's D-026-016-048-16A X
Antonovka Russia 1800's D-030-037-005-17A X
Duchess (of Oldenburg) Russia 1700's D-022-048-031-16A X X
Margaret Pratt Canada 1900's D-022-175-081-16A X X
Crimson Beauty Canada 1800's D-026-014-029-16A X
Zestar USA Late 1900's D-030-025-165-17A X
Jersey Mac USA 1900's D-022-113-063-16A X X
Joyce Canada 1900's D-022-120-067-16A X
Quinte (Mis ID) D-022-166-102-16A X MisID, Unknown Variety
Vista Bella USA 1900's D-022-204-133-16A X
Red Atlas Canada 1900's D-022-223-106-16A X
Melba Canada 1900's D-023-005-084-16A X
Quinte Canada 1900's D-030-015-102-17A X
Viking D-030-022-162-17A X
Ginger Gold USA 1900's D-003-019-049-15A X
Lodi USA 1900's D-022-126-076-16A X
Yellow Transparent Russia 1800's D-023-016-143-16A X X
Honeycrisp USA 1900's D-003-028-057-15A X X
Liberty USA 1900's D-014-033-074-15A X
Alexander Russia 1700's D-022-034-002-16A X
Lobo Canada 1900's D-022-123-075-16A X
McMahon USA 1800's D-022-178-083-16A X
Moscow Pear Russia 1800's D-022-184-086-16A X
Tydeman Red UK 1900's D-022-195-131-16A X
Red Astrachan Russia 1800's D-022-221-105-16A
Eccles D-026-002-035-16A X
Princess Louise Canada 1800's D-026-011-033-16A X
Paulared USA 1900's D-030-018-156-17B X X
Milwaukee USA 1800's D-030-042-085-17B X
Crimson Crisp USA Late 1900's D-030-050-147-17A
Jonamac USA 1900's D-030-056-152-17A X X
Admixed
Genotypes
A5
B2
A1
A2
A3
A4

49
Table 6: Measures of genetic diversity in Malus domestica for the overall dataset, feral individuals, and reference
cultivars. NA: Number of alleles; H0: Observed heterozygosity; HE: Expected heterozygosity; NAE: Effective number of
alleles.
Reference Cultivars N = 127
Locus Name NA H0 HE NAE NA H0 HE NAE NA H0 HE NAE
CH04c07 18 0.871 0.849 6.62 18 0.851 0.842 6.31 16 0.945 0.873 7.85
CH01h10 11 0.674 0.668 3.01 11 0.672 0.666 2.99 10 0.68 0.674 3.07
CH01h01 17 0.855 0.859 7.07 15 0.855 0.860 7.13 13 0.857 0.842 6.31
Hi02c07 13 0.791 0.759 4.15 12 0.775 0.744 3.9 10 0.85 0.801 5.03
CH01f02 21 0.897 0.889 8.97 20 0.901 0.889 9 16 0.882 0.887 8.84
CH01f03b 14 0.789 0.791 4.78 14 0.792 0.795 4.87 11 0.778 0.775 4.45
GD12 16 0.773 0.742 3.87 16 0.771 0.745 3.92 12 0.78 0.728 3.68
GD147 13 0.814 0.786 4.67 11 0.811 0.783 4.62 12 0.827 0.796 4.9
CH04e05 17 0.723 0.713 3.49 16 0.728 0.719 3.56 14 0.701 0.692 3.25
CH02d08 17 0.819 0.794 4.85 17 0.823 0.787 4.69 15 0.803 0.814 5.39
CH02c11 15 0.899 0.897 9.67 14 0.891 0.896 9.65 13 0.929 0.890 9.07
CH02c09 13 0.844 0.835 6.06 13 0.83 0.828 5.83 10 0.898 0.846 6.5
CH05f06 11 0.819 0.802 5.04 11 0.817 0.801 5.01 11 0.827 0.803 5.08
CH03d07 22 0.842 0.858 7.06 20 0.834 0.853 6.82 18 0.874 0.874 7.94
Mean 15.57 0.815 0.803 5.66 14.86 0.811 0.801 5.59 12.93 0.831 0.807 5.81
Overall Dataset N = 603 Only Ferals N = 476

50
Table 7: Descriptive information for feral Malus domestica populations found within five sampling regions across southern
Ontario. HE: Expected heterozygosity; H0: Observed heterozygosity; NAE: Effective number of alleles; AR: Allelic richness.
Population Sample Size HE H0 Total Private NAE AR
Overall 476 0.801 0.811 208 NA 5.59 11.66
Central-West 97 0.790 0.804 172 11 5.33 11.65
West 70 0.805 0.822 150 0 5.69 10.71
Central 94 0.800 0.811 163 5 5.57 11.17
North 114 0.794 0.801 171 8 5.49 11.36
East 101 0.804 0.82 168 6 5.76 11.34
Number of Alleles

51
Table 8: Pairwise genetic differentiation values (Fst) between five populations of feral Malus domestica apples in southern
Ontario. P-values are shown above the diagonal.
Table 9: Analysis of molecular variance (AMOVA) table for feral samples of Malus domestica corresponding to five
sampling regions, and 20 sampling plots within the five regions.
Population Central West West Central North East
Central West -- 0 0.002 0.006 0.001
West 0.002 -- 0 0 0
Central 0.002 0.002 -- 0.036 0.001
North 0.001 0.002 0.001 -- 0.022
East 0.002 0.003 0.002 0.001 --
Population df Sum of Square % Variation p value
Between Regions 4 33.354 0.25 <0.001
Between Sampling Plots 15 98.355 0.56 <0.001
Within Plots 614 3420.038 99.19 0.00889

52
Table 10: Counts of unique alleles observed in only one Malus domestica reference cultivar at each locus, and alleles
observed in more than one M. domestica reference cultivar.
Locus Alleles only found in one cultivar Alleles found in 2 or more cultivars
CH04c07 None 94, 96, 104, 106, 108, 109, 110, 112, 114, 118, 120, 128, 129, 133, 135, 140
CH01h10 103 88, 96, 100, 101, 107, 109, 113, 115, 131
CH01h01 107, 123 103, 109, 111, 113, 115, 117, 119, 125, 127, 129, 139
Hi02c07 122, 126, 152 106, 110, 114, 116, 118, 124, 150
CH01f02 174, 207 168, 170, 172, 178, 180,182, 186, 188, 191, 193, 199, 203, 205, 221
CH01f03b None 136, 143, 148, 156, 158, 160, 162, 170, 176, 178, 182
GD12 157, 162 138, 147, 150, 151, 153, 154, 160, 182, 190
GD147 123, 156 131, 135, 137, 139, 141,143, 145, 147,150, 152
CH04e05 216, 228 173, 181, 196, 198, 200, 202, 206, 208, 216, 220, 222, 224, 226
CH02d08 258 204, 208, 210, 212, 214, 216, 222, 224, 228, 246, 248, 250, 252, 254
CH02c11 223 205, 213, 215, 217, 221,225, 227, 229, 231, 233, 235, 237
CH02c09 246, 250, 232, 238, 240, 242, 244, 248, 254, 256
CH05f06 191, 197 171, 177, 179, 181, 183, 185, 187, 189, 193
Ch03d07 185, 187, 207, 211, 217, 233 173, 189, 191, 193, 195, 199, 205, 109, 221, 227, 229, 231, 233

53
Table 11: Descriptive information for two major groups and seven subgroups of Malus domestica identified in
STRUCTURE analyses, and the number of genotypes strongly assigned to each group/subgroup. HE: Expected
heterozygosity; H0: Observed heterozygosity; NAe: Effective number of alleles; AR: Allelic richness.
Group/Subgroup Number Genotypes Proportion Genotypes Q > 0.8 HE H0 Total Private NAE AR
A 172 0.785 0.8093 0.855 186 11 5.66 13.27
A1 26 0.346 0.7115 0.846 101 0 3.64 6.23
A2 31 0.161 0.8471 0.889 153 6 6.82 9.12
A3 29 0.241 0.7373 0.861 104 0 4.18 6.42
A4 16 0.5 0.7341 0.844 85 1 4.22 6.05
A5 23 0.435 0.7573 0.86 102 1 4.53 6.73
ADMIXED 47 NA 0.7991 0.831 138 3 5.71 7.88
B 431 0.847 0.7838 0.799 203 25 5.148 12.84
B1 248 0.31 0.7917 0.808 196 20 5.32 8.14
B2 183 0.322 0.7581 0.787 165 5 4.52 7.11
Number of Alleles

54
Table 12: Differences in distributions of seven subgroups of feral Malus
domestica among geographic regions using a Chi square analysis, with Pearson
Chi-square values, likelihood ratios, and p-values.
Table 13: Distributions of feral Malus domestica within seven subgroups among
five sampling regions represented in a contingency table with an associated post-
hoc z-test.
Value df
P-value (2-
sided)
Pearson Chi-
Square86.740
a 28 0.000
Likelihood Ratio 81.948 28 0.000
N of Valid Cases 476
a. 21 cells (52.5%) have expected count less than 5.
Subgroup
Central-
West West Central North East
B1 49a 12b 50a 39a, b 42a 192
B2 27a 28a 29a 43a 25a 152
A1 <5a, b 9b <5a, b <5a 5a, b 23
A2 5a <5a <5a 7a 5a 23
A3 9a <5a <5a 6a 7a 25
A4 <5a 6b <5a <5a, b <5a 8
A5 <5a 6a 5a <5a 5a 20
Admixed <5a <5a <5a 13a 12a 33
Total 99 68 94 114 101 476
Population
Total
Each subscript letter denotes a subset of Population categories whose column proportions do
not differ significantly from each other at the .05 level.

55
Table 14: Bivariate analysis comparing proportion of feral Malus domestica
individuals assigned to subgroup B1 to proportions of major commercial cultivar
production in subgroup B1 in 2016, and 1966.
Table 15: Analysis of molecular variance (AMOVA) table corresponding to two
major groups and 7 subgroups of Malus domestica defined in the nested
STRUCTURE analysis.
Ferals Cultivars
Pearson
Correlation
0.056
P-value (2-sided) 0.929
N 5 5
Pearson
Correlation
0.310
P-value (2-sided) 0.690
N 4 4
Ferals
(2016)
Ferals
(1966)
Population df Sum of Square % Variation p value
Between Group A and B 1 70.591 2.42 <0.001
Between Subgroups 6 112.353 2.98 <0.001
Within Subgroups 796 4318.035 94.6 0.14154

56
Table 16: Pairwise genetic differentiation values (Fst) between seven subgroups
of cultivars and feral Malus domestica in southern Ontario defined by the nested
STRUCTURE analysis.
Subgroup B1 B2 A1 A2 A3 A4 A5
B1 --
B2 0.006 --
A1 0.029 0.032 --
A2 0.01 0.016 0.023 --
A3 0.032 0.037 0.026 0.016 --
A4 0.028 0.032 0.038 0.022 0.033 --
A5 0.026 0.03 0.052 0.022 0.048 0.046 --

57
Table 17: Inferred pedigrees for nine cultivars of Malus domestica whose pedigrees are fully or partially known, within a
set of 103 diploid cultivars using 14 SSRs at 95% confidence with CERVUS software.
Cultivar Offspring Cultivar Parent 1 Cultivar Parent 2 Historical Notes
Ambrosia Golden Delicious Red Delicious Matches documented lineage
Cortland Mcintosh Ben Davis Matches documented lineage
Dawn Mac Mcintosh Red Delicious Matches documented lineage
Jonamac Mcintosh Jonathan Matches documented lineage
Lobo Mcintosh McMahon Matches Mcintosh, unknown second parent
Ontario Northern Spy Wagener Matches documented lineage
Quinte Melba Crimson Beauty Matches documented lineage
Tydeman Red Mcintosh Akane Doesn't match, Worcester Pearmain is true parent
Wolf River Alexander Westfield Seek-no-further Matches Alexander, unknown second parent

58
Table 18: Inferred parental assignments for 47 feral offspring using 14 SSRs at
the level of 95% and 80% confidence for comparison, using Cervus parentage
analysis.
Cultivar # Parental Assignments 95% # Parental Assignments 80% Subgroup Major Cultivar
c.v. Wealthy 13 15 A1
c.v. Tolman Sweet 12 17 B2
c.v. Ben Davis 9 11 B2
c.v. Duchess (of Oldenburg) 7 9 A3
c.v. Fameuse 7 8 B2
c.v. Yellow Transparent 6 11 A5
c.v. Northern Spy 4 11 B2 X
c.v. Golden Russet 3 3 B2
c.v. Red Delicious 3 6 B2 X
c.v. Collamer Twenty Ounce 2 2 B1
c.v. Golden Delicious 2 4 B1 X
c.v. Mann 2 2 B1
c.v. Pewaukee 2 2 B1
c.v. Wagener 2 2 B1
c.v. Cortland 2 2 B2 X
c.v. McIntosh 2 9 B2 X
c.v. Saint Lawrence Tree 2 2 B2
c.v. Jonathan 1 2 A1
c.v. Gideon 1 2 A2
c.v. Wolf River 1 1 A2
c.v. Alexander 1 1 Admixed
c.v. Red Astrachan 1 2 Admixed
c.v. Bishop's Pippin 1 1 B1
c.v. Bough Sweet 1 1 B1
c.v. Canada Red 1 1 B1
c.v. Grime's Golden 1 1 B1
c.v. Hubbardston Nonesuch 1 1 B1
c.v. Idared 1 2 B1
c.v. Northwestern Greening 1 1 B1
c.v. Pomme Grise 1 1 B1
c.v. Winter Banana 1 1 B1
c.v. Lobo 0 1 Admixed
c.v. Tydeman Red 0 1 Admixed

59
Table 19: Most common Malus domestica cultivar pairings for feral offspring
inferred through parentage analysis at 95% confidence.
First Parent Second Parent Number times observed
c.v. Wealthy c.v. Tolman Sweet 4
c.v. Wealthy c.v. Ben Davis 2
c.v. Duchess (of Oldenburg) c.v. Tolman Sweet 2
c.v. Ben Davis c.v. Fameuse 2
c.v. Ben Davis c.v. Tolman Sweet 2
c.v. Yellow Transparent c.v. Bough Sweet 1
c.v. Wealthy c.v. Golden Russet 1
c.v. Wealthy c.v. Mann 1
c.v. Wealthy c.v. Pewaukee 1
c.v. Wealthy c.v. Wagener 1
c.v. Wealthy c.v. Wolf River 1
c.v. Wealthy c.v. Yellow Transparent 1
c.v. Red Delicious c.v. Wealthy 1
c.v. Northern Spy c.v. Saint Lawrence Tree 1
c.v. Northern Spy c.v. Tolman Sweet 1
c.v. Northern Spy c.v. Yellow Transparent 1
c.v. McIntosh c.v. Northwestern Greening 1
c.v. McIntosh c.v. Red Delicious 1
c.v. Jonathan c.v. Winter Banana 1
c.v. Idared c.v. Cortland 1
c.v. Hubbardston Nonesuch c.v. Tolman Sweet 1
c.v. Grime's Golden c.v. Tolman Sweet 1
c.v. Golden Russet c.v. Duchess (of Oldenburg) 1
c.v. Golden Russet c.v. Yellow Transparent 1
c.v. Golden Delicious c.v. Cortland 1
c.v. Golden Delicious c.v. Red Delicious 1
c.v. Fameuse c.v. Gideon 1
c.v. Fameuse c.v. Pomme Grise 1
c.v. Fameuse c.v. Tolman Sweet 1
c.v. Fameuse c.v. Yellow Transparent 1
c.v. Duchess (of Oldenburg) c.v. Collamer Twenty Ounce 1
c.v. Duchess (of Oldenburg) c.v. Fameuse 1
c.v. Duchess (of Oldenburg) c.v. Red Astrachan 1
c.v. Canada Red c.v. Duchess (of Oldenburg) 1
c.v. Bishop's Pippin c.v. Pewaukee 1
c.v. Ben Davis c.v. Mann 1
c.v. Ben Davis c.v. Northern Spy 1
c.v. Ben Davis c.v. Wagener 1
c.v. Alexander c.v. Collamer Twenty Ounce 1
c.v. Saint Lawrence Tree c.v. Yellow Transparent 1

60
FIGURES
Figure 1: Distribution of major commercial Malus domestica production in
southern Ontario represented by square grids, with red circles corresponding to
approximate locations of 20 sampling plots (each 5-kilometer in radius) used for
this study within five growing regions (1: Central Region; 2: Central-West Region;
3: East Region; 4 North Region; 5: West Region). The range of Malus coronaria
populations within southern Ontario corresponds to the shaded sections of the
map, with the black-lined open circle representing the location of rare Charitable
Research Reserve, where a major population of M. coronaria is located. Original
map taken and used with permission from Kron & Husband (2009).

61
Figure 2: STRUCTURE analysis of K = 3 with Malus domestica cultivars, Malus domestica feral individuals, Malus
coronaria, and ornamental Malus reference material. Each vertical line represents the membership coefficients assigned
to each individual.

62
Figure 3: Nested STRUCTURE analysis of feral Malus domestica individuals and reference cultivars. A) STRUCTURE
analysis of K = 2 divided into two clustering groups A and B. B) STRUCTURE analysis of K = 5 for group A, individuals
arranged in the same order as Figure 3A. Subgroups arranged in order of A1 - A5, Admixed. C) STRUCTURE analysis of
K = 2 for group B, individuals arranged in same order as Figure 3A. Subgroups arranged in order of B1, B2.
A
B
C

63
Figure 4: STRUCTURE analysis of K = 2 with Malus domestica cultivars, and five sampling regions of feral Malus
domestica sampled across southern Ontario. Blue = Group A, Orange = Group B.

64
Figure 5: Unweighted neighbor joining tree, showing the two major groupings of Malus
domestica defined by STRUCTURE. The tree contains cultivar reference individuals
and feral trees. Red = Group A; Blue = Group B.

65
Figure 6: Unweighted neighbor joining tree, showing the 7 subgroups of Malus
domestica defined by STRUCTURE. The tree contains cultivar reference individuals
and feral trees.

66
APPENDICES
Appendix 1
List of heritage cultivar sources:
Beach, S. (1905). The Apples Of New York (Vol. 1). Albany, New York: J.B. Lyon
Company.
Beach, S. (1905). The Apples Of New York (Vol. 2). Albany, New York: J.B. Lyon
Company.
Dolan, S. (2009). Fruitful legacy: A historic context of orchards in the United States, with
technical information for registering orchards in the National Register of Historic
Places. Seattle, WA: National Park Service, Olmsted Center for Landscape
Preservation, Pacific West Regional Office, Cultural Resources, Park Historic
Structures and Cultural Landscapes Program.
Fruit Growers' Association of Ontario. (1884). Fruit Growers' Association of Ontario For
The Year 1889. Toronto, Ontario: C. Blackett Robinson.
Fruit Growers' Association Of Ontario. (1922). Fifty-Third Annual Report Of The Fruit
Growers' Association Of Ontario 1921. Toronto, Ontario: Clarkson W. James.
Macoun, W.T. (1901). Apple Culture And District Lists Of Apples Suitable For Ontario
And Quebec With Descriptions Of Varieties (Vol. 37). Ottawa, Ontario: Stiney A.
Fisher.
Martin, H. M. (1911). An Apple Orchard Survey of Ontario County. Ithaca, NY:
Published by the University.
Ontario Department of Agriculture and Food. (1971). Ontario Apples.
Ontario Department of Agriculture. (1964). Ontario Apples.

67
Volk, G. M., Chao, C. T., Norelli, J., Brown, S. K., Fazio, G., Peace, C., McFerson, J.,
Zhong, G.Y., & Bretting, P. (2015). The vulnerability of US apple (Malus) genetic
resources. Genetic Resources and Crop Evolution, 62(5), 765-794.

68
Appendix 2 DNA Extraction Protocol: Incubate Buffer PE at 65 degrees Celsius within a water bath. Homogenization: -Take 15-20 mg of dried leaf material and insert into labeled fastprep tubes. -Insert one ceramic bead into each tube. -Load tubes into fastprep machine. -Run for 30 seconds at speed 4.0. Cell lysis: -Open tubes and add 400 µl Buffer PL1 to each and vortex. -Add 10 µl RNase A to each tube. -Add 20 µl Proteinase K to each tube. -Incubate tubes for 60 minutes at 65 degrees Celsius within water bath. Filtration: -Place violet-ringed Nucleospin filters into 2 mL collection tubes. -Load lysate into filters. -Centrifuge for 2 minutes at 11000 g -If pellet is visible on flowthrough, transfer supernatant to a new 1.5 mL microcentrifuge tube DNA binding conditions: -Add 450 µl Buffer PC and pipette up and down with mixture 3-5 times Bind DNA: -Place green-ringed nucleospin Plant II columns onto new 2 mL collection tubes. -Load a max of 700 µl of the sample onto it. -Centrifuge for 1 minute at 11000 g and discard flowthrough. Wash and Dry Stage: -Add 400 µl Buffer PW1 to the green filter. -Centrifuge for 1 minute at 11000 g and discard flowthrough. -Add 700 µl Buffer PW2 to the green filter. -Centrifuge for 1 minute at 11000 g and discard flowthrough. -Add 200 µl Buffer PW2 to the green filter. -Centrifuge for 2 minutes at 11000 g and discard flowthrough. DNA Elution: -Place green-ringed filters onto 1.5 mL microcentrifuge tubes. -Pipette 50 µl Buffer PE (65 degrees Celsius) onto the membrane.

69
-Incubate the filter and tube for 5 minutes at 65 degrees Celsius. -Centrifuge for 1 minute at 11000 g.

70
Appendix 3 PCR Protocol: -Acquire a PCR microplate and microcentrifuge tube. -Add 572 µl Qiagen Multiplex PCR Master Mix, 114.4 µl Multiplexed primer mix, and 353.6 µl water. Mix.3 -Take 10 µl of new master mix solution and add to each well on PCR microplate. -Add 1 µl of diluted DNA (10 ng/µl) to each reaction well. -Seal reaction plate with foil and press down with roller. -Insert into PCR thermocycler. -Run with the following settings: Control method: calculated
1. 94.0 for 15:00 min 2. 60-55 (down 1 degree per cycle) for 1:30 min 3. Go to 2, 4 times 4. 94 for 30 sec 5. 55 for 1:30 min 6. 72 for 1:00 min 7. Go to 4, 34 times 8. 72.0 for 15:00 min 9. 10.0 for hold 10. end