the optimum dietary amino acid pattern for growing pigs · british journal of nutrition (1989), 62,...
TRANSCRIPT
British Journal of Nutrition (1989), 62, 17-89 77
The optimum dietary amino acid pattern for growing pigs 1. Experiments by amino acid deletion
BY T. C. WANG A N D M. F. F U L L E R Rowett Research Institute, Bucksburn, Aberdeen AB2 9SB
(Received 16 August 1988 ~ Accepted 20 January 1989)
A series of four nitrogen-balance experiments was carried out with growing pigs to determine the optimum balance amongst the amino acids in the diet. The reduction in N retention when 20% of a single amino acid was removed from the diet was used to calculate a dietary amino acid pattern in which each amino acid would he equally limiting. A mixture of amino acids simulating the amino acid pattern of casein was used with the same efficiency as casein. From two successive deletion experiments an optimum balance amongst the essential amino acids was derived. Expressed relative to lysine = 100 this had threonine 72, valine 75, methionine + cystine 63, isoleucine 60, leucine 110, phenylalanine + tryosine 120, tryptophan 18. No estimate was made for histidine. Essential amino acids in this pattern were mixed with non-essential amino acids in ratios of 36:64 up to 57:43. The highest efficiency of N retention was achieved with diets having a ratio of a t least 45:55. This included (g/16 g N) lysine 6.5, threonine 4.7, valine 4.9, methionine + cystine 4.1, isoleucine 3.9, leucine 7.2, phenylalanine + tyrosine 7.8, tryptophan 12. The N of diets with this amino acid pattern was utilized significantly better than when the pattern proposed by the Agricultural Research Council (1981) was used. The flow of amino acids past the terminal ileum of pigs given the semi-synthetic diet with this amino acid pattern was no greater than that observed with protein-free diets. The proposed pattern thus describes the intrinsic requirements of the growing pig for absorbed amino acids.
Amino acids: Protein quality: Pig.
The quality of dietary protein is determined by its content of amino acids, and by their digestibility and availability. Quality can be considered as the degree to which the composition of the absorbed amino acid mixture accords with the balance required by the animal.
An optimum (or ideal) amino acid pattern is needed as a standard profile or reference protein when evaluating the quality of other dietary proteins. Since the nitrogen of essential amino acids can also be used in the synthesis of non-essential amino acids, a protein with essential amino acids in surplus relative to the non-essential amino acids may still support maximum N retention (NR). A more restricted definition of an ideal protein is one which includes the minimum quantity of each essential amino acid compatible with maximum utilization of the protein as a whole.
The question of the dietary amino acid pattern required by growing pigs has been reviewed in the past few years (Cole, 1978; Fuller, 1978; Cole et al. 1980; Henry, 1980; Low, 1980; Agricultural Research Council, 1981 ; Fuller & Chamberlain, 1982; Wiesemuller, 1983; Yen et al. 1986). The experiments described here were designed to answer the question ‘what is the optimum dietary amino acid balance for growing pigs?’. The optimum dietary amino acid profile is considered to be that which, for a given N intake (NI), results in the highest NR.
The method used is an extension of that published by Bender (1965) with rats. It is based on the concept that the removal of a non-limiting amino acid has no effect on NR. The changes in NR on removing a proportion of each amino acid in turn were used to calculate a dietary amino acid pattern in which all the amino acids were equally limiting.
Dow
nloaded from https://w
ww
.cambridge.org/core . IP address: 54.39.106.173 , on 22 Jan 2020 at 02:28:50 , subject to the Cam
bridge Core terms of use, available at https://w
ww
.cambridge.org/core/term
s . https://doi.org/10.1079/BJN19890009

78 T. C. W A N G A N D M. F. FULLER
Table 1. Expt 1. Composition ( g l k g ) of diets
Diet ... (1) (2) (3) (4) ( 5 ) Low-casein High-casein Low-casein Low-casein
(low-control) (high-control) + AA + EAA Protein-free
~ Amino acid (AA) - 28.59* 13.53t -
Casein 128.65 160.82 128.65 128.65 -
Maize starch 280.00 265.00 265.06 274.12 300.00 Glucose 297.65 280.48 284.00 29000 300.00 Sucrose 137.00 137.00 137.00 137.00 150~00 Cellulose 60.00 60.00 6000 6000 60.00 Vegetable oil 40.00 40.00 40.00 40.00 40.00 Mineral-vitamin 56.70 56.70 56.70 56.70 56.70
mixture
premix1 Nitrogen (g/kg) 17.60 22.00 20.98 19.21 0.2 1 DE (MJ/kg) 14.10 14.09 14.09 14.09 12.75
-~ . . . .. ~ . . . ~ ~ . ~ _ _ _ _ _ ~ ~
EAA, essential amino acids; AA, amino acids; DE, digestible energy. * Containing (g): aspartate 2.3 19, threonine 1.076, serine 1.469, glutamate 5.637, proline 3.174, glycine 0-492,
alanine 0.754, valine 1,458, cystine 0,130, methionine 0.591, isoleucine 1.183, Ieucine 2.349, tyrosine 1-485, phenyialanine 1.351, lysine 2-527, histidine, 1.029, arginine 1.2 14, tryptophan 0358.
t As for *, but omitting aspartate, serine, glutamate, proline, glycine, alanine and arginine. 1 Supplying (per tonne) : retinol 1.5 g, cholecalciferol 25 mg, a-tocopherol acetate 5 g, phytylmenenaquinone
1 g, thiamin 2 g, riboflavin 3.4 g, nicotinic acid 19 g, pyridoxine 2.73 g, vitamin B,, 21 mg, choline chloride 1150 g, pantothenic acid 12 g, biotin 50 mg, folk acid 2 g, ascorbic acid 12 g, salt 3.5 kg, dicalcium phosphate 40 kg, potassium bicarbonate 7 kg, iron 80 g, zinc 100 g, manganese 40 g, magnesium 420 g, copper 150 g, iodine 2 g, cobalt 0.5 g, selenium 0.15 g.
MATERIALS A N D METHODS
There were four N balance trials for which, except where otherwise indicated, the experimental procedure was the same. In Expt 5 the digestibilities of amino acids in the experimental diet were estimated.
Animals In Expts I , 2 ,3 and 4, the number of gilts used was eighteen, twenty-four, twenty and twenty respectively. Their starting weights were 25-30 kg and their finishing weights 45-50 kg. All were Large White x (Landrace x Large White) from the Rowett Institute herd.
Housing and cages At 7 d before the first urine collection the pigs were moved into metabolism cages to adjust to their new environment. The room temperature was controlled at 22-24'. Water was supplied ad lib. through nipple drinkers.
Experimental diets Expt 1. Of the N in casein 20% was replaced by synthetic amino acids in the same proportions as in casein to confirm that the free amino acids used in this way gave a similar rate of NR to intact protein. The diets used in Expt 1 are shown in Table I . At the end of the measurement period all animals were fed on a protein-free diet for 11 d (4 d adjustment and 7 d collection of urine and faeces) to measure the obligatory N losses.
Expt 2. Casein protein was used to provide the control amino acid pattern. The diets supplied 1.4 g N/kg body-weight (BW)"" per d in the high-control diet (treatment 1 ) and 1.05 g N/kg BW" 75 per d in the low-control diet (treatment 12). To provide diets in which
Dow
nloaded from https://w
ww
.cambridge.org/core . IP address: 54.39.106.173 , on 22 Jan 2020 at 02:28:50 , subject to the Cam
bridge Core terms of use, available at https://w
ww
.cambridge.org/core/term
s . https://doi.org/10.1079/BJN19890009

IDEAL PROTEIN FOR GROWING PIGS 79
Table 2. Expt 2. Composition (g lkg) of diets*
Diet.. . (1) High-
control
(2)
Threonine
(3)
Valine
Amino acid mixture Casein Maize starch Glucose Sucrose Cellulose Vegetable oil Mineral-vitamin
Nitrogen (g/kg) premix?
DE (MJ/kg)
0 110.91 297.39 300.00 130.00 65.00 40.00 56.70
15.17 14.1 1
26.61 83.18
298.51 300.00 130.00 65.00 40.00 56.70
14.54 14.1 1
Amino acid mixture Casein Maize starch Glucose Sucrose Cellulose Vegetable oil Mineral-vitamin premix?
N (g/kg) DE (MJ/kg)
Phenylalanine + tyrosine
41.52 66.55
300.23 300.00 130.00 65.00 40.00 56.70
14.18 14.11
Lysine 27.53 83.18
297.59 300.00 130.00 65.00 40.00 56.70
14.48 14.1 1
26.68 83.18
29844 300.00 130.00 65.00 40.00 56.70
14.55 14.1 1
(9)
Histidine 27.38 83.18
297.74 300.00 130.00 65.00 40.00 56.70
14.51 14.1 1
(4) Methionine t
cystine
26.42 83.18
298.70 300.00 130.00 65.00 40.00 56.70
14.54 14.1 1
(10)
Tryptophan 26.59 83.18
298.53 300.00 I30.00 65.00 4000 56.70
14.54 14.1 1
( 5 )
Isoleucine
(6)
Leucine
26.52 83.18
298.60 30000 130.00 65.00 40.00 56.70
1454 14.1 1
(1 1) Non-
essential amino acids
11.74 83.18
3 13.38 300.00 13000 65.00 40.00 56.70
12.90 14.13
26.21 83.18
298.91 300.00 130.00 65.00 40.00 56.70
14.52 14. I 1
(12)
Low- control
0 83.18
325.12 30000 130.00 65.00 40.00 56.70
11.50 14.14
DE, digestible energy. * Diet (l), high-control, casein-protein only; diet (12), low-control, casein-protein only; diets (2t(10), the
amino acid omitted from the level of amino acids of the high-control pattern to the low-control pattern level (22% of that in high-control); diet (7), omitting 36% of the tyrosine and phenylalanine from the high-control pattern; diet (1 l), omitting all non-essential amino acids from the supplement.
t For details, see Table 1.
each essential amino acid was reduced from the high-control to the low-control level, diets 2-10 were made by adding to the low-control diet a mixture of synthetic amino acids including all but one of the essential amino acids, together with aspartate, glutamate and alanine, each supplying one-third of the N needed to restore the total N to the concentration in the high-control diet. In treatment 1 1 these non-essential amino acids were omitted. Because casein protein is high in phenylalanine and tyrosine relative to other amino acids, according to preliminary estimation of an optimal balance (Agricultural Research Council, 1981), 36% of these amino acids were omitted to form treatment 7. The compositions of the diets used in Expt 2 are given in Table 2. From the results the quantity of each amino acid that could be removed without effect on N retention was calculated. These estimates were used to formulate a pattern closer to the ideal than that of casein. For this purpose the simple linear model shown in Fig. 1 was used. In this model it is assumed that (1) removal of the first limiting amino acid (as A in Fig. 1) would reduce NR to the greatest extent; (2) if removal of an amino acid did not reduce NR at all (as C in Fig. l), then the quantity removed was in excess relative to the first limiting amino acid; (3) if removal of
Dow
nloaded from https://w
ww
.cambridge.org/core . IP address: 54.39.106.173 , on 22 Jan 2020 at 02:28:50 , subject to the Cam
bridge Core terms of use, available at https://w
ww
.cambridge.org/core/term
s . https://doi.org/10.1079/BJN19890009

80 T. C. W A N G A N D M. F. F U L L E R
I I 1 I
80 90 100
Amino acid intake (% of control)
Fig. 1. Principle of the method of determining amino acid requirements by deduction. A is the first limiting amino acid; B and C are amino acids which are respectively 10 and > 20% in excess relative to A.
an amino acid resulted in a reduction in NR intermediate between 1 and 2 (as B in Fig. 1) then the proportion that could have been removed without reducing NR could be interpolated proportionately.
The resulting estimates were used to form a provisional 'ideal' pattern. Because the quantity of some amino acids removed from the control pattern in Expt 2 did not affect NR, it was not possible to calculate from the results a pattern of equally limiting amino acids. Thus the provisional ideal pattern was tested in the third experiment.
Expt 3. In this experiment another 20% of each essential amino acid was removed in turn from the new pattern. The compositions of the diets used in Expt 3 are given in Table 3. The results of the third experiment were again used to make a second estimate of the ideal amino acid pattern, i.e. in which each essential amino acid would be equally limiting. This new pattern was used as the basis of the fourth experiment.
Expt 4 . Four diets were formulated in which the essential amino acids were in the pattern derived from Expt 3 and in which the ratio of their sum: the sum of the non-essential amino acids was varied from 36: 64 to 57:43, corresponding to 5, 6, 7 and 8 g lysine/l6 g N. The pattern proposed as 'ideal protein' by the Agricultural Research Council (198 l), which contained 7 g lysinell6 g N, was also included in this experiment. All these diets supplied the same amount of N. The compositions of the diets in Expt 4 are given in Table 4.
Feeding The animals were given the diets at the rate of 93 g/kg BW"'75 per d in three equal meals each with 0.8 litres water. The feeding times were 08.30, 1230 and 17.30 hours. All pigs received their experimental diets for 7 d, made up of a 3 d preliminary period and 4 d of collection, except that the preliminary period before the collection of urine in the first period was 7 d.
Collections and measurement Before the first collection bladder catheters were introduced as described by Fuller et al. (1979). In each period urine was collected continuously into acid (250 ml 2 M-sulphuric
Dow
nloaded from https://w
ww
.cambridge.org/core . IP address: 54.39.106.173 , on 22 Jan 2020 at 02:28:50 , subject to the Cam
bridge Core terms of use, available at https://w
ww
.cambridge.org/core/term
s . https://doi.org/10.1079/BJN19890009

I D E A L PROTEIN FOR GROWING PIGS 81
Table 3 . Expt 3. Compositions (g lkg ) of diets
Diet ... (1) (2) (3) (4) (5) High- Methionine
control Threonine Valine + cystine Isoleucine
Amino acid 802 1 80.33 80.36 80.19 80.25
Casein 43.15 43.15 43.15 43.15 43.15 Maize starch 288.94 288.82 288.79 288.96 288.90 Glucose 295.00 295.00 295.00 295.00 295.00 Sucrose 136.00 136.00 136.00 136.00 136.00 Cellulose 6000 60.00 60.00 60.00 60.00 Vegetable oil 40.00 40.00 4000 40.00 40.00 Mineral-vitamin 56.70 5670 56.70 56.10 56.70
Nitrogen (g/kg) 14.52 14.52 14.52 14.52 14.52 DE (MJ/kg) 14.1 1 14.1 1 14.11 14.1 1 14.1 1
mixture*
premix?
Diet ... (6) (7) (8) (9) (10) Phenylalanine +
Leucine tyrosine Lysine Histidine Tryptophan Amino acid 80.29 80.0 1 8085 80.80 80.27
Casein 43.15 43.15 43.15 43.15 43.15 Maize starch 288.86 289.14 288.30 288.35 288.88 Glucose 295.00 295.00 295.00 295.00 295.00 Sucrose 136.00 136.00 136.00 136.00 13600 Cellulose 60.00 6000 60.00 60.00 60.00 Vegetable oil 4000 40.00 40.00 40.00 40.00 Mineral-vi tamin 56.70 56.70 56.70 56.70 56.70
N (g/kd 1452 14.52 14.52 14.52 14.52 DE (MJ/kg) 14.1 1 14.1 1 14.1 1 14.11 14.1 1
mixture*
premix?
* Diets (2)-(10) were formed by isonitrogenous replacement of amino acids by aspartate, glutamate and alanine
t For details, see Table 1. (see p. 79 for details).
Table 4 . Expt 4 . Composition (g lkg) of diets
Diet ... (1) (2) (3) (4) (5)* EAA:NEAA ... 36:64 43157 5O:SO 57143 40:60
Lysine (g/16 g N) ... 5.0 6.0 70 8.0 7.0
Amino acid mixture 63.17 Maize starch 292.96 Casein 56.17 Glucose 295.00 Sucrose 136.00 Cellulose 6000 Mineral-vitamin 56.70
Vegetable oil 40.00 Nitrogen (g/kg) 14.52 DE (MJ/kg) 14.11
premix?
46.77 298.13 67.40
295.00 136.00 60.00 56.70
40.00 14.52 14.11
30.37 303.30 78.63
295.00 136.00 60.00 56.70
40.00 14.52 14.1 1
13.97 308.46 89.86
295.00 136.00 60.00 56.70
40.00 14.52 14.1 1
52.27 296.95 63.08
295.00 I3600 60.00 56.70
40.00 14.52 14.1 1
EAA, essential amino acids ; NEAA, non-essential amino acids; DE, digestible energy. * Pattern proposed by the Agricultural Research Council (1981). t For details, see Table 1.
Dow
nloaded from https://w
ww
.cambridge.org/core . IP address: 54.39.106.173 , on 22 Jan 2020 at 02:28:50 , subject to the Cam
bridge Core terms of use, available at https://w
ww
.cambridge.org/core/term
s . https://doi.org/10.1079/BJN19890009

82 T. C. W A N G A N D M. F. F U L L E R
Table 5. Expt 5. Composition (g /kg ) of diet
Amino acid mixture* 43.83 Vegetable oil 40.00 Maize starch 298.90 Mineral-vitamin 56.70
Glucose 295.00 Nitrogen (g/kg) 14.52 Sucrose 136.00 DE (MJ/kg) 14.12 Cellulose 60.00
Casein 6957 premix?
... ~~~~
DE, digestible energy. * Containing (g): aspartic acid 15.17, threonine 1.63, monosodium glutamate 19.29, alanine 1.06, valine 048,
cystine 0.16, methionine 1.3 I , isoleucine 0.14, leucine 0.82, lysine hydrochloride 1.72, histidine 060, arginine 1.20, tryptophan 0.26.
t See Table 1 for details.
acid) for 48 h. The faeces were collected and preserved in acid in the last 10 d of each balance. Total N was analysed in the faeces and urine samples by the Kjeldahl method of Davidson et al. (1970). The amino acid composition of casein was measured by ion- exchange chromatography (Spackman et al. 1958). A sample of casein was first treated with performic acid to oxidize methionine and cystine to methionine sulphone and cysteic acid (Moore, 1963). Both this and an unoxidized sample were hydrolysed in 6 M-hydrochloric acid for 24 h. A sample of casein was hydrolysed in 4 M-lithium hydroxide for 4 h for tryptophan analysis (Lucas & Sotelo, 1980).
Design Expt I . Eighteen animals were formed into two blocks of nine on the basis of BW. Within each block four different treatments were tested in two periods, giving a total of nine observations with each treatment.
Expts 2 and 3. Two animals were given each treatment in three sequential periods, ensuring that no animal was on the same treatment twice. This gave a total of six observations per treatment.
Expt 4 . Twenty animals were used for two periods to test five different treatments. Four animals were allocated to each treatment ensuring that no animal was on the same treatment twice. This resulted in eight observations per treatment.
Expt 5. Eight gilts, weighing 45 kg, fitted with simple ‘T’ cannulas in the terminal ileum were used to measure the digestibility of amino acids. The diet was based on a mixture of synthetic amino acids added to casein to make the balanced amino acid pattern derived from the results of Expt 4. Measurements were also made on a protein-free diet (as in Table 1) and the values for daily amino acid flow were used to calculate the true digestibility of the amino acids in the test diet. Chromic oxide (3 g/kg) was used as an indigestible marker. The composition of the diet is given in Table 5. At 7 d after the animals were introduced to the diet, an 8 h collection of digesta was made. Samples were frozen and then freeze-dried for analysis.
Statistical analysis In each experiment, a regression analysis was made to determine the relation between NR and amino acid intake, using each set of amino acid values for animals with limiting intakes and those on the high-control diet, adjusting for the effects of animal, period and N intake. GENSTAT (Lawes Agricultural Trust, 1982) was used in all the statistical analyses.
Dow
nloaded from https://w
ww
.cambridge.org/core . IP address: 54.39.106.173 , on 22 Jan 2020 at 02:28:50 , subject to the Cam
bridge Core terms of use, available at https://w
ww
.cambridge.org/core/term
s . https://doi.org/10.1079/BJN19890009
IDEAL PROTEIN FOR G R O W I N G PIGS
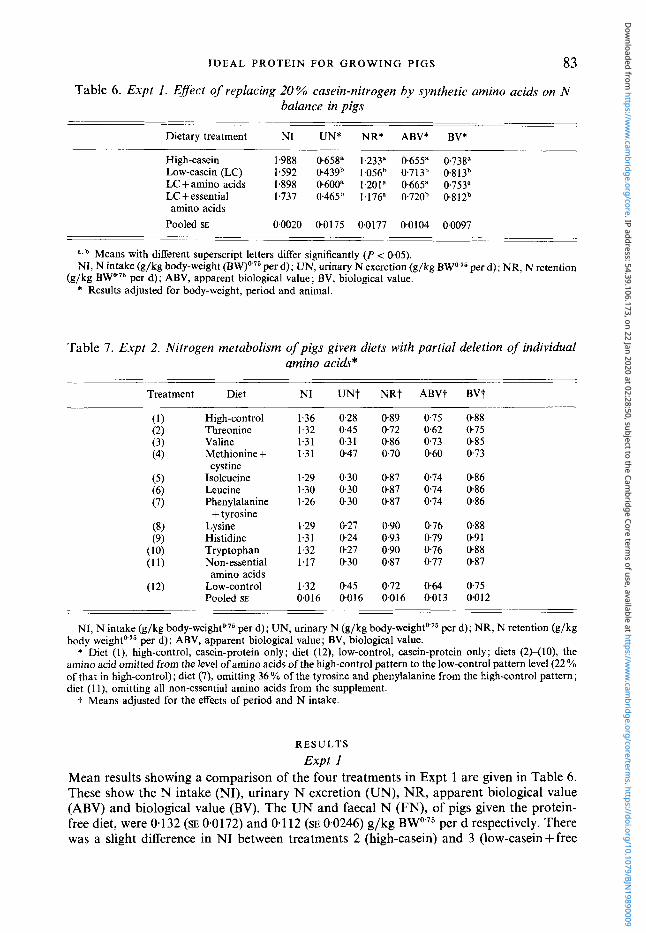
Table 6. Expt 1. Effect of replacing 20% casein-nitrogen by synthetic amino acids on N balance in pigs
83
Dietary treatment NI UN* NR* ABV* BV*
High-casein 1.988 0.658" 1.233" 0,655" 0738" Low-casein (LC) 1.592 0439b 1.056" 0713b 0.813" LCfamino acids 1,898 0600" 1.201" 0.665" 0753" LC +essential 1.737 0465b 1.176" 0.720b 0.812b
Pooled SE 00020 00175 0.0177 0.0104 0.0097 amino acids
____ ._
a , b Means with different superscript letters differ significantly (P < 0.05). NI, N intake (g/kg body-weight (BW)o" per d); UN, urinary N excretion (g/kg BWo 75 per d); NR, N retention
(g/kg BW07s per d); ABV, apparent biological value ; BV, biological value. * Results adjusted for body-weight, period and animal.
Table 7. Expt 2. Nitrogen metabolism of pigs given diets with partial deletion of individual amino acids*
Treatment Diet NI UNt NRt ABVt BVt
High-control 1.36 028 089 0.75 088 Threonine 1.32 0.45 0.72 0.62 075 Valine 1.31 0.31 0.86 073 085
1.31 0.47 0.70 060 073 Methionine + cystine
Isoleucine 1.29 030 0.87 0.74 086 1.30 0.30 0.87 074 086 Leucine
Phenylalanine 1.26 0.30 0,87 0.74 086
Lysine 1.29 0.27 0.90 0.76 0.88 1.31 0.24 0.93 0.79 0.91 Histidine
Tryptophan 1.32 0.27 0.90 0.76 088 Non-essential 1.17 0.30 087 0.77 087
(1) (2) (3) (4)
( 5 ) (6) (7)
(8) (9)
(10) (1 1)
(12)
+ tyrosine
amino acids Low-control 1.32 045 0.72 0.64 075 POOkd SE 0.016 0016 0.016 0.013 0012
NI, N intake (g/kg b o d y - ~ e i g h t o ~ ~ per d); UN, urinary N (g/kg b~dy-weighto'~ per d); NR, N retention (g/kg body
* Diet (l), high-control, casein-protein only; diet (12), low-control, casein-protein only; diets (2H10), the amino acid omitted from the level of amino acids of the high-control pattern to the low-control pattern level (22% of that in high-control); diet (7), omitting 36 YO of the tyrosine and phenylalanine from the high-control pattern; diet (1 l), omitting all non-essential amino acids from the supplement.
per d); ABV, apparent biological value; BV, biological value.
t Means adjusted for the effects of period and N intake.
R E S U L T S
Expt 1 Mean results showing a comparison of the four treatments in Expt 1 are given in Table 6 . These show the N intake (NI), urinary N excretion (UN), NR, apparent biological value (ABV) and biological value (BV). The UN and faecal N (FN), of pigs given the protein- free diet, were 0.132 (SE 0.0172) and 0 1 12 (SE 0.0246) g/kg BW075 per d respectively. There was a slight difference in NI between treatments 2 (high-casein) and 3 (low-casein +free
Dow
nloaded from https://w
ww
.cambridge.org/core . IP address: 54.39.106.173 , on 22 Jan 2020 at 02:28:50 , subject to the Cam
bridge Core terms of use, available at https://w
ww
.cambridge.org/core/term
s . https://doi.org/10.1079/BJN19890009

84
1.00
u 0.90
In r.
3 m cn cn c 0
c 0)
0.80 - ._ - E 0.70
T. C. W A N G A N D M. F. F U L L E R
-
-Trp
-
-
His
Phe - Met +'Cvs
+ Tvr
0.60 1 I I I 1 1 0 0.20 0.40 0.60 0.80 1 .oo
Amino acid intake (g/kg BWo 75 per d) Fig. 2. Expt 2. The effects on nitrogen retention of deleting 22 % (36 YO for phenylalanine (Phe) and tyrosine (Tyr)) of each essential amino acid. Trp, tryptophan; His, histidine; Met, methionine; Cys, cystine; Thr, threonine; Ile, isoleucine; Val, valine; Lys, lysine; Leu, leucine. BW, body-weight.
Table 8. Expt. 3. Nitrogen metabolism of pigs given diets with partial deletion of individual amino acids
~ ________ Treatment Diet NI UN* NR* ABV* BV*
High-control 1.42 0.51 0.81 0.61 0.73 Threonine 1.43 0.61 0.71 0.54 0.66
(3) Valine 1.43 0.56 0.75 0.57 0.69 (4) Methionine 1.43 0.60 071 0.54 067
( 5 ) Isoleucme 1.44 055 0.77 0.58 0.70 (6) Leucine 1.42 0.54 0.77 0.59 0.71 (7) Phenylalanine 1.44 0.66 0.67 0.50 0.63
(8) Lysine 1.42 059 072 055 067 (9) Histidine 1.43 032 0.80 0.61 0.72
(10) Tryptophan 1.43 0.59 0.73 0.55 0.67
__ _ _ -
(1) (2)
+cystine
+ tyrosine
Pooled SE 0.006 0.017 0016 0012 0.011
NI, N intake (g/kg body-weight" 7 5 per d), UN, urinary N (g/kg body-weight0'5 per d); NR, N retention (g/kg
* Means adjusted for the effects of period and N intake. body-weight' 75 per d); ABV, apparent biological value; BV, biological value.
amino acids); the lower NR in treatment 3 compared with treatment 2 was due to the low NI. NR was expressed as a proportion of the absorbed N (ABV) or, with correction for UN and FN losses on the protein-free diet, as BV. Expressed in these terms, the results demonstrated that the synthetic amino acid mixture with the amino acid composition of casein could replace casein protein without significant difference in N utilization.
Expt 2 The mean value of FN excretion was 0-105 (SE 0.0022) g N/kg BW0-75 per d. As there were no significant differences between treatments in FN excretion, this value was used for the
Dow
nloaded from https://w
ww
.cambridge.org/core . IP address: 54.39.106.173 , on 22 Jan 2020 at 02:28:50 , subject to the Cam
bridge Core terms of use, available at https://w
ww
.cambridge.org/core/term
s . https://doi.org/10.1079/BJN19890009

I D E A L PROTEIN FOR GROWING PIGS 85
I Thr
I Phe + Tvr
0.65 I I 1 1
0 0.20 0.40 0.60
Amino acid intake (g/kg BW0'75 per d )
Fig. 3. Expt 3. The effects on nitrogen retention of deleting 20 YO of each essential amino acid. Trp, tryptophan; His, histidine; Met, methionine; Cys, cystine; Thr, threonine; Ile, isoleucine; Val, valine; Lys, lysine; Leu, leucine. BW, body-weight.
calculation of NR, BV and ABV. The results for each treatment are shown in Table 7. The responses to the deduction of individual amino acids were expressed in terms of NR. Fig. 2 shows these responses to reductions in the daily amino acid intake. Only the omissions of methionine +cystine and threonine gave significantly (P < 0.001) lower NR than the high-control treatment. In the other treatments NR was either unchanged or improved in response to the deduction of essential amino acids. The simple linear model shown in Fig. 1 was used to calculate the proportion of each essential amino acid which was surplus to an ideally balanced pattern.
Expt 3 The mean value of FN excretion was 0 1 15 (SE 0.0202) g N/kg BW0'75 per d. The values of NR, ABV and BV for each treatment are shown in Table 8. The responses of NR to daily amino acid intake are shown in Fig. 3. For each essential amino acid except histidine, a 20 % deduction was sufficient to make it in turn the first limiting amino acid in the diet. It was, therefore, possible to calculate a pattern in which each essential amino acid would be equally limiting. Expressed relative to lysine = 100 this had threonine 72, valine 75, methionine + cystine 63, isoleucine 60, leucine 1 10, phenylalanine + tyrosine 120, tryptophan 18. No estimate was made for histidine.
Expt 4 The mean value of FN excretion was 0.086 (SE 0.0151) g N/kg BW0'75 per d. The values for NR, ABV and BV for each treatment are shown in Table 9. The responses of NR to the ratio, essential : non-essential amino acids (and to daily lysine intake) are shown in Fig. 4. Maximum NR was achieved when the ratio, essential : non-essential amino acids was 50: 50 or 57 : 43, with lysine at 7 or 8 g/ 16 g N, and these treatments gave a significantly (P < 0.05) higher rate of NR than the 'ideal protein ' pattern recommended by the Agricultural Research Council (1981). A broken line model was fitted to these values and from this the optimal ratio, essential : non-essential amino acids was estimated to be 45 : 55.
Dow
nloaded from https://w
ww
.cambridge.org/core . IP address: 54.39.106.173 , on 22 Jan 2020 at 02:28:50 , subject to the Cam
bridge Core terms of use, available at https://w
ww
.cambridge.org/core/term
s . https://doi.org/10.1079/BJN19890009

86 T. C. W A N G AND M. F. FULLER
Table 9. Expt 4 . Nitrogen nzetabolism of pigs given dieu with various ratios of essential: non- essential amino acids ( E A A NEAA). The pattern of amino acids proposed by the Agricultural Research Council (1981) is also given (diet 5 ) ~~ _ _ _ _ _ ~
Lysine Diet EAA:NEAA (g/I6gN) N1 UN* NR* ABV* BV*
(1) 36:64 5.0 1.31 0.34 0.88 072 0.84 (2) 43 : 57 6.0 1.30 025 096 0.79 090 (3) 50:50 7.0 1.30 0.21 1.00 0.83 0.93 (4) 51:43 8.0 1.31 0.23 0.99 0.81 0.92 (5) 45:55 7.0 1.30 0.26 0.95 0.78 089 Pooled SE 0.004 0.015 0.014 0012 0,011
- -~ -
NI, N intake (g/kg body-weight"' per d); UN, urinary N (g/kg body-~eighto'~ per d); NR, N retention (g/kg
* Means adjusted for the effects of period and N intake. body-weighto7' per d); ABV, apparent biological value ; BV, biological value.
0.80 \ I I I 0.40 0.50 0.60 0.70
Lysine intake (g/kg BW0'75 per d)
Fig. 4. The effects of varying the ratio; essential amino acids (EAA): non-essential amino acids (NEAA). The EAA were in the proportion deduced from the results of Expt 3 (see p. 85). The ratio, EAA:NEAA was (m), 36:64; (m), 43:57; (A), 50:50, (+), 57:43. The amino acid pattern proposed by the Agricultural Research Council (1981) was also included (A). All diets supplied 1.3 g N/kg body-weight (BW)07s per d.
Expt 5 The results are shown in Table 10. There were no significant differences in daily amino acid flow between the animals fed on the protein-free and those fed on the test diet suggesting that the amino acids in these semi-synthetic diets were absorbed completely before the terminal ileum.
DISCUSSION
Amino acids surplus to the animal's requirement are degraded and their N is excreted. When dietary energy is limiting, amino acids are oxidized and used as an energy source. In
Dow
nloaded from https://w
ww
.cambridge.org/core . IP address: 54.39.106.173 , on 22 Jan 2020 at 02:28:50 , subject to the Cam
bridge Core terms of use, available at https://w
ww
.cambridge.org/core/term
s . https://doi.org/10.1079/BJN19890009

I D E A L P R O T E I N FOR G R O W I N G P I G S 87
Table 10. Expt 5. Amino acid digestibility and daily amino acidflow at the terminaI ileum in pigs given the semi-synthetic diet
___ Amino acid flow (g/d)
Semi-synthetic Protein-free Digestibility
Amino acid Apparent True diet diet
Threonine 0850 1.018 1.41 1.41 Valine 0886 1.022 092 073 Isoleucine 0.878 0,988 0.74 0.45 Leucine 0.920 1.090 0.98 1.00 Tyrosine 0.91 1 1,077 0.57 0.56 Phenylalanine 0910 1.088 054 0.58 Histidine 0.88 1 1.094 0.49 0.66 Lysine 0.939 1,101 0.63 0.6 1
Methionine 0.968 1.116 0.20 0.18
SED 00385 00514
Arginine 0846 1.089 053 073
Cystine 0.390 0.593 0.44 0.55
SED, standard error of difference.
the present experiments non-protein energy was supplied generously to prevent energy being a limiting factor for protein accretion.
In Expts 2 and 3 the changes in NR when dietary essential amino acids were deducted from the control pattern were used to calculate the optimum balance between the essential amino acids. The optimum pattern calculated includes the amino acids required to meet the obligatory N losses. There is in any case some doubt as to the correctness of subtracting the obligatory N losses in these calculations. Obligatory N losses were measured as the N output of animals given a protein-free diet. As protein is essential for both growth and maintenance, 'NR is affected not only by the quality of the dietary protein, but also by the level of protein intake. Although all animals had approximately the same daily NI, it was not possible to ensure that every animal had exactly the same amount of N. First, although the feeding scale was based on body-weight, the animals were not weighed daily during the experiments, and their mean weights were somewhat different. Second, the animals did not always eat all the food they were offered. There were, therefore, some small differences in NI between animals. The results were accordingly adjusted for differences in NI by regression analysis.
The amino acids in the diets were mainly from casein, which is highly digestible by pigs of this body-weight (Kies et al. 1986). In all treatments, apart from those with amino acid deletions, all other dietary conditions (e.g. dietary energy and fibre) were the same. As the period used for urine collection was not long enough for faeces collection (because of the error arising from the variable retention time in the gut of the small quantity of faeces with these diets) faeces were collected for the last 10 d of each balance, and a mean value of FN for all pigs was used in the calculations.
Synthetic amino acids were used to vary the amino acid composition of the experimental diets. The efficiency of utilization of free amino acids by the animal can be affected by the frequency of feeding. Lysine was the first free amino acid to be examined in this context (Walz, 1972; Batterham, 1979). Compared with protein-bound amino acids, free amino acids pass more rapidly through the stomach and are absorbed in the small intestine (Rolls et al. 1972; Buraczewska et al. 1978). Protein synthesis requires that all necessary amino acids are available to the tissues at the same time. Batterham (1979) suggested that the use
Dow
nloaded from https://w
ww
.cambridge.org/core . IP address: 54.39.106.173 , on 22 Jan 2020 at 02:28:50 , subject to the Cam
bridge Core terms of use, available at https://w
ww
.cambridge.org/core/term
s . https://doi.org/10.1079/BJN19890009
88 T. C . W A N G A N D M. F. F U L L E R
of free amino acids in a conventional diet to estimate amino acid requirements could lead to an overestimate especially when animals were fed only once daily. The efficiency of utilization of the free lysine could be improved by increasing the frequency of feeding (Batterham, 1974, 1979; Batterham & O’Neill, 1978 ; Buraczewska & Buraczewski, 1980). However, the errors arising from the use of free amino acids in these experiments are thought to be small because (1) compared with other protein sources, casein is one of the most fully and rapidly digested (Kies et al. 1986); ( 2 ) not only one, but almost all the essential amino acids were u s e d h each experimental diet so that a balanced mixture was being supplied; (3) instead of feeding the animals once daily, the animals were fed three times daily. M. F. Fuller, H. S. Willcox and A. Cadenhead (unpublished results) used intragastric infusion to study the efficiency of replacing casein with its constituent amino acids and showed that the two diets were equally utilized when NR per unit N apparently absorbed was used as the criterion of response.
As shown in Fig. 2, there were improvements in NR when certain essential amino acids were removed from the amino acid mixture in the casein protein pattern, suggesting that imbalances between essential amino acids depressed NR ; even with casein protein the imbalance between the essential amino acids was sufficient to depress NR. These results suggest that the use of only the first limiting amino acid (as in chemical score) does not describe accurately enough dietary protein quality. The amino acids which, when removed from the casein protein pattern, improved NR were tryptophan, lysine, and phenylalanine + tyrosine. The deduction of isoleucine, leucine or valine had little effect. The lowest NR in response to deduction was with methionine +cystine, suggesting that this pair of amino acids was first limiting in casein protein, whilst the second limiting amino acid was threonine.
In the second experiment, deduction of histidine improved NR; in the third experiment there was still no significant response in NR to a further 20% deduction in histidine. Whether this means that the histidine requirement is even lower, or that there is a bigger body reserve of histidine than of other amino acids, is not clear.
As shown in Fig. 3, all deductions, except for histidine, were sufficient to make the amino acid deducted first limiting. When calculated in relation to the first limiting amino acid (phenylalanine + tyrosine) in the control pattern the calculated optimum balance amongst the essential amino acids was, relative to lysine = 100, methionine +cystine 63, threonine 72, tryptophan 18, valine 75, isoleucine 60, leucine 110, phenylalaninef tyrosine 120.
The surpluses of some essential amino acids relative to the ideally balanced pattern were used as sources of N for non-essential amino acids. The results of Expt 4 (Fig. 4) clearly show this. Based on these results the optimum ratio, essential : non-essential amino acids was at least 45 : 55, and the optimum balance of amino acids (g/16 g N) was thus lysine 6.5, methionine + cystine 4.1, threonine 4.7, tryptophan 1.2, valine 4.9, isoleucine 3.9, leucine 7.2, phenylalanine + tyrosine 7.8.
The dietary ideal protein determined in these experiments is based on the assumption that casein and the synthetic animo acids used are completely absorbed in the small intestine, and thus describes the intrinsic needs of the pig. To use the results as a reference pattern in evaluating the quality of dietary proteins, and for practical diet formulation, amino acid digestibility (measured at the terminal ileum) must also be considered. The pattern describes the total requirements of the pig, that is, its requirements for both maintenance and tissue accretion.
The authors gratefully acknowledge the financial contribution of Eurolysine SA.
Dow
nloaded from https://w
ww
.cambridge.org/core . IP address: 54.39.106.173 , on 22 Jan 2020 at 02:28:50 , subject to the Cam
bridge Core terms of use, available at https://w
ww
.cambridge.org/core/term
s . https://doi.org/10.1079/BJN19890009

I D E A L P R O T E I N FOR G R O W I N G P I G S 89
REFERENCES Agricultural Research Council (1981). The Nutrient Requirement of Pigs. Slough: Commonwealth Agricultural
Bureaux. Batterham, E. S. (1974). The effect of frequency of feeding on the utilization of free lysine by growing pigs. British
Journal of Nutrition 31, 237-242. Batterham, E. S. (1979). Amino acid availability in pig diets with special reference to natural proteins and
synthetic amino acids. In Recent Advances in Animal Nutrition - 1979, pp. 11-22 [w. Haresign and D. Lewis, editors]. London: Buttenvorths.
Batterham, E. S. & O’Neill, G. H. (1978). The effect of frequency of feeding on the response by growing pigs to supplements of free lysine. British Journal of Nutrition 39, 265-270.
Bender, A. E. (1965). The balancing of amino acid mixtures and proteins. Proceedings of the Nutrition Society 24, 190-197.
Buraczewska, L. & Burdczewski, S . (1980). Protein utilization of diets supplemented with free lysine or protein concentrate in pigs fed one or four meals daily. In Protein Metabolism and Nutrition, pp. 307-31 1 [H. J. Oslage and K. Rohr, editors]. EAAP Publication no. 27.
Burdczewska, L., Zebrowska, T. & Buraczewski, S. (1978). The rate of passage of synthetic lysine and dietary protein from the stomach to the intestine in pigs. Roczniki Nauk Rolniczych Series B, 99, 107-1 12.
Cole, D. J. A. (1978). Amino acid nutrition of the pig. In Recent Advances in Animal Nutrition - 1978, pp. 59-72 [W. Haresign and D. Lewis, editors]. London: Buttenvorths.
Cole, D. J. A., Yen, H. T. & Lewis, D. (1980). The lysine requirements of growing and finishing pigs -the concept of an ideal protein. In Protein Metabolism and Nutrition, pp. 658-668 [H. J. Oslage and K. Rohr, editors]. EAAP Publication no. 27.
Davidson, J., Mathieson, J. & Boyne, A. W. (1970). The use of automation in determining nitrogen by the Kjeldahl method, with final calculation by computer. Analyst 95, 181-193.
Fuller, M. F. (1978). Amino acids in the nutrition of the pig. Rowett Research Annual Report 34, 116-128. Fuller, M. F. & Chamberlain, A. G . (1982). Protein requirement of pigs. In Recent Advances in Animal Nutrition - 1982, pp. 175-186 [W. Haresign, editor]. London: Butterworths.
Fuller, M. F., Livingstone, R. M., Baird, B. A. & Atkinson, T. (1979). The optimal amino acid supplementation of barley for the growing pig. 1. Response of nitrogen metabolism to progressive supplementation. British Journal of Nutrition 41, 321-331.
Henry, Y. (1980). Protein and amino acid requirements of growing pigs. In Protein Metabolism and Nutrition, pp. 634-655 [H. J. Oslage and K. Rohr, editors]. EAAP Publication no. 27.
Kies, A. K., Moughan, P. J . & Smith, W. C. (1986). The apparent and true ileal digestibility ofnitrogen and amino acids in lactic casein for the growing pig. Animal Feed Science and Technology 16, 169-178.
Lawes Agricultural Trust (1982). Genstat V , Mark 4.04. Harpenden, Hertfordshire : Rothamsted Experimental Station.
Low, A. G. (1980). Amino acid use by growing pigs. In Recent Developments in Animal Nutrition - 1980, pp. 141-156 [W. Haresign, editor]. London: Butterworths.
Lucas, B. & Sotelo, A. (1980). Effect of different alkalies, temperature and hydrolysis times on tryptophan determination in pure protein and foods. Analytical Biochemistry 109, 192-197.
Moore, S. (1963). On the determination of cystine as cysteic acid. Journal of Biological Chemisrry 238, 235-237. Rolls, B. A,, Porter, J. W. G. & Westergarth, D. R. (1972). The course of digestion of different food proteins in
the rat. 3. The absorption of proteins given alone and with supplements of their limiting amino acids. British Journal of Nutrition 28, 283-293.
Spackman, D. H., Stein, W. H. & Moore, S. (1958). Automatic recording apparatus for use in the chromatography of amino acids. Analytical Chemistry 30, 1190-1206.
Walz, 0. P. (1972). Die Wirkung kombinierter Lysin-Methionin-Zulagen und der Einfluss des Zeitpunktes ihrer Verabreichung auf die biologische Wertigkeit von Haferrationen beim Schwein. Zeitschrqt .fur Tierphysiologie, Tierernuhrung und Futtermittelkunde 30, 143-144.
Wiesemuller, W. (1983). Physiological basis of the protein requirements of pigs. Critical analysis of allowances. In Protein Metabolism and Nutrition, pp. 405431 [M. Arnal, R. Pion and D. Bonin, editors]. EAAP Publication no. 31. Paris: INRA.
Yen, H. T., Cole, D. J. A. & Lewis, D. (1986). Amino acid requirements of growing pigs. 7. The response of pigs from 25 to 55 kg live weight to dietary ideal protein. Animal Production 43, 141-154.
Printed in Great Britain
Dow
nloaded from https://w
ww
.cambridge.org/core . IP address: 54.39.106.173 , on 22 Jan 2020 at 02:28:50 , subject to the Cam
bridge Core terms of use, available at https://w
ww
.cambridge.org/core/term
s . https://doi.org/10.1079/BJN19890009