the opportunity for sicin electric vehicles
TRANSCRIPT

The opportunity for SiC in electric vehiclesPrepared for PowerAmerica Annual Meeting
February 2021

About Exawatt
2
Strategic consulting and market analysis in industries that support decarbonization through electrification

Typical Exawatt customer projects
3
Custom projects:
Capacity expansion analysis for global mining company in PV/semiconductor industries
Cell manufacturing strategy for global PV manufacturer
Semiconductor material market strategy for emerging manufacturer
Long-term materials cost forecast for solid-state battery manufacturer
SiC market forecasting and monitoring for EV manufacturer
Quarterly/annual research examples:
PV module, EV, SiC device, battery market tracking and forecasting
PV, EV, SiC, battery BOM cost forecasting

Exawatt activity in SiC
4
Exawatt has applied its PV research methodologies to the global SiC power electronics market, beginning with applications in EVs
Models include:• SiC crystal growth cost • SiC die cost• SiC device cost and
performance tracker (MOSFET and Schottky diode)
• SiC device and wafer demand analysis and forecasts for EV and PV markets
• EV core technology analysis (inverter, DC-DC converter, on-board charger, charging station) and demand forecasts
• Global EV sales tracking and forecastingSource: GT Advanced Technologies

Exawatt research partnerships: ESCAPE project
5
Exawatt is part of the UK-based ESCAPE project (End-to-end Supply Chain development for Automotive Power Electronics). The project started in October 2019Focus is on developing a supply chain for silicon carbide in automotive applications
Source: McLaren Applied

The BEV revolution is gathering momentum
6
We believe BEVs – not hybrids – will dominate the vehicle market by 2030
This presents a huge opportunity for SiC
0.0%0.1%
0.2%0.3%
0.4%0.5%
0.6%
0.7%0.8%
0.9%1.0%
2015 Q4 2016 Q4 2017 Q4 2018 Q4 2019 Q4 2020 Q4
BEV household share
US
Europe
Source: Exawatt

What will the BEV adoption curve look like?
7
0%
10%
20%
30%
40%
50%
60%
70%
80%
90%
100%
1890 1900 1910 1920 1930 1940 1950 1960 1970 1980 1990 2000 2010 2020
Adoption of technology in the US (1900-2015)Telephone
Electricity
Cars
Radio
Fridge
TV
Air travel
Colour TV
Credit card
Microwave
Video games
PC
Cell phone
Internet
Digital camera
MP3 player
HDTV
Social media
Smartphone
Tablet
Source: Exawatt, adapted from Blackrock Investment Institute. Adoption rates are based on household ownership, except for cell phone and smart phones, which are based on ownership per capita

What will the BEV adoption curve look like?
8
Source: Exawatt, adapted from Blackrock Investment Institute. Adoption rates are based on household ownership except for cellphone and smart phones, which are based on ownership per capita
0%
10%
20%
30%
40%
50%
60%
70%
80%
90%
100%
0 10 20 30 40 50 60 70 80 90 100 110
Adoption of technology in the US (normalised to year of 10% adoption)Telephone
Electricity
Cars
Radio
Fridge
TV
Air travel
Colour TV
Credit card
Microwave
Video games
PC
Cell phone
Internet
Digital camera
MP3 player
HDTV
Social media
Smartphone
Tablet
SiC in EVs: benefits in the inverter
9
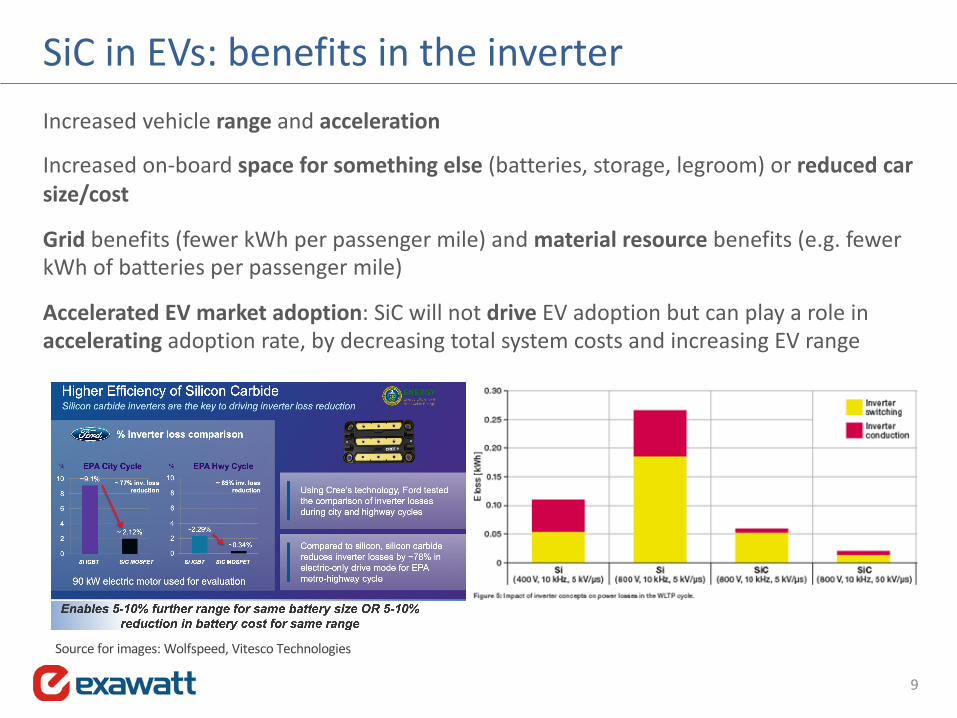
Increased vehicle range and acceleration
Increased on-board space for something else (batteries, storage, legroom) or reduced car size/cost
Grid benefits (fewer kWh per passenger mile) and material resource benefits (e.g. fewer kWh of batteries per passenger mile)
Accelerated EV market adoption: SiC will not drive EV adoption but can play a role in accelerating adoption rate, by decreasing total system costs and increasing EV range
Source for images: Wolfspeed, Vitesco Technologies

BEV cost drivers: range, battery cost/kWh, efficiency
10
Source: Exawatt, incorporating estimates from TUM, ICCT, EPA, CARB, NHTSA, company data, Morgan Stanley
SiC enables either a 5-10% increase in range – or a smaller battery for the same range
ICE Full hybrid BEV BEV BEV BEV
50kWh 50kWh 45kWh 45kWh
$150/kWh $100/kWh $100/kWh $80/kWh
ICE vs hybrid vs BEV manufacturing cost
Battery pack
BEV/hybridpowertrainICEpowertrainCommoncomponents

-
200,000
400,000
600,000
800,000
1,000,000
1,200,000
1,400,000
1,600,000
1,800,000
2,000,000
2016 Q4 2017 Q4 2018 Q4 2019 Q4 2020 Q4 2021 Q4 2022 Q4
Vehicles BEV demand (TTM)
China
Europe (inc. UK)
Tesla (SiC)
USA
UK
SiC is already mainstream
11
Source: Exawatt
BYD Han – launched July 2020 –has a SiC inverter

SiC is getting cheaper
12
Source: Exawatt

SiC benefit greatest in long-range, high-power cars
13
Source: Exawatt
$0
$200
$400
$600
$800
$1,000
$1,200
50kW 100kW 150kW 200kW 250kW 300kW 350kW
20kWh 40kWh 60kWh 80kWh 100kWh 120kWh 140kWh
Motor power (kW)Battery capacity (kWh)
Battery cost savingfrom 5% range gain,2020
Inverter costincrease due to SiC,2020

SiC benefit greatest in long-range, high-power cars
14
Source: Exawatt
Audi E-Tron 55 Quattro
BMW i3Honda E
Hyundai Kona 39kWh
Hyundai Kona 64kWh
Jaguar I-PACE
MG ZSMini Cooper S Electric
Nissan Leaf ZE1 40kWh Nissan Leaf ZE1 62kWh
Porsche Taycan (800V)
Porsche Taycan Turbo S (800V)
Renault Zoe ZE 40Renault Zoe ZE 50Skoda Citigo-e
Tesla Model 3 Standard RangeTesla Model 3 Long Range
Tesla Model S Long Range
Tesla Model S Performance
VW e-Golf
VW ID3 1st Edition
VW ID3 Pure*
BYD Han*
BYD Han Flagship*Tesla Model Y Long Range Dual Motor*
0
100
200
300
400
500
600
700
0 20 40 60 80 100 120
Motor power (kW)
Battery capacity (kWh)
EV battery capacity vs motor power

New car model lifetime is typically 5-8 years
15
7 years 6 years
0
2,000
4,000
6,000
8,000
10,000
12,000
14,000
2006 2007 2008 2009 2010 2011 2012 2013 2014 2015 2016 2017 2018 2019
Quarterly sales Leading UK family car A
Source: Exawatt analysis of DfT data
2001 2003 2005 2007 2009 2011 2013 2015 2017 2019
Leading UK family car B
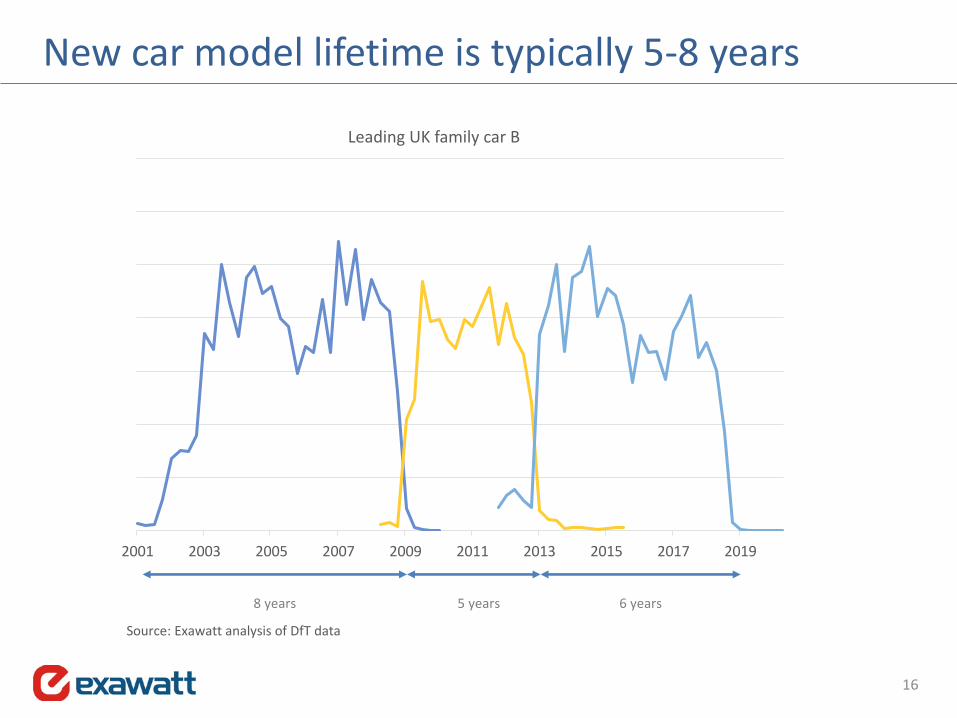
New car model lifetime is typically 5-8 years
16
8 years 5 years 6 years
Source: Exawatt analysis of DfT data

When will the last mainstream passenger ICE be sold?
17
* functionally equivalent for needs of average user, and competitively priced
Event Aggressive Conservative
BEVs reach tipping point* 2024 2026
Last mainstream ICE car model launches 2025 2027
ICE version production lifetime 5 years 8 years
Last mainstream car is produced in US 2030 2035

EV and total vehicle forecasts
18
Source: Exawatt
0
20,000,000
40,000,000
60,000,000
80,000,000
100,000,000
120,000,000
2018 2019 2020 2021 2022 2023 2024 2025 2026 2027 2028 2029 2030
Global annual BEV and FCEV market
Total vehicles
High case
Base case
Low case

The opportunities beyond BEVs
19
New power electronics enable more efficient, cheaper vehicles with lower running costs
Battery supply chain benefits from reduced materials requirement per kWh
More-efficient vehicles generate savings at the grid level
Large-scale EV manufacturing enables cost reductions that can be leveraged in other applications that require power converters
Other transportation forms also benefit from SiC power electronics, including rail, aviation, marine

New report: market for SiC in electric vehicles
20
Simon PriceCEO, Exawatt
Landmark House20 Broomgrove RoadSheffieldS10 2LR
Launching Q1 2021
For more details, contact: