the open transportation journal, 2013, 7, 7-19 7 open ... · send orders of reprints at...
TRANSCRIPT
Send Orders of Reprints at [email protected]
The Open Transportation Journal, 2013, 7, 7-19 7
1874-4478/13 2013 Bentham Open
Open Access
Assessment of the Performance of Road Markings in Urban Areas: The Outcomes of the CIVITAS RENAISSANCE Project
Francesco Asdrubali*, Cinzia Buratti, Elisa Moretti, Francesco D’Alessandro and
Samuele Schiavoni
CIRIAF, Interuniversity Centre of Research on Pollution by Physical Agents, University of Perugia, Via G. Duranti, snc,
06125 Perugia, Italy
Abstract: In the framework of the EU funded CIVITAS plus RENAISSANCE project, a research activity was focused on
the definition of a new methodology for evaluating the global quality of the road markings at urban level, both from a
technical and an economic point of view, in order to assure road safety.
Two innovative indicators were developed: one for the assessment of the technical performance (CIS-Q) and one for the
optimization of the budget (CIS-C).
In order to rate the global quality of municipal road markings, the performance indicator CIS-Q takes into account all the
parameters characterizing the performance of road markings, such as luminance coefficient in day conditions Qd,
retroreflectivity in night conditions RL (dry, wet), skid resistance SRT, colour, kind of material and ageing of the
pavement markings, traffic volumes, characteristics of road surface and average local weather conditions.
The economic indicator CIS-C considers the budget available for the road manager and compares it with the one needed
to ensure an adequate level of quality for road markings.
Keywords: Road markings, road management, retroreflection, maintenance, monitoring, economic assessment.
1. INTRODUCTION
Road safety is a focus of the European Commission policies: in 2009, more than 35,000 people died on the roads of the European Union and no fewer than 1,500,000 persons were injured. The corresponding social cost was approximately 130 billion Euros [1].
The third European Road Safety Action Programme (2003-2010) proposed a series of measures such as stricter checks on road traffic, new road safety technologies, improved road infrastructures and actions to improve users' behaviour [2]. The programme included an ambitious target to halve the number of road deaths by 2010, which was not reached. Despite that, the fourth European Road Safety Action Programme (2011-2020) maintains the target of halving the overall number of road deaths in the EU between 2010 and 2020 [2].
The importance of pavement markings and their influence on driving safety, especially at night and in difficult weather conditions (fog, rain, etc.) is well known [3].
Efficiency and durability of road horizontal markings are strongly required by both users and administrators. From the users’ point of view, pavement markings provide an optical
*Address correspondence to this author at the CIRIAF, Interuniversity Center
of Research on Pollution by Physical Agents, University of Perugia, Via G.
Duranti, snc, 06125 Perugia, Italy; Tel: +39 075 5853716;
Fax: +39 075 5853697; E-mail: [email protected]
path by means of an adequate contrast of colour and luminance with the road surface [4, 5], while costs and performance influence the administrators’ choices, especially as far as the time planning of maintenance.
Public administrations invest considerable amounts of money to keep the markings at adequate performance level. However the researches done so far have still not produced definitive results: it is still not clear which road markings produce benefits on safety. At highways level, several studies showed that with high visibility markings the drivers tend to increase the speed, nullifying the benefits on safety [6-8]. At urban level things get more complicated because of several factors which are not present on highways, such as, pedestrian crossings, turnabouts, stop signals and also a different way of driving.
As stated by Elvik in [9], the use of cost–benefit analysis to set priorities for road safety policy, including road markings, is usually controversial, and it is almost impossible to foresee the trend of the performance of the materials used for the markings [10]. Furthermore, the number of typologies of used materials is very high and their performance is deeply influenced by local factors such as average weather conditions, AADT (annual average daily traffic), snow removal frequency, etc.
In the United States there are several studies on road markings realized by the Departments of Transportations of various federal states (the most interesting are those of the DoT of Kansas, Texas, California, and Iowa), while at European level the research is performed mainly by the
8 The Open Transportation Journal, 2013, Volume 7 Asdrubali et al.
chemical companies manufacturing the materials used for road markings. Furthermore the research is mainly focused on extra urban roads (always considering retroreflection as the only yardstick) and little data are available for urban scenarios [11-14].
The European standard EN 1436 [15] defines the quality requirements for road markings, in terms of night and day visibility, colour and skid resistance, but it does not specify how some factors (such as road surface, installation conditions, age, traffic conditions) influence the efficiency and durability of adherence and retro-reflectivity properties [16-19]. Therefore a scientific approach is needed in order to define a modus operandi for in-situ measurements, to take into account the characteristics of the site of installation of road markings.
In this context, a research was done in Perugia (Italy) within the European Project CIVITAS RENAISSANCE - Testing Innovative Strategies for Clean Urban Transport for historic European cities” [20], funded under the 7
th
Framework Programme.
The general objective of the Project was to demonstrate that new and innovative transport solutions can facilitate mobility, economic growth and environmental sustainability while protecting the valuable fabric of historic cities. The cities involved in the project were: Perugia (Italy) – Project Leader, Bath (United Kingdom), Szczecinek (Poland), Gorna Oryahovitsa (Bulgaria) and Skopje (Republic of Macedonia).
In particular, measure 5.2 of the project, “Assessing the options for more efficient road pavement markings”, focused on the study of the performance of road surface markings. These activities aimed at defining a modus operandi for in-situ measurements able to take into account the characteristics of the installation site of road markings, in order to:
optimize the maintenance;
maximize the security;
give the municipalities a tool to verify the quality of the application in order to assess if the requirements given in tenders are fulfilled.
This last aspect is particularly important for public administrations: as a matter of fact the evaluation of the performance of road surface markings in small and medium towns is usually made by means of the visual judgment of the amount of paint used, without any experimental support.
The paper reports the outcomes of the research. In particular a methodology was developed for measuring the performance of road markings, taking into account the characteristics of the site; two extensive experimental campaigns on selected road segments in Perugia were performed to validate the methodology. Finally, two new indicators were defined in order to rate the global quality of the road markings system of a municipality.
2. ROAD SURFACE MARKINGS: STATE OF THE ART
2.1 Materials Used for Road Surface Markings
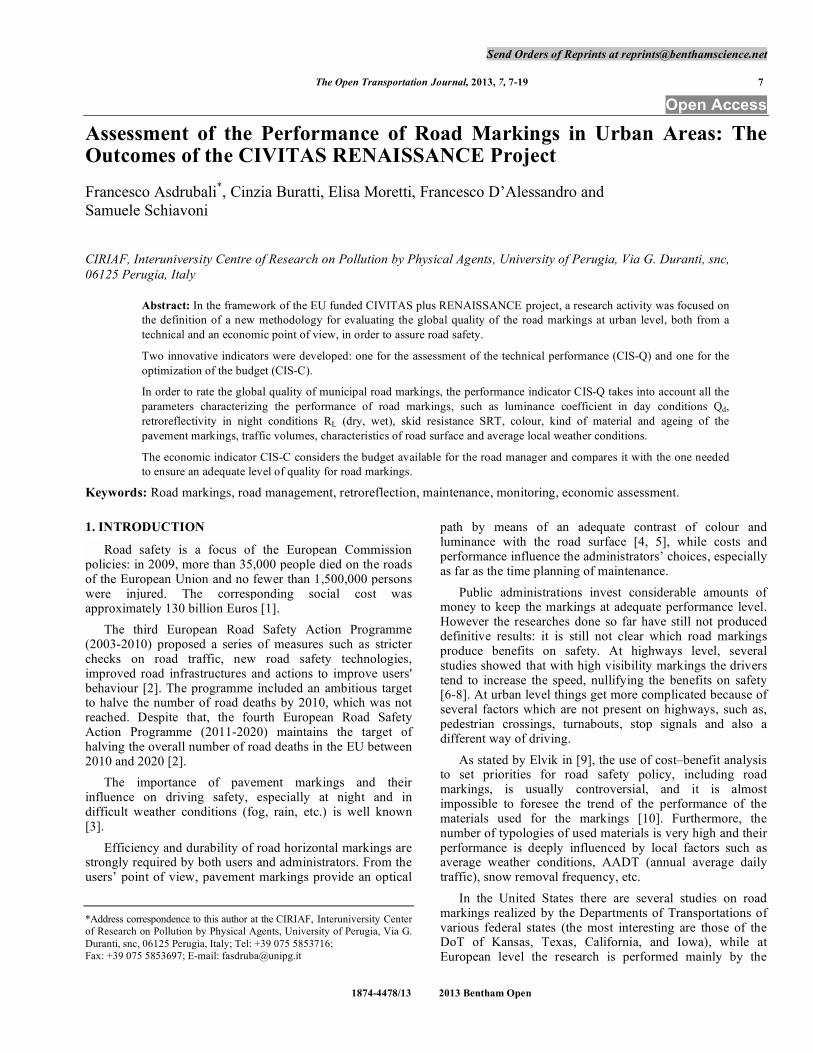
There are four main typologies of road marking materials. Their characteristics differ in terms of costs, performance, durability, speed of application, as reported
below [21-24]. The retro-reflecting properties of each material could be improved using glass beads; they could be mixed with the road marking material before the application on the road pavement or post-sprayed on the signage.
2.1.1. Paint
It is the most widely used road marking system in the world (see Fig. 1a). It does not require heating and can be applied very quickly at speeds up to 15 km/h. It has little build up and an affinity to glass beads, that can be either pre-mixed or dropped on the paint while it is wet. This road marking system can be applied generally in warm seasons because of the weather conditions. Traffic paints are available with a variety of solvents (alkyd resin, rubber, modified alkyd) and water-borne. Solvent-borne paints are very durable with respect to water-borne, but have a higher content of VOC (Volatile Organic Compounds, around 440 g/l vs 150 g/l). Water-borne are much easier to handle than solvent paints, but wear off rapidly and lose reflectivity quickly. Therefore paints are not suitable for high-volume roadways, but for nondurable markings. Expected service life is around half to one year, while retro reflectivity – which is the main parameter to evaluate the performance of a road marking material, see § 2.2 - is within the range of 140-250 mcd/(lux m
2). In Italy, the cost of solvent-based paint is
between 0.3 and 0.5 /m for stripes and between 3.4 and 4 /m
2 for other signals (give way, pedestrian crossing, etc.).
The cost of water-based paint is between 0.5 and 0.7 /m for stripes and between 4.5 and 5.2 /m
2 for other signals.
2.1.2. Thermoplastic
It is a durable pavement marking material composed of glass beads, pigments, binders (plastics and resins) and fillers (see Fig. 1b). There are two types of thermoplastics: hydrocarbon and alkyd. Thermoplastic road markings are solid at ambient temperatures, so they must be melted for the application (at least at 200°C). They do not contain solvents, have an application speed of around 5 km/h and a thickness from 1.5 to 3 mm. A correct installation requires a proper surface cleaning and the removal of the moisture; it is recommended not to apply thermoplastic materials on cold pavements surfaces (poor adhesion may occur). Moreover these materials can be re-applied over older thermoplastic marking and they perform very well on all types of asphalt surfaces. A loss of material may occur from snow-removal operation. Expected service life is from around 2 up to 7 years (strongly depending on formulation and installation), while retro reflectivity is within the range of 80-120 mcd/(lux m
2). In Italy, the cost of thermoplastic paint is
between 1.0 and 2.3 /m for stripes and between 8.2 and 15.2 /m
2 for other signals.
2.1.3. Two-Components Resins
These materials are produced on site through the reaction of two chemical reactants (see Fig. 1c). The first component contains epoxy resin, pigment, extenders and fillers, while the second component acts as a catalyst to accelerate the setting time. Epoxy resin may be substituted with polyester, polyurea or methacrylate. All these materials have a low VOC content. Epoxy-based marking materials have a service life up to 4 years, but they discolour with age; they have a drying time in most cases higher than 40 minutes. Methyl
Assessment of the Performance of Road Markings in Urban Areas The Open Transportation Journal, 2013, Volume 7 9
Methacrylate-based markings have to be applied slowly (5 km/h) and need a cure time of about 30 minutes; nevertheless this system has a very high retro-reflectivity and a service life up to 10 years. Polyurea-based marking materials have a faster drying time and need a short cure time (3 to 8 minutes); they may be also applied at low pavement surface temperatures (as low as 0°C) and are not affected by humidity. In Italy, the cost of two component resins is between 1.7 and 2.3 /m for stripes and about 22.0
/m2 for other signals.
2.1.4. Preformed Road Markings (Tapes)
These materials are available with several performance levels and types, both permanent and temporary (see Fig. 1d). The markings can be applied to existing pavement rolled into hot surfaces, or placed in prepared grooves. They need a proper pavement surface preparation, a slow application and have a cost which is 5 to 10 times higher than thermoplastic. Glass beads are incorporated into the material during factory manufacturing. Nevertheless tapes have a service life longer than others marking systems and an excellent retro-reflectivity (300-1000 mcd/(lux m
2)). In
Italy, these materials are very expensive; for instance their cost reaches the 60 /m
2 for pedestrian crossing and other
signals like give way, stop, etc.
2.1.5. Glass Beads
As previously mentioned, the performance of all road marking materials in terms of retroreflectivity is determined by the quality and quantity of included glass beads.
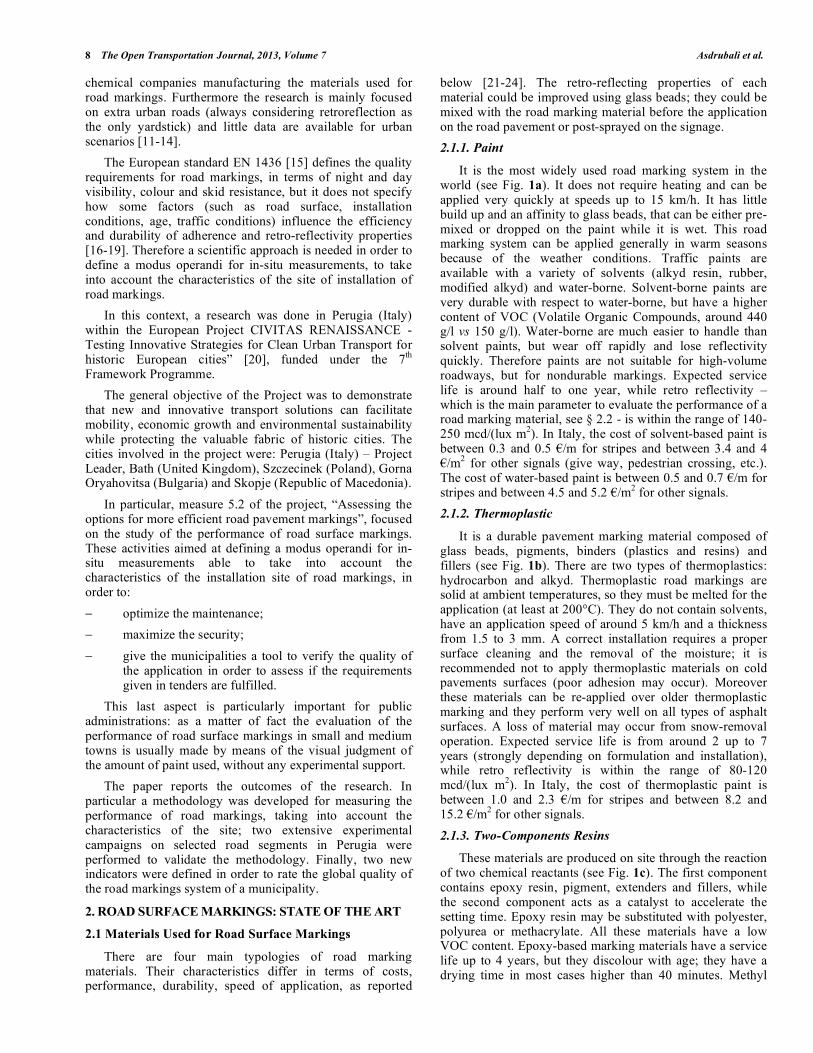
Retroreflection is a particular reflection wherein the reflected rays of radiation return along paths parallel to those of their corresponding incident rays (see Fig. 2).
The glass beads cause retroreflection in a three step process involving:
refraction (bending) as light enters a bead;
reflection in the material in which the bead is embedded;
refraction as the light leaves the bead.
The retro-reflection is due only to the interface between the road marking material and the glass. Moreover the quality and quantity of the pigments in the markings (Titanium dioxide for white markings) affect the retro-reflection.
Fig. (2). Retroreflection of glass beads.
Glass beads have usually diameters between 60 and 850 μm; they can be pre-mixed in the marking material or post-sprayed on the surface of the material after its installation.
Glass beads have a refraction index between 1.5 and 1.55 and have a high retro-reflection if their degree of sinking is between 55 and 60% of their diameter. A sinking degree less than the 50% weakens their resistance to tyres, while a
Fig. (1). Different types of materials for road markings (a: paint, b: thermoplastics, c: two components resins, d: tapes).
10 The Open Transportation Journal, 2013, Volume 7 Asdrubali et al.
sinking degree higher than 60% limits the retro-reflection properties.
2.2. Parameters for the Evaluation of Road Markings Performance: Requirements and Equipment
The evaluation of road markings performance was introduced in the European Union through the standard EN 1436 in August 1997, following the withdrawal of the British Standard BS 3262 and of other national norms.
In particular, EN 1436 specifies the performance for the road user of white and yellow road markings, based on luminance (colour), day-time visibility, night-time visibility and skid resistance. The standard introduces also the importance of wet-night visibility road markings and describes the methods of measuring the various performance characteristics [15].
The standard derives from the studies conducted in the COST Action 331:1999 “Requirements for Horizontal Road Marking” [25], aimed at defining a scientific method to determine, on the basis of drivers’ visual needs, the optimum pavement marking design, in order to ensure markings visibility, by day and by night, in all weather conditions.
The application field of the road markings covered by the COST Action was restricted to interurban roads (motorways, dual carriageways and single carriageways). Therefore, pavement markings applied in urban areas were not considered and the requirements given by EN 1436 cannot be directly applied in such conditions.
The standard EN 1436 defines different classes of performance for road markings: the managing authorities of road networks can introduce a certain class of performance in their public tenders for the installation of road markings, depending on the compromise between road users’ needs and the available budget.
A short description of the parameters addressed by EN 1436 is reported below.
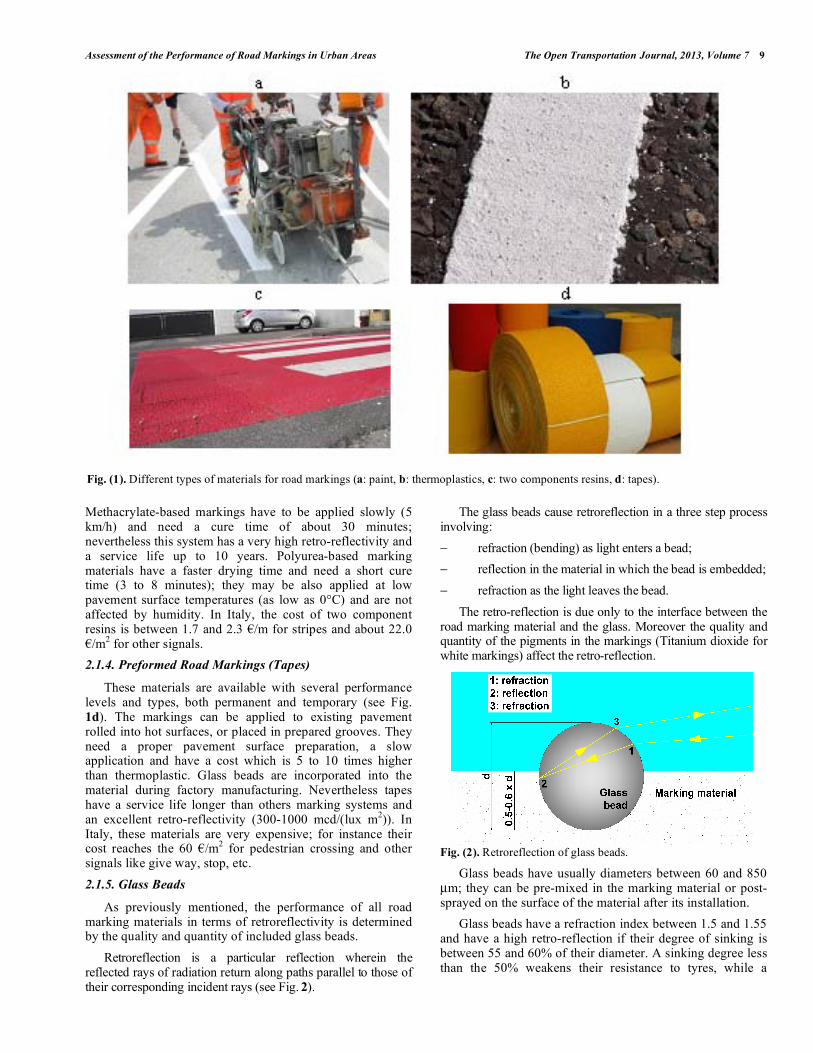
Reflection in daylight or under road lighting Qd is the property of the marking which describes the brightness of its colour.
Qd measures, true to scale, the luminance (day visibility) of a road marking. The observation angle of 2.29° corresponds to the viewing distance of a motor car driver of 30 m under normal
conditions (see Fig. 3). The illumination is diffused light. Reflection in daylight or under road lighting Qd is measured using a retroreflectometer.
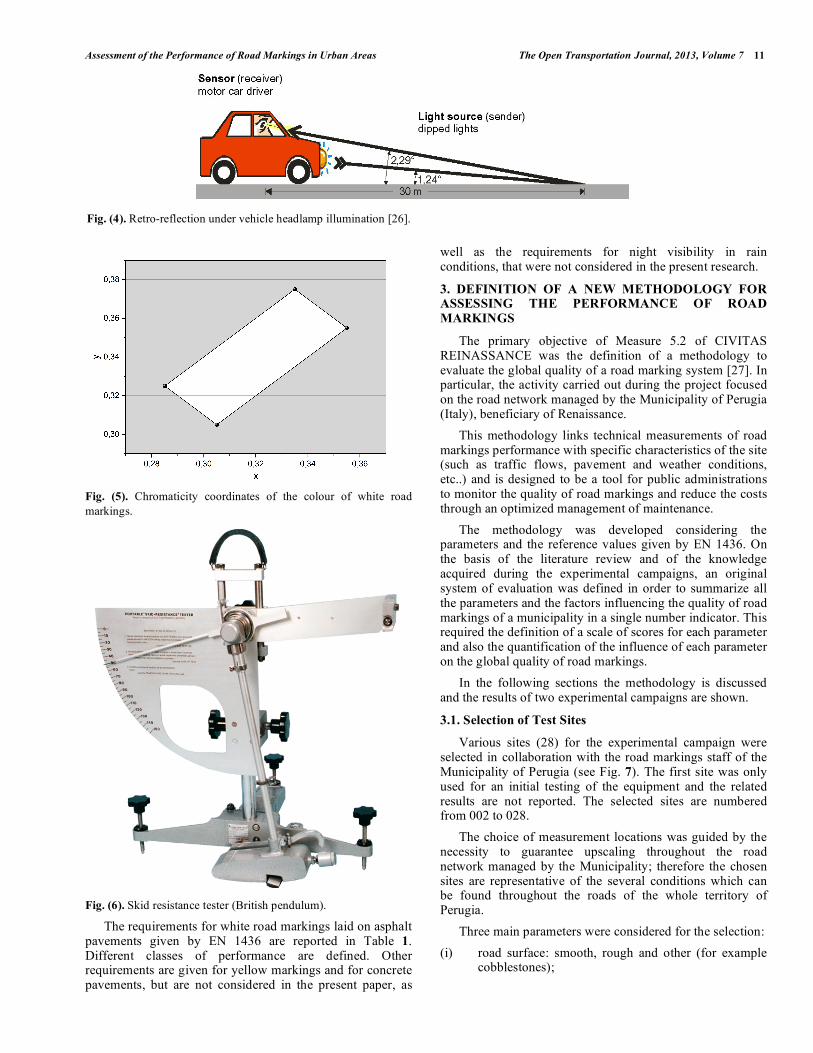
Reflection under vehicle headlamp illumination RL (commonly named retroreflection) is the ability of a road marking to reflect light from a vehicle headlights back to the driving position of a vehicle. Retroreflected light is reflected back toward the source (headlight) but it must spread out slightly in a very narrow cone or the driver would not be included within it and the sign or marking would not be seen by the driver.
RL measures, true to scale, the retroreflection (night visibility) of a road marking. Also in this case, the observation angle of 2.29° corresponds to the viewing distance of a motor car driver of 30 m under normal conditions. The illumination angle is 1.24° (see Fig. 4). Reflection under vehicle headlamp illumination RL should be measured in dry, wet and rain conditions with a retroreflectometer.
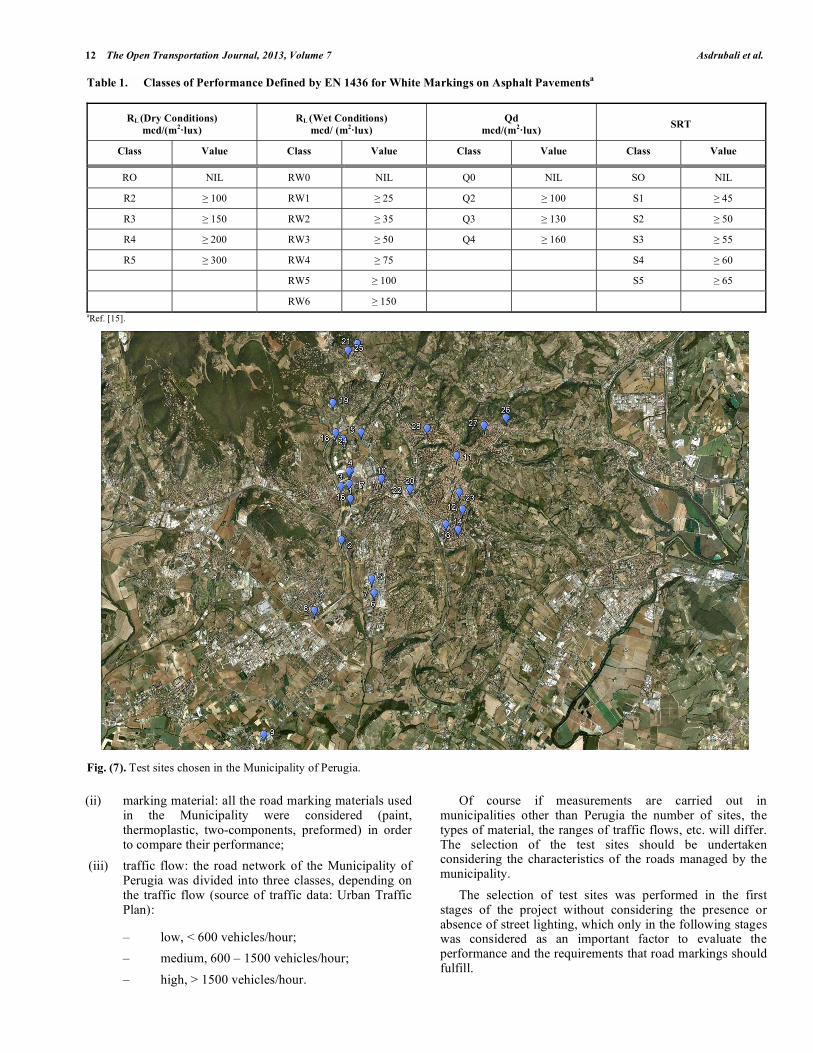
The road markings colour is defined through the luminance factor and chromaticity (x, y), using the chromaticity diagram. Fig. (5) reports the plain figure having the chromaticity vertexes defined by EN 1436 for white markings. Chromaticity is measured using a spectrophoto-meter able to evaluate the optical performance even of small and irregular surfaces.
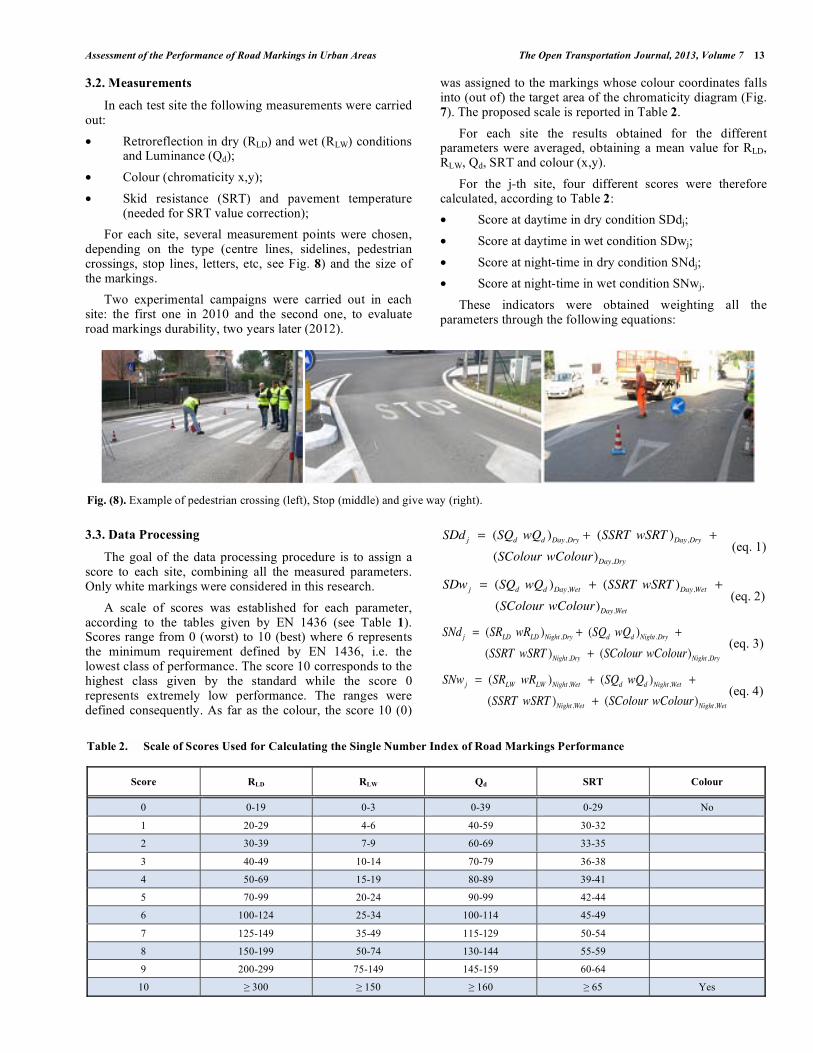
Skid resistance measurement on road markings is carried out using the standard British pendulum apparatus (see Fig. 6). The units of measurement quoted in EN 1436 are followed by the abbreviation SRT. The skid resistance correlates with the performance of a vehicle with patterned tyres braking with locked wheels on a wet road at 50 km/h. For skid resistance, emphasis is sometimes placed on those road markings which occupy a large percentage of the trafficked areas such as zebra crossings, arrows, transverse markings, text and symbols.
The SRT value should be evaluated trough a portable skid resistance tester that gives a measure of the friction between a skidding tyre (a rubber slider mounted at the end of the pendulum arm) and a wet road surface. A correction of SRT is needed to take into account the influence of the asphalt temperature.
Fig. (3). Reflection in daylight or under road lighting [26].
Assessment of the Performance of Road Markings in Urban Areas The Open Transportation Journal, 2013, Volume 7 11
Fig. (5). Chromaticity coordinates of the colour of white road
markings.
Fig. (6). Skid resistance tester (British pendulum).
The requirements for white road markings laid on asphalt pavements given by EN 1436 are reported in Table 1. Different classes of performance are defined. Other requirements are given for yellow markings and for concrete pavements, but are not considered in the present paper, as
well as the requirements for night visibility in rain conditions, that were not considered in the present research.
3. DEFINITION OF A NEW METHODOLOGY FOR ASSESSING THE PERFORMANCE OF ROAD
MARKINGS
The primary objective of Measure 5.2 of CIVITAS REINASSANCE was the definition of a methodology to evaluate the global quality of a road marking system [27]. In particular, the activity carried out during the project focused on the road network managed by the Municipality of Perugia (Italy), beneficiary of Renaissance.
This methodology links technical measurements of road markings performance with specific characteristics of the site (such as traffic flows, pavement and weather conditions, etc..) and is designed to be a tool for public administrations to monitor the quality of road markings and reduce the costs through an optimized management of maintenance.
The methodology was developed considering the parameters and the reference values given by EN 1436. On the basis of the literature review and of the knowledge acquired during the experimental campaigns, an original system of evaluation was defined in order to summarize all the parameters and the factors influencing the quality of road markings of a municipality in a single number indicator. This required the definition of a scale of scores for each parameter and also the quantification of the influence of each parameter on the global quality of road markings.
In the following sections the methodology is discussed and the results of two experimental campaigns are shown.
3.1. Selection of Test Sites
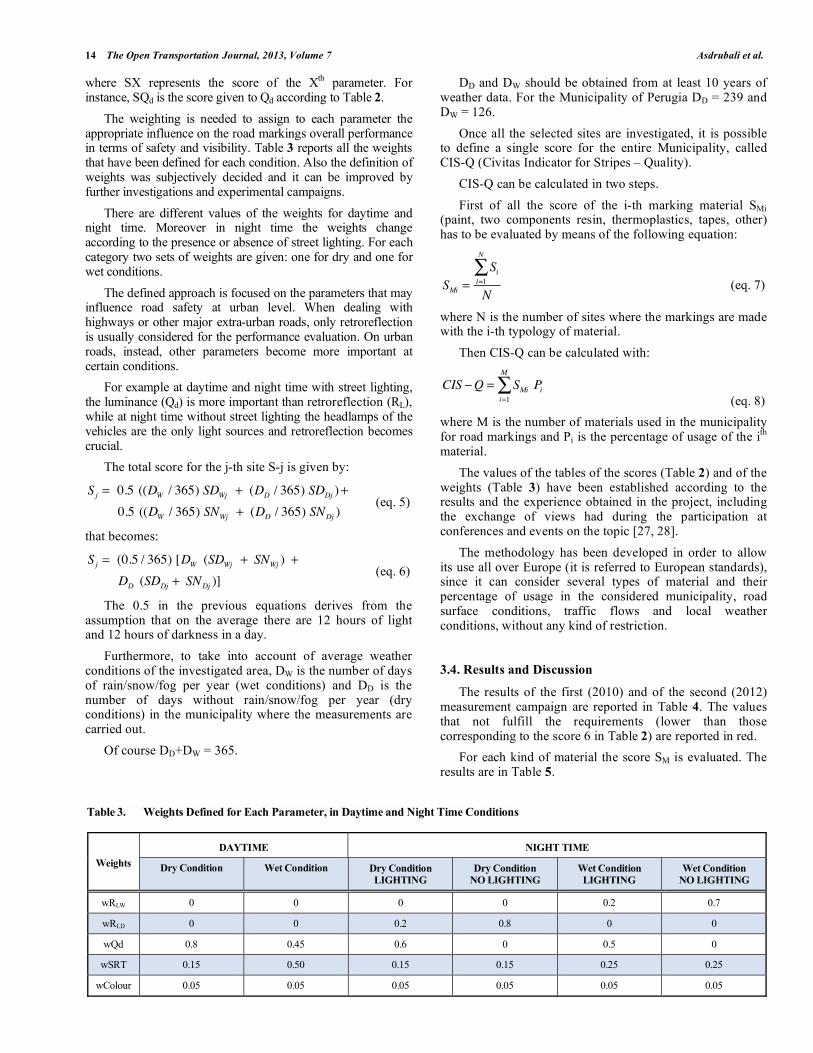
Various sites (28) for the experimental campaign were selected in collaboration with the road markings staff of the Municipality of Perugia (see Fig. 7). The first site was only used for an initial testing of the equipment and the related results are not reported. The selected sites are numbered from 002 to 028.
The choice of measurement locations was guided by the necessity to guarantee upscaling throughout the road network managed by the Municipality; therefore the chosen sites are representative of the several conditions which can be found throughout the roads of the whole territory of Perugia.
Three main parameters were considered for the selection:
(i) road surface: smooth, rough and other (for example cobblestones);
Fig. (4). Retro-reflection under vehicle headlamp illumination [26].
12 The Open Transportation Journal, 2013, Volume 7 Asdrubali et al.
(ii) marking material: all the road marking materials used in the Municipality were considered (paint, thermoplastic, two-components, preformed) in order to compare their performance;
(iii) traffic flow: the road network of the Municipality of Perugia was divided into three classes, depending on the traffic flow (source of traffic data: Urban Traffic Plan):
– low, < 600 vehicles/hour;
– medium, 600 – 1500 vehicles/hour;
– high, > 1500 vehicles/hour.
Of course if measurements are carried out in municipalities other than Perugia the number of sites, the types of material, the ranges of traffic flows, etc. will differ. The selection of the test sites should be undertaken considering the characteristics of the roads managed by the municipality.
The selection of test sites was performed in the first stages of the project without considering the presence or absence of street lighting, which only in the following stages was considered as an important factor to evaluate the performance and the requirements that road markings should fulfill.
Table 1. Classes of Performance Defined by EN 1436 for White Markings on Asphalt Pavementsa
RL (Dry Conditions)
mcd/(m2
lux)
RL (Wet Conditions)
mcd/ (m2
lux)
Qd
mcd/(m2
lux)
SRT
Class Value Class Value Class Value Class Value
RO NIL RW0 NIL Q0 NIL SO NIL
R2 100 RW1 25 Q2 100 S1 45
R3 150 RW2 35 Q3 130 S2 50
R4 200 RW3 50 Q4 160 S3 55
R5 300 RW4 75 S4 60
RW5 100 S5 65
RW6 150
aRef. [15].
Fig. (7). Test sites chosen in the Municipality of Perugia.
Assessment of the Performance of Road Markings in Urban Areas The Open Transportation Journal, 2013, Volume 7 13
3.2. Measurements
In each test site the following measurements were carried out:
• Retroreflection in dry (RLD) and wet (RLW) conditions and Luminance (Qd);
• Colour (chromaticity x,y);
• Skid resistance (SRT) and pavement temperature (needed for SRT value correction);
For each site, several measurement points were chosen, depending on the type (centre lines, sidelines, pedestrian crossings, stop lines, letters, etc, see Fig. 8) and the size of the markings.
Two experimental campaigns were carried out in each site: the first one in 2010 and the second one, to evaluate road markings durability, two years later (2012).
3.3. Data Processing
The goal of the data processing procedure is to assign a score to each site, combining all the measured parameters. Only white markings were considered in this research.
A scale of scores was established for each parameter, according to the tables given by EN 1436 (see Table 1). Scores range from 0 (worst) to 10 (best) where 6 represents the minimum requirement defined by EN 1436, i.e. the lowest class of performance. The score 10 corresponds to the highest class given by the standard while the score 0 represents extremely low performance. The ranges were defined consequently. As far as the colour, the score 10 (0)
was assigned to the markings whose colour coordinates falls into (out of) the target area of the chromaticity diagram (Fig. 7). The proposed scale is reported in Table 2.
For each site the results obtained for the different parameters were averaged, obtaining a mean value for RLD, RLW, Qd, SRT and colour (x,y).
For the j-th site, four different scores were therefore calculated, according to Table 2:
• Score at daytime in dry condition SDdj;
• Score at daytime in wet condition SDwj;
• Score at night-time in dry condition SNdj;
• Score at night-time in wet condition SNwj.
These indicators were obtained weighting all the parameters through the following equations:
SDdj = (SQd wQd )Day,Dry + (SSRT wSRT )Day,Dry +
(SColour wColour)Day,Dry
(eq. 1)
SDwj = (SQd wQd )Day,Wet + (SSRT wSRT )Day,Wet +
(SColour wColour)Day,Wet
(eq. 2)
SNdj = (SRLD wRLD )Night ,Dry + (SQd wQd )Night ,Dry +
(SSRT wSRT )Night ,Dry + (SColour wColour)Night ,Dry (eq. 3)
SNwj = (SRLW wRLW )Night ,Wet + (SQd wQd )Night ,Wet +
(SSRT wSRT )Night ,Wet + (SColour wColour)Night ,Wet(eq. 4)
Fig. (8). Example of pedestrian crossing (left), Stop (middle) and give way (right).
Table 2. Scale of Scores Used for Calculating the Single Number Index of Road Markings Performance
Score RLD RLW Qd SRT Colour
0 0-19 0-3 0-39 0-29 No
1 20-29 4-6 40-59 30-32
2 30-39 7-9 60-69 33-35
3 40-49 10-14 70-79 36-38
4 50-69 15-19 80-89 39-41
5 70-99 20-24 90-99 42-44
6 100-124 25-34 100-114 45-49
7 125-149 35-49 115-129 50-54
8 150-199 50-74 130-144 55-59
9 200-299 75-149 145-159 60-64
10 300 150 160 65 Yes
14 The Open Transportation Journal, 2013, Volume 7 Asdrubali et al.
where SX represents the score of the Xth parameter. For
instance, SQd is the score given to Qd according to Table 2.
The weighting is needed to assign to each parameter the appropriate influence on the road markings overall performance in terms of safety and visibility. Table 3 reports all the weights that have been defined for each condition. Also the definition of weights was subjectively decided and it can be improved by further investigations and experimental campaigns.
There are different values of the weights for daytime and night time. Moreover in night time the weights change according to the presence or absence of street lighting. For each category two sets of weights are given: one for dry and one for wet conditions.
The defined approach is focused on the parameters that may influence road safety at urban level. When dealing with highways or other major extra-urban roads, only retroreflection is usually considered for the performance evaluation. On urban roads, instead, other parameters become more important at certain conditions.
For example at daytime and night time with street lighting, the luminance (Qd) is more important than retroreflection (RL), while at night time without street lighting the headlamps of the vehicles are the only light sources and retroreflection becomes crucial.
The total score for the j-th site S-j is given by:
Sj = 0.5 ((DW / 365) SDWj + (DD / 365) SDDj )+
0.5 ((DW / 365) SNWj + (DD / 365) SNDj ) (eq. 5)
that becomes:
Sj = (0.5 / 365) [DW (SDWj + SNWj ) +
DD (SDDj + SNDj )] (eq. 6)
The 0.5 in the previous equations derives from the assumption that on the average there are 12 hours of light and 12 hours of darkness in a day.
Furthermore, to take into account of average weather conditions of the investigated area, DW is the number of days of rain/snow/fog per year (wet conditions) and DD is the number of days without rain/snow/fog per year (dry conditions) in the municipality where the measurements are carried out.
Of course DD+DW = 365.
DD and DW should be obtained from at least 10 years of weather data. For the Municipality of Perugia DD = 239 and DW = 126.
Once all the selected sites are investigated, it is possible to define a single score for the entire Municipality, called CIS-Q (Civitas Indicator for Stripes – Quality).
CIS-Q can be calculated in two steps.
First of all the score of the i-th marking material SMi (paint, two components resin, thermoplastics, tapes, other) has to be evaluated by means of the following equation:
SMi =Si
i=1
N
N (eq. 7)
where N is the number of sites where the markings are made with the i-th typology of material.
Then CIS-Q can be calculated with:
CIS Q = SMi Pii=1
M
(eq. 8)
where M is the number of materials used in the municipality for road markings and Pi is the percentage of usage of the i
th
material.
The values of the tables of the scores (Table 2) and of the weights (Table 3) have been established according to the results and the experience obtained in the project, including the exchange of views had during the participation at conferences and events on the topic [27, 28].
The methodology has been developed in order to allow its use all over Europe (it is referred to European standards), since it can consider several types of material and their percentage of usage in the considered municipality, road surface conditions, traffic flows and local weather conditions, without any kind of restriction.
3.4. Results and Discussion
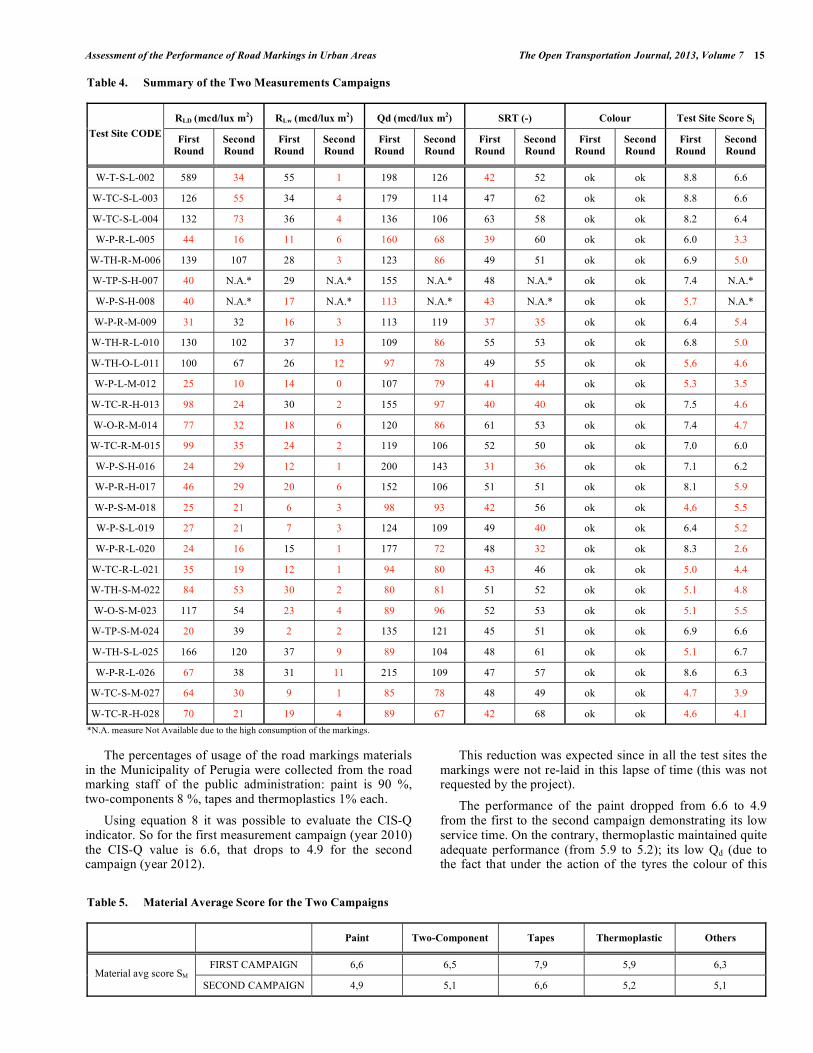
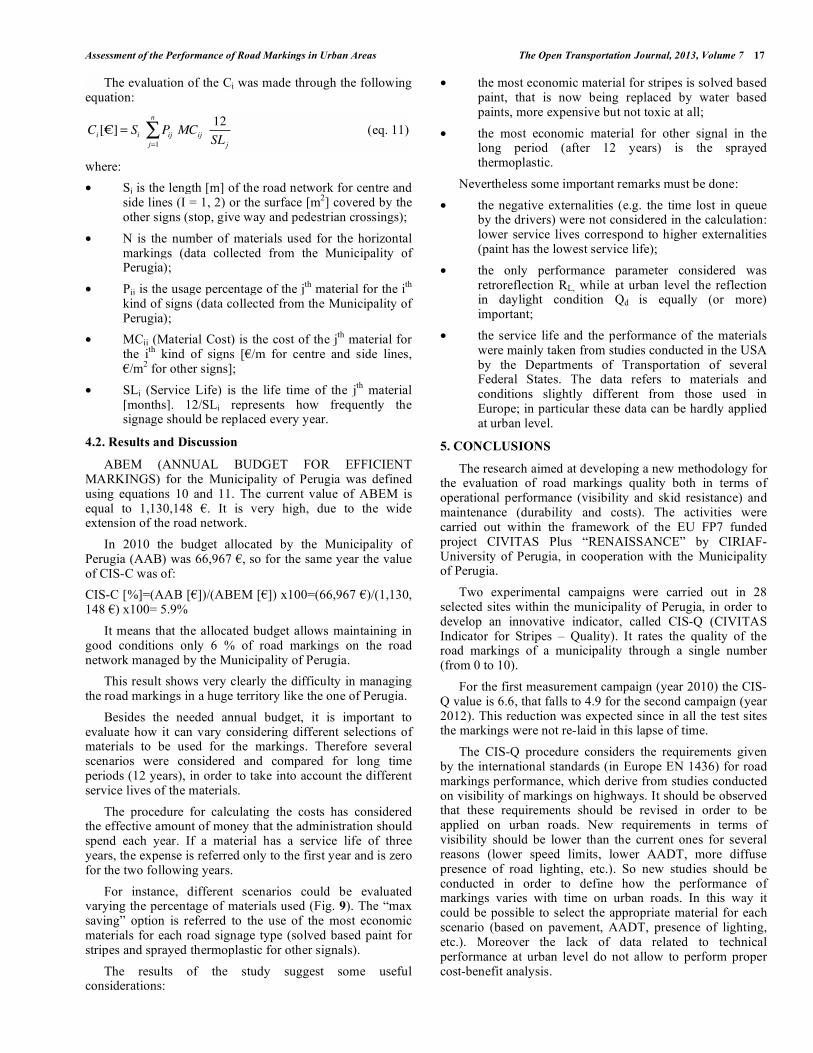
The results of the first (2010) and of the second (2012) measurement campaign are reported in Table 4. The values that not fulfill the requirements (lower than those corresponding to the score 6 in Table 2) are reported in red.
For each kind of material the score SM is evaluated. The results are in Table 5.
Table 3. Weights Defined for Each Parameter, in Daytime and Night Time Conditions
DAYTIME NIGHT TIME
Weights Dry Condition Wet Condition Dry Condition
LIGHTING
Dry Condition
NO LIGHTING
Wet Condition
LIGHTING
Wet Condition
NO LIGHTING
wRLW 0 0 0 0 0.2 0.7
wRLD 0 0 0.2 0.8 0 0
wQd 0.8 0.45 0.6 0 0.5 0
wSRT 0.15 0.50 0.15 0.15 0.25 0.25
wColour 0.05 0.05 0.05 0.05 0.05 0.05
Assessment of the Performance of Road Markings in Urban Areas The Open Transportation Journal, 2013, Volume 7 15
The percentages of usage of the road markings materials in the Municipality of Perugia were collected from the road marking staff of the public administration: paint is 90 %, two-components 8 %, tapes and thermoplastics 1% each.
Using equation 8 it was possible to evaluate the CIS-Q indicator. So for the first measurement campaign (year 2010) the CIS-Q value is 6.6, that drops to 4.9 for the second campaign (year 2012).
This reduction was expected since in all the test sites the markings were not re-laid in this lapse of time (this was not requested by the project).
The performance of the paint dropped from 6.6 to 4.9 from the first to the second campaign demonstrating its low service time. On the contrary, thermoplastic maintained quite adequate performance (from 5.9 to 5.2); its low Qd (due to the fact that under the action of the tyres the colour of this
Table 4. Summary of the Two Measurements Campaigns
RLD (mcd/lux m2) RLw (mcd/lux m
2) Qd (mcd/lux m
2) SRT (-) Colour Test Site Score Sj
Test Site CODE First
Round
Second
Round
First
Round
Second
Round
First
Round
Second
Round
First
Round
Second
Round
First
Round
Second
Round
First
Round
Second
Round
W-T-S-L-002 589 34 55 1 198 126 42 52 ok ok 8.8 6.6
W-TC-S-L-003 126 55 34 4 179 114 47 62 ok ok 8.8 6.6
W-TC-S-L-004 132 73 36 4 136 106 63 58 ok ok 8.2 6.4
W-P-R-L-005 44 16 11 6 160 68 39 60 ok ok 6.0 3.3
W-TH-R-M-006 139 107 28 3 123 86 49 51 ok ok 6.9 5.0
W-TP-S-H-007 40 N.A.* 29 N.A.* 155 N.A.* 48 N.A.* ok ok 7.4 N.A.*
W-P-S-H-008 40 N.A.* 17 N.A.* 113 N.A.* 43 N.A.* ok ok 5.7 N.A.*
W-P-R-M-009 31 32 16 3 113 119 37 35 ok ok 6.4 5.4
W-TH-R-L-010 130 102 37 13 109 86 55 53 ok ok 6.8 5.0
W-TH-O-L-011 100 67 26 12 97 78 49 55 ok ok 5.6 4.6
W-P-L-M-012 25 10 14 0 107 79 41 44 ok ok 5.3 3.5
W-TC-R-H-013 98 24 30 2 155 97 40 40 ok ok 7.5 4.6
W-O-R-M-014 77 32 18 6 120 86 61 53 ok ok 7.4 4.7
W-TC-R-M-015 99 35 24 2 119 106 52 50 ok ok 7.0 6.0
W-P-S-H-016 24 29 12 1 200 143 31 36 ok ok 7.1 6.2
W-P-R-H-017 46 29 20 6 152 106 51 51 ok ok 8.1 5.9
W-P-S-M-018 25 21 6 3 98 93 42 56 ok ok 4.6 5.5
W-P-S-L-019 27 21 7 3 124 109 49 40 ok ok 6.4 5.2
W-P-R-L-020 24 16 15 1 177 72 48 32 ok ok 8.3 2.6
W-TC-R-L-021 35 19 12 1 94 80 43 46 ok ok 5.0 4.4
W-TH-S-M-022 84 53 30 2 80 81 51 52 ok ok 5.1 4.8
W-O-S-M-023 117 54 23 4 89 96 52 53 ok ok 5.1 5.5
W-TP-S-M-024 20 39 2 2 135 121 45 51 ok ok 6.9 6.6
W-TH-S-L-025 166 120 37 9 89 104 48 61 ok ok 5.1 6.7
W-P-R-L-026 67 38 31 11 215 109 47 57 ok ok 8.6 6.3
W-TC-S-M-027 64 30 9 1 85 78 48 49 ok ok 4.7 3.9
W-TC-R-H-028 70 21 19 4 89 67 42 68 ok ok 4.6 4.1
*N.A. measure Not Available due to the high consumption of the markings.
Table 5. Material Average Score for the Two Campaigns
Paint Two-Component Tapes Thermoplastic Others
FIRST CAMPAIGN 6,6 6,5 7,9 5,9 6,3 Material avg score SM
SECOND CAMPAIGN 4,9 5,1 6,6 5,2 5,1
16 The Open Transportation Journal, 2013, Volume 7 Asdrubali et al.
material turns quickly to greyish because of its roughness) kept the SM under 6.0.
Tapes are the only type of material characterized by a SM
higher than 6.0 both in the first and in the second measurement campaign.
The results of the two measurement campaigns showed that the current system of road marking management in the Municipality of Perugia does not allow both fulfilling the requirements of its own tenders and achieving adequate performance (in terms of CIS-Q) because of:
• lack of technical/instrumental control: before RENAISSANCE Project the road markings staff of the Municipality of Perugia did not perform any instrumental control on the horizontal markings;
• intensive use of pre-mixed paint: the measurement carried out during the project demonstrated that this kind of material, even if freshly applied, cannot reach sufficient levels of performance in terms of night visibility. Night visibility is the most important parameter, especially for roads without illumination. Moreover the performance of paint drops quickly.
4. DEVELOPMENT OF A TOOL FOR THE ECONOMIC MANAGEMENT OF ROAD SURFACE
MARKINGS
4.1. Methodology
Together with the assessment of technical performance of horizontal road markings, a part of the research dealt with the economic aspects related to their management, a significant issue for public administrations. At present a proper correlation between the technical performance (CIS-Q) and the proposed economic method (CIS-C) cannot be applied. This is mainly due to lack of data related to the time-dependence of road markings performance on urban road networks.
Thanks to the experience gathered within the Project, a new indicator, named CIS-C (CIVITAS indicator for stripes – Cost), was defined with the aim of giving a ratio between the annual budget allocated by the Municipality for road markings maintenance and the budget needed to keep road markings efficient :
CIS C [%] =AAB [ ]
ABEM [ ] 100 (eq. 9)
where:
• AAB is the ANNUAL ALLOCATED BUDGET: it is the budget that the Municipality invests for road markings maintenance in one year. It can be taken from public tenders without considering discount biddings;
• ABEM is the ANNUAL BUDGET FOR EFFICIENT MARKINGS: it represents the annual budget that the Municipality should invest to keep road markings efficient (that is retroreflection in dry conditions RLD higher than 100 mcd/lux m
2). Only retroreflection
was considered, because in the Literature there are not data concerning the time variation of the other
parameters and service life is always considered only in terms of retroreflection.
The budget required to the Municipality of Perugia to keep efficient the horizontal marking (ABEM) was estimated considering:
• the whole length of the road network managed by the Municipality of Perugia;
• an estimation of the surface covered by stop, give way and other signage in the road network;
• the type and cost of the material used for the horizontal markings.
Information about the road network managed by the municipality was taken from the “Special Public Tender for Road Markings” of the Municipality for the year 2012. The length of the road network can be split in:
• 254 km of urban roads;
• 219 km of extra-urban roads.
Considering the average size of each horizontal marking type (stripes, pedestrian crossing, give way, etc.) given by the Italian Rules of the Road [29], the surface covered by horizontal signage in the Municipality of Perugia was estimated equal to 211,557 m
2.
Data about costs of the common material used in Italy for the horizontal markings were taken from the price list of ANAS
§ [24] without considering discount biddings. With the
exception of paint (that does not require elimination), the cost of each material comprises the cost needed for its mechanical elimination.
Negative externalities in terms of citizens’ time loss created by the application of the horizontal marking were not considered. Their effects grow as the service life of the signage decreases.
The service life of the horizontal markings (number of months in which the retroreflection in dry conditions RL higher than 100 mcd/lux m
2) was evaluated analysing the
scientific Literature [30, 31], especially of the USA, and the results of the activities carried out within RENAISSANCE Project.
The estimation of the budget that should be allocated by the Municipality of Perugia to keep efficient the horizontal markings for 1 year (ABEM, Annual Theoretical Cost) was finally calculated:
ABEM [ ] = Cii=1
3
(eq. 10)
where:
• ABEM Annual Budget for Efficient Markings [ ];
• Ci is the cost needed to keep efficient the ith
type of horizontal markings (1:centre lines, 2: side lines, 3: pedestrian crossings, stop signs, give way signs and others) [ ].
§Italian government-owned company deputed to the construction and
maintenance of Italian motorways and state highways under the control of
Italian Ministry of Infrastructure and Transport.
Assessment of the Performance of Road Markings in Urban Areas The Open Transportation Journal, 2013, Volume 7 17
The evaluation of the Ci was made through the following equation:
Ci[ ] = Si Pij MCijj=1
n
12
SLj
(eq. 11)
where:
• Si is the length [m] of the road network for centre and side lines (I = 1, 2) or the surface [m
2] covered by the
other signs (stop, give way and pedestrian crossings);
• N is the number of materials used for the horizontal markings (data collected from the Municipality of Perugia);
• Pij is the usage percentage of the jth
material for the ith
kind of signs (data collected from the Municipality of Perugia);
• MCij (Material Cost) is the cost of the jth
material for the i
th kind of signs [ /m for centre and side lines,
/m2 for other signs];
• SLj (Service Life) is the life time of the jth
material [months]. 12/SLj represents how frequently the signage should be replaced every year.
4.2. Results and Discussion
ABEM (ANNUAL BUDGET FOR EFFICIENT MARKINGS) for the Municipality of Perugia was defined using equations 10 and 11. The current value of ABEM is equal to 1,130,148 . It is very high, due to the wide extension of the road network.
In 2010 the budget allocated by the Municipality of Perugia (AAB) was 66,967 , so for the same year the value of CIS-C was of:
CIS-C [%]=(AAB [ ])/(ABEM [ ]) x100=(66,967 )/(1,130, 148 ) x100= 5.9%
It means that the allocated budget allows maintaining in good conditions only 6 % of road markings on the road network managed by the Municipality of Perugia.
This result shows very clearly the difficulty in managing the road markings in a huge territory like the one of Perugia.
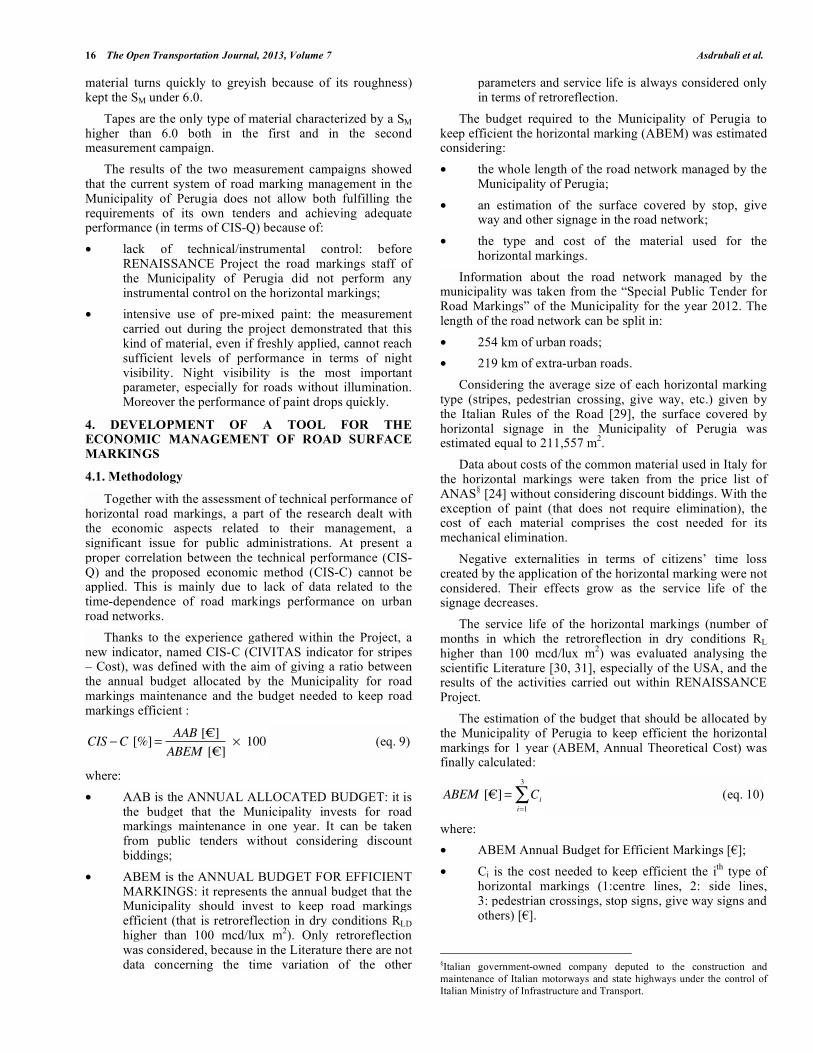
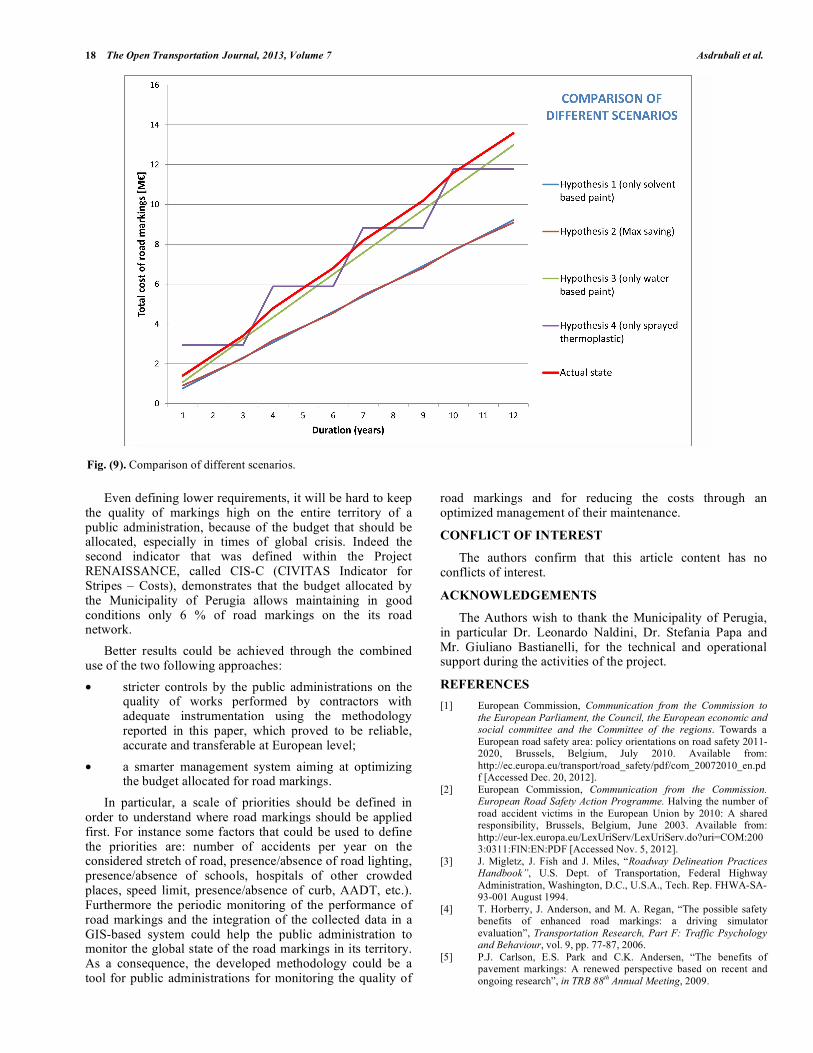
Besides the needed annual budget, it is important to evaluate how it can vary considering different selections of materials to be used for the markings. Therefore several scenarios were considered and compared for long time periods (12 years), in order to take into account the different service lives of the materials.
The procedure for calculating the costs has considered the effective amount of money that the administration should spend each year. If a material has a service life of three years, the expense is referred only to the first year and is zero for the two following years.
For instance, different scenarios could be evaluated varying the percentage of materials used (Fig. 9). The “max saving” option is referred to the use of the most economic materials for each road signage type (solved based paint for stripes and sprayed thermoplastic for other signals).
The results of the study suggest some useful considerations:
• the most economic material for stripes is solved based paint, that is now being replaced by water based paints, more expensive but not toxic at all;
• the most economic material for other signal in the long period (after 12 years) is the sprayed thermoplastic.
Nevertheless some important remarks must be done:
• the negative externalities (e.g. the time lost in queue by the drivers) were not considered in the calculation: lower service lives correspond to higher externalities (paint has the lowest service life);
• the only performance parameter considered was retroreflection RL, while at urban level the reflection in daylight condition Qd is equally (or more) important;
• the service life and the performance of the materials were mainly taken from studies conducted in the USA by the Departments of Transportation of several Federal States. The data refers to materials and conditions slightly different from those used in Europe; in particular these data can be hardly applied at urban level.
5. CONCLUSIONS
The research aimed at developing a new methodology for the evaluation of road markings quality both in terms of operational performance (visibility and skid resistance) and maintenance (durability and costs). The activities were carried out within the framework of the EU FP7 funded project CIVITAS Plus “RENAISSANCE” by CIRIAF-University of Perugia, in cooperation with the Municipality of Perugia.
Two experimental campaigns were carried out in 28 selected sites within the municipality of Perugia, in order to develop an innovative indicator, called CIS-Q (CIVITAS Indicator for Stripes – Quality). It rates the quality of the road markings of a municipality through a single number (from 0 to 10).
For the first measurement campaign (year 2010) the CIS-Q value is 6.6, that falls to 4.9 for the second campaign (year 2012). This reduction was expected since in all the test sites the markings were not re-laid in this lapse of time.
The CIS-Q procedure considers the requirements given by the international standards (in Europe EN 1436) for road markings performance, which derive from studies conducted on visibility of markings on highways. It should be observed that these requirements should be revised in order to be applied on urban roads. New requirements in terms of visibility should be lower than the current ones for several reasons (lower speed limits, lower AADT, more diffuse presence of road lighting, etc.). So new studies should be conducted in order to define how the performance of markings varies with time on urban roads. In this way it could be possible to select the appropriate material for each scenario (based on pavement, AADT, presence of lighting, etc.). Moreover the lack of data related to technical performance at urban level do not allow to perform proper cost-benefit analysis.
18 The Open Transportation Journal, 2013, Volume 7 Asdrubali et al.
Even defining lower requirements, it will be hard to keep the quality of markings high on the entire territory of a public administration, because of the budget that should be allocated, especially in times of global crisis. Indeed the second indicator that was defined within the Project RENAISSANCE, called CIS-C (CIVITAS Indicator for Stripes – Costs), demonstrates that the budget allocated by the Municipality of Perugia allows maintaining in good conditions only 6 % of road markings on the its road network.
Better results could be achieved through the combined use of the two following approaches:
• stricter controls by the public administrations on the quality of works performed by contractors with adequate instrumentation using the methodology reported in this paper, which proved to be reliable, accurate and transferable at European level;
• a smarter management system aiming at optimizing the budget allocated for road markings.
In particular, a scale of priorities should be defined in order to understand where road markings should be applied first. For instance some factors that could be used to define the priorities are: number of accidents per year on the considered stretch of road, presence/absence of road lighting, presence/absence of schools, hospitals of other crowded places, speed limit, presence/absence of curb, AADT, etc.). Furthermore the periodic monitoring of the performance of road markings and the integration of the collected data in a GIS-based system could help the public administration to monitor the global state of the road markings in its territory. As a consequence, the developed methodology could be a tool for public administrations for monitoring the quality of
road markings and for reducing the costs through an optimized management of their maintenance.
CONFLICT OF INTEREST
The authors confirm that this article content has no conflicts of interest.
ACKNOWLEDGEMENTS
The Authors wish to thank the Municipality of Perugia, in particular Dr. Leonardo Naldini, Dr. Stefania Papa and Mr. Giuliano Bastianelli, for the technical and operational support during the activities of the project.
REFERENCES
[1] European Commission, Communication from the Commission to
the European Parliament, the Council, the European economic and social committee and the Committee of the regions. Towards a
European road safety area: policy orientations on road safety 2011-2020, Brussels, Belgium, July 2010. Available from:
http://ec.europa.eu/transport/road_safety/pdf/com_20072010_en.pdf [Accessed Dec. 20, 2012].
[2] European Commission, Communication from the Commission. European Road Safety Action Programme. Halving the number of
road accident victims in the European Union by 2010: A shared responsibility, Brussels, Belgium, June 2003. Available from:
http://eur-lex.europa.eu/LexUriServ/LexUriServ.do?uri=COM:200 3:0311:FIN:EN:PDF [Accessed Nov. 5, 2012].
[3] J. Migletz, J. Fish and J. Miles, “Roadway Delineation Practices Handbook”, U.S. Dept. of Transportation, Federal Highway
Administration, Washington, D.C., U.S.A., Tech. Rep. FHWA-SA-93-001 August 1994.
[4] T. Horberry, J. Anderson, and M. A. Regan, “The possible safety benefits of enhanced road markings: a driving simulator
evaluation”, Transportation Research, Part F: Traffic Psychology and Behaviour, vol. 9, pp. 77-87, 2006.
[5] P.J. Carlson, E.S. Park and C.K. Andersen, “The benefits of pavement markings: A renewed perspective based on recent and
ongoing research”, in TRB 88th Annual Meeting, 2009.
Fig. (9). Comparison of different scenarios.
Assessment of the Performance of Road Markings in Urban Areas The Open Transportation Journal, 2013, Volume 7 19
[6] T. Miller, “Benefit-Cost Analysis of Lane Marking”,
Transportation Research Record, vol. 1334, pp. 38-45, 1992. [7] X. Sun and O.V. Tekell, “Impact of Edge Lines on Safety of Rural
Two-Lane Highways”, Louisiana Transportation Research Center, Baton Rouge, Louisiana, U.S.A, LTRC Rep. 414, 2005.
[8] R.A. Retting, H.W. McGee and C.M. Farmer, “Influence of Experimental Pavement Markings on Urban Freeway Exit-Ramp
Traffic Speeds”, Transportation Research Record, vol. 1705, pp. 116-121, 2000.
[9] R. Elvik, “Strengthening incentives for efficient road safety policy priorities: The roles of cost–benefit analysis and road pricing”,
Safety Science, vol. 48, pp. 1189–1196, 2010. [10] J. Kopf, “Reflectivity of pavement markings: Analysis of
retroreflectivity degradation curves”, Washington State Department of Transportation, Olympia, Washington, U.S.A., Rep.
WA-RD 592.1, September 2004. [11] J.L. Ethen and H.L. Woltman, “Minimum Retroreflectance for
Nighttime Visibility of Pavement Markings”, Transportation Research Record, vol. 1093, pp. 43-47, 1986.
[12] J.R. Graham and L.E. King, “Retroreflectivity Requirements for Pavement Markings”. Transportation Research Record, vol. 1316,
pp. 18-23, 1991. [13] J.R. Graham, J.K. Harrold and L.E. King, “Pavement Marking
Retroreflectivity Requirements for Older Drivers”, Transportation Research Record, vol. 1529, pp. 65-70, 1996.
[14] F.E. Loetterle, R.A. Beck and J. Carlson, “Public Perception of Pavement Marking Brightness”, Transportation Research Record,
vol. 1715, pp. 51-59, 2000. [15] European Committee for Standardization, CEN/TC 226 - Road
equipment: EN 1436:2007+A1:2008, “Road marking materials - Road marking performance for road users”, 2007-2008.
[16] P. Carlson, J. Miles, M. Pratt and A. Pike, “Evaluation of wet-weather pavement markings”, Texas Department of Transportation,
Austin, Texas, U.S.A., Rep. FHWA/TX-06/0-5008-1, 2005. [17] N.A. Parker and M. Meja, “Evaluation of the Performance of
Permanent Pavement Marking”, Transportation Research Record, vol. 1824, pp. 123-132, 2003.
[18] H.S. Lee and H.U. Oh, “Minimum retroreflectivity for pavement markings by driver’s static test response”, Journal of the Eastern
Asia Society for Transportation Studies, vol. 6, pp. 1089 - 1099, 2005.
[19] G. Bahar, M. Masliah, T. Erwin, E. Tan and E. Hauer, “Pavement marking materials and markers: real-world relationship between
retroreflectivity and safety over time”, Transportation Research
Board, Washington, D.C., U.S.A., Final Report for NCHRP Project
17-28, April 2006. [20] Civitas Renaissance. Available from: www.civitas-renaissance.eu
[Accessed Nov. 5, 2012]. [21] T. Martin, J. Perrin, S. Jitprasithsiri and B. Hansen, “A
Comparative Analysis of the Alternative Pavement Marking Materials for The State of Utah”, August 1996. Available from:
http://www.trafficlab.utah.edu/documents/UDOTfin.pdf [Accessed Nov. 7, 2012].
[22] H. Fu and C.G. Wilmot, “Assessing Performance of Alternative Pavement Marking Materials”, Louisiana Transportation Research
Center, Baton Rouge, Louisiana, U.S.A, Tech. Assist. Rep. 08-4TA, August 2008.
[23] Y. Jiang, “Durability and retro-reflectivity of pavement markings (synthesis study)”, Joint Transportation Research Program, Indiana
Department of Transportation and Purdue University, West Lafayette, Indiana, Rep. FHWA/IN/JTRP-2007/11, January 2008.
[24] Available from: http://www.serravalle.it/doc/48lavori_appalti_9PA RTE_Tecnica_Elenco_Prezzi. pdf, [Accessed Dec. 12, 2012].
[25] European Commission “COST 331. requirements for horizontal road marking. final report of the action”, Brussels, Belgium, May
1999. Available from: ftp://ftp.cordis.europa.eu/pub/cost-transport/ docs/331-en.pdf [Accessed Nov. 7, 2012].
[26] Zehntner GmbH Testing Instruments, ZRP 6030 Retroreflecto-meter Manual. Available from: http://www.zehntner.com/products
/categories/retroreflection/zrp-6030#downloads, [Accessed Nov. 9, 2012].
[27] F. Asdrubali, C. Buratti, E. Moretti, F. D'Alessandro and S. Schiavoni, “A new methodology to assess the performance of road
surface markings”, in 2nd International Conference on Road and Rail Infrastructures, Dubrovnik, Croatia, 7-9 May 2012, pp. 169-
175. [28] International Workshop on Road Safety and Markings, Perugia,
Italy, May2012. Available from: http://www.civitas-initiative.org/ index.php?id=12&event_id=467 [Accessed Nov. 30, 2012].
[29] Available from: http://www.aci.it/i-servizi/normative/codice-della-strada.html [Accessed Nov. 9, 2012].
[30] J. Migletz, and J. Graham, “Long term Pavement Marking Practices”, Transportation Research Board, Washington, D.C.,
U.S.A., NCHRP Synthesis 306, 2002. [31] D. Montebello and J. Schroeder, “Cost of pavement marking
materials”, Minnesota Department of Transportation, St. Paul, Minnesota, U.S.A., Rep. 2000-11, March 2000.
Received: December 4, 2012 Revised: December 28, 2012 Accepted: January 3, 2013
© Asdrubali et al.; Licensee Bentham Open.
This is an open access article licensed under the terms of the Creative Commons Attribution Non-Commercial License (http://creativecommons.org/licenses/by-nc/3.0/) which permits unrestricted, non-commercial use, distribution and reproduction in any medium, provided the work is properly cited.