the oil price crisis of - oxford institute for energy studies reasons are: (a) oil inventories have...
TRANSCRIPT

OXFORD INSTITUTE
The Oil Price Crisis of 1998
Robert Mabro
Oxford Institute for Energy Studies
SP10
1998
The Oil Price Crisis of 1998
Robert Mabru
Oxford Institute for Energy Studies
SP 10
1998

The contents of this paper are the author’s sole responsibility. They do not necessarily represent the views of the
Oxford Institute for Energy Studies or any of its Members.
Copyright 0 1998
Oxford Institute for Energy Studies (Registered Charity, No. 286084)
All rights reserved. No part of this publication may be reproduced, stored in a retrieval system, or transmitted in any form or by any means, electronic, mechanical, photocopying, recording, or otherwise, without prior permission of the Oxford Institute for Energy Studies.
This publication is sold subject to the condition that it shall not, by way of trade or otherwise, be lent, resold, hired out, or otherwise circulated without the publisher’s prior consent in any form or binding or cover other than that in which it is published and without a similar condition including this condition being imposed on the subsequent purchaser.
ISBN 1901795 07 1

CONTENTS
1. INTRODUCTION
2. OIL PRICES
3. OIL PRODUCTION AND CONSUMPTION
4. STOCKS
5.
6. POLICY PROPOSALS
OIL EXPORTERS' RESPONSES TO THE PRICE CRISIS
1
5
13
23
29
39
Tables
1. Export Prices of Saudi Arabian and Mexican Crudes Corresponding to the Lowest Reference Prices Obtained in March 1998. US Dollars per Barrel. 5
2. Hypothetical Net Revenues for Saudi and Mexican Crudes for Dated Brent Prices of $1 1.30 and $17.00 per Barrel. March 1998 Pricing Formulae. US Dollars per Barrel. 6
3. Price Differentials between Second and First Month, and Sixth and First Month on the NYMEX. August 1997 - April 1998. US Dollars per Barrel. 10
4. Crude Oil Stocks in the US PADD 2 and the Price Term Structure in NYMEX. 1997-1998. Million Barrels and US Dollars per Barrel. 11
5 . Differences in Oil Production Levels by OPEC Member Countries. 1996-97 and 1997-98 Q1. Million Barrels per Day. 15
6 . Stocks Held by Industry, OECD Countries. 1993-1997. Million Barrels and Consumption Days. 24
Figures
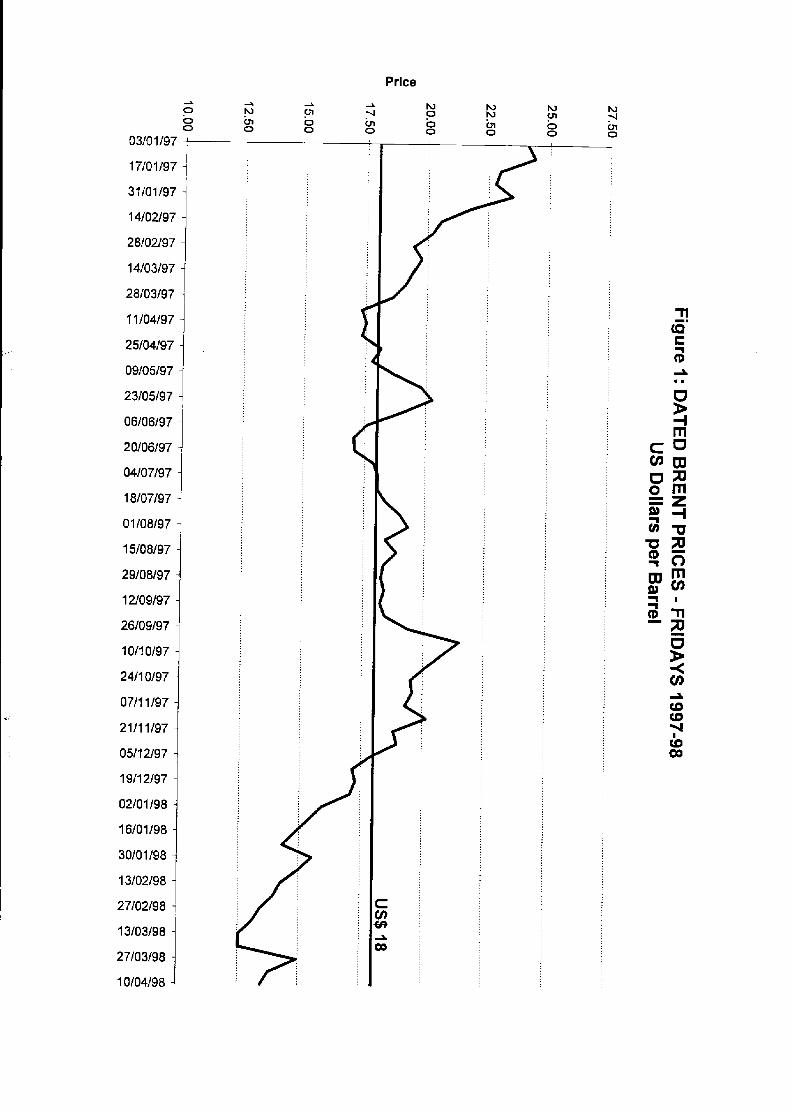
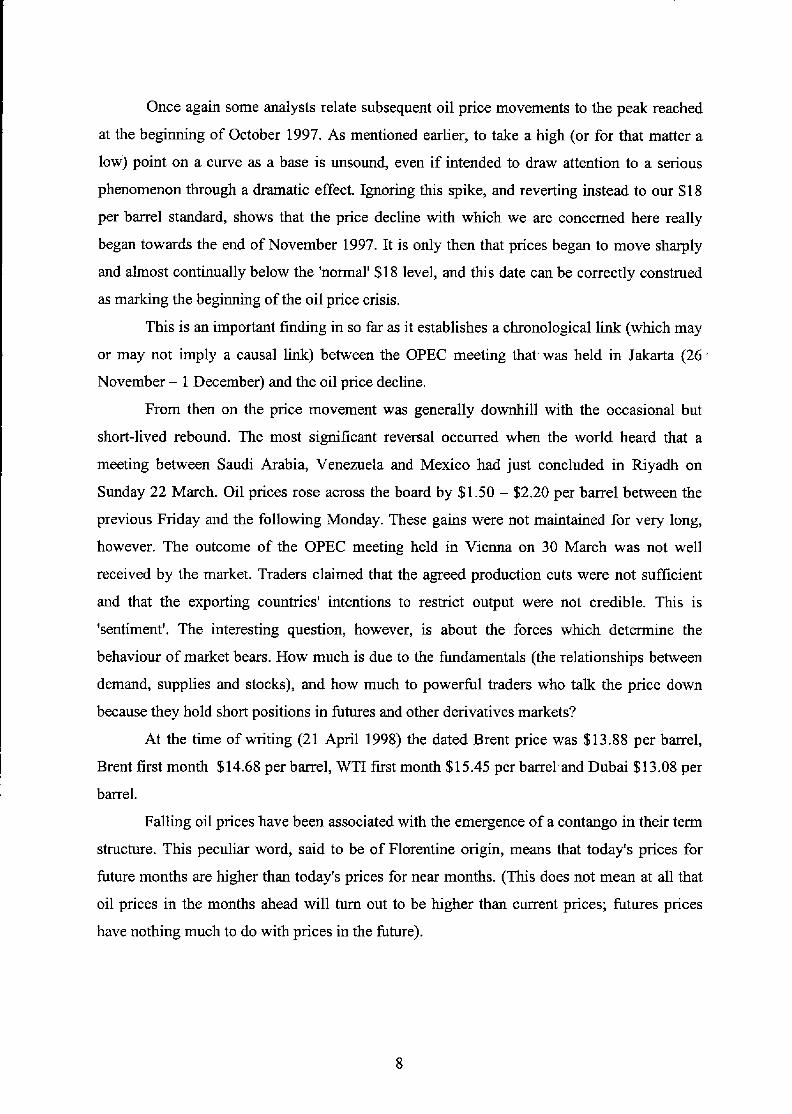
1. Dated Brent Prices - Fridays 1997-98. US Dollars per Barrel. 7
1. INTRODUCTION
Oil prices have fallen since the end of November 1997 well below a level of $18 per barrel
for dated Brent which petroleum-exporting countries and oil companies have been recently
inclined to consider as a kind of acceptable norm. The fall in price has elicited rather speedily
a producers' response which involved both OPEC and non-OPEC countries.
Exporting countries, and more generally, the industry have much to learn from oil
developments of recent months. Lessons can be derived from an analysis of the causes of the
oil price fall, of the role of contangos and the building-up of inventories, of producers'
reactions and the ways in which oil dipIomacy works or does not work, and of the market
response to producers' policy initiatives and decisions.
An opportunity has now arisen for oil-exporting countries, both from within and
outside OPEC, to re-think the framework and substance of their co-operative policies. Their
current approach to the problem of weak prices is not very efficient. Furthermore, the oil
price crisis may prove deeper than initially thought and may remain immune for a whle to
the remedy which OPEC and other oil-exporting countries are trying to apply.
The reasons are: (a) Oil inventories have been built up to high levels, albeit not as
high as the current conventional wisdom wants us to believe, and (b) All the signs are that the
Asian economic situation, further aggravated by enduring stagnation in Japan, will not
improve for a long time, The adverse impact of the economic crisis on the demand for oil in
the region that was the engine of growth of world petroleum consumption in recent years
should not be underestimated.
The speed with which oil-exporting countries expressed concern about the behaviour
of prices, and began to take negotiating initiatives reveal that they perceive themselves very
vulnerable - albeit for different sets of reasons depending on the circumstances of the country
- to a significant fall in government revenues. Ths perception of their own vulnerability may
well prompt them into fbture action if the oil price crisis shows no sign of receding in the
near future. The problem does not seem to lie primarily in the lack of will to address the price
situation. The mind set which determines the conception of policy has been shaped by old
experiences and traditional ways of approaching problems. This mind set is far too rigid and
does not appear to be sufficiently relevant to the challenges posed by the oil market.
1

There is no doubt that the petroleum-exporting countries and the oil companies
brought upon themselves the price crisis through the blind pursuit of expansionary production
policies. When revenues constitute the significant objective, producers must continually
assess the possible impact of increasing volumes on prices, and the effect of rising prices on
future production volumes. Seeking to increase market share without regard to the price
implications does not make sense except in very rare situations. The sobering thought which
the recent oil events must have elicited is that no oil-exporting country has the ability, that is
the financial resources and the political power, to engage in price wars.
When conflict is far too costly the rational alternative is to find co-operative solutions.
Today, OPEC no longer incIudes in its membership all the relevant exporting counties. It
only provides a partial framework for effective policy making. Imaginative ways need to be
found to secure the involvement of outside exporters in policy making without attaching them
to the Organisation with formal ties.
The co-operation issue does not concern large exporting countries exclusively. True,
their production policies can damage price behaviour. But production increases by small
producers, in aggregate, can also cause similar damages. And small producers are equally
vulnerable to the reduction in revenues stemming from a fall in price. They have a
fundamental interest in co-operating; not as we are often told to take a fiee ride.
To reduce the likelihood, or at least the intensity of future price crises, the exporting
countries need to improve their understanding of market behaviour and to develop the slulls
of how to talk to markets. A number of fallacies seem to affect correct understanding. It is
wrong to believe, for example, that nominations for lifting will reflect correctly the state of
actual demand when (say three months or longer after the nominations are made) these
lifiings reach the market. It is also unwise to focus on price levels and ignore the nature of the
prevailing term structure (contango or backwardation) in the market. Another fdlacy is to
believe that withholding information, say on production, investments or stocks, improves the
producer’s position vis-a-vis the market. Transparency pays much higher dividends.
Producers need to give attention to both economic fundamentals and market
‘sentiment’. Over-production in 1997 and early 1998 destroyed the balance of supplyldemand
fimdamentals. Jakarta had a negative impact on sentiment.
This paper purports to identify the causes of the current oil price crisis. We label it the
1998 crisis although its origins are found in the preceding year. This is not unusual as all
2

crises have their roots in a previous period. It then examines the movement of oil prices, the
evolution of the oil supply and demand balance, and the behaviour of inventories. An
important finding is that the forces which initially triggered the price downturn sometime in
1997 4 4 have worked adversely with increased momentum in 1998 Q1, that is precisely at
the time when producing countries were expressing concern about the crisis and working
towards the conclusion of some agreement.
The paper then describes the moves made by oil-exporting countries to reach an
accord on production cuts. The moves began in February 1998 and led to the Riyadh meeting
between Saudi Arabia, Venezuela and Mexico (21-22 March) and to the OPEC meeting in
Vienna (30 March). It assesses the moves and draws conclusions about the role of non-OPEC
producers and the nature of the agreement.
Finally we propose a number of ideas for exporters’ policies that are more effective
than the traditional OPEC approaches to prices and quotas without being necessarily more
difficult to design, agree upon and implement.
3

4

2. OIL PRICES
The prices of internationally traded oil have fallen in the first months of 1998 to levels which
have caused, and are still causing, much concern to both governments and companies
engaged in the upstream sector of the industry. The price of dated Brent - an important
marker for crude oil exports to Europe and some other parts of the world - hit a trough at
$1 1.29 per barrel on Tuesday 17 March 1998. On that same day the light sweet crude futures
contract (generally known as the WTI contract) traded at $12.98 per barrel on the NYMEX,
and the Dubai price - the marker for exports to Asia - fell below the $10 per barrel leveI for
the first time in a Iong while.
These very low prices of reference crudes correspond to the export prices for Saudi
Arabian and Mexican crudes shown (by type and destination) in Table 1.
Table 1: Export Prices of Saudi Arabian and Mexican Crudes Corresponding to the Lowest Reference Prices Obtained in March 1998. US Dollars per Barrel.
Destination To USA To Europe To Asia Crudes: Arabian Light $9.50 $9.40 $9.85 Arabian Medium 8.35 8.20 9.15 Arabian Heavy 6.95 7.30 8.10
Maya 6.3 1 -
Let us now compare the net government revenue per barrel that would accrue at the prices
shown in Table 1 with the net revenues that would have accrued at a $17 per barrel price for
dated Brent. We have chosen here a rather modest reference price. For the purposes of this
exercise, assume that costs of production average $1.50 per barrel, and that the price
differentials between Brent and WTI, and Brent and Dubai, are the same at $17 Brent as they
happened to be on 17 March. These hypothetical unit revenues computed on the basis of
March 1998 pricing formulae are shown in Table 2.
The data in Table 2 show that a fall in the price of dated Brent from $17 to $1 1.30 per barrel
(a fall of 33.5 per cent) results in unit revenue losses ranging from about 40 per cent to about
5

Table 2: Hypotheticd Net Revenues for Saudi and Mexican Crudes for Dated Brent Prices of $1 1.30 and $17.00 per Barrel. March 1998 Pricing Formulae. US Dollars per Barrel.
Des tin a tion To USA To Europe To Asia Crudes: Arabian Light $8 .OO/ 1 3.70 $7.90/13.60 $8.35/14.05 Arabian Medium 6.85112.55 6.70/12.40 7.65A3.35 Arabian Heavy 5.4511 1.15 5.80/11.50 6.60/12.30
Maya 4.8 m0.5 1 -
54 per cent, depending on crude type and destination. The proportional impact on unit
revenues of a price fall for an exporting country such as Saudi Arabia or Mexico is greater,
and in some instances significantly greater, than the percentage fall in prices. One needs to
remember that a one dollar fall in the price of oil represents a one dollar reduction in net unit
revenue, and therefore a larger relative fall since unit revenue is always a smaller number
than price.
The oil price crisis of 1998 naturally had its origins in 1997. Any assessment of the
magnitude of the price fall calls for the choice of an appropriate base for comparison. Some
analysts compare the current prices with those attained in 1996. This is misleading since a
comparison with 1996 involves the implicit assumption that that year was a 'normal' one.
Nobody ever believed that the high oil prices of the fourth quarter of 1996 were sustainable
over a long period; and the market at that time was expecting a correction to take place
sooner or later. To compare oil prices in most of 1997 and early 1998 with the peaks reached
in December 1996 and January 1997 over-dramatises the significance of the fall. Such
comparisons make sensationalist headlines but do not serve the purposes of meaningfhl
analysis.
Price fluctuations are better assessed against an average, a trend line or some number
generally perceived as representing a 'normal' level. The oil market performance over the past
five or six years suggests that a dated Brent price of about $18 per barrel provides a
reasonable basis for comparison. The use of this basis suggests that the post-1996 price
adjustment was completed by the end of March 1997. Figure 1 shows that oil prices, with the
inevitable small and short-lived ups and downs remained remarkably stable until early
September 1997, There was a spike which raised the dated Brent price to $21.48 per barrel on
3 October.
6
Price
0 0 ~
03101J97 ' I
17/01/97 i
3 110 1 19
14/02/9
2810U9
14/03/9
28JO319
1 1104l9'
2510419'
09/05/9
2310519;
0610619;
20/06/9;
0410719i
18/0?/9?
01 108197
15108197
29108197
12109197
26/09/97
1011 0197
2411 0/97
0711 1197
2111 1/97
05112197
1911 2/97
0210 1198
16/01/98
30101 198
13/02/98
27102198
13/03/98
27103198
1 0104198
Once again some analysts relate subsequent oil price movements to the peak reached
at the beginning of October 1997. As mentioned earlier, to take a high (or for that matter a
low) point on a curve as a base is unsound, even if intended to draw attention to a serious
phenomenon through a dramatic effect. Ignoring tlus spike, and reverting instead to our $18
per barrel standard, shows that the price decline with which we are concerned here really
began towards the end of November 1997. It is only then that prices began to move sharply
and almost continually below the 'normal' $18 level, and this date can be correctly construed
as marking the beginning of the oil price crisis.
This is an important finding in so far as it establishes a chronological link (whch may
or may not imply a causal link) between the OPEC meeting that was held in Jakarta (26
November - 1 December) and the oil price decline.
From then on the price movement was generally downhill with the occasional but
short-lived rebound. The most significant reversal occurred when the world heard that a
meeting between Saudi Arabia, Venezuela and Mexico had just concluded in Riyadh on
Sunday 22 March. Oil prices rose across the board by $1.50 - $2.20 per barrel between the
previous Friday and the following Monday. These gains were not maintained for very long,
however. The outcome of the OPEC meeting held in Vienna on 30 March was not well
received by the market. Traders claimed that the agreed production cuts were not sufficient
and that the exporting countries' intentions to restrict output were not credible. This is
'sentiment'. The interesting question, however, is about the forces which determine the
behaviour of market bears. How much is due to the fimdamentals (the relationships between
demand, supplies and stocks), and how much to powerful traders who talk the price down
because they hold short positions in futures and other derivatives markets?
At the time of writing (21 April 1998) the dated Brent price was $13.88 per barrel,
Brent first month $14.68 per barrel, WTI first month $15.45 per barrel and Dubai $13.08 per
barrel.
FalIing oil prices have been associated with the emergence of a contango in their term
structure. This peculiar word, said to be of Florentine origin, means that today's prices for
future months are higher than today's prices for near months. (This does not mean at all that
oil prices in the months ahead will turn out to be higher than current prices; futures prices
have nothing much to do with prices in the future).
8
A contango like a backwardation, its opposite, is subject to different, not necessarily
exclusive, interpretations. A contango may indicate the existence of excess supplies at the
near end of the market, and backwardation excess demand. Excess supplies depress prices. If
they depress current prices by larger amounts than future prices a contango may emerge.
Contangos have an influence on inventory demand when the price differential between the
current and a subsequent month is greater than the marginal cost of storage over that period
plus the opportunity cost of the working capital tied up by the additional stock. Thus, if the
contango between first and third month, for example, is US cents 70 per barrel, the marginal
cost of storage is US cents 40 per barrel for two months, the interest rate is 8 per cent per
annum (about 0.67 per cent per month), and the current oil price is $14 per barrel, the total
cost of storing a barrel of oil for two months would be US cents 40 + 18.50 = US cents 58.50.
Buying physical oil at current prices and hedging the purchase with a sale on the fitures
market would bring a profit of US cents 70 - 58.50 = US cents 11 S O per barrel if the
positions, both physical and in the futures market, are held for the two months.
The trader involved in such transactions in response to a contango may either close
the positions at maturity or earlier on, taking advantage of favourable price movements,
should they occur or roll them over. In any case there will be a temporary build-up of stocks.
Analysts sometimes say that contangos occur when stocks are high, and sometimes
that contangos cause a stock build-up. These views seem contradictory. In fact they can be
reconciled if we accept the proposition mentioned above that a contango emerges when there
are excess supplies. Since these are bound to end up in stocks, the observation that we have a
contango when stocks are high is correct but the interpretation misses one link in the chain. It
is excess supplies which initially cause stock levels to rise, and it is excess supplies which
depress prices at the near-end of the term structure, and ultimately may cause a contango to
obtain; and this, in turn provides an inducement to build stocks. A vicious circle is set in:
excess supplies through this causal chain create a situation in which new demand exceeds
consumption requirements and adds to stocks. Excess supplies lead to further excess supplies.
The contango feeds on itself until storage facilities, including tankers, become so full as to
raise the marginal cost of additional stocks to very high levels.
The term structure of prices on the NYMEX switched from backwardation to
contango in April 1997 but the price differentials between first and second months were small
9

Table 3: Price Differentials between Second and First Month, and Sixth and First Month on the NYMEX. August 1997 - April 1998. US Dollars per Barrel. Date Second Month minus Sixth Month minus
First Mun th First Month 1 August 1997 0.03 0.00 7 0.23 C 0.56 15 0.19 c 0.29 22 0.1 1 0.23 29 0.14 0.23 5 September 0.10 0.14 12 0.14 0.39 19 0.16 0.22 26 0.08 -0.05 3 October -0.17 -1.12 10 -0.02 -0.67 17 0.15 -0.20 24 0.09 -0.15 31 0.08 -0.3 1 7 November 0.17 -0.08 14 0.16 -0.3 1 21 0.16 0.20 28 0.20 c 0.44 5 December 0.27 C 0.66 12 0.22 c 0.72 19 0.24 C 0.84 26 0.13 0.53 2 January 1998 0.23 C 0.90 9 0.17 0.94 16 0.17 1.01 23 0.21 c 1.18 30 0.16 0.79 6 February 0.21 c 0.94 13 0.22 c 1.15 20 0.15 1.21 27 0.35 C 1.58 6 March 0.42 C 1.79 13 0.36 C 1.81 20 0.29 C 1.55 27 0.23 C 0.85
10 0.34 C 1.28 Note: C inchcates a significant contango greater than $0.18 per barrel between first and second month.
3 April 0.32 C 1.20
(between US cents 2 and US cents 13) throughout April and May. This differential was not
sufficient to induce stocking. A wider contango emerged in June (between US cents 20 and
10

US cents 30) and then only for a short whiIe in August. The contango on the NYMEX that
was both sustained and wide enough to encourage storage of oil and concomitant hedging on
the htures market did not appear until late November. It remained a feature of the term
structure of prices on the NYMEX throughout subsequent months as shown in Table 3.
In the Brent market the price differential between dated and first month is often much
wider than between first and second month on the NYMEX when a contango obtains. But
significant contangos appeared on the Brent market in the same periods as on the NYMEX,
that is in June and August for a short while, and then continuously since the end of
November 1997.
I have tested the hypothesis that the contango on the NYMEX tends to be associated
with a rise in oiI stock levels in the US PADD 2, the area where WTI is delivered or stored.
As stocks increased at the beginning of 1997 the initial backwardation whch was very large
(US dollars 0.52-0.98 in January) began to shrink in size until it tumed into a small contango
Table 4: Crude Oil Stocks in the US PADD 2 and the Price Term Structure in NYMEX. 1997-1 998. Million Barrels and US Dollars per Barrel. Month Crude Oil Stock (nab) Backwardation (B) Range
or Contango (C) Jan 97 62.5 B 0.52-0.98 Feb 64.2 B 0.16-0.38 M U 68.8 B 0.01 -0.15 APr 73.9 C 0.02-0.09 May 72.5 C 0.02-0.13 June 72.5 C 0.10-0.30 July 72.6 C 0.01-0.16 Aug 70.6 C 0.03-0.19 Sept 71.7 C 0.00-0.16 Oct 74.4 C 0.08-0.15 Nov 74.3 C 0.16-0.20 Dec 73.6 C 0.13-0.24 Jan 98 73.8 C 0.16-0.23
in April 1997. After that month the term structure of NYMEX prices continued to display a
contango (except for a few odd days) but there was no clear pattern between the size of the
price differentials and stock levels until October 1997 when the contango became wider and
then increased in size in subsequent months as the stock level in PADD 2 rose to around 74
million barrels.
11

12

3. OIL PRODUCTION AND CONSUMPTION
OiI-exporting countries and private oil companies - with some notable exceptions - have
been going on a ‘production binge’ in recent years. The exceptions, until late 1997, were
Saudi Arabia, Kuwait and the UAE, the three OPEC countries which voluntarily restricted
their production to the levels of quotas agreed within the Organisation in 1993. However, the
quotas for the UAE and Kuwait happened to be set fairly close (say at about 90 or 95 per
cent) to the productive capacity available to these countries, and this means that only Saudi
Arabia was carrying a significant volume of idle capacity. Another exception, of course, was
Iraq which is involuntarily restricted by UN sanctions.
That the maximisation of production is a desirable economic objective is a widely
held view in the world petroleum industry. The general validity of this proposition is subject
to important qualifications. The first is that rational economic agents seek to maximise net
profits (firms), or net revenues (governments of exporting countries which own the resource)
or national value added (governments of exporting countries, for example the UK, which do
not tax oil production heavily) and not production. There are few cases where the
maximisation of production happens to fulfil one or another of these objectives. This arises in
the case of profits if production does not affect prices (marginal revenue is constant),
marginal costs are constant and the maximum output is technically determined. The
maximisation of production only corresponds to the maximisation of government revenues if,
once again, production does not affect prices, and if the government’s unit take does not vary
with output.
These are rather stringent conditions. True, small producers considered individually
are price takers; but as in all industries producers taken together influence the course of prices
by their aggregate output decisions.
Not all oil producers are small. In any case even a small entity can sometimes
influence prices when its investments add production at the margin in volumes that may be
considered small in absolute terms but are large relatively to incremental demand. If country
X adds 300,000 b/d to world production through investments in new capacity t h s may only
represent 4.3 per cent of world output (70 mb/d) but 20 per cent of an incremental margin of
say 1 -5 mb/d.
13

rn
Small producers, in oil as in any competitive market, may have no choice but to act
individually as price takers. From time to time they will inevitably suffer the adverse impact
of faIling prices on revenues. In oil however the institutional mechanism for coordinating
decisions does exist. It may need an overhaul and changes in the definition of means and
objectives as well as a change in coverage. The fact remains, however, that the institution
exists. It is called upon, not only by member countries, to respond to a 'price crisis'. One
cannot say that the oil market is always truly competitive in the economics textbook sense.
The problem is that the existing institutional mechanism (OPEC) does riot seem capable of
preventing price crises, but is only able to respond to them with varying degrees of success
when they emerge.
The significant oil price fall of December 1997 to April 1998, which may well
continue to characterise the market for a while, delivers a very clear message to governments
of oil-exporting countries and petroleum companies alike. And the message is that
uncoordinated production increases may exact a heavy toll in terms of revenues for
governments and of cash flows for companies with interests in the upstream of the oil
business.
But what did happen to crude oil production in 1997 and early 1998?
According to Petrologistics, OPEC crude oil production evolved as follows (mb/d):
1996 I997 Jan-Mar 1998
25.780 27.223 28.468
These numbers are remarkably close to those given in the IEA Monthly Oil Market Report
(10 April 1998) which estimates OPEC crude oil production at 25.84 mb/d in 1996, 27.20
mb/d in 1997 and 28.55 mb/d in the first quarter of 1998. There is clearly dependence
between these two sources.
Middle East Economic Survey, Petroleum Argus and Petroleum Intelligence Weekly
have the following data:
I996 1997 Jan-Mar 1998
MEES 25.646 27.154 28.623
Argus 25.820 27.190 28.646
PIW 25.888 27.608 28.381
The differences between these estimates and those of Petrologistics (or for that matter
the very close ones published by the TEA) range between -1 34/+102 thousand barrels per day
14
for 1996, -69/+385 thousand barrels per day for 1997, and -87/+155 thousand barrels per day
for January to March 1998. The most significant deviation is the PIW estimate of 27.608
mb/d average production for 1997 which seems to be a large overstatement. I also have
doubts about most estimates for 1998 Q1.
I shall take the Petrologistics data as the basis for this analysis, not that they are
perfectly accurate (no source involving some judgements instead of primary material can ever
be), but they seem closer to reality than others because the estimates partly rely on tanker
movements.
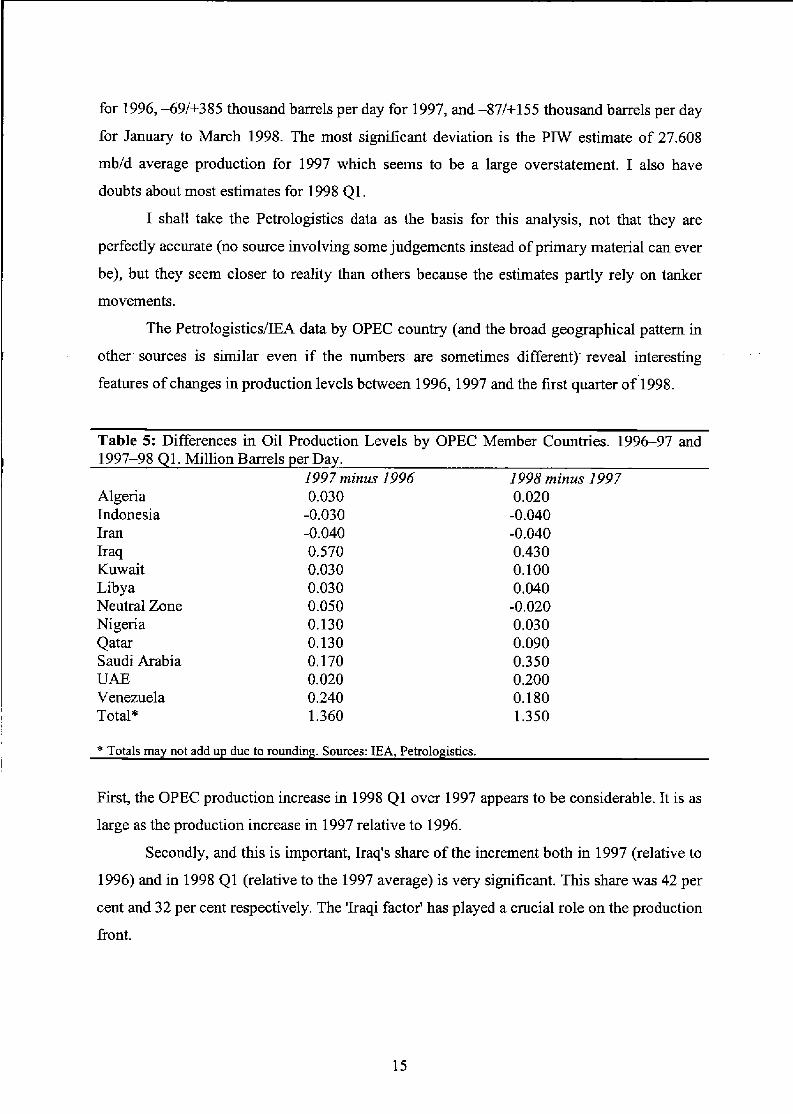
The PetrologisticsEA data by OPEC country (and the broad geographical pattern in
other sources is similar even if the numbers are sometimes different). reveal interesting
features of changes in production levels between 1996,1997 and the first quarter of 1998.
Table 5: Differences in Oil Production Levels by OPEC Member Countries. 1996-97 and 1997-98 Q1. Million Barrels per Day.
1997 minus 1996 1998 minus 1997 Algeria 0.030 0.020 Indonesia -0.030 -0.040 Iran -0.040 -0.040 Iraq 0.570 0.430 Kuwait 0.030 0.100 Libya 0.030 0 I 040 Neutral Zone 0.050 -0.020 Nigeria 0.130 0.030 Qatar 0.130 0.090 Saudi Arabia 0.170 0.350 UAE 0.020 0.200 V e n e z u e 1 a 0.240 0.180 Total* 1.360 1.350
* Totals may not add up due to rounding. Sources: IEA, Petrologistics.
First, the OPEC production increase in 1998 Q1 over 1997 appears to be considerable. It is as
large as the production increase in 1997 relative to 1996.
Secondly, and t h s is important, Iraq's share of the increment both in 1997 (relative to
1996) and in 1998 Q1 (relative to the 1997 average) is very significant. This share was 42 per
cent and 32 per cent respectively. The 'Iraqi factor' has played a crucial role on the production
front.
15

Thirdly, two OPEC countries (Indonesia and Iran) are losing ground as evidenced by
production falls in 1997 and early 1998. Furthermore, Libya and the Neutral Zone do not
seem able to move forward in a significant manner, and Nigeria's expansion in 1997 seems to
have lost steam in early 1998.
Fourthly, the Gulf countries which moved ahead in 1997 were Qatar (1 30,000 b/d
increase) and Saudi Arabia (170,000 b/d), but neither Kuwait nor the UAE, which in this
context really means Abu Dhabi, joined the party. The proportional increase in Qatar's output
was much higher (26.5 per cent) than Saudi Arabia's (2 per cent) in 1997.
Fifthly, Venezuela's absolute contribution to the increase in OPEC's production
(240,000 b/d) in 1997 was lower than the combined contribution of the Gulf countries (Saudi
Arabia, 170,000 b/d; UAE, 20,000 bld; Kuwait, 30,000 b/d; Neutral Zone, 50,000 b/d and
Qatar 130,000 b/d, making a total of 400,000 bld). Here again, the relative increase was
larger for Venezuela (8.2 per cent) than for the Gulf (3.1 per cent).
Finally, the apparent production increases in 1998 Q1 in which 32 per cent was
accounted for by Iraq, as mentioned before, also involved a 13 per cent element accounted for
by Venezuela, and a massive 53 per cent by the Gulf countries (Saudi Arabia, UAE, Kuwait
and Qatar), I say apparent production increases because of doubts about the validity of
numbers likely to have been biased by the reluctance of Saudi Arabia, Kuwait and the UAE
to admit that they did not produce amounts equivalent to the new quota levels decided upon
in Jakarta so soon after the conclusion of the agreement reached there.
An interesting concIusion emerges from this analysis. The c o m e of future OPEC
production depends on three different countries or set of countries: (a) Iraq, (b) Venezuela
and (c) the three critical Gulf countries, that is Saudi Arabia, Abu Dhabi, and Kuwait.
Indonesia, Iran and Libya are at best in a state of stagnation. Algeria, Qatar and Nigeria have
room for further increases but they are unlikely to prove very dramatic in the next two or
three years, The factors that will determine future production increases in the three cases
listed above are very different. For Iraq production increases depend on both political
(sanctions) and technical factors (ability to repair and expand capacity to the limits allowed
by UN resolutions). This is independent of prices. For Venezuela, the willingness to
implement planned increases in production to the stated objective of 6.0 mb/d in 2006 is not
totally independent from the behaviour of oil prices. If these remain low, the incentive to cut
production for revenue motives will emerge and the profitability of investments in certain
16
high-cost fields with very heavy oil reserves will be in question. The Gulf countries would be
inclined to subordinate their production policies to the actual or expected behaviour of oil
pnces.
It is clear that these restraints on the propensity to produce which may curb it in the
near hture did not operate in 1997. The reason is simple. Oil prices were high in late 1996
and early 1997, and the growth of the demand for oil, propelled by the Asian economic
miracle, inspired much confidence to exporting countries. Venezuela, and to a lesser extent
Algeria, Qatar and Nigeria steamed ahead with new investments.
Saudi Arabia, in a very unusual way, has been playing the role of fixed-volume
supplier, very different in essence fiom that of a swing producer who varies output according
to changes in world demand, since a big fixed-voIume producer does not mitigate the impact
of excess demand or supply whch emerges fiorn time to time on the worId market. Saudi
Arabia kept its production almost absolutely fixed at around 8 mb/d from 1992 to the first
half of 1997. At some point during this period Saudi Arabia began to observe that a small
number of OPEC countries, and many more outside OPEC, were benefiting from substantial
production increases. Appeals by Saudi Arabia, Iran and some others to those OPEC
members who were exceeding their quotas fell on deaf ears.
To see others increasing production while you are staying put is not a pleasant
experience. To frequently hear statements fiom Venezuela and other OPEC members
boasting about their expansionary production plans and the merits of their policies can be
irritating. And to read month after month throughout 1995 and 1996 in the IEA Month& Oil
Market Report that non-OPEC production will increase in the year in question by 2.0 mb/d
or more (although, the actual increase turned out to be much lower than the stubborn
prediction) is very disturbing.
Sooner or later Saudi Arabia was bound to respond. The reaction involved two stages.
The first was to increase production during 1997. The change in policy was not advertised.
Until November 1997 there were no apparent moves to induce customers to lift more than they initially wanted either by persuasion or by offering discounts. And Saudi officials
genuinely believed that accepting nominations for liftings which put production above the
OPEC quota would not have adverse effects on prices because they were simply 'meeting
demand'.
17

The second stage was to propose an increase in quotas at the November 1997 OPEC
Conference of Oil Ministers held in Jakarta. One intention was to legalise the actual
production policy followed in the preceding months. The Saudi agenda may have involved
other considerations: (a) a signal to Venezuela and more generally to other non-OPEC
countries that the output restraint shown by Saudi Arabia in recent years could not be taken
for granted for ever (b) to restore some credibility to the OPEC quota system which had lost
much of its validity through repeated roll-overs (c) to secure a higher production base line
from which to move downward should the easing of oil sanctions on Iraq require OPEC to
reduce its production.
Saudi Arabia genuinely believed that increased production on the basis of its
proposals to the Jakarta meeting would not have an adverse impact on prices because world
oil demand had recently proved to be much more, and non-OPEC production less, buoyant
than generally predicted.
It does not seem, however, that it took into consideration the following factors:
- The agreed increase in quotas would lead to an OPEC production level higher than the new ceiling because some countries such as VenezueIa, Nigeria or Qatar were already producing in excess of the new quotas and were unlikely to curtail their output as a result of the Jakarta agreement.
- The supply side of the oil equation had radxally changed between 1996 and 1997 with the resumption of Iraqi oil exports at the average rate of some 600,000 barrels per day. This factor reduced significantly the room for expansion that would have been othenvise available to other producers.
- There had been a big increase in OPEC production in October 1997, partly due to fluke (an unusual spurt in ban), partly to Iraq making up for its refusal to export in two earlier months, partly to the new Saudi policy of increasing its own production. This additional oil inevitably reached the market during, or just after, the Jakarta meeting and weakened prices at an unfortunate time.
- The Asian economic crisis was having an adverse effect on the consumption demand for oil in the very region which had been driving the expansion in recent times.
- The emergence of a contango in the term structure of oil prices created a desire to build up inventories which may have reassured producing countries about the strength of demand. But inventory is different from consumption demand in a fundamental way since it creates a source of future supplies outside the producers' control.
18

- A final, but important point is that nominations for IiAing do not necessarily correspond to the level of demand that will materialise when the liftings reach the market. They are based on predictions and expectations which can prove to be wrong.
Jakarta generated its own momentum. When you have successfully persuaded your
colleagues at the end of November about the rationale of higher quotas to be implemented
fiom 1st January, it is difficult to admit only one month later that your production has not
reached this new quota level. In any case you will also try to reach this quota, productive
capacity permitting, through aggressive marketing tactics (their success, however, cannot be
taken for granted).
For these reasons, one feels uncomfortable with the production estimates for 1 998 Q 1.
The respondents to oil reporters' enquiries had stronger incentives to overstate output levels
in January - March 1998 than in other periods. Another reason that may have motivated
overstatements at least in February and March 1998 is that by this time the main oil-exporting
countries had come to accept the idea that production cuts if they were going to be agreed
would have to apply to actual output levels and not quotas. This by itself provides a strong
incentive for overstating the output position.
The important questions are: was there a surplus of supply over consumption demand
in 1997 and in 1998 Q1 and what was the size of these surpluses?
The IEA estimated the increase in world oil demand (consumption) at 1.90 mb/d in
1997 relative to 1996. I think however that the E A overestimated the oil demand level in
Asia in 1998 4 4 and that the 1997 world demand increase was probably closer to 1.75 mb/d . As regards non-OPEC supplies, the IEA estimates the 1997 increase over 1996 at 0.70
mb/d. We have different estimates for the OPEC crude oil output increases. The data
presented earlier on yield the following estimates:
Petrologistics 1.44 mb/d
MEES 1.51 mb/d
Argus 1.37 mb/d
PIW 1 -72 mb/d
I have already stated a preference for the Petrologistics approach which relies partly on
tankers and partly on telephone interviews while other sources are entirely dependent on the
telephone. Excess supplies in 1997 can thus be computed as:
19
1.44 mb/d (OPEC crude) + 0.15 mb/d (OPEC NGLs) + 0.70 mb/d (non-OPEC supplies) - 1.75 (demand) = 0.54 mb/d
Had we taken the IEA estimates throughout we would have obtained an estimate of
excess supplies of
1.4 (OPEC crude) + 0.2 (OPEC NGLs) + 0.70 (non-OPEC supplies) - 1.9 (demand) = 0.40 mb/d
We have erred on the high side (albeit not as high as the PIW estimates of OPEC
output would have taken us) in order to make the a fortiori case that even in this approach the
inventory build-up of 1997 could not have been as high as claimed by many observers
nowadays. An average excess supply of 540,000 barrels per day throughout the year would
cause a stock build-up of 200 million barrels by the end of 1997. (The IEA data would give
146 million barrels).
From 1998 Q 1 , I take the IEA estimate of non-OPEC production given as 45 .O mb/d,
an estimate of 2.8 mb/d for OPEC NGLs. I shall assume that because of a mild winter in
North America and Europe and because of.the Asian crisis, world demand in 1998 Q1 was
lower than 1997 44, that is 74.8 mb/d instead of 75.3 mbld.
As regards OPEC crude oil supplies I fear that even the Petrologistics data are slightly
overstated for two reasons mentioned before (the Jakarta-effect and the expectations that
production cuts would be from actuals rather than from quotas), and for a third reason,
namely that actual liftings in the Gulf have fallen short of nominations because of the failure
of some Asian customers to turn up with letters of credit, or even to turn up at all.
Respondents asked about export levels may well look at nominations instead of liftings. For
all these reasons I would put OPEC crude oil output at most at 28.3 mb/d in 1998 Q1 not at
the Petrologistics figure of 28.47 mb/d.
The surplus supply in 1998 Q1 would then appear to be:
28.3 mbld (OPEC crude) + 2.8 mb/d (OPEC NGLs) + 45.0 mb/d (non-OPEC) - 74.8 mb/d
(demand) = 1.3 mb/d
Again, if I were to take IEA figures throughout we would get an estimate for 1998 Q1 of 1.4
mb/d.
Assuming a build-up of 1.3 mb/d over the 90 days of 1998 Q1 give us 117 million
barrels of additional inventories (The IEA data would give 126 million barrels).
20
Adding 1997 and 1998 Q1 yields an inventory increase worldwide of 317 million
barrels according to our computations, and of 272 million barrels on the basis of the IEA
data.
The next section addresses the issue of stocks.
21
22

4. STOCKS
Stocks are built up (or drawn down) either involuntarily or voluntarily. Involuntarily stock
changes are the result of wrong predictions, or if one prefers a different terminology,
planning errors. Oil companies usually send their nominations for lifting for a given month at
least one month in advance. And their nominations result from an assessment of demand for
their petroleum products two or three months after lifting. Inevitably, there are time lags
between the date at which supply requirements are determined and the date at which the
demand which these planned supplies are intended to meet actually materialises. These lags
are due to administrative procedures, and to the time needed to transport crude oil from the
export terminal to the harbour of the importing country, then refme it into products, and then
distribute these petroleum products to wholesalers and retailers. Lags between a decision and
the time when the situation which the decision addresses is eventually reached mean that a
prediction is involved. And since predictions are almost synonymous to errors, we can
conclude that in the case of nominations for oil supplies involuntary stock changes are bound
to occur.
Predictions about the future course of prices can also cause an involuntary stock
build-up or draw-down when actual price movements falsify the forecast. When a company
buys more oil than required to meet the demand of its final customers because it believes that
the current price represents a bargain it would be adding to stocks voluntarily. But if the price
at which oil was bought falls further, instead of rising as expected, the stock build may
become a cause of regret. The company then finds itself holding inventories that it would not
have wished to build up had it known that the price would continue to fall.
Voluntary stock build-ups (or draw-downs) occur when the firm seeks (a) to bring
actual inventory levels closer to the operational optimum, or (b) to respond correctly to
opportunities for gains offered by contangos (or backwardations) in the term structure of
prices, or (c) to take advantage of bargains in buying when prices seem low (or in selling
when they are perceived to be high) provided, as mentioned earlier, that its prediction about
subsequent price movements turns out to be correct.
This typology may prove helpful in interpreting movements in oil stocks in 1997 and
early 1998.
23

According to the International Energy Agency (IEA) oil stocks held by industry in
OECD countries varied between 1993 and 1997 as shown in Table 6.
Table 6: Stocks Held by Industry, OECD Countries. 1993-97. Million Barrels and Consumption Days.
Period Million Barrels Days Covered by
1993 end 4 4 2486 61
stock Level. Arum ber of Consumption
Industrial Stock
1994 end Q1 4 2 4 3 4 4
2359 2478 2570 2540
1995 end Q1 242 1 4 2 2494 4 3 2530 4 4 2434
1996 end Q1 2297 4 2 2408 4 3 2449 Q4 2413
1997 end Q1 2439 4 2 2467 43 2508 4 4 2516
61 63 63 62
61 62 61 58
58 59 58 57
60 59 59 59
Source: IEA Latest relevant issues of MonthaTy Oil Market Report
One is almost tempted to see a relationship between the price of oil and stocks held by
industry measured in days of forward consumption. Prices were high in 1996 particularly in
4 4 when the stock cover in OECD countries was low (57 days) and prices were low in 1994
when the stock cover was high (63 days) in both 4 2 and 4 3 . Prices began to fall sharply in
1997 Q1 when the stock cover increased suddenly from 56 days to 60 days.
The hypothesis, however, does not appear to have robust backing from the IEA stock
data for 1997 44. With an estimated 59 days cover in 4 2 to 44 one would have expected oil
prices to hold in a fairly stable manner albeit at a lack-lustre level. They did in 1997 42 and
24

4 3 but not in 44. The reason may well be that by then the ’independent’ stocks (those not
held by industry under the E A definition) were building up.
Compared with 1996 the average level of IEA industry stocks increased by 90 million
barrels in 1997, that is by the equivalent of about two days of consumption. Since the number
of days covered was low in 1996 one could say that the increase of 90 million barrels was
partly in the nature of an adjustment to get back to a preferred stock level relative io demand.
Note also that the average number of days covered in 1997 remained lower than in 1994 and
1995.
Comparing stock levels in the fourth quarters of successive years we note that:
1994 44 - 1993 4 4 = +54 million barrels
1995 44 - 1994 4 4 = -106 million barrels
1996 44 - 1995 4 4 = -21 million barrels
1997 44 - 1996 44 = +lo3 million barrels
Some analysts may consider with good reason that a comparison of ‘a same quarter’ is more
meaningful in this context than a comparison of yearly average levels. But the results thus
obtained are very similar. The stock level in 1997 4 4 is 103 million barrels higher than in
1996 44, equivalent to two and a half OECD consumption days. This is not much greater
than the 90 million barrels average yearly increase. It raised the number of days covered in
1997 4 4 to 59 days which, although higher than in 1995 and 1996, does not appear to be so
much above an optimum of perhaps 58 days as to warrant the triggering of a significant fall
in prices.
The IEA has not published as yet stock data for 1998 Q1 comparable with those
presented in Table 6.
Given that our estimate of the worldwide stock increase in 1997 was about 200
million barrels, of which 90 million barrels only seem to be accounted for by the changes in
industrial stocks in OECD countries, we are left with a significant residual that has to be
attributed to (a) changes in govemment-controlled stocks in OECD (b) trading houses stocks
held outside the IEA coverage (c) trading in non-OECD countries and (d) producing
countries’ stocks.
25

Consider these in turn. (a) Available data show that govemment-controlled stocks in
the OECD have actually declined, albeit very slightly, fiom an average of 1199 million
barrels in 1996 to 1 191 million barrels in 1997.
(b) The trading houses and some oil companies may have built stocks outside the area
covered by the IEA definition. The same determinants would explain changes in this case as
in the main industry stocks reported by the IEA. These are: planning errors, taking advantage
of price bargains and responding to the contango. Although many commentators tend to focus
on the contango as an important explanatory variable, it is important to recall that price
differentials on the NYMEX, large enough to generate profits when hedging a physical stock
in the futures market, did not emerge until December 1997. One can therefore refer to the
contango to explain a stock buiId-up at the very end of 1997 and in 1998 Q1, but not in 1997
as a whole.
(c) Did a very significant stock build-up occur in the third world and the former
Soviet Union? It is possible of course that oil inventones rose in Asia and Latin America in
the first half of 1997 in anticipation of demand growth. One would have thought however that
some Asian countries hit by the economic crisis responded by drawing stocks down in 1997
4 4 and 1998 Q1. If this were the case it would be difficult to attribute a very large part of the
apparent stock increase to the non-OECD world.
(d) Finally, there are stocks held by producing countries - Saudi Arabia, Mexico,
Venezuela, Iran or Kuwait for example - in the Caribbean, Rotterdam, Le Havre, and the Far East. These fall outside the IEA coverage. Is a large part of t h s inventory increase
attributable to producing countries? In the absence of direct information on who owns how
much of the additional stocks, one can only reason with the help of critical arguments and
indirect evidence. Critical analysis would show that neither (a) nor (b), that is neither OECD
governments nor the third world, can explain the bulk of the apparent inventory surge. The
behaviour of commercial speculators could only explain the end-part of the period considered
here. We are thus left with (d), that is producing countries, as an important explanatory
variable. The large increases in the production of Saudi Arabia, Venezuela and to some extent
Mexico reported for part of 1997 and early 1998, that is at times when world demand was
slackening because of the Asian crisis and a very mild winter in North America, give some
support to our hypothesis that exporting countries, having produced more than they were able
to sell immediately, built up inventories, particularly in the Caribbean, to be able to respond
26

quickly in the future to a possible upturn in the US market. This view is supported by two
further considerations. The first is that Venezuela does not have the flexibility to shut down
production in small, difficult, heavy crude fields as temporary closures may entail large costs.
In t h s case, when the production plan exceeds demand, losses may be minimised, if not
avoided, by continuing to produce for a while and put the excess oil in stocks. The second
poht is that the USA is the arena in whch Venezuela, Mexico and Saudi Arabia compete.
The first two have nowhere else to go and Saudi Arabia - having lost in recent years market
share in the USA - want to regain some of it to compensate for the problems encountered in
Asian markets. Both factors explain some stock build-up close to the USA.
To sum up. First, there was stock build-up in 1997 and an even more significant one
in 1998 Q1. Secondly, part of this build-up in 1997 certainly reflected the industry desire to
adjust inventories to higher levels than in 1996 when these proved to be too uncomfortably
low. This does not mean, however, that the industry's desire, observed as a long-term trend
over a large number of recent years, to bring stock down to 'efficient' levels has been
reversed; merely that the tendency proved to have moved too far in 1996 and that a correction
was needed. I would argue that at least 60 million barrels of the build-up in OECD is
accounted for by this correction, and one may assume by extrapoIation that another 40
million barrels represented a similar adjustment elsewhere in the world. Any estimate of the
effective stock build-up should therefore subtract from the apparent number some 100 miilion
barrels which represent a return to the base line.
Thirdly, the serious stock build-up problem arose in late 1997 and in 1998 Q1. We
have here an additional indication that the weakness of oil prices is largely attributable to a
set of factors on the demand, supply and inventory side which began to play around October
1997 and only became significant in December 1997 to March 1998. This is when prices
began to fall, the contango began to open up to a size that made additions to stock profitable,
and the producers continued to push hard on the output fiont when they no longer had the
excuse of believing that demand was growing (they could see the Asian economies collapsing
and the winter tuming out warm in North America and North West Europe).
Fourthly, our discussion here suggested that true production and true stock levels,
although hgh, have been overstated by reporting agencies and many oil analysts.
Fifthly, and more importantly, is the finding that some producing countries may be
holding some of these surplus stocks, The ownership of stocks is not neutral, A producer
27

holding stocks does not behave in the same way as a trading entity which has opened both
physical and matching htures positions for commercial gains. The decision to release these
stocks at some hture date will depend on different determinants. The same point can be
made about other stock owners, be it refineries or governments holding strategic stocks. The
former will release stocks in response to price and demand movements in products (relative
to crude oil) markets. Strategic stocks are rarely released in response to price movements.
They are there for use in case of some catastrophic crisis.
Our final conclusion is that the stock volume which cast its shadow on the market as a
potential source of supplies in the fbture is nut equivalent to the whoIe inventory increase that
obtained in 1997 and 1998 Q 1 . The increase that may destabilise the market in the hture may
be measured as the difference between the stock level at the end of 1998 Q1 and the 1997
average minus those additions that belong to exporting countries and minus the volumes
which represent a compensatory adjustment for the low inventory levels of 1996.
I would venture that this potentially destabilising volume was of the order of:
3 17 million barrels (the total increase) minus 45 million barrels (additional producers' stocks
built at the rate of 0.3 mb/d over 5 months) minus 100 million barrels (the industry
adjustment) = 172 million barrels.
This is a significant number but not so large as to justify the current market scare.
28
5. OIL EXPORTERS' RESPONSES TO THE PRICE CRISIS
Having caused prices to fall by producing as much oil as they could manage to sell (and
perhaps some additional quantities whch ended up in storage facilities in the Caribbean,
Rotterdam and elsewhere) and by signalling, as OPEC did in Jakarta, and as non-OPEC
governments and oil companies did whenever they were induced to make a statement, that
higher output is a findmental objective, all exporting countries began to express worries
about this collapse, often privately, sometimes publicly, and as early as towards the end of
January 1998.
'Why is the oil price falling?' was the anxious question, to which the wry reply can
only be: If you have been drinking or eating all night do not seek the cause of headaches or
stomach pains the next morning.
As mentioned earlier, excess supplies, even if caused involuntarily by forecasting
errors, bring oil prices down and fill up storage. This creates the impression that oil is
available at bargain prices and elicits therefore further demand that ends up in inventories.
Excess supplies cause the emergence of further excess supplies. Sooner or later a significant
contango will emerge and this increases the demand for stock building. Once more the initial
suppIy/demand imbalance eventually leads to greater imbalances. One has then to wait until
storage tanks f i l l up and storage costs rise to the point where they choke off inventory
demand. Meanwhile prices inevitably fall.
This adverse impact resulting from a disequilibrium in the supply/demand relationship
is aggravated, and sometimes very seriously, by the 'sentiment' that producers intend to
pursue aggressively an output objective. Punters in htures and other derivatives markets
then seek to sell. Whenever the willingness to sell exceeds the willingness to buy prices fall,
as this is the only way in which an imbalance between ex ante intentions can yield an ex post
equilibrium. On t h s count too prices immediately fall.
By the third week of January 1998, the price of dated Brent was just above the $14
per barrel mark and that of WTI (first month) just above $16 per barrel. A few years ago
these price levels would have caused some, but not very significant, concern. The important
characteristics of the 1998 oil price crisis are the speed with which it elicited the concern of
oil-exporting countries and the not-so-terribly low price Ievel which triggered producers'
responses. The interesting observation is that producing countries, almost without exception,
29

felt vulnerable in early 1998 at a current dated Brent price of $14 per barrel which
corresponds in real terms to a nominal price of $12.5 per barrel in 1994, the most recent year
when an oil price collapse seemed threatening.
All exporting countries, with one or two exceptions, felt vulnerable to a sharp oil price
decline because each of them fell into one (or more) of the following categories: (a) The
government depends heavily on oil for revenues and the economy on oil or gas exports for
foreign-exchange earnings (b) Oil production involves, at least in part, high costs (c) The
economy of the exporting country is burdened with foreign debt and its financial system
would risk collapse if oil difficulties cause a capital outflow (d) The country has, or plans to
have, large investments in LNG or gas pipeline export projects.
The exceptions are (i) the UK and (ii) to a lesser extent and for totally different
reasons Iraq. The UK is an exception because the contribution of oil production to GDP, the
balance of payments and government revenues is relatively small. Sterling considered in the
early 1980s to be a petro-currency has ceased to be perceived as such for a long time now. . .1
The case of Iraq is more complex. Iraq was indifferent to the oil price when allowed
by the United Nations, as in 1997, to export for earnings of $2 billion every six months,
which involved a relativeIy small volume of oil. A fall in price only meant then a feasible
increase in volume to reach the $2 billion revenue target. The situation has changed recently
with the UN proposing to allow Iraq much higher earnings fiom oil exports. The problem is
that the new revenue target cannot be reached by Iraq because of capacity constraints due to
destruction to oil installations caused by wars, and to the sanctions preventing new
investments and repairs. If Iraq were to accept, as it is likely to do, the new UN oil-for-food
resolution it would find that the attainable oil output level is lower than the volume needed to
reach allowable revenues. This means that Iraq will no longer be indifferent to the course of
oil prices. Given a constant q, a higher p means hgher revenues. Iraq will want the oil price
to rise.
The point worth emphasising again is that most petroleum-exporting countries
showed concern when they saw oil prices crashing through 'psychological' barrier levels and
poised to go further down. Many commentators, analysts and journalists became interested in
a question which initially was: 'Who will blink first?' and later became 'Who has blinked
first?' There was, of course, no shortage of conflicting answers as some singled out Saudi
Arabia or Venezuela or Iran or Mexico. The question reveals a lack of understanding of a
30
fundamental point, that the economic, financial and, by implication, the political situation in
petroleum-exporting countries is exposed to the vagaries of oil prices. And the answer which
singles out this or that country in preference to others misses entirely a fact of considerable
importance: in late January, early February all the major exporting countries blinked at the
same time.
In any case recourse to the term ‘blink’ implies that the exporting countries were
engaged in a war one against the other. The oil price collapse of 1998 was not brought about
by producers who wanted to teach other producers a lesson come what may. In this sense the
1997-8 affair was not a repeat of the 1986 crisis. To be sure, the three major Gulf countries
were extremely irritated with Venezuela for its production policies and Venezuela suspected
them of producing above quotas while procIaiming their sanctity. All the evidence suggests,
however, that despite considerable mutual imtation and distrust, neither Saudi Arabia nor
Venezuela wanted, or were ready for, a price war. Venezuela planned and implemented
production increases since 1994 or thereabouts in the belief that the expansion of demand in
the world market would absorb these increases without adverse effects on prices. And as if to
prove the point, as it were with a vengeance, prices rose in 1996 to levels not attained since
the Iraq-Kuwait war of 1990. And Saudi Arabia observing demand growth and supply
increases by other producers in a situation of stable and sometimes rising prices decided,
albeit too late, both to produce more and to legitimise the increase through an OPEC
decision. Neither did Sau& Arabia want, nor did it expect prices to fall as Saudi official
statements made in Cairo towards the end of December 1997 clearly reveal.
The oil price fell, not because somebody launched a price war but because producers
able to create new capacity or to activate idle capacity at their disposal went ahead at
different times during the 1990s without appearing to give much thought to the price
implications.
And it is precisely for this reason that the oil price decline took them all by surprise
and elicited, in different ways, but with unprecedented speed, universal reaction.
Exporting countries know that an oil price fall of significant magnitude can only be
reversed by co-operative action on the output front. Agreement on this general proposition is
aIways universal. Where disagreements appear is on the question of who should, or is
expected, to co-operate. Usually non-OPEC countries want to leave it all to OPEC, and many
31

within OPEC would like to leave it all to Saudi Arabia and other Gulf countries. 'Let them
carry the can and we shall take a free ride' seems to have been the motto in the past.
The exporting countries' reaction to the 1998 oil price crisis does not fit exactly into
ths perspective. The point that Saudi Arabia has been making consistently since 1985,
backed by its policy in 1986 which was a genuine price war, seems to have s u n k in. Saudi
Arabia's willingness to cut output on its own to influence the course of oil prices could not be
taken for granted. In fact nobody could realistically expect to see such willingness ever
emerging again.
Some non-OPEC countries, realising that OPEC had lost over the years some of its
power and could not be relied upon to perform the production-cutting role in an effective
manner, abandoned the idea that their interests would be best served by sitting back waiting
for the opportunity to take a fiee ride. Paradoxically, it is OPEC's perceived weakness which
persuaded non-OPEC countries to volunteer their participation in some co-operative policy,
something that OPEC had always wanted and failed to achieve when (and precisely because)
it was perceived to be strong.
The new awareness of some non-OPEC countries about the need to co-operate was
perhaps a most significant feature of the 1998 oil price crisis.
Finally there was a consensus view among exporting countries, and more generally
within the world petroleum industry, that Saudi Arabia and Venezuela had to settle their
differences first for any attempt to remedy market weakness to have any chance of success.
A number of oil-exporting countries began to express fears that the oil price decline
would cause them serious damage sometime in January 1998. And some of them attempted to
launch initiatives that could Iead to some co-operation in production policy.
These are some examples. An Omani civil servant sounded out colleagues in other
non-OPEC countries about convening a meeting of P E C experts (IPEC stands for
independent petroleum-exporting countries and was chosen as a label to identify a group of
officials from a dozen non-OPEC countries that meet once a year to discuss the state of the
petroleum market. These meetings are more in the nature of a seminar and do not involve
decision making). The suggestion fell flat simply because the P E C expert meeting is not the
right body to address the problems posed by a major crisis.
32
There was a Nonvegian statement expressing concern about oil price developments
and hinting obliquely that Norway would consider action on output but had not yet been
asked to participate in such a policy.
Iran also moved early on. The Iranian President had a long telephone conversation
with the Venezuelan President after which a comuniqu6 was issued in Caracas stating that
all producing countries suffer from low oil prices. This was an expression of solidarity
between peopIe in pain, not yet the manifestation of solidarity in action. Then the former
Iranian President, M Rafsanjani, led an important state visit to Saudi Arabia. The Iranian oil
minister and senior oil officials were included in the high level delegation and held talks with
their Saudi counterparts. As usual, a joint communiquC was issued, long in the expression of
good intentions, short on policy proposals, not to mention decisions.
A number of oil-exporting countries also approached Saudi Arabia to express their
concerns, to invite it to take some leading role in seeking a solution, and to discover
something about Saudi intentions.
In February 1998 two important moves were initiated by Mexico and Algeria. These
initiatives were taken independently and ran in parallel. Their paths only crossed towards the
end of the run. Both initiatives were directed, albeit in different ways, at the Saudi-Venezuela
relationship. The Mexican initiative was entirely focused on this issue. The Algerians wanted
to promote a comprehensive production agreement, and for this reason visited several
exporting countries, but they understood very clearly that the task had to begin in Caracas and
Riyadh.
The Mexicans managed to persuade their Venezuelan counterparts - oil ministers,
president of PdV and other members of the oil establishment - that a short-term action on the
production fiont would serve their interests. The MexiceVenemela meeting took place
secretly in Miami on the occasion of a conference on Latin America on 4 March 1998. The
secrecy was so well kept that nobody, including the conference hosts, noticed that a meeting
was taking place.
This was an important turning point in the history of the 1998 oil price crisis. The
outcome of this meeting - which remained secret until the Saudis, Venezuelans and Mexicans
met in Riyadh again secretly during the weekend of 21-22 March - shattered conventional
wisdom about Venezuela's policy. The universal view held by oil companies, consultants,
analysts and the media was that Venezuela would never agree to an output reduction. This
33
view was based on two arguments. First, VenezueIa's repeated assertions that it was fully
committed to its long-term plans of production increases did not leave room for a change in
policy. Secondly, a decision to reduce production would send a 'wrong signal' to the foreign
investors which Venezuela was successfully attracting thanks to the apertzcm.
Neither argument is filly convincing. Changes in policy are always possible, even
likely, when significant revenue losses are at stake. This applies to Venezuela as to any other
country and the history of oil abounds in examples of radical changes in policy direction. And
to say that a production cut aimed at pulling oil prices out of the abyss into which they were
falling is a wrong signal to investors does not allow for the fact that an oil price of $7 or 8 per
barrel for a heavy crude is a much worse signal to investors.
The Venezuelans agreed in Miami to a meeting with the Saudis with a view to
reachmg an understanding on a joint production policy on three conditions: (a) Production
cuts will take place from actual levels and not from quotas and, in any case, quotas should not
even be discussed (b) The problem to be addressed is the current supply surplus on the
market not long-run investment plans, and (c) Non-OPEC countries should be involved in
production cuts.
Saudi Arabia had already accepted in private communications to the Mexican
intermediaries conditions (a) and (b). Condition (c) was never the cause of any disagreement
and was redundant given the involvement of Mexico, a non-OPEC country, in the discussion.
Initially, the Saudi officials could not believe that the Venezuelan position had so
radically changed. Their scepticism was largely due to the difficulty of reconciling two sets
of facts: the message that Venezuela was willing to consider production cuts and the stream
of statements from high Venezuelan officials which continued to emphasise the no-
concession line and which, in some cases, were very antagonistic to Saudi Arabia.
The Algerians who were in Caracas on 7 March, just after Miami, visited Riyadh on
11 March, and provided their Saudi counterparts with independent confirmation that the
Venezuelan position had indeed changed. The Saudis re-established then the contact with
Mexico on 12 March and arrangements to hold a tripartite meeting in Riyadh (Saudi Arabia,
Venezuela and Mexico) on 21-22 March were negotiated successfilly despite some
inevitable hurdles and difficulties.
The Mexican mediation succeeded, but the Algerian, valuable as it turned out to be,
did not reach the same outcome. The reason was that the Mexican approach involved
34
negotiations on individual production cuts while the Algerian proposal initially was for pro-
rata cuts by all exporting countries. Saudi Arabia being the biggest producer was strongly
opposed to the idea of equal percentage reductions. This wodd cause it to reduce its output
by a big volume. As a result Algeria was not involved in the Riyadh meeting.
The Riyadh meeting was important for a number of reasons. First, the ice which had
seized up the Saudi-Venezuelan relationship was broken. The two key exporting countries,
both founding members of OPEC, on which the possibility of any production accord rested
had now met face to face and had been able to clear up many misunderstandings. Any Saudi-
Venezuelan dialogue for further co-operation in the hture would no longer require mediation
and patient preparatory work. It will be directly and immediately initiated whenever the need
arises.
Secondly, Riyadh put Venezuela back in the core of OPEC. The widely held view that
Venezuela was for all intents and purposes outside the organisation has been falsified.
Thirdly, exporting countries both from within and outside OPEC clearly manifested
that they have critical interests in common irrespective of their institutional attachments. This
is the true meaning of Mexico‘s involvement.
Fourthly, for the first time in a long whiIe, exporting countries could appreciate the
merits of secret diplomacy. The Riyadh meeting conducted in secret impressed the market; a
week later the OPEC meeting, conducted in public in Vienna, depressed it.
Riyadh represented an achievement calling for further work to build a credible and
effective producers’ strategy. Not enough was done in this respect. One would have expected
the ministers involved to fly round the world immediately in order to sell the production
policy recommended in Riyadh and to secure, through bilateral face-to-face meetings, the
contribution of other exporting countries. Optimistically, the Saudis and the Venezuelans
thought that these contributions could be obtained during a very short meeting which had
been already scheduled for 30 March in Vienna.
It was also necessary to soothe those who resented being excluded from the ’inner
circle’ whch convened in Riyadh. Many did not mind it at all but some ministers were
unhappy. Finally a public relations exercise selling the accord and its merits to the media
should have been skilfully organised. In a market where ‘sentiment’ plays such an important
role it is not sufficient to design policies to remedy the weakness of economic fundamentals.
Producers need also to find ways to influence sentiment. The price weakness caused in the
35
first place by a supply/demand imbalance was aggravated by perceptions that producers were
determined to maintain, if not increase, their output volumes. It was not enough therefore to
agree on cuts. Producers also needed to present evidence that they were determined to
implement them effectively and resolutely,
In this context both substance and presentation matter. On substance, Riyadh was not
explicit on the basis of the agreed cuts. Although it was clearly stated that the basis was
actual production levels the question immediately arose on how one is to determine these
actual levels in the absence of verifiable reporting of output data,
I have no doubt that the parties to the Riyadh agreement were serious about their
intentions to cut production. A sceptical market looks however for objective tests and is not
reassured by subjective intentions.
As politicians, and increasingly modem businessmen, well know, good spin doctors
are indspensable for success. A good spin doctor would not have allowed the inclusion in the
Riyadh communiquC of the sentence which defined a 1.6 to 2.0 mb/d target for the total
volume of cuts sought from all exporters. This apparentIy anodyne sentence provided the
market with a benchmark to judge the success of the final agreement on a new production
policy.
The OPEC meeting in Vienna on 30 March did not improve market sentiment. The
meeting did not get a very good press. Personally I do not have much time for the OPEC
watchers' complaints. Does it really matter whether the meeting lasted seven hours instead of
one? Does it really matter that an AIgerian displayed some bitterness because his minister's
role in previous negotiations has not been given, in his judgement, sufficient credit?
To my mind what matters are (a) the definition of the policy and (b) the chasm
between the producers' and the market's perceptions of current economic fundamentals. The
definition of the policy suffered from a critical flaw: the reliance on secondary sources (that
is reporting agencies and consultancies) for establishing, through a simple averaging of the
numbers they published, the actuaI production level in February 1998 - the agreed basis for
the cuts. Recourse to this procedure stems from the producers' reluctance to disclose in a
transparent way output or export statistics. They may believe that secrecy in this area is a
privilege of sovereignty, It is odd, however, to exercise sovereignty by surrendering to
journalists the right to determine the basis on which a critical policy will rest. Having already
surrendered in 1986 to the same journalists the assessment of reference prices with which
36
export sales are valued, the exporting countries may think it is natural to do the same for
reference volumes.
The producers believe that their proposed cuts wilI be sufficient to re-establish a
balance between oil supply and demand in the coming months. They may have doubts about
balance in the second quarter, not about the average in the rest of this year. The market seems
to think that some cuts will not materialise and that stock levels are far too high for comfort.
The producers would be able to clear some doubts if they were willing to disclose the
volumes held in storage outside their boundaries and to emphasise that cuts are from supply,
not production levels. But unfortunately, disclosure is not part of the oil culture. And the
market could get matters in better perspective by abandoning its fascination for byzantine
discussions on who will cut production and by how much since it is not the numbers agreed
upon that really matter but the number of barrels which will actually appear in international
oil trade in the coming months.
37

313
6. POLICY PROPOSALS
One fact is certain. Low oil prices cause serious troubles to exporting countries; and although
oil companies remain tight lipped during a price crisis or boast that countries are more
vulnerable than they are, low oil prices affect cash flows, profitability and investment plans.
And because low oil prices have adverse effects on the economics and politics of
exporting countries their governments manifest some willingness to intervene on the
production front. Of course, there will always be free riders. But there are also enough
countries which realise that refusing to act because some others will take a free ride will harm
their own interests. In all areas of human activity collective action works when a sufficient
number of agents decide that it is in their interest to co-operate and not because all concerned
unanimously decide to join in.
It is also evident that the exporting countries' interest is in revenues, not in volume as
such and not in prices as such. If prices were independent of volumes, the maximisation of
revenues would entail that of volumes. And in turn if volumes were independent of prices,
every producer would want prices to rise as far as they could as this would then maximise
revenues.
.-
There is, however, an interdependence between prices and volumes. Attempts to
increase volumes against an inelastic demand would cause prices to fall by more than the
volume increase. And changes in oil prices do not necessarily result in commensurate
changes in oil production. For this simple reason those who persistently advocate that OPEC
should pursue a market share policy come what may, that is maximise volumes without
worrying about the price impact, are not offering sensible advice. There are situations, as in
1986 for example, when the collapse in Saudi Arabia's export volumes was so significant as
to require a drastic price war to improve the position on the voIume front. There are cases, of
course when a seller wishing to gain entry into a particular market or to increase its
penetration would accept to incur some temporary losses in revenues in the hope of
increasing gains in the future. Outside these specific instances the pursuit of market share by
an oil exporter or a group of exporters is not a sensible policy because the costs involved can
be very high during its implementation and the future benefits too distant and too uncertain.
The critical characteristic of oil prices is that, on average, they are well above
production costs. This is precisely why they generate revenues on which governments with
39
few other sources of income rely. But this is also why price wars cause huge losses and do
not achieve their objective, whch is to eliminate the competition. To succeed prices have to
fall below costs. On their way down they will remove some marginal barrels from the market,
not enough to increase the volumes supplied by the low cost producers by a proportion
sufficient to compensate for the loss in price. Prices have to fall a long way and price
expectations have to remain depressed for a long time for a significant improvement of the
market share of those who launch an oil price war. No oil-exporting country has the financial
resources which enable it to sustain such a policy.
In a growing world, market shares can improve in favour of producers who are able
and willing to create more new capacity than others. Here again an investment race would
only be successfd if the new capacity thus created does not exceed the increment in demand.
And in an investment race, those who are moving ahead need to watch not only the plans of
other investors but the mood of countries holding significant volumes of idle productive
capacity. An investment race pursued blindly can have similar effects to those of a price war.
There is an important difference, however. In an investment race the front runners improve
their market shares before the subsequent price collapse which occurs if new capacity
exceeds growth in demand. In a price war the leaders improve their market share position
after the subsequent price collapse.
All that means that prices are of greater importance than volumes in a static world
(apart from a few exceptional situations) and that investment in productive capacity is a
critical factor in a growing world. If exporting countries want to protect their revenues
through co-operative action they need to address the price, the volume and the investment
issues in their interaction.
This is a general principle. One may need however a more detailed and concrete
policy proposal for producers. For this purpose we may ask first whether the recent oil events
provide relevant lessons for policy making. These appear to be as follows:
(a) Non-OPEC exporters face similar problems as OPEC countries. They are aware of
them, have shown concern and some of them have been willing to co-operate on joint policy.
OPEC need now to negotiate and establish a framework which would allow countries from
withm and outside the organisation to discuss policy. The framework should be flexible,
meaning that it should not require non-OPEC countries to join the organisation and to make
international commitments which may prove politically difficult.
40
(b) Secret dipIomacy (kyadh) works better than negotiations held in meetings where
delegates are besieged by journalists, traders, analysts, consultants and oil industry watchers
(Vienna). These 'public' meetings (which they are to some extent, although held behind
closed doors, because the observers spend their time guessing and speculating, collecting
leaked information, and sometimes serving as unofficial channels between negotiating
parties) should be reserved for confrrmng decisions agreed upon in advance through secret
talks. Diplomacy has also an important role to play to persuade countries who were not part
of an initial caucus to agree with the results.
(c) The presentation of a policy or an agreement is important. This requires skills and
more particularly a deep understanding of how the oil market functions, how it forms its
views, and how it responds to news. Exporting countries should invest in personnel with
these particular talents.
(d) The understanding of the market needs also to improve not only for presentation
but for matters of substance. Recent events show how dangerous a price contango can be.
They also show that nominations for Iiftings are not necessarily a good indicator of the levels
of future demand that lifings are intended to meet. It is possible to overproduce involuntarily
just by meeting lifting nominations. One dways needs to form a complementary view about
demand in the medium term by looking at-economic and other relevant forecasts.
(e) Transparency may serve better the interests of oil-exporting countries than the
lealung of distorted information on production, investment plans and the like. If, as I suspect,
exporting countries have tended to overstate their oil production in recent months then they
would have induced stronger bearish sentiments than the actual situation had warranted.
(0 The recent oil events suggest that silence has great merits when there are
misunderstandings between major players. Public statements in such a situation only deepen
the rift to the detriment of all parties' interests. Similarly, well crafted public statements are
essential when a policy has been agreed and when the market needs reassurance that an
agreement is in the malung. Some statements made before Riyadh were counter-productive
because they delayed agreement. Some statements made during and after Vienna were not
well thought out and raised doubts in the sceptics' mind about the credibility of the
agreement. As the Bible puts it, wisdom advises that there is 'a time to keep silence, and a
time to speak' (Eccl. 3.7).
41

These are preliminaries. An effective policy to stabilise prices during short-term crises
could be structured as follows:
(A) Producers would first define an oil price range within which the market would
fluctuate freely. If the average monthly price of a chosen reference crude moves outside the
range the exporting countries committed to joint action would automatically implement a pre-
agreed quantity policy whose aim is to bring prices w i b the band. This implies cuts or
increases depending on the direction of the price movement. It aIso means that exporting
countries should hold some idle capacity in reserve to enable intervention if prices rise above
the policy target.
(B) The quantitative changes involved in the policy relate to export not to production.
(C) Export volumes are reported at the end of every month to an ombudsman by
submitting copies of the bills of lading of tankers which lifted oil in the month. Since cuts in
this policy proposal are based on actual export volumes no party to the agreement has an
incentive to understate volumes by withholding bills of lading. On the contrary, they will
ideally want to overstate loadings but this would require the faking of non-existing bills, This
is easily spotted.
Note that the procedure does not require the cumbersome operations of a firm of
accountants visiting countries and checking their books. AI1 that is needed if the criterion is
exports is to add up the bill of lading statements on volumes and to check whether a tanker
which does not appear in other sources really exists. The procedure is simple, neither time
consuming, nor expensive.
(D) The pre-agreement on export cuts or increases when prices move outside the
agreed range need not involve a uniform pro-rata formula. A less rigid scheme involving
absolute quantities or varying percentages can be negotiated.
(E) The price-band target may be revised once a year, and the industry given a long
notice of the proposed change.
(F) Oil-exporting countries should discuss among themselves their investment plans
within, say, a five-year time framework. The programme of short-term quantitative cuts
(increases) in response to price changes would be designed taking into account these
investment plans as well as the volume of surplus capacity available to countries. Naturally
countries which are expanding their production would accept a bigger (relative) role when
42

cuts are required and countries with surplus capacity would be given a bigger (relative) role
when increases are called for.
43

OXFORD INSTITUTE FOR ENERGY STUDIES 57 WOODSTOCK ROAD, OXFORD OX2 6FA ENGLAND
TELEPHONE (Od865) 311377 FAX (01 865) 31 0527
E-mail: [email protected] http :IIwww.oxfordenergy.org