the ohio state university college of engineering
TRANSCRIPT

THE OHIO STATE UNIVERSITY
U.S. Nuclear Regulatory Commission Document Control Desk Attn: Xiaosong Yin One White Flint North 11555 Rockville Pike Rockville MD 20852-2738
College of Engineering
Nuclear Reactor Laboratory 1298 Kinnear Road
Columbus, OH 43212
[email protected] reactor.osu.edu
14-November-2018
Subject: Relevant sections of The Ohio State University Research Reactor (OSURR, License R-75, Docket 50-150) Safety Analysis Report (SAR) to support a Technical Specifications amendment request
Per a letter from the NRC dated October 3, 2018, more information was needed to support a requested change to the OSURR Technical Specifications, which had been sent in a letter dated August 27, 2018 (ADAMS Accession No. ML18242A075). In response to this request, a letter was sent on October 16, 2018 with proposed changes to relevant sections of the OSURR SAR.
Because an up-to-date revision of the affected sections is needed for proper review of the proposed changes, this subsequent letter contains an attachment with the relevant sections of the SAR to which the changes have been made. (Chapter 6 and Section 8.4.4 of the SAR.) Please note that with the changes, some of the page number references in the October 16, 2018 letter may be incorrect. However, for each proposed change, the section in which the change was made was denoted in the October 16, 2018 letter. In addition, each of the changes has been marked with a change bar on the right side in the attached document, so the correspondence between proposed changes in the letter and the changes made in the attached document should be clear.
I also would like to bring a typo to your attention. In the October 16, 2018 letter, Item 12 addresses Section 6.3.5.4, but on second reference indicates that the text will be added to the end of Section 6.3.5.3. The text proposed in Item 12 has been added to 6.3.5.4, as the change bar reflects.
If you have any questions on this matter, please contact me at [email protected] or at 614-688-8220.
I declare under penalty of perjury that the foregoing is true and correct. Executed on 14-November-2018.
Sincerely,
Andrew Kauffman Sr. Assoc. Director, OSU Nuclear Reactor Laboratory 1298 Kinnear Rd Columbus, OH 43212

The Ohio State University Research Reactor
6.0 Radioactive Waste Management
6.1 Source Term Estimation
6.1.1 Liquid Effluents
Safety Analysis Report October 2018
Under normal conditions, no liquid is released from the reactor pool, the primary coolant loop, or the secondary coolant loop. Events that result in significant fluid releases from these systems are considered accident conditions and are discussed in Chapter 8.
Liquid-borne radioactive materials in the reactor pool and primary coolant loop eventually pass through the water processing system. The primary radionuclide detected in the resin bed ion exchange demineralizer is 24Na resulting from neutron-alpha reactions with 27 Al in the aluminum used in and around the reactor core. Current procedures require changing of the demineralizer cartridge at the point where it cannot maintain pool water conductivity requirements. The replacement procedure allows for holding the spent demineralizer cartridge at the reactor building for several months prior to returning it to the manufacturer for regen~ration. This holding period allows 24Na activity to decay to negligible levels. ·
Thus, under normal conditions, no liquid radioactive effluent will be produced by OSURR operations.
6.1.2 Gaseous Effluents
The primary gaseous radionuclide produced by OSURR operations is 41Ar. This isotope is produced whenever air is in contact with a neutron radiation field. Naturally-occurring 40Ar, which comprises over 99% of all argon, undergoes a neutron capture reaction to produce 41Ar, which decays by beta and daughter product (41 K) gamma emission, with a half-life of 1.83 hours. Argon is found in air at slightly less than 1 % concentration under STP conditions.
Smaller concentrations of gaseous radioisotopes will also be produced from other activation products in air, experimental procedures, and a slight possibility of very small quantities of fission product gases released into the reactor room environment from dissolved fission product gases in the pool water. However, the quantities of these other sources are very small compared to 41Ar production.
The water in the reactor pool also contains dissolved air. It is assumed that the dissolved air has an argon concentration equal to that found in atmospheric air. Some of this argon will activate and be released from the surface of the reactor pool into the building air.
Fast neutrons (with energies above about 10 MeV) can interact with the oxygen nuclei in the pool water via th.e neutron-proton reaction and produce the 16N isotope. This nuclide has a very short half-life (7 seconds), so very little of it will reach the surface of the pool because of decay during transit from the core to the surface. Further, if the circulating pumps in the primary loop of the cooling system are on, the water rising from the core will be dispersed into the lower regions of the pool, greatly increasing the effective transit time for a given volume of water from the core to the surface. However, since 16N can contribute to personnel doses as a source distributed on the surface of the pool as well as add to the radionuclide concentration in the air of the building, its production and distribution will be considered in a following section.
6. 1. 2. 1 Argon Production in Experimental Facilities
Production of 41Ar can occur in the two beam ports, the rabbit facility, the central irradiation facility (CIF) tube, dry tubes mounted near the core, and any open stringers in the main or BSF pool thermal columns. When not in use, the beam ports are normally filled with shielding plugs,
120

The Ohio State University Research Reactor
Safety Analysis Report October 2018
which effectively reduce to zero the volume of air in the portion of the beam ports normally exposed to neutron radiation. The main and BSF pool thermal columns are also filled with graphite stringers when not in use. Movable dry tubes are stored at a location away from the reactor core when they are not in use. Thus, in many cases, the only sources of 41Ar during routine operations will be the CIF tube and the rabbit tube. A puff-type release can also occur from the rabbit carrier tube after it is withdrawn from the rabbit facility following irradiation and is opened.
Isotope production can be estimated from:
where
A(t) = Ncr~(1- e-1..ti )e-"'1
J\ = decay constant
t = time after removal of neutron flux
ti= exposure time to neutrons
cr = microscopic cross-section for reaction of interest
cp = neutron flux in neutrons/cm2/second
N = total number of target atoms available for activation.
In using this equation, it is assumed that N remains constant; that is, there is no significant "burnup" of the atoms available for the reaction forming the activation product.
In the interests of conservatism, it is assumed that activity buildup of 41Ar is sufficient to achieve saturation. That is, the irradiation time (ti) is equal to at least five half-lives of the activation product. For 41Ar, with a half-life of 1.83 hours, this corresponds to an activation time of 9 hours. This is conservative in that few OSURR operations will involve irradiations of this length. Also, it is assumed that the release occurs immediately at the end of the irradiation, i.e., t = 0. The production equation simplifies to:
A= Ncrcp
where cr and cp are defined above. Goldman [1] reports a value of 0.61 barns (6.1x1Q-25 cm2) for the microscopic thermal neutron capture cross-section of 40Ar.
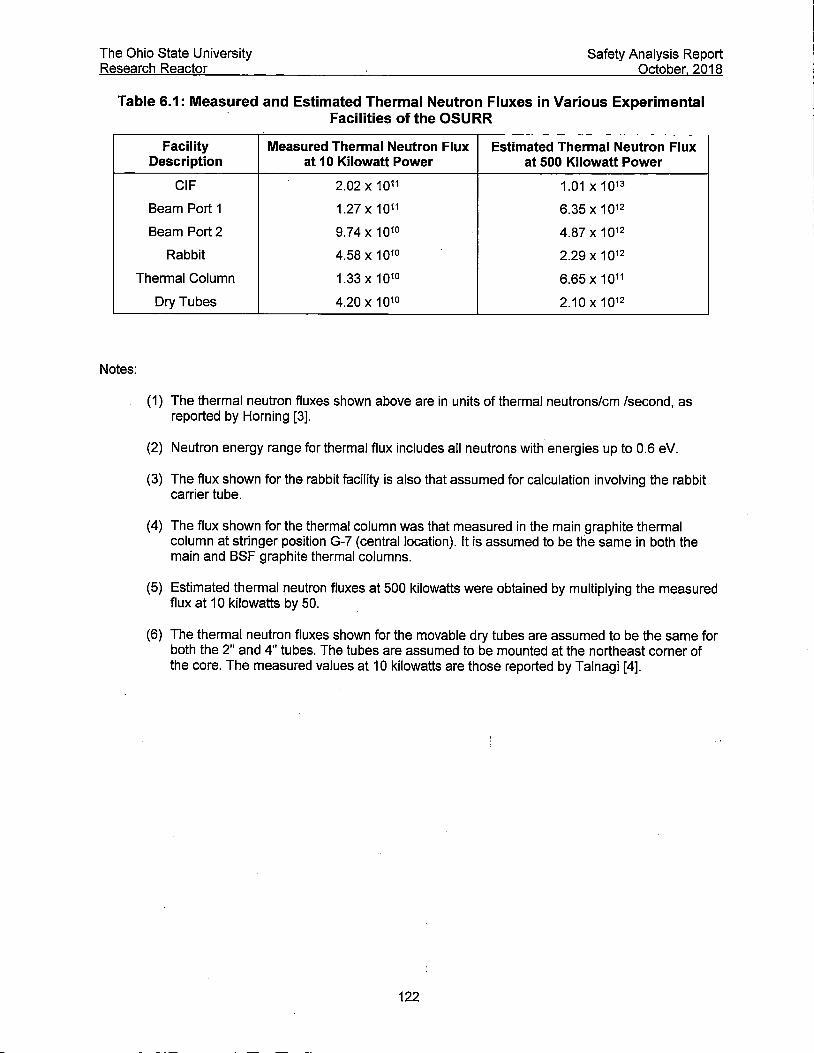
Values for neutron flux are based on thermal neutron flux measurements obtained in the various OSURR facilities at 10 kilowatt operation. It is expected that these thermal neutron fluxes will remain about the same or lower for an LEU-fueled OSURR core, and will be linear with reactor thermal power. Thus, the measured values for 10 kilowatt operation were multiplied by a factor of 50 to estimate the fluxes for 500 kilowatt operation. Table 6.1 shows data for thermal neutron fluxes in the various experimental facilities. For 41Ar production calculations for the main graphite thermal column and the two beam ports, the flux was taken to be half the peak flux, for reasons to be explained in a later paragraph.
The number of 40Ar atoms available for activation is a function of the volume of air in the experimental facility and the concentration of argon in air under STP. conditions. Etherington [2] reports a concentration of 2.5 x 10¹⁷ atoms of argon per cubic centimeter of air under STP conditions. Using the isotopic abundance of 0;996 for 40Ar, a concentration of 2.49 x 10¹⁷ atoms of 40Ar per cubic centimeter of air at STP is estimated.
The volume of air in each experimental facility must be estimated. Since the experimental facilities of interest are either tubes or rectangular ducts, their volume is given by their crosssectional area times their effective length.
121
The Ohio State University Research Reactor
Safety Analysis Report October 2018
Table 6.1: Measured and Estimated Thermal Neutron Fluxes in Various Experimental Facilities of the OSURR
Facility Measured Thermal Neutron Flux Estimated Thermal Neutron Flux Description at 10 Kilowatt Power at 500 Kilowatt Power
CIF 2.02 X 10¹¹ 1.01x10¹³
Beam Port 1 1.27 X 10¹¹ 6.35 X 10¹²
Beam Port2 9.74 X 10¹⁰ 4.87 X 10¹²
Rabbit 4.58 X 10¹⁰ 2.29 X 10¹²
Thermal Column 1.33 X 10¹⁰ 6.65 X 10¹¹
Dry Tubes 4.20 X 10¹⁰ 2.10x10¹²
Notes:
( 1) The thermal neutron fluxes shown above are in units of thermal neutrons/cm /second, as reported by Horning [3].
(2) Neutron energy range for thermal flux includes all neutrons with energies up to 0.6 eV.
(3) The flux shown for the rabbit facility is also that assumed for calculation involving the rabbit carrier tube.
(4) The flux shown for the thermal column was that measured in the main graphite thermal column at stringer position G-7 (central location). It is assumed to be the same in both the main and BSF graphite thermal columns.
(5) Estimated thermal neutron fluxes at 500 kilowatts were obtained by multiplying the measured flux at 10 kilowatts by 50.
(6) The thermal neutron fluxes shown for the movable dry tubes are assumed to be the same for both the 2" and 4" tubes. The tubes are assumed to be mounted at the northeast corner of the core. The measured values at 10 kilowatts are those reported by Talnagi [4].
122

The Ohio State University Research Reactor
Safety Analysis Report October 2018
In this case, effective length is taken to be that length over which most of the 41Ar production occurs. For facilities oriented either parallel or through the core, such as the CIF tube, the rabbit facility, and movable dry tubes, the effective length is taken to be the characteristic dimension of the core over which the experimental facility tube passes. For the CIF and dry tubes, the effective length is 24 inches, which is the vertical length of the active fuel part of the core. For the rabbit facility, the effective length is the dimension of the side of the reactor core, which will be no more than 18 inches, since the grid plate is a 5 x 6 array, with each fuel element being 3 inches long. While some 41Ar production occurs in the regions beyond these boundaries, it is not as great as that produced within these regions. Conservatism is added by assuming that the flux through this region is uniform and equal to the peak neutron flux along the effective length, which is the value shown in Table 6.1. In actuality, the average neutron flux in the facility will be lower than the peak value, since the spatial distribution of flux in the vertical and horizontal directions shows a reduction in thermal neutron flux as the edge of the core is approached.
The effective length for the beam ports and graphite thermal column stringer positions, which converge at the core in a generally perpendicular direction, was estimated differently. Using a spatial neutron flux distribution measured in the open central stringer position in the main graphite thermal column, a characteristic length was determined for a neutron flux profile in air. This length was taken to be that required to achieve a 90% reduction in the initial (peak) neutron flux at the point closest to the core. For calculation of 41Ar activity, the average neutron flux over this length was assumed to be one-half of the peak thermal flux occurring at the core end of the facility.
Table 6.2 shows the results for effective volumes of the various experimental facilities, and the resulting total number of 41Ar atoms available for activation. Using these results in the production equation leads to the source term estimates shown in Table 6.3.
Assuming an irradiation time sufficient to achieve saturation, the rate of radioisotope production is given by:
where
R =AA
R = rate of isotope production in disintegrations/sec/sec
A. = decay constant, and
A = saturation activity in disintegration/sec calculated from the production equation.
The rates of 41Ar production at saturation in the various facilities are listed in Table 6.3.
The rabbit system can be activated and operate continuously for a set period of time. During operation, 41Ar produced in the effective volume of the rabbit is continuously purged into the reactor room atmosphere, which is exhausted to the outside atmosphere by the building vent fan. The 41Ar effluent concentration can be estimated from the production rate of 41Ar and the volumetric fl?w rate of the rabbit blower system.
The name-plate capacity of the rabbit blower system is 150 cubic feet of air per minute, or 7.0792 x 10⁴ cc/second. As shown in Table 6.2, the effective volume of the rabbit facility is 1737.36 cc. This implies a cycle time of 24.54 milliseconds for the effective volume. Assuming a constant neutron flux equal to that shown for the rabbit facility in Table 6.1, and the number of 40Ar atoms available for activation shown in Table 6.3, an irradiation time of 24.54 milliseconds gives an isotope total of 4.22 x 10⁻² µCi. This total must now be multiplied by the total number of cycles of the rabbit effective volume per second (about 41 ). This results in a production rate of 1. 72 µCi of 41Ar per second in the exhaust of the rabbit blower.
123

The Ohio State University Research Reactor
Safety Analysis Report October 2018
Table 6.2: Calculated Air Volumes in Various Experimental Facilities of the OSURR
Notes:
Facility Cross-Sectional Area Effective Length Air Volume Description (cm2) (cm) (cm3)
CIF 9.65 60.96 588.26
Beam Port 1 190.09 66.04 12553.84
Beam Port2 190.09 66.04 12553.84
Rabbit 45.60 38.10 1737.36
Thermal Column 103.23 66.04 6817.02
Rabbit Carrier 8.43 13.97 117.77
4" Dry Tube 61.58 60.96 3753.68
2" Dry Tube 21.29 60.96 1298.11
(1) When not in use, the two beam ports and thermal column have essentially no effective volume of air since they are filled with plugs or graphite stringers.
(2) When in use, inner volume of the main graphite thermal column is sealed with a boralaluminum plate.
(3) The effective volume of the rabbit carrier tube may be lower than the value shown if it is stuffed with cotton, as is normally the case when it is used. The volume shown is the maximum available empty volume in the carrier tube.
(4) The effective volume of Beam Port 2 may actually be smaller than the value shown, since it intersects the face of the core at a non-perpendicular angle, which causes a sharper neutron flux gradient, reducing its effective length (see text for definition of effective length).
124

The Ohio State University Research Reactor
Safety Analysis Report October 2018
Table 6.3: Estimated 41Ar Source Terms for the Various Experimental Facilities of the OSURR
Notes:
Facility Available Saturation 41 Ar Saturation 41 Ar Activity
Description 40Ar Atoms2 Activity Production Rate (1,1Ci) (µCi/sec)
CIF 1.46 X 10²⁰ 2.43x10⁴ 2.56
Beam Port 1 3.13 X 10²¹ 1.64 X 10⁵ 17.25
Beam Port 2 3.13 X 10²¹ 1.26 X 10⁵ 13.25
Rabbit 4.33 X 10²⁰ 1.63 X 10⁴ 1.71
Thermal Column 1.70 X 10²¹ 9.32 X 10³ 0.98
Rabbit Carrier 2.93 X 10¹⁹ 1.11 X 10³ 0.12
4" Dry Tube 9.35 X 10²⁰ 3.24x10⁴ 3.41
2" Dry Tube 3.23 X 10²⁰ 1.12x10⁴ 1.18
(1) The values assumed for thermal neutron flux in the two beam ports and the thermal column is one-half that shown in Table 6.1 for 500 kilowatt operation, as discussed in the accompanying text.
(2) For isotope production rate, the half-life was assumed to be 1.83 hours, which gives a decay constant of 1.052 x 10⁻⁴ seconds.
(3) The estimate shown for the thermal column are assumed to be the same for the main and BSF thermal columns.
(4) All isotopic production calculation results shown above assume the fluxes given in Table 6.1 for 500 kilowatt operation, except as stated in Note 1 above.
125

The Ohio State University Research Reactor
6. 1. 2. 2 Argon Production from Pool Water
Safety Analysis Report October 2018
Estimation of the 41Ar production from dissolved air in the water of the reactor pool begins with a calculation of the exposure time of water passing through the core. Section 4.8 noted that the average coolant velocity through the core is 6.5 cm/second, assuming a 500 kilowatt operating power and natural convection through the core. The length of the active fuel channel is 60.96 cm (24 inches), which gives a coolant transit time of 9.4 seconds, assuming a constant average velocity through the core. This is taken to be the exposure time of the water to the average flux throughout the core.
Based on measurements of the peak thermal neutron flux in the core region at a 10 kilowatt power level, and assuming linearity of thermal flux with reactor power, the peak thermal neutron flux in the core is assumed to be 1x10¹³ neutrons/cm2/second. Measurements of the peak-toaverage thermal neutron flux at 10 kilowatts indicate that the average thermal neutron flux throughout the core will be about 60% of the peak thermal flux, or 6x10¹² neutrons/cm2/second.
The volume flow rate of water through the core is the product of the coolant velocity and the total flow area. Assuming a core with 18 standard fuel elements and 4 control rod fuel elements, the total flow area. is the product of the flow area of an individual coolant channel and the total number of channels in the core. Section 4.8 noted that the flow area of a single coolant channel is 1.964 cm2
. The total number of flow channels is assumed to be 364 (18 standard elements with 18 flow channel each, and 4 control rod fuel elements with 10 channels each). Thus, the total core flow area is 714.896 cm2, and the total volumetric flow rate is 4646.8 cm3/second ..
Now, the average out-of-core cycle time is given by:
T=Vp/V
where Vp = total volume of the pool, and
V = volumetric flow rate through the core.
If the dimensions given in Section 3.1.3.1 are used for the size of the reactor pool, a volume of 2.223x107 cm3 is obtained. Using the volume flow rate calculated earlier, an out-of-core cycle time of 4783.24 seconds is obtained. This can be thought of as a decay time for 41Ar produced in the water of the pool.
The concentration of argon gas in the pool water can be predicted by Henry's Law. The dissolved concentration of a gas in contact with a liquid is proportional to the partial pressure of the gas and the temperature of the liquid. Dorsey [5] reports values for air at STP conditions in water that allow an estimation of 8.65x10¹⁵ atoms of 40Ar per milliliter of water, assuming a water temperature of 25°C (core inlet temperature).
The saturation activity of 41Ar in the pool water may be predicted from:
where
A= Ncr~(1-e-A.1)/(1-e-A.[t+TJ)
N = concentration of 40Ar atoms in the pool water,
a = neutron capture cross section for 40Ar,
A = physical decay constant of 41Ar,
cp = average thermal neutron flux in the core region,
t = exposure time of water in the core, and
T = average out-of-core cycle time.
126

The Ohio State University Research Reactor
Safety Analysis Report October 2018
Substituting appropriate constants in this equation yields an estimate of 79.02 disintegrations/second/cc. Dividing this estimate by the decay constant for 41Ar gives a calculated density of 7 .512x105 atoms of 41Ar/cc.
As water passes through the core it is heated, which reduces the solubility of air in the water. For this calculation, it is assumed that 25% of the dissolved argon is released from the water because of core heating. Some of this released argon will be redissolved as it mixes with cooler water in other regions of the pool. Measurements done at other reactors allow an estimate of 50% redissolving fraction. Thus, the argon available for release to the building air is given by:
where
8 1 = F1(1-F2)N41 V
N41 = 41Ar concentration in the water at equilibrium,
F1 = release fraction from heating (assumed to be 25%)
F2 = redissolving fraction (assumed to be 50%), and
V = volumetric flow rate through the core.
Substituting appropriate values in this equation leads to an available release term of 4.36x1 as atoms of 41Ar/second. This represents one component in the 41Ar release from the pool water.
Another release term arises from the tendency of dissolved gas at the surface of a liquid to escape to the air across the water-air boundary. Estimating the magnitude of this release term requires calculation of an effective exchange coefficient for argon (exchange coefficient being the amount of gas in a unit volume exchanged at the surface per unit time per unit area).
Other reactor facilities have analyzed this problem and provide possible exchange coefficients that appear to cover a wide range. For example, analyzing the gas exchange at the liquid-gas boundary in terms of the diffusion coefficient of argon gas dissolved in water and the meansquare distance traversed by a molecule, an estimate of 2.35x10⁻³ cm/second is obtained. However, measurements made of the 41Ar activity in the pool water of a TRIGA Mark Ill and subsequent analysis of these data indicate an exchange coefficient of about 2.9x10⁴
cm/second. Further, Dorsey [5] reports approximately equal surface exchange coefficients for gases such as air, 02, and N2. Assuming that the exchange properties of argon are similar to those Of these gases, an exchange coefficient of about 5. 7x10⁻³ cm/second is possible. Note that these estimates vary by almost a factor of 10.
In the interest of conservatism, the largest exchange coefficient (5.7x10⁻³ cm/second) is assumed in this calculation. Using this, the release rate from gas exchange at the surface of the pool is given by:
where
82 = 0.938N41As
N41 = concentration of 41Ar atoms in the pool water,
B = exchange coefficient, and
As = surface area of the pool (3.646x104 cm2)
Using this equation a release rate of 1.45x1 as atoms/second is obtained. Now, the total source term for 41Ar released from the pool water is obtained by adding this to the previous estimate for dissolved argon:
841 = 81 + 82
= (4.36x1 as + 1.45x1 as) atoms/second
= 6.81x10s atoms/second.
127

The Ohio State University Research Reactor
Safety Analysis Report October 2018
This is the source term for 41Ar released from the pool water to be used later in estimating doses and isotopic concentrations. The source term assumes 500 kilowatt operation for a time sufficient to attain saturation activity.
6.1.2.3 Nitrogen-16 Production from Pool Water
Section 6.1.2.2 above derived an exposure time of 9.4 seconds for water flowing through the core. The concentration of 16N atoms per cc of water leaving the reactor core can be estimated from the following modified form of the activation product production equation:
where
N = [Ccrnp(pt(1-e-M)]/J..
N = concentration of 16N atoms leaving the core,
C = concentration of oxygen atoms in the pool water,
Onp = n-p microscopic cross-section for 160,
<pt= spectrum-averaged fast neutron flux (0.6-15 MeV),
t = exposure time (9.4 seconds), and
.>..=decay constant for 16N (9.761x10⁻² second-1).
It remains to find appropriate values to substitute into this equation.
First, the concentration of oxygen atoms in water can be taken to be approximately 3.3x10²²
atoms of oxygen per milliliter of water. This value ignores dissolved air in the water, as the number of atoms of oxygen from the water molecules far outweighs the number from dissolved air in the water.
Next, the spectrum-averaged microscopic cross-section of 160 is taken to be about 0.021 millibarns, or 2.1x10⁻²⁹ cm2 . This assumes an integration range of 0.6 MeV to 15 MeV incident neutron energy.
Finally, a value must be assigned for the spectrum-averaged fast neutron flux. The crosssection threshold for the n-p reaction in 160 is about 9.4 MeV, but this must be corrected for center-of-mass effects. When these are taken into account, the effective incident neutron energies are about 10.2 MeV. This relatively high threshold energy results in severe limitation of 16N production, since relatively few neutrons in the OSURR in-core neutron spectrum fall above this threshold. Horning [3] reports a value of 8.4x10¹⁰ neutrons/cm2/second for neutrons above 0.5 MeV (sometimes called the "fission" component) at the central irradiation facility (assumed to be the peak flux) for the HEU-fueled OSURR. Assuming that the LEU-fueled OSURR in-core neutron spectrum is about 15% "harder" (based on experience of other core conversions), and that the power is increased by a factor of 50, the effective neutron flux above 0.5 MeV is assumed to be 4.83x10¹² neutrons/cm2/second.
Substituting values into the production equation yields an estimate of 2.01x10⁶ atoms of 16N per milliliter of water leaving the reactor core. This is assumed to be an equilibrium concentration, given the very short half-life of the isotope. If the volume flow rate through the core calculated in Section 6.1.2.2 (4646.8 cc/sec) is multiplied by this concentration, a rate of 9.34x10⁹ atoms of 16N per second are released from the core. Multiplying this by the decay constant for 16N and converting to activity units gives a release term of 24.64 millicuries of 16N per second released from the top of the core.
128
The Ohio State University Research Reactor
6.2 Liquid Effluent Waste Management
6.2.1 Pool Water Monitoring
Safety Analysis Report October 2018
Normally, no water is released from the reactor pool. The water level of the pool is visually checked prior to each startup of the reactor. The reactor safety system has a reactor trip function should the pool water fall below a setpoint. The water process system has a water inlet valve controlled by a second water level sensor switch to add makeup water to the reactor pool.
The concentration of gamma-emitting radionuclides in the reactor pool water is checked as part of routine maintenance and surveillance activities. Gamma dose rates above the pool are monitored continuously by an area radiation monitor (ARM). An additional ARM monitors dose rates in the area where the reactor pool demineralizer is located. This unit traps most of the 24Na activity contained in the reactor pool water. After each reactor shutdown, the on-contact dose rate of this demineralizer is measured and recorded. If necessary, the area is posted and access to it is controlled.
6.2.2 Secondary Loop Coolant Monitoring
Under normal conditions, no radionuclide concentrations should be present in the secondary coolant. However, to assure this, the dose rate at the corrosion product trapping filter near the secondary coolant pump is surveyed routinely as part of surveillance and maintenance activities. In addition, the secondary coolant is sampled quarterly and analyzed for the presence of gamma-emitting radionuclides.
6.2.3 Liquid Effluent Releases
If significant radionuclide concentration in either the primary or secondary coolant is suspected (above that which is routinely encountered), appropriate procedures are invoked to determine the radionuclide identity, concentration, and release pathway. Based on these tests, necessary corrective action can be taken.
Should release of all or part of the coolant inventory be deemed necessary for repair and/or maintenance activities, appropriate procedures based on the results of the radionuclide assay will be followed to assure compliance with regulations specified in 10CFR, part 20. In most cases, immediate release of the pool water to the city sewage system will be allowed. If not, the fluid will be held until sufficient decay time has elapsed to reduce radionuclide activities to permissible release levels. Otherwise, alternate storage/disposal methods and procedures will be followed.
6.2.4 Cooling System Maintenance Operations
6. 2.4. 1 Draining, 8/owdown, and Purging
At the lowest point in the secondary loop of the cooling system, a trap and drain valve is available for drawing a small sample of secondary coolant. Additional coolant draining can be done at this point to remove larger volumes of fluid.
Maintenance of the secondary coolant chemical and fluid properties can be achieved by intermittent blowdown procedures. A small amount of fluid can be withdrawn from the drain valve and replaced with fresh fluid at the surge tank charging port. The entire volume of secondary coolant can be purged, if necessary, and refilled from the charging port.
An isotopic assay will be performed on all fluid withdrawn from the secondary coolant. If significant quantities of radionuclides are detected, they will be identified and quantified. Based
..... 129
The Ohio State University Research Reactor
Safety Analysis Report October 2018
on these data, appropriate procedures will be followed prior to release of any secondary coolant, and tests will be conducted to determine the primary-secondary leakage path. Appropriate repair and maintenance actions can then be taken.
6.2.4.2 Tertiary Loop Effluent Holdup
There is a very small probability that the city water supply used in the tertiary coolant loop could be contaminated by primary coolant. The probability of significant levels of contamination being present is low, since it would require a primary-secondary-tertiary leakage path. Because this path requires leaks in two heat exchangers and the secondary coolant is monitored for radioactivity, sampling the tertiary loop is not necessary.
6.3 Gaseous Effluent Waste Management
6.3.1 Effluent Monitoring System
Gaseous radionuclides are detected by an effluent monitoring system. This system extracts a sidestream of the air ejected from the reactor building by the building ventilation fan. The sampled air is introduced to a shielded volume containing a double-sided pancake-type GeigerMueller detector. Detector output is counted on a rate meter in the control room, and displayed and recorded on a panel-mounted digital recorder.
System response is calibrated for 41Ar activity. Detector count rate is noted.in the control room. The count rate for the derived air concentration (DAC) of 41Ar is posted at the recorder. Total 41Ar production is tabulated on a yearly basis and compared with permissible limits.
6.3.2 Blower Effluent Monitor
As of 2009 the rabbit blower exhaust stream monitor is no longer in use. All requirements related to this system were removed from the technical specifications when the license was renewed in 2008.
6.3.3 Release Points
The primary gaseous effluent release point is from the building ventilation fan located at the top of the north wall of the building. This vent is about 30 feet above floor (ground) level. The ventilation fan creates a building exhaust stream that has been measured at a volume flow rate of approximately 1000 CFM, or about 4. 72x105 cc/second. Assuming a building volume of 70,000 cubic feet, an exchange time of 70 minutes is obtained. Note that while a value of 1000 cfm is used as the nominal volumetric flow rate for calculations, calculations have also been performed for 500 cfm and 1500 cfm, and select results will be included to demonstrate that the exact flow rate does not affect safety.
Other release pathways are available, such as through open building doors, windows, the vent fan in the control room, and the fume hood in room 104. However, the total capacity of these release pathways is small compared with the building vent. In addition, the pathways are normally unavailable for release during reactor operation, since building doors are closed, the fume hood is not operated continuously and is used sparingly, and windows, being located in offices and classrooms, are usually closed since these areas are serviced by the building HVAC systems. Only the vent fan in the control room is used a significant amount of the time, and the control room is normally isolated (door is closed) from the main reactor room.
Within the confines of the building, release points for gaseous effluents can be identified. For non-vented experimental facilities, gaseous effluent release is limited since the facilities are either plugged or closed when not in use. Any venting of gaseous radioisotopes will occur at the
130

The Ohio State University Research Reactor
Safety Analysis Report October 2018
point where the facility exits from the reactor pool or shielding wall. These points are identified in Table 6.4. The exhaust point for the rabbit blower is located at the end of the exhaust pipe at the top of the building, near the north wall.
6.3.4 Estimated Releases in the Restricted Area
6.3.4.1 Types of Releases
Release of 41Ar from experimental facilities can occur as either a puff or, for a vented facility such as the rabbit or the surface of the pool, a continuous stream. Section 6.1.2 discussed the estimated source terms for 41Ar from experimental facilities and 41Ar and 16N from the surface of the pool, assuming 500 kilowatt operation. The following sections will analyze individual release scenarios and their consequences. These analyses concern releases made within the confines of the reactor building, which is defined as a restricted area.
6.3.4.2 Puff Release from the Rabbit
Saturation levels of 41Ar can build up in the effective volume of the rabbit facility during a long reactor operation with the rabbit system blower turned off. Table 6.3 shows a saturation activity of 16.3 millicuries. of 41Ar being in the rabbit volume under these conditions. The release scenario assumes that the rabbit system blower is then activated and the entire activity is instantaneously and perfectly mixed with the 70,000 cubic feet of air in the reactor building.
Diluting the 16.3 millicuries of 41Ar in the. building atmosphere leads to a concentration of 8.22x1 o-6 microcuries of 41Ar per cc of air in the building. Table I of Appendix B, 1 OGFR20, shows a DAG of 3x10⁻⁵ microcuries/cc for 41Ar, which assumes a 2000 hour working year as an available averaging time. The estimated release for this scenario exceeds the DAG by a factor of about 2.74 times. Thus, an effective exposure time of about 730 hours at the predicted concentration from the puff release would be allowed under DAG yearly restrictions, assuming that the released concentration remains constant over this time. This assumption, however, is very conservative since the concentration will diminish with time as a result of building purging and radioactive decay.
An accurate analysis of building concentration requires consideration of the reduction in concentration as a function of radioactive decay and building purging. Treatment of this problem is similar to analysis of a radioactive material passing through a biological system, where radionuclide concentration decreases after initial introduction because of physical decay and elimination from the system by purging processes. This leads to the concept of the effective half-life, defined as follows;
Te = (Td x Tp)/(Td + Tp)
where = effective half-life
Td = half-life from radioactive decay, and
T P = half-life from building purging.
From the building exhaust rate of 1000 GFM, and a building volume 70,000 cubic feet, a purging time of 70 minutes is obtained. A relatively simple analysis of the inflow and outflow of the building, assuming an equilibrium condition, shows that the value for Tp in the above equation should be 70 minutes. Using this, and assuming a value of 1.83 hours for the radiometric halflife of 41Ar, an effective half- life of 42. 75 minutes is obtained for 41Ar in the reactor building.
131

The Ohio State University Research Reactor
Safety Analysis Report October 2018
Notes:
Table 6.4: Release Points of the Various Experimental Facilities of the OSURR
Facility Release Point Release Aperture Description Location Description
CIF Top of Reactor Pool, Open Aluminum Tube, About 20' Elevation 1.38" Diameter
Beam Port 1 North Reactor Bay, ,·. Open Port, Flush With Shield, About 5' Elevation 7.125" Diameter
Beam Port 2 North Reactor Bay, Open Port, Flush With Shield, About 4' Elevation 7.125" Diameter
Rabbit Building North Wall, Open Aluminum Tube, About 28' Elevation 3" Diameter
Thermal Column West Side of Building, Open Stringer, 1 '-6' Elevation 4" x 4" Square Opening
4" Dry Tube Top of Reactor Pool, Open Aluminum Tube, About 20' Elevation 3.486" Diameter
2" Dry Tube Top of Reactor P,ool, Open Aluminum Tube, About 20' Elevation 2.05" Diameter
(1) Elevations shown above are referenced to the floor of the reactor building.
(2) Aperture release points for the two beam ports assume that one or the other is open for an experiment, with no shielding plugs or other apparatus restricting access to the interior of the tube.
(3) The aperture for the thermal column assumes a single stringer position completely opened.
132

The Ohio State University Research Reactor
Safety Analysis Report October 2018
Now, if one assumes that most 41Ar activity is lost after five effective half-lives have elapsed (213.75 minutes), the average concentration of 41Ar in the reactor building during this time can be obtained by integrating the time-dependent concentration over this time:
where
t2
Cave = C0 f e-itdtl(t2 - t1)
!1
Cave = average concentration of 41Ar in the Reactor building during the time interval from t1 to t2,
Co = initial 41Ar concentration,
t1 = time at the beginning of the release (0 minutes),
h = time at the end of the release (213.75 minutes),
>.. = decay constant (0.693/Te = 1.62x10⁻² min-1).
Performing this integration leads to the following expression for average concentration:
Cave = (Co/11.t)[1 - e-it].
Substituting t = 213. 75 minutes, and appropriate values for Co and 11., an average concentration of 2.3x10⁻⁵ microcuries of 41Ar per milliliter of building air is obtained. This average 41Ar concentration is below the DAC limit of 3x1 o-s µCi/ml. This calculation is conservative in that it assumes a saturation activity in the rabbit effective volume being available for a puff release. Note that this result was calculated assuming a nominal volumetric flow rate of 1000 cfm. If the actual flow rate were different than this, the calculated concentration would not be different, as this methodology averages over five effective half-lives of 41Ar, in which the effective half-life takes into account losses from exhaust.
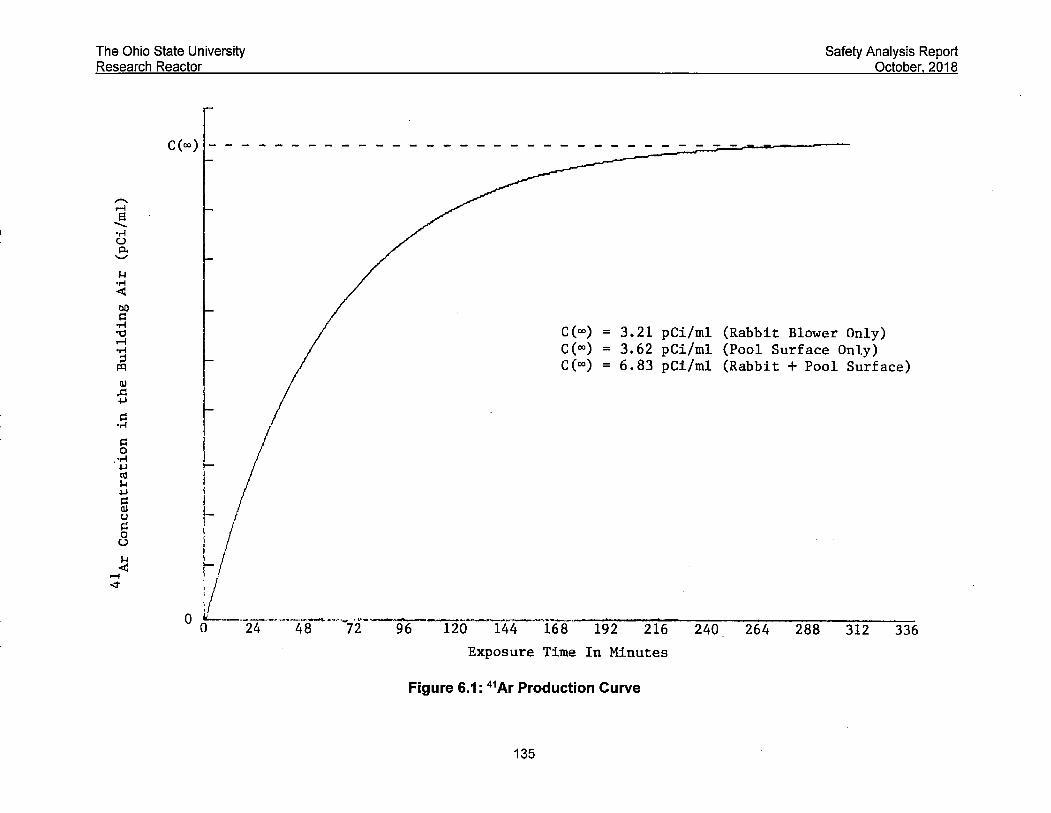
6.3.4.3 Continuous Release from the Rabbit
Section 6.1.2.1 estimated a source term of 1. 72 microcuries of 41Ar per second being produced in the exhaust of the rabbit blower at 500 kilowatts. Expressing the concentration buildup of the isotope in the air of the reactor building, accounting for losses from radiological decay and building purging, leads to an equation similar in form to the production of a radioactive material by neutron irradiation, assuming a constant term for isotope production:
where
C(t) = P(1- e-it )/(11. V)
C(t) = time-dependent concentration of 41Ar in the building air at time t after starting the rabbit blower,
P = production rate of 41Ar in the rabbit blower exhaust stream,
t = time the blower has been running,
" = effective half-life defined earlier, and
V = building volume.
Figure 6.1 shows the time-dependent behavior of the 41Ar concentration in the building air. The concentration approaches an equilibrium value when t becomes large. For conservatism, assume that this equilibrium value has been reached. Substituting appropriate constants in the above equation leads to an estimate of 3.21x10⁻⁶ microcuries of 41Ar per milliliter of air in the building at equilibrium. This about 7% above the DAC limit for a restricted area, which limits the exposure time at this concentration to about 1869 hours per 2000-hour working year.
133

The Ohio State University Research Reactor
Safety Analysis Report October 2018
Essentially, the rabbit blower may run with the reactor at full power for most of the working year. It is difficult to postulate a reactor operation involving continuous rabbit blower operation for anything on the order of 1869 hours at a time. Note that this result was calculated assuming a nominal volumetric flow rate of 1000 cfm. If the actual flow rate were different than this, the 41Ar concentration would vary inversely with flow rate. For example, a volumetric flow rate of 500 cfm would yield an estimated building 41Ar concentration of 4.62x1 o-s µCi/ml, which is 54% above the DAG limit, limiting rabbit blower operation to 1298 hrs per year. This is still significantly greater than actual intended use of the rabbit. Conversely, a volumetric flow rate of 1500 cfm would yield an estimated concentration of 2.46x1 o-s µCi/ml, which is below the DAG limit.
Another way of analyzing continuous 41Ar release from the rabbit is to set C(t) in the above equation equal to the DAG limit (3x1 o-s microcuries per milliliter) and solve the equation for the rabbit blower operation time (t). Doing this, a blower operation time of about 10033 seconds is obtained. Thus, the rabbit blower may operate about 2.8 hours before a DAG level of 41Ar is reached in the building air. Most rabbit operations involve blower run times on the order of 20 minutes or less. Note that this result was calculated assuming a nominal volumetric flow rate of 1000 cfm. If the actual flow rate were different than this, the calculated time would vary as a function of flow rate. For example, a volumetric flow rate of 500 cfm would yield an estimated time of 1.6 hours to reach the 41Ar DAG limit, which is still much greater than the typical rabbit irradiation of 20 minutes or less. Conversely, there would be no time limit corresponding to a volumetric flow rate of 1500 cfm.
6.3.4.4 Puff Release from the Rabbit Carrier Tube
Reactor operations involving rabbit irradiations require use of a carrier tube to insert and remove samples from the rabbit facility. Each irradiation therefore involves a puff release from the carrier tube when it is opened. Since this is a commonly-performed operation, it is analyzed separately here.
Table 6.3 lists a source term for saturation 41Ar in the rabbit carrier tube of 1.11x10³ microcuries. Assuming that this source is instantaneously and perfectly mixed with the air in the reactor building, a concentration of 5.6x10⁻⁷ microcuries per milliliter results. This is less than the DAG of 3x1 o-s microcuries/ml allowed for 41Ar in a restricted area. Therefore, puff releases from the rabbit carrier tube are allowable even if the activity in the tube has reached saturation levels (which is unlikely in almost all conceivable rabbit operations).
134
The Ohio State University Research Reactor
Safety Analysis Report October 2018
C(oo) - - - - - - - - - - - - - - - - - - - - - - - - - - -~-~-~-~-~-~~~~-
i r I I
~ l i
i 1.
V
I
C(00) = 3.21 pCi/ml (Rabbit Blower Only)
C(00) = 3.62 pCi/ml (Pool Surface Only)
C(00) = 6.83 pCi/ml (Rabbit+ Pool Surface)
0 &L.__ _____ ···-·-·-·--·-----. ~ ..... _ .... _._.....,. __ ..,..___ ___ ....... ,_ ___ ..,.... __ , .. _____________________ _
0 24 48 72 96 120 144 168 192 216 240 _ 264 288 312 336
Exposure Time In Minutes
Figure 6.1: 41Ar Production Curve
135

The Ohio State University Research Reactor
6.3.4.5 Puff Releases from Other Experimental Facilities
Safety Analysis Report October 2018
Using the source term estimates from Table 6.3, a similar analysis for puff-type releases from the other experimental facilities was done. Table 6.5 shows the estimates for initial and average concentration of 41Ar in the reactor building atmosphere. The average concentration assumes an averaging time equal to five times the effective half-life of 41Ar in the building. The last column shows the relationship between the average concentration in the building air and the allowable DAC limits for a restricted area (factor = average concentration/DAG). Note that puff releases from the rabbit, the rabbit carrier tube, the thermal column, and the 2 inch dry tube result in average 41Ar concentration less than restricted area DAC for releases averaged over five effective half-lives. Thus, under these conditions, no operational limits need to be established.
Table 6.6 shows operational limits on facility use for a 2000-hour work year. The last column in Table 6.6 shows the length of operation time necessary to attain a DAC level of 41Ar in the building, while the other column assumes a saturation level released in the initial puff and predicts the allowed exposure duration at the resulting concentration in the building. Note that these results were calculated assuming a nominal volumetric flow rate of 1000 cfm. If the actual flow rate were different than this, the calculated concentrations would not be different, as this methodology averages over five effective half-lives of 41Ar, in which the effective half-life takes into account activity losses from exhaust.
Assuming that a single saturation-level puff release occurs over a time equal to about five effective half-lives (213.75 minutes), dividing this release time into the calendar year hours of operation limit indicates how many releases of this type may be made during the calendar year. For example, the releases per calendar year for Beam Port 1, which has the lowest hourly limit, yields about 73 puff-type releases per year to stay within DAC limits. Similarly, for puff releases from the rabbit, about 732 releases are allowed. In all cases, based on previous operating history, it is unlikely that the total puff releases from these facilities during a calendar year will exceed these estimates. Note that these results were calculated assuming a nominal volumetric flow rate of 1000 cfm. If the actual flow rate were different than this, the calculated number of allowable puff releases would vary inversely with flow rate. For example, a volumetric flow rate of 500 cfm would yield an estimated 51 Beam Port 1 puff releases or 509 rabbit puff releases allowable, which are still unlikely to occur in a work year. Conversely, a volumetric flow rate of 1500 cfm would yield an estimated 95 Beam Port 1 puff releases or 956 rabbit puff releases allowable.
136

The Ohio State University Research Reactor
Safety Analysis Report October 2018
Table 6.5: Estimated 41Ar Concentrations for Puff Releases of Saturation Activities of 41Ar from the Various Experimental Facilities of the OSURR
Notes:
Facility Initial 41Ar Average 41 Ar DAC Factor For Concentration Concentration Average Description
(µCi/ml) (µCi/ml) Concentration
CIF 1.23 X 10⁻⁵ 3.44 X 10⁻⁶ 1.15
Beam Port 1 8.27 X 10⁻⁵ 2.31 X 10⁻⁵ 7.70
Beam Port2 6.36 X 10⁻⁵ 1.78 X 10⁻⁵ 5.93
Rabbit 8.22 X 10⁻⁶ 2.30 X 10⁻⁶ 0.77
Thermal Column 4.71 X 10⁻⁶ 1.32 X 10⁻⁶ 0.44
Rabbit Carrier 5.60 X 10⁻⁷ 1.57 X 10⁻⁷ 0.05
4" Dry Tube 1.63 X 10⁻⁵ 4.56 X 10⁻⁶ 1.52
2" Dry Tube 5.65 X 10⁻⁶ 1.58 X 10⁻⁶ 0.53
(1) The initial concentrations shown above assume instantaneous and perfect mixing with the building air.
(2) The average concentrations shown above assume losses of initial activity from radioactive decay and building purging. The effective half-life is taken to be that derived in the accompanying text. The release is averaged over five effective half-lives.
(3) The DAG factor shown above is calculated by dividing the average concentration by the DAG for 41Ar in a restricted area (3x1 o-6 µcuries/ml). ·
137
_j

The Ohio State University Research Reactor
Safety Analysis Report October 2018
Table 6.6: Operational Limits and Activation Time Estimates for the Various Experimental Facilities of the OSURR
Facility Limit of Full-Power Hours Activation Time Required To Attain Average 41Ar Concentration Equal to Description of Operation Per Year
DAC
CIF 1739 329 minutes
Beam Port 1 260 10 minutes
Beam Port2 337 14 minutes
Rabbit ·, 2608 No Limit
Thermal Column 4545 No Limit
Notes:
Rabbit Carrier 45000 No Limit
4" Dry Tube 1316 170 minutes
2" Dry Tube 3774 No Limit
(1) Where the limits on full-power operation exceed 2000 hours per calendar year, there are no limits on facility use under the assumptions of this analysis.
(2) The limits expressed above assume a puff release at saturation activity levels in a completely voided effective volume of the facility.
(3) The limits on full-power operation are in fact effective exposures times allowed at the estimated concentration. DAC limits are not exceeded if exposure times are less than or equal to this value.
138

The Ohio State University Research Reactor
6.3.4.6 Continuous Release of 41Ar from the Pool Water
Section 6.1.2.2 estimated a release rate from the pool water for 41Ar of:
S41 = 6.81x10⁸ atoms/second.
Safety Analysis Report October 2018
Multiplying this release rate by the radiological decay constant for 41Ar (1.0519x10⁻⁴ second-1) and converting activity to microcuries leads to an estimate of 1.936 microcuries/second released from the pool. Using the concept and equation developed in Section 6.3.4.3 for continuous discharge of 41Ar from the rabbit blower, an equilibrium concentration of 3.62x10⁻⁵ microcuries of 41Ar per milliliter of building air. This is about 21% above the DAG for 41Ar in a restricted area, and thus would limit reactor operation (effective exposure time) to 1657 full-power equivalent hours each calendar year. Since this would average out to about 6.6 full-power equivalent hours of operation each day, it is unlikely that OSURR operation would result in exceeding restricted area DAG for 41Ar.
Note that these results were calculated assuming a nominal volumetric flow rate of 1000 cfm. If the actual flow rate were different than this, the calculated concentration would vary inversely with flow rate. For example, a volumetric flow rate of 500 cfm would yield an estimated building concentration of 5.20x10⁻⁵ µCi/ml, which is 73% above the DAG limit and would limit operations to 1153 full-power hours per year. Conversely, a volumetric flow rate of 1500 cfm would yield an estimated building concentration of 2. 77x10-5 µCi/ml, which is below the DAG limit. As will be discussed later, operational data indicates that these calculations are very conservative, likely because the calculation being performed does not account for the cooling system return sending a blanket of water above the core and reducing the amount of 41Ar released from the pool.
6. 3. 4. 7 Combined Continuous Release from the Pool & Blower
The release rate of 1.936 microcuries of 41Ar per second calculated above for the pool water can be added to the rabbit blower source term estimated in Section 6.1.2.1 of 1.72 microcuries/second to yield a combined continuous source term of 3.656 microcuries of 41Ar added to the building air per second. Using the equation developed in Section 6.3.4.3 and substituting appropriate constants gives an equilibrium concentration of 6.83x10⁻⁵ microcuries of 41Ar per milliliter of building air. This is a factor of about 2.28 above the DAG allowed in a restricted area. Using an averaging time of 2000 hours, an effective exposure time of 878 hours is allowed. Thus, operation with the reactor at full power and the rabbit blower running is restricted to this number of hours each working calendar year. It allows an average of about 3.5 full-power equivalent hours each day of combined full: power reactor operation with the rabbit blower running continuously.
Solving the characteristic equation for run time, assuming the production rate above, leads to a run time of about 2141 seconds, or about 35 minutes, to attain a DAG level in the building air. Again, most rabbit operations will involve run times of 20 mioutes or less.
Note that these results were calculated assuming a nominal volumetric flow rate of 1000 cfm. If the actual flow rate were different than this, the calculated concentration would vary inversely with flow rate. For example, a volumetric flow rate of 500 cfm would yield an estimated building concentration of 9.82x10⁻⁶ µCi/ml, which is 3.27 times the DAG limit and would limit operations to 611 full-power hours per year. Conversely, a volumetric flow rate of 1500 cfm would yield an estimated building concentration of 5.23x10⁻⁶ µCi/ml, which is 1. 7 4 times the DAG limit and would limit operations to 1148 full-power hours per year. As will be discussed later, operational data indicates that these calculations are very conservative, likely because the calculation performed for 41Ar released from the pool water does not account for the cooling system return
139
The Ohio State University Research Reactor
Safety Analysis Report October 2018
sending a blanket of water above the core and reducing the amount of 41Ar released from the \ pool.
6.3.4.8 Continuous Release of 16N from the Pool Water
Section 6.1.2.3 provided calculations to show that the release rate of 16N from the core is about 2.01x10⁶ atoms of 16N per milliliter of water per second, or a total of 9.34x10⁹ atoms of 16N per second (24.64 millicuries/second). This source term must be diluted to account for delay in traversing the distance from the top of the core to the surface of the pool.
Using the average coolant velocity through the core of 6.5 cm/second noted in Section 4.8 and assuming a constant average coolant velocity from a point immediately above the core to the surface of the pool, the total transit time is obtained by dividing the distance from the top of the core to the surface by the velocity. Given that the minimum depth of water in the reactor pool is 15 feet (457.2 cm), a total transit time of 70.34 seconds is obtained. This estimate is conservative in that it ignores delay times resulting from pool water mixing and dispersion by the cooling system pump. Essentially, it assumes the cooling system dispersion pump is off, but the reactor is at full power. This condition is prohibited by the reactor safety system, which initiates a reactor trip if the power rises above 100 kilowatts with the primary coolant pump off.
The 16N concentration at the pool top can thus be estimated from:
where
C = Coe·'-1
C = concentration of 16N atoms at the pool surface,
>.=decay constant for 16N,
Co= concentration of 16N atoms immediately above the core, and
t = transit time from the core to the pool surface.
Substituting appropriate constant in this equation yields a concentration of 2096.9 atoms of 16N per milliliter of pool water at the surface of the pool.
As the 16N-bearing water reaches the surface of the pool, it spreads across the surface in the shape of a disk, forming an area source of radiation and a release interface to the building air. For the purpose of this calculation, assume that the disk has a radius of 85 cm, which is about the width of the reactor pool. The time the water takes to spread across this area, assuming a 6.5 cm/sec constant velocity is
t = r/v = (85 cm)/(6.5 cm/sec) = 13.07 seconds.
During this distribution time, the concentration of 16N decays from that initially available in the rising plume from the core. The average concentration of N across the surface of the disk source given by:
t
N = ! J N0e-'-1dt = No (1-e-'-1) t
O At
where t = spreading time across disk surface,
>.=decay constant for 16N, and
N = initial 16N concentration at the pool surface.
From earlier calculations, we find that N = 2096.9 atoms/ml, A = 9.761x1Q·2 second·\ and t = 13.07 seconds. Performing the caiculation gives an average disk source concentration of 1184.8 atoms of 16N per milliliter in the disk source at the surface of the pool.
140
The Ohio State University Research Reactor
Safety Analysis Report October 2018
For estimation of the release rate of gaseous radionuclides to the air of the building, the number of 16N atoms diffusing from the surface of the disk source to the air must be estimated. Dorsey [5] reports an escape velocity of 9x10⁻³ cm/second for nitrogen atoms from water. Multiplying this by the average concentration of nitrogen iri the disk source gives:
S = Cv = (1184.8 atoms/cc)(9x10-3 cm/sec)
= 10.66 atoms/cm2/second:,
The total release rate of atoms of 16N to the building air would be the area of the disk (85 cm equivalent radius) times the emission rate per unit area noted above. The release rate to the building air is thus 2.4196x10⁵ atoms of 16N per second.
As the 16N atoms enter the reactor room air, their concentration is reduced by dilution into the volume of the building, exhausting through the ventilation fan, and radioactive decay. Since the half-life of 16N is very short (7.1 seconds) compared to the building purge time (70 minutes, or an effective half-life for air in the building of 70 minutes), the radioactive half-life will dominate the effects of concentration reduction resulting from decay. The rate of buildup of 16N in the building air is given by:
where
d(~N) =8-( A+ ;()vN
S = release rate of 16N atoms to the air,
'A= decay constant of 16N,
q = building ventilation rate,
N = concentration of 16N in the building air, and
V = building volume.
Under equilibrium conditions, the time rate of change of the concentration is zero, and the above equation can be solved for, N:
N = S/(XV + q)
Substituting known values in this equation gives an equilibrium concentration of 1.25x10⁻³ nuclei of 16N per milliliter of building air. Converting this to activity units gives a concentration of 3.3x10⁻⁹ microcuries of 16N per cc of building air. Table I of Appendix B, 1 OCFR20 does not have a listing for 16N. However, it states that, "Any single nuclide not listed above with decay mode other that alpha emission or spontaneous fission and with radioactive half-life of less than 2 hours", has a DAC of 1x10⁻⁷ µCi/ml. The calculated value for 16N concentration is well within this bound.
For this calculation, assume that the volume of the building is represented by a hemisphere with an effective radius of 980 cm (about 32 feet). The dose rate resulting from the 16N concentration calculated above, dispersed in this volume, can be estimated by:
where
R = K1NR/2K2
K1 = 3. 7x10⁴ photons/second/microcurie,
N = 16N concentration in the building air,·
R = effective building radius, and
K2 = 1.6x10⁵ photons/sec-cm2 /rad-hr.
141

The Ohio State University Research Reactor
Safety Analysis Report October 2018
Performing this calculation yields an estimate of3.75x10-7 rads/hr in the building from dispersed 16N, or about 0.4 microrads/hr.
6. 3. 4. 9 Actual 41 Ar Releases
The actual releases of 41Ar into the restricted area can be calculated from an effluent monitor near the intake of the building exhaust fan. It will be assumed that the concentration of 41Ar measured by this monitor is representative of the concentration in the reactor building. This is a conservative assumption in that the outlet for the rabbit is very near the intake for the effluent monitor, which will result in a higher reading than that of the rest of the building. In the half-year period from 1/1/99 to 6/30/99, the effluent monitor at the building exhaust fan measured a net count of 1,923,402 counts. The calibration for this monitor is 19.3 counts/second corresponds to 3x10⁻⁵ µCi/ml. Assuming that % of the work year is 1000 hours, this gives a concentration of
1,923,402 counts * 3x10⁻⁶ µCi/ ml = 8_30x10-a µCi I ml
1000 hr* 3600 sec/ hr 19.3 counts/sec
This is well below the DAG limit for 41Ar in restricted areas of 3x10⁻⁵ µCi/ml. Data from the past decade (2008-2017) is consistent with these results. The average concentration for this period, assuming 2000-hr work years, is 6.01x10⁻⁸ µCi/ml, which is 2% of the DAG. Note that this result is unaffected by the assumed 1000 cfm nominal volumetric flow rate of the exhaust fan, as the effluent monitor directly measures the 41Ar concentration upstream of the exhaust fan.
This shows that the calculations for 41Ar releases, particularly for pool water releases, are conservative. The average number of effective full-power hours during the period 2008-2017 was 72.6 hr. Given that this corresponds to 2% of the DAG, scaling to 2000 hrs results in only 55% of the DAG. Clearly, the estimate of full-power operations being limited to 1153 hours by 41Ar releases from the pool in Section 6.3.4.6 is conservative, particularly given that some of the 41Ar that contributed to the 2% of DAG average for 2008-2017 was from other releases, such as the rabbit.
6.3.5 Releases from the Restricted Area
Once gaseous radionuclides are released to the building atmosphere, they begin to be discharged to the outside environment by the building ventilation fan. As noted in the earlier analyses, this fan has a measured capacity of 1000 CFM, which results in a building purge time of 70 minutes. The exhaust point is approximately 32 feet above ground level, at the roofline of the building along the north wall. The exhaust stream exits the building parallel to the ground.
The following sections will consider the dilution factors available for the building releases and analyze several release cases.
6. 3. 5. 1 Dilution Factor
Radionuclides contained in the building exhaust stream will mix with the outside air in the lee of the building. The dilution resulting from this mixing effect can be described as:
Ao = AqljJ(X)
where Ao = effective exposure concentration in curies/m3,
q = building exhaust rate in m3/second,
l!J(X) = dilution factor at distance x, in sec/m3, and
A = activity concentration in the exhaust stream.
142

The Ohio State University Research Reactor
Safety Analysis Report October 2018
The dilution factor is computed for the lee of the building (x=O), and assumes that the release is made from the roofline of the building. Further, assume that the wind velocity is steady at the time of the release and is equal to· 1 m/sec. The dilution factor can be written as:
4J(O) = 1/[(0.5)(s)(u)]
where u = wind velocity in m/second, and
s = building cross-sectional area normal to the wind direction in m2•
Assuming that the prevailing westerly winds are blowing at the time of the release, a normal cross-sectional area of 201.6 m2 is presented to the wind. Substituting values into the above equation indicates a dilution factor of \j/(0) = 9.921x10⁻³ second/m3
.
The building exhaust rate is assumed to be 1000 CFM, or 0.47195 m3/second. Using this for q in the above equation and the value of \j/(0) calculated above, values for A can be substituted for various release cases. In the puff release cases analyzed in the following sections, the exhaust stream activity concentration is taken to be the average concentration over the release period shown in Table 6.5, column 3.
I
6..3.5.2 Puff Release from Various Facilities
Using appropriate data in the equations derived above, various concentrations in the air on the lee side of the reactor building were calculated. The results are shown in Table 6.7. The Effluent Concentration Limit for 41Ar in unrestricted areas is specified in Appendix B, Table II, Column 1 of 10CFR20 as 1x10·8 microcuries/ml.
To maintain releases to the outside air within Effluent Concentration Limits, either the source term must be reduced or operational limits imposed so that when the releases are averaged over the permitted averaging time, the average concentration does not exceed the limit. For releases to unrestricted areas, 10CFR20 specifies an averaging time of one year. Table 6.8 shows the results of calculations based on these limits.
If one assumes that the releases occur over a time equal to 213. 75 minutes (five effective halflives of 41Ar in the building), dividing the operational limits shown in Table 6.8 by this gives an approximate number of puff-type releases of this type allowed in a year. About 228 releases are allowed for Beam Port 1, and 295 releases are permitted for Beam Port 2. Considering Beam Port 1 as the most restrictive case, 228 releases e~ch year would require an average of 4.38 releases of this type each week. It is very unlikely that OSURR operations would result in this frequent a release rate; so it is unlikely that unrestricted area limits will be exceeded.
It should be noted that the calculations shown above are conservative in that they assume a saturation activity source term in the puff releases, with the entire beam tube volume being air void. Generally, lower initial source activities will. be avail~ble for release, since reactor operation times less than that necessary to achieve. saturation activities of 41Ar (about 9 hours) are more common than those exceeding this duration, and many, if not most, reactor operations will have much less than the full volume of the beam tube voided. Thus, lower overall concentrations in the building and in the outside air will result.
143

The Ohio State University Research Reactor
Safety Analysis Report October 2018
Table 6.7: Estimated 41Ar Concentrations in the Lee of the Reactor Building for Puff Releases of 41Ar from the Various Experimental Facilities of the OSURR
Notes:
Facility Average Exhaust Outside 41 Ar DAC Factor For
Concentration Concentration Average Description (µCi/ml) (µCi/ml) Concentration
CIF 3.43x10·6 1.61x10·8 1.16
Beam Port 1 2.31x10·5 1.08x10·7 10.80
Beam Port 2 1.78x10·5 8.33x1 o-0 , 8.33
Rabbit 2.30x10·6 1.08x1o-a 1.08
Thermal Column 1.32x10·6 6.18x10⁻⁹ 0.62
Rabbit Carrier 1.56x10·7 7.30x10⁻¹⁰ 0.07
4" Dry Tube 4.57x10·6 2.14X10·8 2.14
2" Dry Tube 1.58x10·6 7.40x10·9 0.74
(1) The average exhaust stream concentration was taken from column 3 of Table 6.5. It assumes a puff release from the building and a purge time equal to five effective half-lives of 41Ar in the building.
(2) Of the above cases, releases from the CIF, beam ports, rabbit, and 4" dry tube result in outside concentration greater than the effluent concentration limit over the averaging time.
144

The Ohio State University Research Reactor
Safety Analysis Report October 2018
Table 6.8: Operational Limits for the Various Experimental Facilities of the OSURR to Maintain Unrestricted Area Effluent Concentration Limits on the Lee Side of the Reactor
Building
Notes:
Facility Limit of Full-Power Hours of Description Operation Per Year
CIF 7556.9
Beam Port 1 811.7
Beam Port2 1052.3
Rabbit 8116.7
Thermal Column No Limit
Rabbit Carrier No Limit
4" Dry Tube 4096.3
2" Dry Tube No Limit
(1) The limits expressed above assume a puff release at saturation activity levels in a completely voided effective volume of the facility.
(2) The limits on full-power operation are in fact effective exposures times allowed at the estimated concentration. Effluent Concentration Limits are not exceeded if exposure times are less than or equal to this value.
145

The Ohio State University Research Reactor
Safety Analysis Report October 2018
Also note that the results of this section were calculated assuming a nominal volumetric flow rate of 1000 cfm. If the actual flow rate were different than this, the calculated concentration would vary as a function of flow rate. For example, a volumetric flow rate of 500 cfm would result in a reduction in the calculated 41Ar concentration from a puff release for each of the experimental facilities. Conversely, a volumetric flow rate of 1500 cfm would result in increased 41Ar concentrations calculated for each facility, with a release from Beam Port 1 still being the most limiting. For this limiting case of Beam Port 1, calculations yield: for Table 6.7, 16.2 times the effluent concentration limit; for Table 6.8, 539 full-power hours of operation allowed in a year; and for number of Beam Port 1 releases allowed, 198 rather than 228. Even with this higher flow rate, these constraints would not be practically limiting.
6. 3. 5. 3 Continuous Release from the Rabbit Blower
The calculations shown in Section 6.3.4.3 indicate that an equilibrium concentration of 3.21x1Q-5
microcurieslml of 41Ar in the air of the reactor building will result from continuous operation of . the rabbit blower. Equilibrium concentrations will be present after about five effective half-lives
(213. 75 minutes). At equilibrium, the equation used in Section 6.3.5.1 will predict equilibrium concentrations in the air on the lee side of the building. Substituting appropriate values leads to an estimate of 1.5x1 o-s microcuries/ml of 41Ar. This is above the limit for 41Ar in an unrestricted area, which means that full-power reactor operation is limited to 5844 hours per year. This is well above the amount of time actually spent running at full-power in a year.
Note that the results of this section were calculated assuming a nominal volumetric flow rate of 1000 cfm. If the actual flow rate were different than this, the calculated concentration would vary as a function of flow rate. For example, a volumetric flow rate of 500 cfm would result in a reduction in the calculated 41Ar concentration to 1.08x1 o-s µCi/ml. Conversely, a volumetric flow rate of 1500 cfm would result in an increased calculated 41Ar release concentration of 1. 73x1 o-s µCi/ml, which would limit operations to 5071 hours per year.
6. 3. 5. 4 Continuous Release from the Pool Water
Section 6.3.4.6 noted that a building equilibrium concentration for 41Ar of 3 .. 62x10-5 microcuries per milliliter would result from releases from the pool water. The equation shown in Section 6.3.5.1 predicts an outside air concentration of 1.62x1 o-s microcuries of 41Ar per milliliter of air, which is also above the limit for 41Ar in an unrestricted area. This restricts operation to 5411 hours per year. ·
Section 6.3.4.8 gave an estimate of 3.3x10⁻⁹ µCi/ml for 16N restricted area concentration. Using the calculation from Section 6.3.5.1, this results in a unrestricted area concentration of 1.55x10⁻¹¹ µCi/ml. This well below the Effluent Concentration Limit for unrestricted areas of 1x1Q-9 µCi/ml. Most likely, the actual concentration will be far below that calculated since the seven second half-life of 16N will result in most of it decaying away before it reaches ground level.
Note that the results of this section were calculated assuming a nominal volumetric flow rate of 1000 cfm. If the actual flow rate were different than this, the calculated concentration would vary as a function of flow rate. For example, a volumetric flow rate of 500 cfm would result in a reduction in the calculated 41Ar concentration to 1.22x1 o-s µCi/ml. Conversely, a volumetric flow rate of 1500 cfm would result in an increased calculated 41Ar release concentration of 1.94x1 o-s µCi/ml, which would limit operations to 4505 hours per year.
146

The Ohio State University Research Reactor
6. 3. 5. 5 Combined Pool Water and Rabbit Blower Releases
Safety Analysis Report October 2018
If the source terms for continuous 41Ar production from the rabbit blower exhaust and pool water are added, the outside air concentration at equilibrium is estimated to be about 3.20x1 o-s microcuries of 41Ar per milliliter. The combined 41Ar release restricts the reactor to 2739 hours of full-power operation per year, which is still well above the number of hours actually run.
Note that the results of this section were calculated assuming a nominal volumetric flow rate of 1000 cfm. If the actual flow rate were different than this, the calculated concentration would vary as a function of flow rate. For example, a volumetric flow rate of 500 cfm would result in a reduction in the calculated 41Ar concentration to 2.30x1 o-s µCi/ml. Conversely, a volumetric flow rate of 1500 cfm would result in an increased calculated 41Ar release concentration of 3.67x1 o-s µCi/ml, which would limit operations to 2386 hours per year.
6. 3. 5. 6 Actual 41 Ar Released
Using the effluent monitor data for 1/1/99 to 6/30/99 along with the calculation method shown in Section 6.3.5.1 and the data shown in Section 6.3.4.9 yields an 41Ar outside air concentration of 8.87x10⁻¹¹ µCi/ml (assuming that half of a calendar year is 4383 hours).
"' 10-,; µCi a 1.923,402 cts -,x m s ------* mi* 0.47195-* 9.921x10⁻³ - = B.87x10-11 ~1Cifml 4383 hr,. 3600 ssc/hr 19.3 cts/ssc sec m 3
This is well below (0.9% of) the effluent concentration limit of 1x10-s µCi/ml given for 41Ar for unrestricted areas. Data from the past decade (2008-2017) is consistent with this result. The average concentration for this period, assuming 8766-hr calendar years; is 6.42x10~11 µCi/ml, which is 0.6% of the effluent concentration limit. Note that a 1000 cfm nominal volumetric flow rate was assumed for the exhaust fan to yield this result (0.47195 m3/s = 1000 ft3/s). If the actual flow rate were different than this, the calculated concentration would vary as a function of flow rate. For example, a volumetric flow rate of 500 cfm would result in a reduction in the 41Ar concentration to 3.21x10⁻¹¹ µCi/ml, which is 0.3% of the limit. Conversely, a volumetric flow rate of 1500 cfm would result in an increased 41Ar release concentration of 9.64x10⁻¹¹ µCi/ml, which is still only 1 % of the effluent concentration limit.
6.3.6 Steps to Limit Release Levels
Although the calculations noted in the preceding sections are conservative, it is possible to take steps to limit releases even further. This section will discuss some of these actions and their effects.
6.3.6.1 Reducing Effective Irradiated Volumes:
In most cases, the volumes considered in the preceding calculations will be larger than those normally irradiated during routine operations. For example, the two beam ports are normally filled with shielding plugs, and the thermal column is filled with graphite stringers when it is not being used in an experiment, which essentially·. 'eliminate their effective volumes. Devices or samples being irradiated in the dry tubes, thermal columns, or CIF will also reduce the effective irradiated volumes. Also, the dry tubes are usually stored away from the core when not in use, so their effective volumes are not irradiated during routine operations. Air voids in experiments placed in these facilities can be limited by packing them with inert, non-activating materials (e.g., the rabbit carrier tube is packed with cotton). Only the rabbit and CIF effective volumes are irradiated when they are not in use during routine operations. '
147

The Ohio State University Research Reactor
6. 3. 6. 2 Facility Purging
Safety Analysis Report October 2018
The rabbit facility can be purged at any time during normal operations. The other experimental facilities can also be purged by insertion of apparatus to circulate gas through the effective volume of the facility. Purging the experimental facility limits the buildup of 41Ar in the effective volume, thereby reducing the initial concentration that might be released in a puff-type expulsion of air from the facility. Limiting the purging rate can keep equilibrium concentrations of 41Ar in the restricted area within DAC limits.
The experimental facilities can also be purged with nitrogen gas. When irradiated by neutrons, nitrogen undergoes very little neutron capture reactions leading to radioactive products. Replacement of air in the experimental facilities with nitrogen thereby limits the concentration of 41Ar in the building air. Nitrogen gas can be introduced to the facility prior to irradiation, or in a continuous stream by gas lines inserted during the time the facility is in use.
6.3.6.3 Limiting Facility Releases
Release of 41Ar from irradiated air volumes can be reduced by sealing the facilities against leakage to the atmosphere for a time sufficient to allow decay of the isotope. For example, the boral plate on the outer surface of the main graphite thermal column has a rubber gasket along its inner edge, allowing it to be hermetically sealed against the outer surface of the facility. If the experiment allows, the facility may be kept sealed until 41Ar concentration has been reduced by radioactive decay. Similarly, the CIF can be left plugged for a time to reduce 41Ar activity, if allowable under the conditions of the experiment. For neutron activation experiments resulting in relatively long-lived radioisotopes, overnight decay periods are generally acceptable. In this case, for example, 41Ar activity in the CIF effective volume would be reduced by about 99% from that initially present at the time the irradiation ended.
6.3.6.4 Ventilation System Control
The building ventilation systems can be turned off by a switch in the control room. Such an action can thereby limit releases of gaseous radionuclides to the unrestricted area. If. more rapid purging of the building is desired, ventilation rates can be increased by activating portable fans and allowing them to exhaust out of opened doors or windows. Any such releases will be recorded, and the calculated release concentrations of gaseous radioisotopes averaged into the total yearly release to the unrestricted area.
6.3.7 Estimated Doses
Release of 41Ar from the experimental facilities of the OSURR will result in accumulated doses to persons exposed to the resulting isotope concentration in the air. The whole-body gamma ray dose to a person surrounded by and immersed in a semi-infinite cloud of radioactive gases can be approximated by:
D = 900EAo
where D = dose rate in rads/hr,
E = photon energy in MeV, and
Ao = effective exposure concentration in curies/m3
Earlier calculations and tables listed values for Ao given various types of releases. Assuming a gamma photon energy of 1.3 MeV, exposure rates can be estimated. Table 6.9 summarizes the results of these calculations.
148

The Ohio State University Research Reactor
Safety Analysis Report October 2018
Note that the results of this section were calculated assuming a nominal volumetric flow rate of 1000 cfm. If the actual flow rate were different than this, the dose rates calculated for inside the restricted area will vary inversely with flow rate, and the dose rates calculated for outside the restricted area will vary with flow rate. For example, a volumetric flow rate of 500 cfm would result in a calculated dose rate increase inside the restricted area for a continuous release from the rabbit and pool from 7.99 mrad/hr to 11.5 mrad/hr, and it would result in a calculated dose rate decrease outside the restricted area from 0.037 mrad/hr to 0.027 mrad/hr. Conversely, a volumetric flow rate of 1500 cfm would result in a calculated dose rate decrease inside the restricted area for a continuous release from the rabbit and pool from 7.99 mrad/hr to 6.12 mrad/hr, and it would result in a calculated dose rate increase outside the restricted area from 0.037 mrad/hr to 0.043 mrad/hr.
Also note that the calculated dose rates shown in Table 6.9 are conservative compared to hypothetical doses to the public estimated using the EPA code COMPLY each year for the annual report to the NRC. Over the past decade, the highest hypothetical doses to the public was estimated as 0.4 mrem, which occurred during the period July 2010 - June 2011. It would only take about 21 hrs at the dose rate of 0.019 mrad/hr shown in Table 6.9 for the unrestricted area for continuous release from the pool water to reach 0.4 mrem. As the reactor has much higher utilization than this, it is clear that the calculated 41Ar concentrations and resulting dose rates are conservative. Even if the exhaust fan volumetric flow rate was higher or lower than the nominal volumetric flow rate of 1000 cfm, hypothetical doses to the public will be far below the limit.
6.4 Solid Radioactive Waste Management
Operation of the OSURR will generate very little solid low-level radioactive waste. The primary source of low-level solid waste will be the demineralizer cartridge in the reactor pool water processing system. Current procedures call for cartridges to be kept on-site for a decay period sufficient to reduce the activity of short-lived radionuclides (e.g., 24Na) to negligible levels. If higher-power operation of the OSURR results in additional radioisotopes being present in the resins of the demineralizer cartridge with longer half-lives, a bulk radioassay will have to be performed to determine specific and total activity in the cartridges prior to disposal. Disposal of this low-level waste is handled by the OSU Radiation Safety Section and comprises a few cubic feet per year.
Spent fuel assemblies might also be classified as solid radioactive waste. These are stored in the fuel storage pit at the east end of the reactor pool, unless otherwise approved by the Reactor Operations Committee and the Nuclear Regulatory Commission. After suitable decay times have elapsed, spent fuel assemblies are returned · to the Department of Energy for ultimate disposal. Because of their isotopic content and activity inventory, used fuel assemblies are not considered low-level radioactive waste, and are therefore handled separately from other waste forms generated by the laboratory. Spent fuel shipment is performed in accordance with approved procedures that meet appropriate federal, state, and local requirements.
6.5 Liquid Radioactive Waste Management
Section 6.1.1 noted that no liquid-borne radioactive materials are discharged from the OSURR during normal operation. However, certain maintenance and repair activities may result in liquid discharges.
An alternative to demineralizer cartridge regeneration by the manufacturer or replacement of the resins by OSURR personnel would involve on-site regeneration of the cartridges by OSURR
149

The Ohio State University Research Reactor
Safety Analysis.Report October 2018
staff. In this event, some liquid-borne radionuclides would result. These eventually would have to be released from the reactor building as liquid radioactive waste.
Prior to release of liquid radioactive waste, the isotopic content of the material and specific activities of radioisotopes present in the liquid must be determined. The liquids may then be kept in a holding tank to allow decay to reduce the total activity inventory, or make it available for dilution or treatment prior to release.
6.6 Byproduct Materials Management
Operation of the OSURR will result in the production of radioactive materials as part of experimental procedures. Production of radioactive materials by neutron activation, also called byproduct materials, may be a deliberate result of the experiment (as would be the case in isotope production or neutron activation experiments), or incidental to the experiment (as would occur in materials damage studies or medical experiments). In either case, the radionuclides so produced must be handled safely.
Laboratory procedures are available for survey and assay of all materials irradiated in the OSURR. Handling . and storage of activated materials is also governed by laboratory procedures. These procedures fall within the overall university guidelines for working with radioactive materials, which themselves are designed to meet or exceed the requirements specified in 1 OCFR20.
Typical byproduct materials would include a variety of beta and gamma-emitting radioisotopes of various half-lives, generally formed by thermal neutron-induced activation of parent (target) nuclei. A few radionuclides are formed by fast neutron capture reactions, such as 58Co (from the neutron-proton reaction with 58Ni) and 24Na (from the neutron-alpha reaction with 27 Al). A few byproduct materials emit alpha particles. Half-lives can range from seconds up to years. Most byproduct materials are in solid form, but a few are liquids, and very few are gases. Experimental procedures call for activation targets to be encapsulated, where possible. Induced activity can result in dose rates ranging from a few tenths of a millirem/hour up to a few rem or tens of rem per hour. Radiation safety procedures are followed for dealing with sources producing intense radiation fields and significant dose rates.
Radioactive materials are typically handled in the northeast corner of the building, which is designated as the radioactive materials handling and storage area. Other areas of the building may also be used for handling and storage if they are so designated and posted. Handling and storage procedures are available to assure safety in these activities. Storage of irradiated materials, if necessary, can be facilitated by using appropriate shielded containers. A variety of lead storage containers, of various shapes and sizes, are available in the laboratory.
Solid byproduct materials, if they contain essentially no transuranic radionuclides, are disposed of in designated containers. Transuranic materials are handled separately, but the quantities are generally very small. A record is kept of materials placed in the disposal container. The container is collected when required by Radiation Safety Section personnel, and added to the university total waste inventory. Liquids are released, if permitted within the framework of 1 OCFR20 limits, into a designated disposal sink ("hot" sink). Records are kept of liquid disposals. Liquid sources may be evaporated and disposed of as dry materials, if the radionuclides they contain are non-volatile. Gaseous radioactive materials may be vented to the air, if such procedures do not exceed averaged annual effluent release concentration limitations, or the containers holding the gases, if tight, can be disposed of in the waste container.
150

The Ohio State University Research Reactor
Safety Analysis Report October 2018
Table 6.9: Estimated Dose Rates Resulting From 41Ar Concentrations As A Result Of Releases From Various Experimental Facilities of the OSURR
Facility Type of Restricted Area Dose Unrestricted Area Dose Description Release Rate (rads/hr) Rate (rads/hr)
CIF Puff 4.02 X 10⁻³ 1.36 X 10⁻⁵
Beam Port 1 Puff 2.70 X 10⁻² 1.26 X 10⁻⁴
Beam Port 2 Puff 2.08 X 10⁻² 9.75 X 10⁻⁵
Rabbit Puff 2.69 X 10⁻³ 1.26 X 10⁻⁵
Rabbit Continuous 3.76 X 10⁻³ 1.76 X 10⁻⁵
Pool Water Continuous 4.24 X 10⁻³ 1.90 X 10⁻⁵
Pool & Rabbit Continuous 7.99 X 10⁻³ 3.74 X 10⁻⁵
Thermal Column Puff 1.54 X 10⁻³ 7.23 X 10⁻⁶
Rabbit Carrier Puff 1.83 X 10⁻⁴ 8.54 X 10⁻⁷
Notes:
4" Dry Tube Puff 5.34 X 10⁻³ 2.50 X 10⁻⁵
2" Dry Tube Puff 1.85 X 10⁻³ 8.66 X 10⁻⁶
(1) The puff releases calculated above assume saturation activities have been attained. The continuous discharge from the rabbit facility assumes a blower operation time sufficient to attain equilibrium concentrations in the building.
(2) The averaging time for the concentration used in the calculations is assumed to be five effective half-lives of 41Ar in the building (213.75 minutes).
151

The Ohio State University Research Reactor
Safety Analysis Report October 2018
Miscellaneous radioactive waste, such as contaminated gloves, tools, apparatus, or absorbent pads are considered as solid byproduct waste materials and are disposed of in the waste container. The items are surveyed for dose rate prior to disposal.
The area of the building where the radioactive waste disposal container is located is surveyed for gamma dose rates are part of the area radiation surveys performed routinely at the laboratory.· If necessary, the area is posted as q Radiation Area or High Radiation Area. The container is posted as a Radioactive Materials storage area.
6. 7 Chapter 6 References
[1] David T. Goldman, "Chart of the Nuclides", The General Electric Company, Schenectady, N.Y., 1965.
[2] Harold Etherington, Editor, "Nuclear Engineering Handbook", First Edition, McGraw-Hill Book Company, Inc., New York, 1958.
[3] Nicholas C. Horning, "Measurement of the Neutron Spectra in the Beam Ports and Thermal Column of The Ohio State University Research Reactor'', M.Sc. Thesis (unpublished}, The Ohio State University, Columbus, OH, 1976.
[4] Joseph W. Talnagi, "Investigation of Perturbation Induced by Neutron Detectors in the Spatial and Energy Dependent Neutron Flux of The Ohio State University Research Reactor", M.Sc. Thesis (unpublished}, The Ohio State University, Columbus, OH, 1979.
[5] Noah E. Dorsey, "Properties of Ordin,ary Water-Substance In All Its Phases: WaterVapor, Water, And All The lees", Hafner Publishing Co., New York, NY, 1940.
152
The Ohio State University Research Reactor
Safety Analysis Report October 2018
mentioned previously, there are other scrams in the safety system to ensure that the reactor would be shut down by scram in such a scenario. In addition to the period safety module providing a scram in response to a 1-second period, there is a scram for an indicated period of less than 5 seconds on the reactor period time-trace display and a scram for an indicated power greater than 120% of the current scale on the linear power level time-trace display.
8.4.4 Damaged Fuel Plate
Operation of the OSURR produces an inventory of radioisotopes in each fuel plate resulting from the fission of 235U. Section 13 of Reference 1 O (NUREG 1537) suggests that an analysis should be performed for a maximum hypothetical accident (MHA) involving a release of fission products that would have consequences greater than any credible accident. For a low-power ( < 2 MW) MTR fuel reactor, the recommended analysis is that resulting from cladding stripped from one face of one fuel plate. In this section, the consequences of an event in which fission fragment radioisotopes are released from a fuel plate to the pool water and subsequently to the atmosphere of the building, ultimately to be released to the outside air, will be analyzed.
Such an event is extremely unlikely during routine operation of the OSURR. The core operates in a natural convection cooling mode, so failure of a fuel plate as a result of hydraulic pressures in the core is not likely. Table 4.1 shows that the average coolant velocity in an average channel is 5 cm/sec, with 6.1 cm/sec being the coolant velocity in the hot channel. Such coolant velocities are low enough that significant pressures will not be generated anywhere in the core, nor will excessive wear or erosion of the fuel plate surface occur.
Fuel plate cladding failure can occur as a result of corrosion action over years. However, previous studies of MTR-type fuel plates have shown that a cladding hole on the order of several square centimeters in size must be present before significant amounts of radioactivity can be detected in the pool water. It is very unlikely that a hole of such size will form suddenly during normal operations. Current operating procedures call for periodic testing of the pool water to determine radioisotopic content on a regular basis. In addition, fuel element inspections are performed annually. Each year some of the fuel elements are inspected such that all of the elements are inspected at least once in a five year period. During the operating history of the HEU-fueled OSURR (over 25 years), no evidence of significant fuel plate surface corrosion (to the point of showing major defects such as formation of thick oxidation layers, fracture defects, or stress lines) has been found.
Nevertheless, to provide a bound on the consequences of any hypothetical release of fission fragments, the following sections will analyze the scenario described above.
8. 4. 4. 1 MHA Assumptions for Radioiodine Release
For the purposes of this analysis, the following assumptions are made:
1. the reactor is operated at 500 kilowatts for an infinite irradiation time,
2. the fuel plate which fails does so at the end of this operation,
3. the failed fuel plate is located at the peak flux point in the core,
4. the released radionuclides are perfectly mixed with the pool water at the time of release, to be transferred by diffusion to the building air,
5. the primary radionuclide of consequence is elemental iodine.
Although fission products contain other radioisotopes in addition to iodine, the thyroid dose consequences from these radionuclides are less severe. Thus, we consider the releases from iodine alone in this section.
198
The Ohio State University Research Reactor
8.4.4.2 Source Term Estimation for Radioiodine Release
Safety Analysis Report October 2018
This section will estimate the total amount of radioic;,dine released from a failed fuel plate. In these calculations, no credit is taken for reduction in radioiodine activity resulting from radioactive decay during the time allowed for the. course of the release from the failed fuel plate and the mixing time in the pool. Essentially, we assume an instantaneous release of the material and an instantaneous, perfect mixing in the pool water. These are obviously conservative assumptions.
Further conservative assumptions are that the radioiodines are present in the fuel plates at saturation quantities, and that a flux peaking factor of 1.8 is applied to the failed plate. This value is conservative because it includes radial and axial peaking; however, only the radial peaking should affect the source term, as release from the fuel plate will be from across the entire length of the plate. In actual practice, the peak neutron flux will be less than that assumed in this analysis.
As is mentioned above, Section 13 of Reference 10 suggests that the MHA for a low-power (<2 MW) MTR fuel reactor is cladding stripped from one face of one fuel plate. Therefore, this assumption will be used in our analysis.
The production and decay rate of the i1h radioiodine isotope in the core is determined by ANi, where:
with
K = conversion constant = 3.1x10¹⁰ fissions/second/watt
P = reactor operating power in watts,
Fi = fractional fission yield for the i1h radioiodine,
Ai = decay constant for the i1h radioiodine, and
Ni = saturation number of atoms of i1h radioiodine in core
The constants Fi, Ai, and the calculations for ANi and Ni, are shown in Table 8.6, assuming 500 kW operating power. The total number of radioiodine atoms available in the core is 6.1x10²⁰ . Assuming that the iodine forms the '2 molecule, the total number of 12 molecules is thus 3.05x10²⁰
.
199
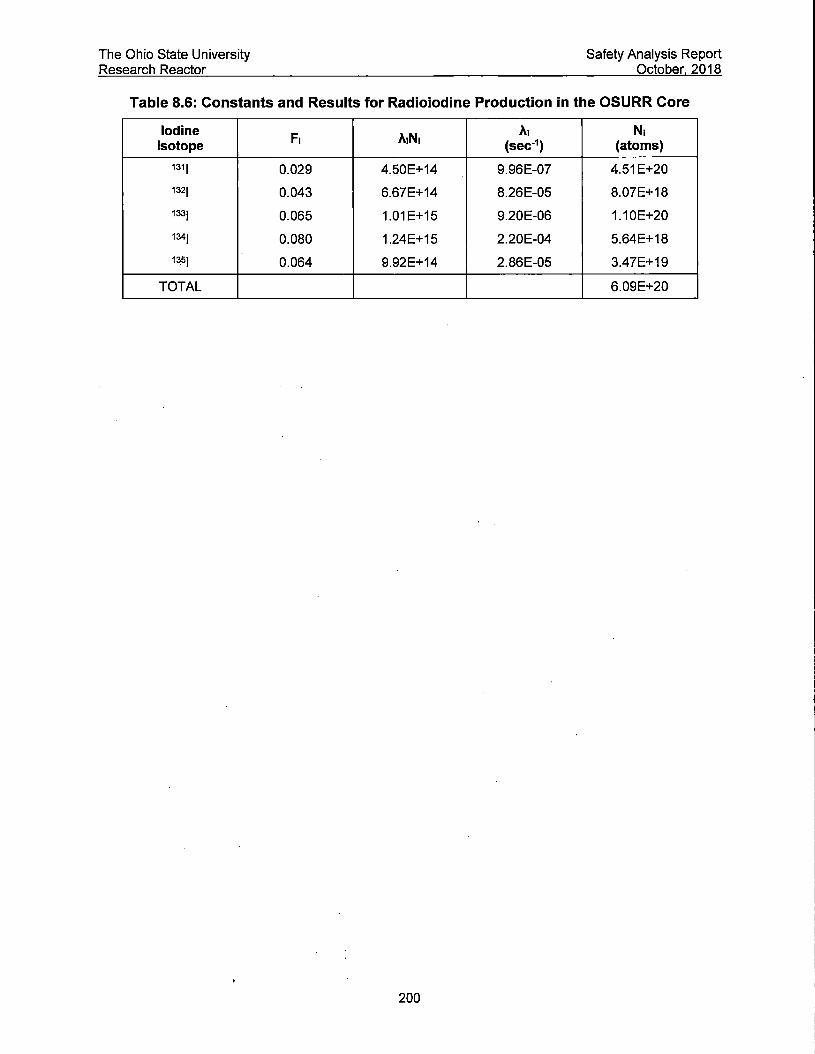
The Ohio State University Research Reactor
Safety Analysis Report October 2018
Table 8.6: Constants and Results for Radioiodine Production in the OSURR Core
Iodine F1 A1N1 A1 N1
Isotope (sec-1) (atoms)
1311 0.029 4.50E+14 9.96E-07 4.51E+20
1321 0.043 6.67E+14 8.26E-05 8.07E+18
1331 0.065 1.01E+15 9.20E-06 1.10E+20
1341 0.080 1.24E+15 2.20E-04 5.64E+18
13.5( 0.064 9.92E+14 2.86E-05 3.47E+19
TOTAL 6.09E+20
200

The Ohio State University Safety Analysis Report Research Reactor October 2018
To estimate the total release from a given fuel plate, the number of radioiodine molecules released is given by:
where
N1 = NC . pf .f NP
N1 = total number of radioiodine molecules released
Ne = total number of radioiodine molecules in the core
Np = number of fuel plates in the core
Pt = flux peaking factor (assume 1.8, see Table 4.1)
f = fission fragment gas release fraction
It is conservative to assume the smallest core size estimated for the OSURR. This core consists of 17 standard fuel elements and 4 control rod fuel elements, which have a combined total of 312 plates. Regarding the fraction of fission fragment gas atoms released from the plate, it is suggested in Reference 11 (NUREG/CR-2079) that only fission fragment gases within recoil range of the surface of fuel will escape for a scenario such as this. The value given for fission fragment recoil range for aluminum matrix fuels is 1.37x10⁻³ cm, so only the fraction of noble gases and iodine within this distance of the surface of the fuel plate should be considered for escape from the fuel. The thickness of fuel in each plate is 0.020" or 0.0508 cm (see Table 4.1), which gives a fission fragment gas release fraction of:
f = 1.37x10-scm = 0.0270 0.0508cm
Thus, we obtain a total of 4.74x10¹⁶ radioiodine molecules released to the pool water.
The reactor pool contains about 5800 gallons of water. The mole fraction of radioiodines in the pool water is calculated from:
Xw = (N1/NA) / (VKp/M)
where
Xw = mole fraction of radioiodines in the water
N1 = number of radioiodine molecules released
NA = Avogadro's Number (6.023x10²³/mole)
V = reactor pool volume (5800 gallons)
K = conversion factor (3.8x103 cm3/gallon)
p = density of water (1 gram/cm3)
M = molecular weight of water (18 grams/mole)
Substituting appropriate data into the equation gives a mole fraction of 6.43x10⁻¹⁴_
The partial pressure of the radioiodine in air, denoted P1, can now be estimated as follows:
P1 = PoXw
with Xw estimated above, and Po the vapor pressure of pure iodine. Po in turn can be estimated from:
201

The Ohio State University Research Reactor
where
log10(Po) = ACrr + B
Po = vapor pressure of pure iodine in mm of Hg
A = molar heat of vaporization (13057 cal/mole for '2)
C = constant = -0.2185
T = 'bulk pool temperature in K
B = constant = 9.24 (for b)
Safety Analysis Report October 2018
Assuming a bulk pool water temperature close to that of the core inlet temperature of 20°c (293 K), a value of 0.32 mm Hg is obtained for Po. Thus, substituting values into the equation for P1 gives an estimate of 2.05x10⁻¹⁴ mm Hg for the partial pressure of the radioiodine in air. From this, the molar fraction of radioiodine in air, assuming equilibrium, is given by:
Xair = 2.06x10⁻¹⁴ mm Hg/ 760 mm Hg
= 2. 70x10-17
Assuming a building volume of 70,000 cubic feet (1.98x10⁶ L), the total moles of radioiodine present can be estimated as:
M1 = XairVt/(24.5 liters/mole)
where Xair is calculated above and Vb is the building volume in liters. Performing this calculation yields an estimate of 2.18x10⁻¹² moles.
It is now possible to estimate the number of moles of the i1h radioiodine, denoted as M from the estimates shown in Table 8.6 for the relative populations of the various iodine isotopes. The following formula is used:
Mi = M1 • _!i where Nc = total iodine atoms in core NC
The activity of the i1h radioiodine isotope in the building air is then calculated from:
A=2·M·NA-Ai
The results are shown in Table 8.7.
Now it is possible to estimate the quantity of a given radioiodine present at a time 't' after the fuel plate rupture:
si = slo)- e->.;t
where
Ai = decay constant of the i1h radioiodine
t = time following iodine release
Si(O) = initial quantity present
202

The Ohio State University Research Reactor
Safety Analysis Report October 2018
Table 8.7: Number of Moles and Activities for Radioiodine Isotopes in Building Air After Release From The Pool
Iodine N1/N M1 h1 A1
Isotope (mol) (sec·1 ) (Ci)
1311 0.741 1.62E-12 9.96E-07 5.26E-05
1321 0.013 2.90E-14 8.26E-05 7.80E-05
1331 0.180 3.94E-13 9.20E-06 1.18E-04
1341 0.009 2.03E-14 2.20E-04 1.45E-04
1351 0.057 1.25E-13 2.86E-05 1.16E-04
203

The Ohio State University Research Reactor
Safety Analysis Report October 2018
For this analysis, we will assume that the quantity Si is expressed in units of dose (rads) to the thyroid gland of a person breathing the radioiodine-bearing air. Although the concentration of iodine in the building air is continuously reduced by various processes such as radioactive decay, purging of the building air by the exhaust fan, and plating out of the iodine on surfaces, we will assume only a reduction in concentration resulting from radioactive decay. Essentially, this assumes that the releases from the pool surface are balanced by losses other than radioactive decay, and an equilibrium is established between the pool water radioiodine and that in the building air. This also implies that the concentrations of iodine in the air outside the building, taking no credit for dissipation in the air outside the building, will be the same as those in the building. It is believed that these assumptions are conservative.
The concentration of a given radioiodine in units of thyroid dose per unit volume of air is thus:
Ci= SiNb
where Vb is the volume of the building (1.98x109 cm3).
8.4.4.3 Thyroid Dose Consequences for Radioiodine Release
The integrated thyroid dose to a person breathing the building air containing radioiodine contaminant for a time period from time O to time T is obtained from:
Di= Js. Cidt = [ 8 . Si(O)]J e-A;tdt a vb a
Performing this integration and evaluating the resulting expression over the limits gives:
D. = B-Si(O) ·(1-e-V) I vb .J...i
where B is the breathing rate, assumed to be a constant of 2x107 cm3 per day.
Estimates of Si(O) are shown in Table 8.8. This table also summarizes earlier results and shows the decay constant in different terms. Using the equation for Di above and the data for Si(O), estimates of integrated thyroid dose for various exposure times are shown in Table 8.9. As can be seen from these results, over one week of continuous exposure to released radioiodine in the building air would be required to attain a thyroid dose equivalent nearing 5 rem. Even this exposure would be extremely unlikely, since it is difficult to conceive of a credible combination of meteorological conditions and personnel occupancy which will result in the attainment of such doses. The imposition of such limited cloud dispersion effects required to approach these estimates is not realistic. It is more likely that dispersive effects will result in much lower doses. For example, even the building blower exhaust at 1000 CFM volume flow rate will cause a concentration reduction. This dispersion will also be enhanced by natural dispersive effects such as wind speed.
204

The Ohio State University Research Reactor
Safety Analysis Report October 2018
Table 8.8: Source Terms and Other Data for Integrated Thyroid Dose Calculations
Iodine Activity Thyroid Dose S1(0) A1 Isotope Released (Ci) (rads/Ci) (rads) (day-1)
1311 5.24E-05 1.48E+06 7.75E+01 0.086
1321 7.77E-05 5.35E+04 4.16E+OO 7.14
1331 1.17E-04 4.00E+05 4.70E+01 0.795
1341 1.44E-04 2.50E+04 3.61E+OO 19.0
1351 1.16E-04 1.24E+05 1.43E+01 2.47
Table 8.9: Thyroid Dose Estimates
Dose in rem
Iodine Exposure Times
Isotope 2 1 2 4 7 30 infinite Symbol hours day days days days days
1311 0.06 0.75 1.44 2.65 4.11 8.40 9.09
1321 0.00 0.01 0.01 0.01 0.01 0.01 0.01
1331 0.04 0.33 0.47 0.57 0.59 0.60 0.60
1341 0.00 0.00 0.00 0.00 0.00 0.00 0.00
135( 0.01 0.05 0.06 0.06 0.06 0.06 0.06
TOTAL 0.12 1.14 1.98 3.28 4.77 9.06 9.75
205

The Ohio State University Research Reactor
8.4.4.4 MHA for Gaseous Radionuclides
Safety Analysis Report October 2018
A similar analysis can be done for all gaseous radionuclides released from a single ruptured fuel plate. The same analysis for iodine as was done in the preceding sections applies, as well as all noble gases (fission products) available in the plate released to the pool water and then to the building air. As before, we will take no credit for decay of the radioisotopes during release and dispersion. This assumption, as before, leads to conservative results in that the estimates obtained are higher than those that would actually occur in this postulated accident.
For this analysis and the results shown in the tables in the following section, a nominal volumetric flow rate of 1000 cfm has been assumed. However, calculations have also been performed for 500 cfm and 1500 cfm, and select results will be included to demonstrate that the exact flow rate does not impact safety.
8.4.4.5 Whole-Body Gamma Dose Estimation
As with the radioiodine release model considered in previous sections, we will assume that the released radionuclides are dispersed into a hemispherical cloud, perfectly mixed with the air in this hemispherical volume. The dose consequences to a person submersed in this cloud are considered.
For a submersion dose, Cember [7] recommends calculating the dose from an infinite hemisphere of gas. To accomplish this, first we calculate the dose from an infinite cloud and then divide by two to account for an infinite hemispherical geometry. By assuming an infinite cloud, we can assume that the density of absorbed energy is equal to the density of emitted energy. This allows us to do a straight-forward calculation from activity density to dose rate. For an isotope i:
where
A = source term activity in Ci
p = density of air = 1.293 kg/m3
V = building volume = 1.982x10³ m3
Ai = nuclide decay constant in seconds-1
A = building volume leakage constant in seconds-1
t = time after source release in seconds
E = gamma energy in MeV per tranformation
F1 = factor to convert Ci to transformations/sec = 3. 7x10¹⁰
F2 = factor to convert MeV to J = 1.6x10⁻¹³
F3 = factor to convert J/kg to rad = 100
F 4 = factor to convert rad to rem = 1
Fs = factor to account for stopping power of tissue ~ 1.1
Fe = factor to account for hemispherical geometry = %
The term e-(Ai+A)t accounts for reduction in the source term over time due to both radioactive decay and leakage from the building. If we integrate this equation from the release time t=O to the final time t=T, we get a dose for that period of exposure.
206

The Ohio State University Research Reactor
A 1- e-<>.;+Alt Di = - 1 EiF1F2F3F4F5F6
pV Ai +A
Safety Analysis Report October 2018
Information relevant to these calculations is shown in Table 8.10. Also, in Table 8.10, the value for the activity Ai = AN is calculated as follows:
AN = KPFiPt/Np
where
Ai = decay constant for the isotope of interest Ni = number of atoms of isotope of interest K = conversion constant (3.1x10¹⁰ fissions/sec/watt) P = reactor power in watts Fi = fission yield for the isotope of interest Pt = flux peaking factor (assumed to be 1.8) Np = number of fuel plates in the core (312)
Values for the radioiodine activities not shown in Table 8.10 are taken from Table 8. 7.
Results for the isotopes in question and for a number of different lengths of time can be seen in Tables 8.11 and 8.12. Table 8.11 has results for the purge fan turned off, and Table 8.12 has results for the purge fan turned on. The results in Table 8.12 were calculated assuming a nominal volumetric flow rate of 1000 cfm. If the flow rate were to be lower than this, the results would fall between those in Tables 8.11 and 8.12, and if the flow rate were to be higher than this, the calculated doses would be lower than those shown in Table 8.12.
These values that were obtained assuming an infinite cloud set a very conservative upper bound on the dose. If the air volume of the reactor building is considered to be in the shape of a hemisphere, this hemisphere would have a radius of about ten meters. The gammas coming from the nuclides of interest have an average path length in air on the order of 250 meters. This indicates that the infinite cloud assumption is grossly overestimating the actual dose, so we need to use a factor to correct for the non-infinite extent of the cloud.
To obtain this factor, we can think of a spherical cloud consisting of a number of thin concentric shells. Consider a shell at an arbitrary distance 'r' from the origin, which is our point of interest. The contribution of gammas from a point on this shell passing through the origin is:
where
cp = _s_e-µr 4TTr2
cp = flux at the origin
S = volume-distributed source (Ci/m3)
µ = gamma absorption coefficient in air (m-1)
r = distance from origin (m)
This equation accounts for the spread of the radiation away from the point as well as the attenuation from interactions with air. If we sum over all the points on this shell we get a contribution of: ·
<p = Se-µR
Now, by integrating these thin shells over a radius of zero to infinity, we find the quantity of gammas passing through the origin from the infinite cloud.
207

The Ohio State University Research Reactor
Safety Analysis Report October 2018
Table 8.10: Constants and Calculational Results Used in Estimation of Submersion Cloud Whole-Body Gamma Dose
Isotope Decay Fractional Gamma Isotope Isotope
Symbol Constant Fission Energy Activity Activity (hour1) Yield (MeV/dis) (h1N1) (Ci)
1311 0.0035 0.029 0.4 * 5.24E-05
132( 0.2888 0.043 2.12 * 7.77E-05
133( 0.0333 0.065 0.55 * 1.17E-04
134( 0.792 0.08 1.25 * 1.44E-04
135( 0.1037 0.064 1.5 * 1.16E-04
ssmKr 0.1589 0.013 0.19 3.14E+10 8.48E-01
B7Kr 0.5331 0.025 0.63 6.04E+10 1.63E+OO
ssKr 0.2502 0.036 2.18 8.69E+10 2.35E+OO ·
131mxe 0.0024 0.029 0.002 7.00E+10 1.89E+OO
133mxe 0.0126 0.065 0.006 1.57E+11 4.24E+OO
133Xe 0.0055 0.065 0.08 1.57E+11 4.24E+OO
135mxe 2.6637 0.064 0.15 1.55E+11 4.18E+OO
13sxe 0.076 0.064 0.24 1.55E+11 4.18E+OO
208

The Ohio State University Research Reactor
Safety Analysis Report October 2018
Table 8.11: Integral Whole-Body Gamma Doses in The Building Assuming an Infinite Cloud and a Leakage Fraction Of 0.0042 Hr1 (Purge Fan Off)
Dose in rem
Exposure Times Isotope
5 10 15 30 60 2 24 48 168 720 symbol Minutes Minutes Minutes Minutes Minutes Hours Hours Hours Hours Hours
1311 0.000 0.000 0.000 0.000 0.000 0.000 0.000 0.000 0.001 0.001 1321 0.000 0.000 0.000 0.000 0.000 0.000 0.000 0.000 0.000 0.000 1331 0.000 0.000 0.000 0.000 0.000 0.000 0.000 0.001 0.001 0.001 1341 0.000 0.000 0.000 0.000 0.000 0.000 0.000 0.000 0.000 0.000 1351 0.000 0.000 0.000 0.000 0.000 0.000 0.001 0.001 0.001 0.001
a5mKr 0.006 0.012 0.018 0.035 0.068 0.126 0.443 0.452 0.452 0.452
B7Kr 0.038 0.075 0.110 0.206 0.364 0.576 0.875 0.875 0.875 0.875
asKr 0.193 0.382 0.567 1.100 2.068 3.671 9.186 9.206 9.206 9.206
131mxe 0.000 0.000 0.000 0.001 0.002 0.003 0.038 0.071 0.176 0.260
133mxe 0.001 0.002 0.003 0.006 0.012 0.023 0.230 0.383 0.652 0.693
133Xe 0.013 0.026 0.039 0.077 0.154 0.307 3.323 5.955 12.862 15.983 135mxe 0.021 0.039 0.052 0.079 0.100 0.107 0.107 0.107 0.107 0.107
135Xe 0.038 0.076 0.113 0.225 0.440 0.847 4.882 5.594 5.715 5.715
TOTALS 0.311 0.612 0.903 1.729 3.208 5.661 19.085 22.646 30.048 33.295
209

The Ohio State University Research Reactor
Safety Analysis Report October 2018
Table 8.12: Integral Whole-Body Gamma Doses in The Building Assuming an Infinite Cloud and a Leakage Fraction Of 0.857 Hr1 (Purge Fan On)
Dose in rem
Isotope Exposure Times
symbol 5 10 15 30 60 2 24 48 168 720 Minutes Minutes Minutes Minutes Minutes Hours Hours Hours Hours Hours
131( 0.000 0.000 0.000 0.000 0.000 0.000 0.000 0.000 0.000 0.000 1321 0.000 0.000 0.000 0.000 0.000 0.000 0.000 0.000 0.000 0.000 133( 0.000 0.000 0.000 0.000 0.000 0.000 0.000 0.000 0.000 0.000 1341 0.000 0.000 0.000 0.000 0.000 0.000 0.000 0.000 0.000 0.000 1351 0.000 0.000 0.000 0.000 0.000 0.000 0.000 0.000 0.000 0.000
ssmKr 0.006 0.011 0.016 0.029 0.046 0.063 0.073 0.073 0.073 0.073 B7Kr 0.037 0.070 0.099 0.169 0.254 0.317 0.338 0.338 0.338 0.338 aaKr 0.186 0.356 0.511 0.899 1.416 1.884 2.115 2.115 2.115 2.115
131mxe 0.000 0.000 0.000 0.001 0.001 0.002 0.002 0.002 0.002 0.002 133mxe 0.001 0.002 0.003 0.005 0.008 0.011 0.013 0.013 0.013 0.013 133Xe 0.012 0.024 0.035 0.063 0.104 0.148 0.180 0.180 0.180 0.180
135mxe 0.021 0.036 0.048 0.067 0.079 0.081 0.081 0.081 0.081 0.081 13sxe 0.037 0.071 · 0.102 0.183 0.298 0.415 0.491 0.491 0.491 0.491
TOTALS 0.300 0.571 0.815 1.417 2.206 2.922 3.294 3.294 3.294 3.294
210
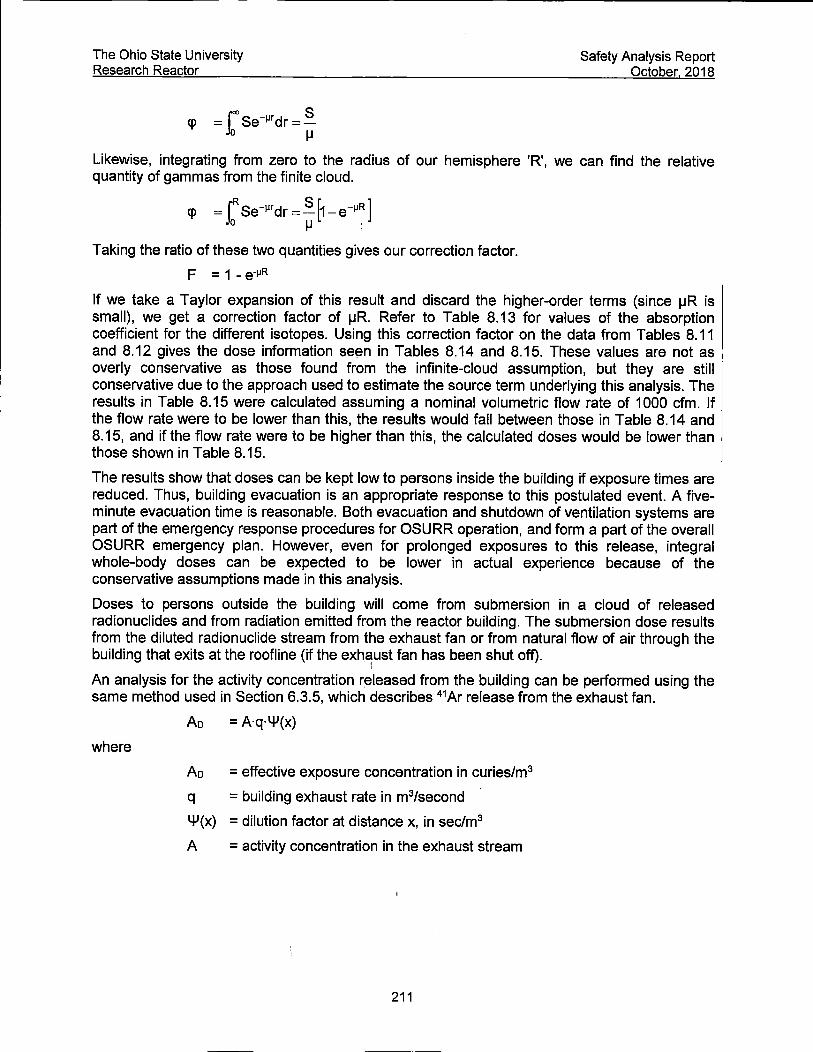
The Ohio State University Research Reactor
cp = rse-µrdr = s 0 µ
Safety Analysis Report October 2018
Likewise, integrating from zero to the radius of our hemisphere 'R', we can find the relative quantity of gammas from the finite cloud.
cp =rRse-µrdr= 8 [1-e-µR] Jo µ ;
Taking the ratio of these two quantities gives our correction factor.
F = 1 - e-µR
If we take a Taylor expansion of this result and discard the higher-order terms (since µR is small), we get a correction factor of µR. Refer to Table 8.13 for values of the absorption coefficient for the different isotopes. Using this correction factor on the data from Tables 8.11 and 8.12 gives the dose information seen in Tables 8.14 and 8.15. These values are not as overly conservative as those found from the infinite-cloud assumption, but they are still conservative due to the approach used to estimate the source term underlying this analysis. The results in Table 8.15 were calculated assuming a nominal volumetric flow rate of 1000 cfm. If the flow rate were to be lower than this, the results would fall between those in Table 8.14 and 8.15, and if the flow rate were to be higher than this, the calculated doses would be lower than those shown in Table 8.15.
The results show that doses can be kept low to persons inside the building if exposure times are reduced. Thus, building evacuation is an appropriate response to this postulated event. A fiveminute evacuation time is reasonable. Both evacuation and shutdown of ventilation systems are part of the emergency response procedures for OSURR operation, and form a part of the overall OSURR emergency plan. However, even for prolonged exposures to this release, integral whole-body doses can be expected to be lower in actual experience because of the conservative assumptions made in this analysis.
Doses to persons outside the building will come from submersion in a cloud of released radionuclides and from radiation emitted from the reactor building. The submersion dose results from the diluted radionuclide stream from the exhaust fan or from natural flow of air through the building that exits at the roofline (if the exh~ust fan has been shut off).
An analysis for the activity concentration released from the building can be performed using the same method used in Section 6.3.5, which describes 41Ar release from the exhaust fan.
Ao = Aq·4J(x)
where
Ao = effective exposure concentration in curies/m3
q = building exhaust rate in m3/second
4J(x) = dilution factor at distance x, in sec/m3
A = activity concentration in the exhaust stream
211

The Ohio State University Research Reactor
Safety Analysis Report October 2018
Table 8.13: Constants Used in Whole-Body Dose Estimates
Nuclide Average Linear Attenuation
Symbol Gamma Energy Coefficient in Air (MeV) (m·1)
1311 0.4 3.9x10·3
1321 0.8 3.7 X 10·3
1331 0.55 3.9 X 10·3
1341 1.3 3.4 X 10·3
1351 1.5 3.3x10·3
B5mKr 0.2 3.5x10·3
B7Kr 2.0 3.0x10·3
BBKr 2.0 3.0 X 10·3
131mxe 0.16 3.3 X 10·3
133mxe 0.23 3.6 X 10·3
133Xe 0.08 3.2 X 10·3
135mxe 0.52 3.9 X 10·3
13sxe 0.25 3.6 X 10·3
212

The Ohio State University Research Reactor
Safety Analysis Report October 2018
Table 8.14: Integral Whole-Body Gamma Doses in The Building Assuming a Finite Cloud and a Leakage Fraction Of 0.0042 ·· Hr1 (Purge Fan Off)
Dose in mrem
Isotope Exposure Times
symbol 5 10 15 30 60 2 24 48 168 720 Minutes Minutes Minutes Minutes Minutes Hours Hours Hours Hours Hours
1311 0.00 0.00 0.00 0.00 0.00 0.00 0.01 0.01 0.03 0.05
1321 0.00 0.00 0.00 0.00 0.00 0.00 0.01 0.01 0.01 0.01
1331 0.00 0.00 0.00 0.00 0.00 0.00 0.02 0.03 0.03 0.03
1341 0.00 0.00 0.00 0.00 0.00 0.00 0.00 0.00 0.00 0.00
1351 0.00 0.00 0.00 0.00 0.00 0.00 0.02 0.02 0.02 0.02
asmKr 0.21 0.42 0.62 1.22 2.34 4.32 15.22 15.52 15.53 15.53 .•
B7Kr 1.13 2.21 3.24 6.07 10.71 16.97 25.76 25.76 25.76 25.76
BBKr 5.69 11.26 16.71 -32_39 60.90 108.13 270.54 271.15 271.15 271.15 ·-
131mxe 0.00 0.01 0.01 0.03 0.06 0.11 1.24 2.31 5.69 8.42
133mxe 0.03 0.07 0.10 0.20 0.41 0.81 8.12 13.55 23.03 24.48
133Xe 0.41 0.81 1.22 2.43 4.85 9.66 104.38 187.09 404.09 502.14
135mxe 0.82 1.48 2.00 3.03 3.83 4.09 4.11 4.11 4.11 4.11
13sxe 1.35 2.68 4.01 7.94 15.57 29.94 172.53 197.70 202.00 202.00
TOTALS 9.64 18.93 27.91 53.31 98.67 174.04 601.98 717.28 951.47 1053.72
213

The Ohio State University Research Reactor
Safety Analysis Report October 2018
Table 8.15: Integral Whole-Body Gamma Doses in The Building Assuming a Finite Cloud and a Leakage Fraction Of 0.857 Hr·1 (Purge Fan On)
Dose in mrem
Isotope Exposure Times symbol
5 10 15 30 60 2 24 48 168 720 Minutes Minutes Minutes Minutes Minutes Hours Hours Hours Hours Hours
1311 0.00 0.00 0.00 0.00 0.00 0.00 0.00 0.00 0.00 0.00 1321 0.00 0.00 0.00 0.00 0.00 0.00 0.00 0.00 0.00 0.00
1331 0.00 0.00 0.00 0.00 0.00 0.00 0.00 0.00 0.00 0.00 1341 0.00 0.00 0.00 0.00 0.00 0.00 0.00 0.00 0.00 0.00 1351 0.00 0.00 0.00 0.00 0.00 0.00 0.00 0.00 0.00 0.00
asmKr 0.20 0.39 0.56 0.99 1.59 2.17 2.49 2.49 2.49 2.49
B7Kr 1.09 2.06 2.92 4.99 7.48 9.34 9.96 9.96 9.96 9.96
aaKr 5.49 10.50 15.06 26.49 41.71 55.50 62.30 62.30 62.30 62.30
131mxe 0.00 0.01 0.01 0.02 0.04 0.05 0.07 0.07 0.07 0.07
133mxe 0.03 0.06 0.09 0.17 0.27 0.39 0.47 0.47 0.47 0.47
133Xe 0.39 0.76 1.10 1.98 3.27 4.65 5.65 5.65 5.65 5.65
135mxe 0.79 1.38 1.82 2.58 3.02 3.11 3.12 3.12 3.12 3.12
13sxe 1.30 2.50 3.61 6.47 10.53 14.68 17.36 17.36 17.36 17.36
TOTALS 9.30 17.66 25.19 43.69 67.92 89.89 101.43 101.43 101.43 101.43
214

The Ohio State University Research Reactor
Safety Analysis Report October 2018
The dilution factor was calculated in Section 6.3.5 at x = 0 as 9.921x10⁻³ s/m3 for a release from the roofline of the building. Using this value for 4-'(0) with the appropriate values for building exhaust rate gives values for activity concentrations outside the restricted area. These concentrations can then be used to. calculate estimates for accumulated doses from the nuclides of interest as was done for immersion dose inside the building. For isotope 'i',
Ai. q. 4J 1- e-<,\+Alt ~ = . E--~-~-~-~-~-~
pV Ai +A I
where all variables are as defined previously in this section.
Tables 8.16 and 8.17 show the results of this calculation. We can see that turning the building fan off should keep submersion doses to personnel outside the building to very low levels. Even if the exhaust fan were left running, accumulated dose to persons outside would be reasonable, particularly after the first day. Note that the results in Table 8.17 were calculated assuming a nominal volumetric flow rate of 1000 cfm. If the actual flow rate were different than this, the calculated doses would vary as a function of flow rate. For example, a volumetric flow rate of 500 cfm yields an estimated dose from all analyzed nuclides after 720 hours of 12.8 mrem, versus the estimated dose of 15.4 mrem from 1000 cfm. Conversely, a volumetric flow rate of 1500 cfm yields an estimated dose from all analyzed nuclides after 720 hours of 16. 7 mrem.
To calculate the direct dose from the reactor building to someone standing at ground level at the middle of one of the outer walls, assume a half-hemisphere with a volume equivalent to that of the reactor building. The direct dose can then be calculated as a submersion dose from a finite hemisphere divided by two, since the dose only comes from half of a hemisphere.
where
A 1 - e -<>-j+AJt Di = 1 Ei · F1 · F2 · F3 · F4 · F5 · F7 · µ · R
p-V Ai +A
F1 = factor to account for half-hemispherical geometry = %
µ = gamma absorption coefficient in air (m-1)
R = radius of half hemisphere (m)
and all other variables are as defined above.
Tables 8.18 and 8.19 show the results of this calculation. This estimate is very conservative in that it assumes that a person is standing up against a building wall for an extended period of time, and it does not take into account absorption from building walls or concrete in the building. In the event of such an accident, personnel would be prevented from receiving integral doses from direct radiation such as those seen in Table 8.18 by restricting access to the building. Note that the results in Table 8.19 were calculated assuming a nominal volumetric flow rate of 1000 cfm. If the actual flow rate were different than this, the calculated doses would vary inversely with flow rate. For example, a volumetric flow rate of 500 cfm yields an estimated cumulative dose after 720 hours from all analyzed nuclides of 106.0 mrem, versus the estimated dose of 63.9 mrem from 1000 cfm. Conversely, a volumetric flow rate of 1500 cfm yields an estimated cumulative dose after 720 hours from all analyzed nuclides of 46.0 mrem. All of these are significantly lower than the calculated dose for the fan turned off.
215

The Ohio State University Research Reactor
Safety Analysis Report October 2018
Table 8.16 Integral Whole-Body Gamma Doses From Submersion Outside of the Restricted Area Assuming a Leakage Fraction of 0.0042 Hr1 (Purge Fan Off)
Dose in mrem
Isotope Exposure Times
symbol 5 10 15 30 60 2 24 48 168 720 Minutes Minutes Minutes Minutes Minutes Hours Hours Hours Hours Hours
1311 0.0 0.0 0.0 0.0 0.0 0.0 0.0 0.0 0.0 0.0 1321 0.0 0.0 0.0 0.0 0.0 0.0 0.0 0.0 0.0 0.0 1331 0.0 0.0 0.0 0.0 0.0 0.0 0.0 0.0 0.0 0.0 1341 0.0 0.0 0.0 0.0 0.0 0.0 0.0 0.0 0.0 0.0 1351 0.0 0.0 0.0 0.0 0.0 0.0 0.0 0.0 0.0 0.0
ssmKr 0.0 0.0 0.0 0.0 0.0 0.0 0.0 0.0 0.0 0.0
B7Kr 0.0 0.0 0.0 0.0 0.0 0.0 0.0 0.0 0.0 0.0
esKr 0.0 0.0 0.0 0.0 0.0 0.1 0.2 0.2 0.2 0.2
131mxe 0.0 0.0 0.0 0.0 0.0 0.0 0.0 0.0 0.0 0.0 133mxe 0.0 0.0 0.0 0.0 0.0 0.0 0.0 0.0 0.0 0.0
1ssxe 0.0 0.0 0.0 0.0 0.0 0.0 0.1 0.1 0.3 0.4
135mxe 0.0 0.0 0.0 0.0 0.0 0.0 0.0 0.0 0.0 0.0
13sxe 0.0 0.0 0.0 0.0 0.0 0.0 0.1 0.1 0.1 0.1
TOTALS 0.0 0.0 0.0 0.0 0.1 0.1 0.4 0.5 0.7 0.8
216

The Ohio State University Research Reactor
Safety Analysis Report October 2018
Table 8.17 Integral Whole-Body Gamma Doses From Submersion Outside of the Restricted Area Assuming a Leakage Fraction of 0.857 Hr1 (Purge Fan On)
Dose in mrem
Exposure Times Isotope
5 10 15 30 60 2 24 48 168 720 symbol Minutes Minutes Minutes Minutes Minutes Hours Hours Hours Hours Hours
1311 0.0 0.0 0.0 0.0 0.0 0.0 0.0 0.0 0.0 0.0 1321 0.0 0.0 0.0 0.0 0.0 0.0 0.0 0.0 0.0 0.0 1331 0.0 0.0 0.0 0.0 0.0 0.0 0.0 0.0 0.0 0.0 1341 0.0 0.0 0.0 0.0 0.0 0.0 0.0 0.0 0.0 0.0
1351 0.0 0.0 0.0 0.0 0.0 0.0 0.0 0.0 0.0 0.0
ssmKr 0.0 0.1 0.1 0.1 0.2 0.3 0.3 0.3 0.3 0.3
s1Kr 0.2 0.3 0.5 0.8 1.2 1.5 1.6 1.6 1.6 1.6
ssKr 0.9 1.7 2.4 4.2 6.6 8.8 9.9 9.9 9.9 9.9
131mxe 0.0 0.0 0.0 0.0 0.0 0.0 0.0 0.0 0.0 0.0
133mxe 0.0 0.0 0.0 0.0 0.0 0.1 0.1 0.1 0.1 0.1
1ssxe 0.1 0.1 0.2 0.3 0.5 0.7 0.8 0.8 0.8 0.8
135mxe 0.1 0.2 0.2 0.3 0.4 0.4 0.4 0.4 0.4 0.4
1ssxe 0.2 0.3 0.5 0.9 1.4 1.9 2.3 2.3 2.3 2.3
TOTALS 1.4 2.7 3.8 6.6 10.3 13.7 15.4 15.4 15.4 15.4
217
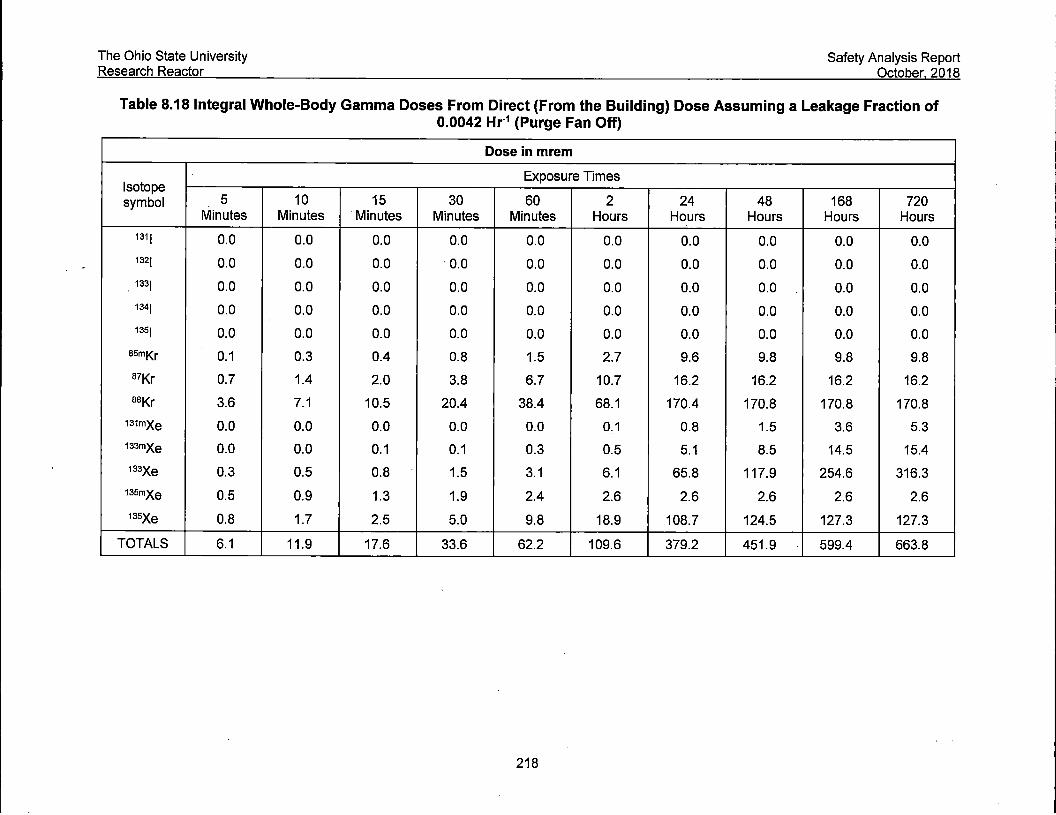
The Ohio State University Research Reactor
Safety Analysis Report October 2018
Table 8.18 Integral Whole-Body Gamma Doses From Direct (From the Building) Dose Assuming a Leakage Fraction of 0.0042 Hr1 (Purge Fan Off)
Dose in mrem
Isotope Exposure Times
symbol 5 10 15 30 60 2 24 48 168 720 Minutes Minutes Minutes Minutes Minutes Hours Hours Hours Hours Hours
1311 0.0 0.0 0.0 0.0 0.0 0.0 0.0 0.0 0.0 0.0 1321 0.0 0.0 0.0 0.0 0.0 0.0 0.0 0.0 0.0 0.0
. 1331 0.0 0.0 0.0 0.0 0.0 0.0 0.0 0.0 0.0 0.0 1341 0.0 0.0 0.0 0.0 0.0 0.0 0.0 0.0 0.0 0.0 1351 0.0 0.0 0.0 0.0 0.0 0.0 0.0 0.0 0.0 0.0
ssmKr 0.1 0.3 0.4 0.8 1.5 2.7 9.6 9.8 9.8 9.8 B7Kr 0.7 1.4 2.0 3.8 6.7 10.7 16.2 16.2 16.2 16.2 asKr 3.6 7.1 10.5 20.4 38.4 68.1 170.4 170.8 170.8 170.8
131mxe 0.0 0.0 0.0 0.0 0.0 0.1 0.8 1.5 3.6 5.3 133mxe 0.0 0.0 0.1 0.1 0.3 0.5 5.1 8.5 14.5 15.4 133Xe 0.3 0.5 0.8 1.5 3.1 6.1 65.8 117.9 254.6 316.3
135mxe 0.5 0.9 1.3 1.9 2.4 2.6 2.6 2.6 2.6 2.6 13sxe 0.8 1.7 2.5 5.0 9.8 18.9 108.7 124.5 127.3 127.3
TOTALS 6.1 11.9 17.6 33.6 62.2 109.6 379.2 451.9 599.4 663.8
218

The Ohio State University Research Reactor
Safety Analysis Report October 2018
Table 8.19 Integral Whole-Body Gamma Doses From Direct (From the Building) Dose Assuming a Leakage Fraction of 0.857 Hr1 (Purge Fan On)
Dose in mrem
Isotope Exposure Times
symbol 5 10 15 30 60 2 24 48 168 720 Minutes Minutes Minutes Minutes Minutes Hours Hours Hours Hours Hours
1311 0.0 0.0 0.0 0.0 0.0 0.0 0.0 0.0 0.0 0.0 1321 0.0 0.0 0.0 0.0 0.0 0.0 0.0 0.0 0.0 0.0 1331 0.0 0.0 0.0 0.0 0.0 0.0 0.0 0.0 0.0 0.0 1341 0.0 0.0 0.0 0.0 0.0 0.0 0.0 0.0 0.0 0.0 1351 0.0 0.0 0.0 0.0 0.0 0.0 0.0 0.0 0.0 0.0
ssmKr 0.1 0.2 0.4 0.6 1.0 1.4 1.6 1.6 1.6 - 1.6
s1Kr 0.7 1.3 1.8 3.1 4.7 5.9 6.3 6.3 6.3 6.3 ssKr 3.5 6.6 9.5 16.7 26.3 35.0 39.2 39.2 39.2 39.2
131mxe 0.0 0.0 0.0 0.0 0.0 0.0 0.0 0.0 0.0 0.0 133mxe 0.0 0.0 0.1 0.1 0.2 0.2 0.3 0.3 0.3 0.3 133Xe 0.2 0.5 0.7 1.2 2.1 2.9 3.6 3.6 3.6 3.6
135mxe 0.5 0.9 1.1 1.6 1.9 2.0 2.0 2.0 2.0 2.0 13sxe 0.8 1.6 2.3 4.1 6.6 9.2 10.9 10.9 10.9 10.9
TOTALS 5.9 11.1 15.9 27.5 42.8 56.6 63.9 63.9 63.9 63.9
219

The Ohio State University Research Reactor
Safety Analysis Report October 2018
With the exhaust fan off, Table 8.18 shows that the maximum direct dose from the building received by someone standing next to the building is 665 mrem. Likewise, the maximum submersion dose listed in Table 8.16 for someone standing next to the building with the exhaust fan off is listed as 0.8 mrem. Therefore, when the exhaust fan was turned off for such a hypothetical release, members of the general public could theoretically receive a dose greater than the limit of 100 mrem. This is highly unlikely, given that exposure to such a dose would require occupancy next to the building for a significant period of time. In the event of a radionuclide release, the fence surrounding the building would be used to establish a controlled area that would keep members of the general public away from the building. Therefore the hypothetical dose at this boundary will be estimated to determine if it is within 1 O CFR 20 limits.
To model direct dose at the controlled-area boundary, we use spherical shapes once again to simplify the calculations via symmetry. As was shown previously, the dose from a spherical cloud of an isotope of radius R can be estimated as the dose from an infinite cloud of that isotope multiplied by µR, where µ is the gamma absorption coefficient in air for that isotope. Therefore, the dose from a cloud of radius R1 is D.,µR1, where D., is the dose from an infinite cloud. Likewise, the dose from a cloud of radius R2 is D.,µR2, and the dose from a spherical shell extending from R1 to R2 is D.,µ(R2 - R1).
The hypothetical maximum dose (dose at the nearest point to the building at the boundary of the controlled area) was modeled as the center of spherical shells, and the reactor building was modeled as sections of the total solid angles of two shells, as seen from the center of the sphere. The size of these sections was determined by the ratio of the areas of building faces by the areas of spheres with radii equal to the distances to the building faces, and the thickness of the shell sections was calculated to make the section volumes equal the building volume. The center of the spherical shells was chosen at the east fence surrounding the building, as that is the closest point from between building and fence.
Figure 8.16 shows the spherical shell sections superimposed on the building. The solid lines show the outline of the building, and the hatched areas show the model's volumes. As can be seen in the figure, this simplification is conservative in that the average distances from the modeled volumes are closer to the point of interest at the fence than the average distance from the actual volume of the building to the fence.
To calculate the dose from isotope 'i' from the shell section closest to the controlled-area boundary, we use an equation similar to those used in previous estimates.
Di
where
Ai p
V
Ai A t
Ei F1
F2
A. 1- e-(,\+A)t =-1
- Ei -F1 -F2 ·F3 -F4 -F5 ·F8 -µ-(R2 -R1) P· V Ai +A
= source term activity in Ci = density of air = 1.293 kg/m3
= building volume = 1.982x10³ m3
= nuclide decay constant in seconds-1
= building volume leakage constant in seconds-1
= time after source release in seconds = gamma energy in MeV per tranformation = factor to convert Ci to transformations/sec= 3.7x1010
= factor to convert MeV to J = 1.6x10⁻¹³
220
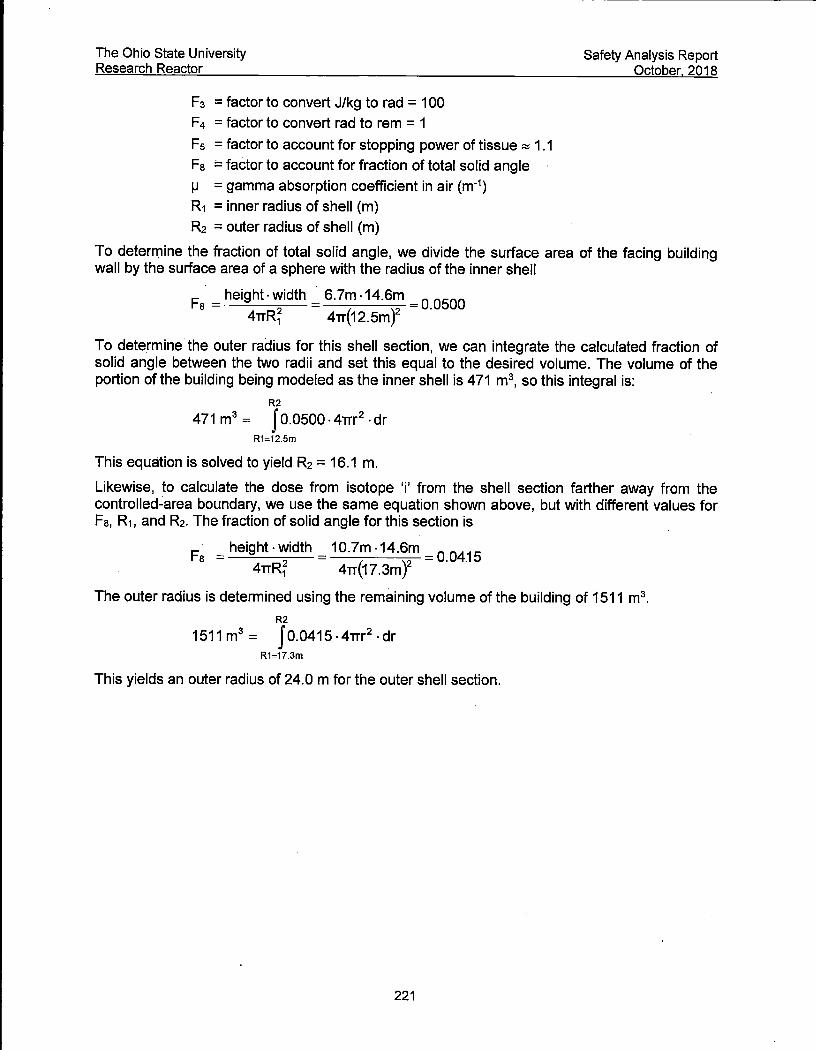
The Ohio State University Research Reactor
Fs = factor to convert J/kg to rad = 100 F 4 = factor to convert rad to rem = 1 F5 = factor to account for stopping power of tissue ~ 1.1 Fa = factor to account for fraction of total solid angle µ = gamma absorption coefficient in air (m-1) R1 = inner radius of shell (m) R2 = outer radius of shell (m)
Safety Analysis Report October 2018
To detern:,ine the fraction of total solid angle, we divide the surface area of the facing building wall by the surface area of a sphere with the radius of the inner shell
Fa= height-width= 6.7m-14.6m = 0_0500 4rrR~ 4rr(12.5m)2
To determine the outer radius for this shell section, we can integrate the calculated fraction of solid angle between the two radii and set this equal to the desired volume. The volume of the portion of the building being modeled as the inner shell is 471 m3
, so this integral is: R2
471 m3 = f 0.0500 · 4rrr2 · dr R1=12.5m
This equation is solved to yield R2 = 16.1 m.
Likewise, to calculate the dose from isotope 'i' from the shell section farther away from the controlled~area boundary, we use the same equation shown above, but with different values for Fa, R1, and R2. The fraction of solid angle for this section is
Fa =height-width= 10.7m-14.6m =0.0415 4rrR~ 4rr(17.3m)2
The outer radius is determined using the remaining volume of the building of 1511 m3.
R2
1511 m3 = f 0.0415-4rrr2 -dr R1=17.3m
This yields an outer radius of 24.0 m for the outer shell section.
221

The Ohio State University Research Reactor
Top View
Safety Analysis Report October 2018
'
,~....,,....,t,-~--,-,-..,..'-,~'--...... ------::----
',,,::,,,,, ',,
Side View (from the South)
' ' .... , .... :, .......
' ' ' ' ........................... .................... , ............
"""~ .., .:::-~ ............
Figure 8.6 Spherical shell sections used in dose modelling
222

The Ohio State University Research Reactor
Safety Analysis Report October 2018
Using the values calculated above in addition to those provided previously, we can calculate the doses from the two shell sections for each isotope and add them together to estimate the total direct dose from the building at the boundary of the controlled area. Results of these calculations are shown below in Table 8.20.
As is seen in the table, the estimate of maximum direct dose from all isotopes from the building received by someone standing at the nearest point at the controlled-area boundary is 98.3 mrem. When this is added to the submersion dose calculated previously of 0.8 mrem, the total dose is still below the limit of 100 mrem. This estimate is close to the limit, but because it is conservative, the limit will not be exceeded.
In addition to the conservatism resulting from the distance of the modeled shell sections to the point of interest, there is also conservatism from the fact that no dose attenuation is accounted for from the building or the large concrete reactor structure. Also, as was mentioned previously, the estimates for source term activities are conservative.
Note that the maximum dose calculated at the controlled-area boundary assumes that the exhaust fan has been shut off, so exhaust fan volumetric flow rate is irrelevant to these results. If the exhaust fan were to be running at any speed, the maximum dose at the controlled-area boundary would be lower, as the drop in direct dose from radioisotopes in the building would be reduced significantly more than the increase in submersion dose from exhausted radioisotopes.
223

The Ohio State University Research Reactor
Safety Analysis Report October 2018
T~1ble 8.20: Integral Whole-Body Gamma Doses From Direct (From the Building) Dose At the Controlled-Area Boundary Assuming a Leakage Fraction of 0.0042 Hr1 (Purge Fan Off)
Dose in mrem
Isotope Exposure Times
symbol 5 10 15 30 60 2 24 48 168 720 Minutes Minutes Minutes Minutes Minutes Hours Hours Hours Hours Hours
131( 0.0 0.0 0.0 0.0 0.0 0.0 0.0 0.0 0.0 0.0 132( 0.0 0.0 0.0 0.0 0.0 0.0 0.0 0.0 0.0 0.0 133( 0.0 0.0 0.0 0.0 0.0 0.0 0.0 0.0 0.0 0.0 134( 0.0 0.0 0.0 0.0 0.0 0.0 0.0 0.0 0.0 0.0 135( 0.0 0.0 0.0 0.0 0.0 0.0 0.0 0.0 0.0 0.0
asmKr 0.0 0.0 0.1 0.1 0.2 0.4 1.4 1.4 1.4 1.4 B7Kr 0.1 0.2 0.3 0.6 1.0 1.6 2.4 2.4 2.4 2.4 asKr 0.5 1.1 1.6 3.0 5.7 10.1 25.2 25.3 25.3 25.3
131mxe 0.0 0.0 0.0 0.0 0.0 0.0 0.1 0.2 0.5 0.8 133mxe 0.0 0.0 0.0 0.0 0.0 0.1 0.8 1.3 2.1 2.3 133Xe 0.0 0.1 0.1 0.2 0.5 0.9 9.7 17.5 37.7 46.9
135mxe 0.1 0.1 0.2 0.3 0.4 0.4 0.4 0.4 0.4 0.4 13sxe 0.1 0.3 0.4 -0.7 1.5 2.8 16.1 18.4 18.8 18.8
TOTALS 0.9 1.8 2.6 5.0 9.2 16.2 56.2 66.9 88.8 98.3
224