the ohio motor vehicle industry - odsa homepage · the ohio motor vehicle industry february 2009...
TRANSCRIPT

Policy Research and Strategic Planning Office A State Affiliate of the U.S. Census Bureau
THE OHIO MOTOR VEHICLE INDUSTRY
February 2009
Ted Strickland, Governor of Ohio
Lee Fisher, Lt. Governor of Ohio
Director, Ohio Department of Development


THE OHIO MOTOR VEHICLE INDUSTRY
FEBRUARY 2009
B401 Don Larrick, Principal Analyst Policy Research and Strategic Planning, Ohio Department of Development
P.O. Box 1001, Columbus, Oh. 43216-1001 Production Support: Steven Kelley, Editor
Robert Schmidley, GIS Specialist

TABLE OF CONTENTS Page Executive Summary - - - - - - - - - - - - - - - - - - - - - - - - - - - - - - - - - - - - - - - - - - - - - - - - - - - - - - - - - - - - - - - - - 1 Description of Ohio’s Motor Vehicle Industry 4 The Motor Vehicle Industry’s Impact on Ohio’s Economy- - - - - - - - - - - - - - - - - - - - - - - - - - - - - - - - - - - - - - - - - - - 5 Ohio’s Strategic Position in Motor Vehicle Assembly 7 Notable Motor Vehicle Industry Manufacturers in Ohio- - - - - - - - - - - - - - - - - - - - - - - - - - - - - - - - - - - - - - - - - - - - - 10 Recent Expansion and Attraction Announcements 20 The Concentration of the Industry in Ohio: Gross Domestic Product and Value-Added- - - - - - - - - - - - - - - - - - - - - - 22 The Composition of Ohio’s Motor Vehicle Industry: Value-Added 24 Three-Year Summaries of Light Vehicle Production in Ohio- - - - - - - - - - - - - - - - - - - - - - - - - - - - - - - - - - - - - - - - - 26 Motor Vehicle Parts: Powertrain and Stamping Operations 29 Motor Vehicle Parts: Other Suppliers - - - - - - - - - - - - - - - - - - - - - - - - - - - - - - - - - - - - - - - - - - - - - - - - - - - - - - - - - 32 The Composition of Ohio’s Motor Vehicle Industry – Employment at the Plants 36 Industry Wages - - - - - - - - - - - - - - - - - - - - - - - - - - - - - - - - - - - - - - - - - - - - - - - - - - - - - - - - - - - - - - - - - - - - - - - - 38
i

The Distribution of Industry Establishments in Ohio 40 The Distribution of Industry Employment in Ohio- - - - - - - - - - - - - - - - - - - - - - - - - - - - - - - - - - - - - - - - - - - - - - - - - 42 Foreign Investment in Ohio 43 Trends - - - - - - - - - - - - - - - - - - - - - - - - - - - - - - - - - - - - - - - - - - - - - - - - - - - - - - - - - - - - - - - - - - - - - - - - - - - - - 48 Employment 50 Gross Domestic Product- - - - - - - - - - - - - - - - - - - - - - - - - - - - - - - - - - - - - - - - - - - - - - - - - - - - - - - - - - - - - - - - - - 52 Value-Added by Ohio’s Motor Vehicle Industry 54 Light Vehicle Production in Ohio and the U.S.- - - - - - - - - - - - - - - - - - - - - - - - - - - - - - - - - - - - - - - - - - - - - - - - - - - 56 Capital Expenditures for Ohio’s Motor Vehicle Industry 58 Establishments - - - - - - - - - - - - - - - - - - - - - - - - - - - - - - - - - - - - - - - - - - - - - - - - - - - - - - - - - - - - - - - - - - - - - - - - 60 U.S. Industry Analysis and Outlook 62 Balance of Trade Trends - - - - - - - - - - - - - - - - - - - - - - - - - - - - - - - - - - - - - - - - - - - - - - - - - - - - - - - - - - - - - - - - - 64 Market Share Trends 68
ii

Recent Trends in Industry Operations - - - - - - - - - - - - - - - - - - - - - - - - - - - - - - - - - - - - - - - - - - - - - - - - - - - - - - - - 70 Technologies in Production Processes and Vehicles 74 The Near and Longer Term Outlooks- - - - - - - - - - - - - - - - - - - - - - - - - - - - - - - - - - - - - - - - - - - - - - - - - - - - - - - - - 79 Assembler Profiles 82 Chrysler LLC- - - - - - - - - - - - - - - - - - - - - - - - - - - - - - - - - - - - - - - - - - - - - - - - - - - - - - - - - - - - - - - - - - - - - - - - - - 84 Ford Motor Co. 86 General Motors Corp.- - - - - - - - - - - - - - - - - - - - - - - - - - - - - - - - - - - - - - - - - - - - - - - - - - - - - - - - - - - - - - - - - - - - 88 Honda Motor Co. 92 Navistar International Corp. and PACCAR, Inc.- - - - - - - - - - - - - - - - - - - - - - - - - - - - - - - - - - - - - - - - - - - - - - - - - - 94
Appendices 95
Detailed Tables- - - - - - - - - - - - - - - - - - - - - - - - - - - - - - - - - - - - - - - - - - - - - - - - - - - - - - - - - - - - - - - - - - 96
Table A1: Notable Motor Vehicle Companies in Ohio, 2008 97 Table A2: Expansion and Attraction Announcements in Ohio’s Motor Vehicle Industry, 2005-2008 - 105 Table A3: Value-Added in Ohio’s Motor Vehicle Industry, 2002 109 Table A4: Detailed Light Vehicle Assembly Capacity and Production in Ohio- - - - - - - - - - - - - - - - - 111 Table A5: Motor Vehicle Industry Establishments and Employment, Ohio and the U.S., 2006 113
iii

Detailed Tables- - - - - - - - - - - - - - - - - - - - - - - - - - - - - - - - - - - - - - - - - - - - - - - - - - - - - - - - - - - - - - - - - - 96
Table A6: Motor Vehicle Industry Employment and Pay, Ohio and the U.S., 2006 - - - - - - - - - - - - - 115 Table A7: Establishments and Employment in Ohio’s Motor Vehicle Industry, by County, 2006 117 Table A8a: Motor Vehicle Industry Employment Trends in Ohio, 1998-2006- - - - - - - - - - - - - - - - - - 119 Table A8b: Motor Vehicle Industry Employment Trends in the U.S., 1998-2006 120 Table A9: Total and Motor Vehicle Industry Gross Domestic Product, Ohio and the U.S., 1997-2006 121 Table A10: Trends in Value-Added by Group for Ohio and the U.S., 1997-2006 122 Table A11: Light Vehicle Production Trends in Ohio and the U.S., 1987-2007- - - - - - - - - - - - - - - - - 123 Table A12: Trends in Capital Expenditures by Group for Ohio and the U.S., 1997-2006 124 Table A13a: Motor Vehicle Industry Establishment Trends in Ohio, 1998-2006- - - - - - - - - - - - - - - - - 125 Table A13b: Motor Vehicle Industry Establishment Trends in the U.S., 1998-2006 126 Table A14: Exports as a Percentage of Imports – Motor Vehicles, Engines and Parts by Area and Type, 1997-2007 - - - - - - - - - - - - - - - - - - - - - - - - - - - - - - - - - - - - - - - - - - - - - - - - - - - 127 Table A15a: U.S. Sales of Imported and Domestic Light Vehicles, 1988-2007 129 Table A15b: Percentages of U.S. Sales of Imported and Domestic Light Vehicles, 1988-2007- - - - - - 131 Table A16: Projections of Motor Vehicle Industry Employment, Ohio and the U.S., 2006-2016 133
NAICS Codes: Industry Definition and Examples- - - - - - - - - - - - - - - - - - - - - - - - - - - - - - - - - - - - - - 134 Glossary 142 Notes - - - - - - - - - - - - - - - - - - - - - - - - - - - - - - - - - - - - - - - - - - - - - - - - - - - - - - - - - - - - - - - - - - - - - - - - - 139
Sources and References Cited 145
iv

APPENDICES
95

DETAILED TABLES
96

Table A1: Notable Motor Vehicle Industry Companies in Ohio, 2008
PrimaryParent/Company/Division NAICS City Total At Site^
AB Volvo*-Hitachi Ltd.*/Euclid-Hitachi Heavy Equipment, Inc. 336212 Cleveland 457Aisin Seiki Co. Ltd.*, et.al./ADVICS N. America, Inc./ADVICS Mfg. Ohio, Inc. 33634 Lebanon 625American Trim LLC 33637 Sidney 600ArcelorMittal*/Dofasco, Inc./Powerlasers Corp. 33637 Pioneer 115ArvinMeritor, Inc.* 1,481 ArvinMeritor, Inc. 33635 Newark 600 ArvinMeritor, Inc. 336399 Cleveland 81 ArvinMeritor, Inc. 336399 Kenton 800Asahi Glass Co., Ltd.1 650 AGC Automotive 327215 Bellefontaine 500 Belletech Corp. (a joint venture with PPG*) 327215 Bellefontaine 150ATC Group, Inc. 649 ATC Group, Inc. 336321 Geneva 100 ATC Lighting & Plastics, Inc. 336321 Geneva 60 ATC Lighting & Plastics, Inc./Advanced Technology Corp. 336321 Geneva 250 ATC Lighting & Plastics, Inc./Lighting Products, Inc. 336321 Andover 155 ATC Lighting & Plastics, Inc./Lighting Products, Inc. 336321 Andover 84Atlas Industries, Inc. 532 Atlas Industries, Inc. 336312 Fremont 134 Atlas Industries, Inc. 336312 Gibsonburg 302 Atlas Industries, Inc. 336312 Tiffin 96BAE Systems AH, Inc.* 340 BAE Systems Survivability Systems LLC 336111 Fairfield 250 BAE Systems Survivability Systems LLC/Centigon USA LLC 336111 Fairfield 90Behr & Co. GmbH/Behr Dayton Thermal Products, Inc.2 336391 Dayton 1,400Berkshire-Hathaway*/Scott Fetzer Co. 257 Stahl Co. 336212 Cardington 107 Stahl Co. 336212 Wooster 150Blackhawk Automotive Plastics 336399 Salem 680Blackstone Group LP/ TRW Automotive Holdings* 392 TRW Automotive, Inc. 336311 Cleveland 42 TRW Automotive, Inc. 33634 Mt. Vernon 35 TRW Automotive, Inc. 336399 Cleveland 50
Jobs
97

Table A1: Notable Motor Vehicle Industry Companies in Ohio, 2008
PrimaryParent/Company/Division NAICS City Total At Site^
Blackstone Group LP/ TRW Automotive Holdings* (continued) TRW Automotive, Inc.6 336399 Fayette 210 TRW Automotive U.S. LLC 336399 Toledo 55Bridgestone Corp.*/Bridgestone AMP Co. 326291 Upper Sandusky 100Cerberus Capital Mgt. LP6 3,755 Chrysler LLC*3 3,375 Toledo North Assembly Plant 336112 Toledo 1,275 Toledo Supplier Park4 336112 Toledo 500 Toledo Machining Plant 3363 Perrysburg 700 Twinsburg Stamping Plant 33637 Twinsburg 900 Tower Automotive, Inc. 380 Tower Automotive Operations USA I LLC 33637 Bluffton 217 Tower Automotive Operations USA I LLC 336399 Bellevue 163Commercial Vehicle Group, Inc. 1,073 Commercial Vehicle Group, Inc.5 336211 Norwalk Commercial Vehicle Group, Inc.5 33637 Shadyside Commercial Vehicle Group, Inc.5 336399 New Albany 125 Trim Systems Operating Corp. 31332 Dublin 240 Trim Systems Operating Corp. 336211 Chillicothe 178 Trim Systems Operating Corp. 336399 New Albany 80Cooper Tire & Rubber Co., Inc.*6 326211 Findlay 1,192Cummins, Inc.*/Cummins Filtration, Inc./Kuss Corp. 333999 Findlay 280Cypress Group LLC/Cooper-Standard Automotive, Inc.* 1,442 Cooper-Standard Automotive, Inc. 32622 Bowling Green 500 Cooper-Standard Automotive, Inc. 32622 Bowling Green 350 Cooper-Standard Automotive, Inc. 33634 New Lexington 352 Cooper-Standard Automotive, Inc. 336391 Archbold 240Daimler AG*/Detroit Diesel Remanufacturing 333618 Byesville 500Dana Corp.* 1,327 Coupled Products LLC 33634 Upper Sandusky 355 Coupled Products LLC 336399 Wharton 200 Daido Metal 331525 Bellefontaine 372 Dana Corp. 336399 Toledo 300 Dana Ltd. 336399 Maumee 100
450--------->
Jobs
98

Table A1: Notable Motor Vehicle Industry Companies in Ohio, 2008
PrimaryParent/Company/Division NAICS City Total At Site^
Delphi Corp.* 3,300+ Delphi Corp. 336322 Warren 120 Delphi Corp. 336399 Dayton 1,200 Delphi Corp. 336399 Dayton 700 Delphi Corp. 336399 Kettering n.a. Delphi Corp. 336399 Vienna 120 Delphi Corp. 336399 Warren 99 Delphi Corp. 336399 Warren 500 Delphi Corp. 336399 Warren 200 Delphi Corp. 336399 Youngstown 100Dover Corp.*/Dover Diversified, Inc./Wiseco Piston, Inc. 336311 Mentor 265Eaton Corp.* 1,100 Eaton Corp. (headquarters only - no manufacturing at this site) 336322 Cleveland 500 Eaton Corp. 33634 Cleveland 200 Eaton Inoac (a joint venture with Inoac Corp.) 336399 Fremont 400Ernie Green Industries, Inc. 983 Florida Production Engineering 33637 New Madison 230 Marion Industries, Inc. 336399 Marion 753Ford Motor Co.*6 7,995 Cleveland Casting Plant7 331511 Brook Park 1,067 Ohio Assembly Plant 336112 Avon Lake 2,300 Cleveland Engine Plant 18 336312 Brook Park 0 Cleveland Engine Plant 2 336312 Brook Park 813 Lima Engine Plant 336312 Lima 730 Sharonville Transmission Plant 33635 Cincinnati 1,478 Walton Hills Stamping Plant 33637 Walton Hills 607 Automotive Components Holding Co. (f.k.a. a Visteon Corp.* plant)9 336399 Sandusky 1,000F-Tech, Inc./F&P America Mfg., Inc. 336399 Troy 650General Motors Corp.*6 9,145 GMPT Defiance Foundry 331511 Defiance 1,493 DMAX Ltd. (joint venture with Isuzu Motors Ltd.*)10 333618 Moraine 600 Lordstown Complex: Assembly and Metal Center11 336111/33637 Lordstown 2,756 GMPT Toledo Transmission 33635 Toledo 1,663
Jobs
99
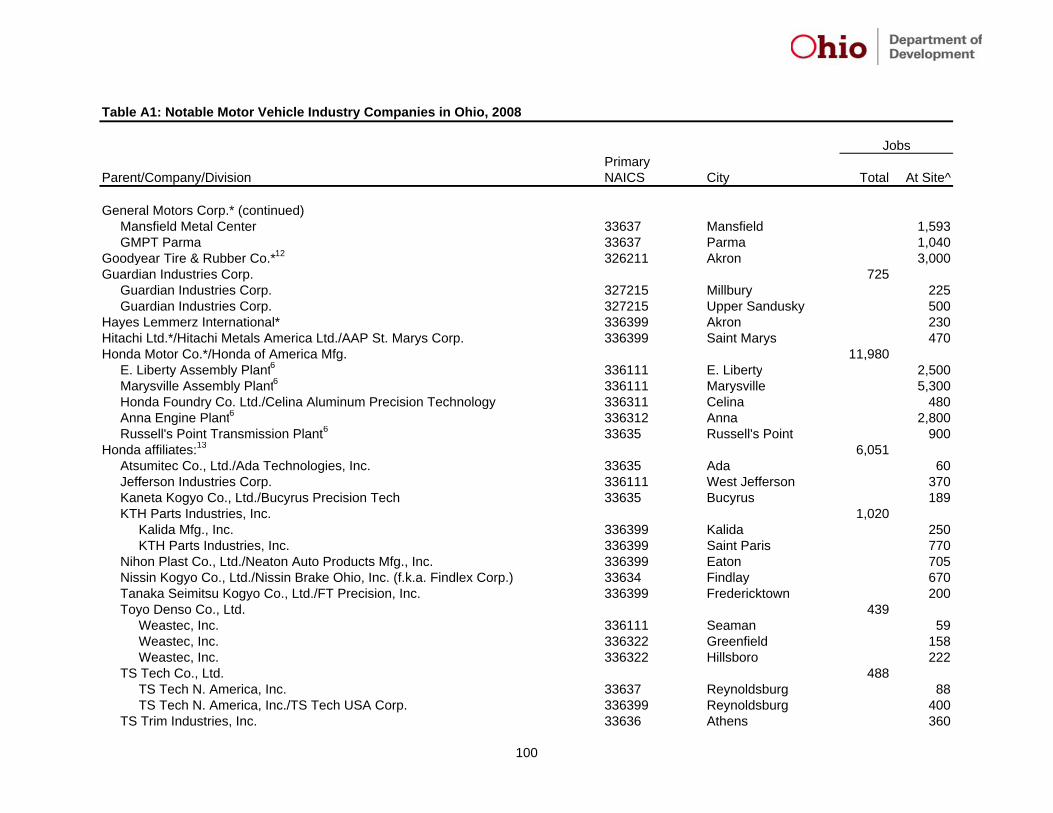
Table A1: Notable Motor Vehicle Industry Companies in Ohio, 2008
PrimaryParent/Company/Division NAICS City Total At Site^
General Motors Corp.* (continued) Mansfield Metal Center 33637 Mansfield 1,593 GMPT Parma 33637 Parma 1,040Goodyear Tire & Rubber Co.*12 326211 Akron 3,000Guardian Industries Corp. 725 Guardian Industries Corp. 327215 Millbury 225 Guardian Industries Corp. 327215 Upper Sandusky 500Hayes Lemmerz International* 336399 Akron 230Hitachi Ltd.*/Hitachi Metals America Ltd./AAP St. Marys Corp. 336399 Saint Marys 470Honda Motor Co.*/Honda of America Mfg. 11,980 E. Liberty Assembly Plant6 336111 E. Liberty 2,500 Marysville Assembly Plant6 336111 Marysville 5,300 Honda Foundry Co. Ltd./Celina Aluminum Precision Technology 336311 Celina 480 Anna Engine Plant6 336312 Anna 2,800 Russell's Point Transmission Plant6 33635 Russell's Point 900Honda affiliates:13 6,051 Atsumitec Co., Ltd./Ada Technologies, Inc. 33635 Ada 60 Jefferson Industries Corp. 336111 West Jefferson 370 Kaneta Kogyo Co., Ltd./Bucyrus Precision Tech 33635 Bucyrus 189 KTH Parts Industries, Inc. 1,020 Kalida Mfg., Inc. 336399 Kalida 250 KTH Parts Industries, Inc. 336399 Saint Paris 770 Nihon Plast Co., Ltd./Neaton Auto Products Mfg., Inc. 336399 Eaton 705 Nissin Kogyo Co., Ltd./Nissin Brake Ohio, Inc. (f.k.a. Findlex Corp.) 33634 Findlay 670 Tanaka Seimitsu Kogyo Co., Ltd./FT Precision, Inc. 336399 Fredericktown 200 Toyo Denso Co., Ltd. 439 Weastec, Inc. 336111 Seaman 59 Weastec, Inc. 336322 Greenfield 158 Weastec, Inc. 336322 Hillsboro 222 TS Tech Co., Ltd. 488 TS Tech N. America, Inc. 33637 Reynoldsburg 88 TS Tech N. America, Inc./TS Tech USA Corp. 336399 Reynoldsburg 400 TS Trim Industries, Inc. 33636 Athens 360
Jobs
100

Table A1: Notable Motor Vehicle Industry Companies in Ohio, 2008
PrimaryParent/Company/Division NAICS City Total At Site^
Honda affiliates (continued) Yachiyo Industry Co., Ltd./AY Mfg. Ltd. 336399 Columbus 200 Yamada Mfg. Co., Ltd./Yamada N. America, Inc. 33633 S. Charleston 350 Yanagawa Seiki Co., Ltd./YSK Corp. 33637 Chillicothe 250 Yutaka Giken Co., Ltd./Cardington Yutaka Technologies 336399 Cardington 750Honeywell International, Inc.* 1,225 Honeywell International, Inc. 336399 Fostoria 900 Honeywell International, Inc. 336399 Greenville 325Illinois Tool Works, Inc.*/Tomco Div. 326199 Bryan 270INA Holding Schaffler KG/LuK GmbH/LuK Clutch Systems LLC 336399 Wooster 980International Automotive Components Group 1,954 International Automotive Components Group 326199 Fremont 304 International Automotive Components Group 326199 Huron 700 International Automotive Components Group 33636 Sidney 350 International Automotive Components Group 336399 Wauseon 600Johnson Controls, Inc.* 1,376 Battery Group 335911 Holland 456 Johnson Controls, Inc. 336211 Dayton 500 Johnson Controls Interiors LLC 33636 Oberlin 250 Johnson Controls Interiors LLC 336399 Northwood 170Kongsberg Automotive Holdings ASA/Kongsberg Driveline Systems II Corp. 336399 Van Wert 750Lear Corp.*7 336399 Zanesville 300Magna International, Inc.* 750 Decoma International of America, Inc. 336322 Toledo 100 Intier Automotive Seating of America, Inc. 33636 Strongsville 60 Gra-Mag Truck Interior Systems (joint venture with Grammer AG) 33636 London 40 Decoma International of America, Inc./Norplas Industries, Inc. 33637 Northwood 100 Decoma International, Inc./Decoma Systems Integration Group, Inc. 33637 Toledo 100 Decoma International of America, Inc./Decoma Modular Systems, Inc. 336399 Toledo 100 Intier Automotive Seating of America, Inc. 336399 Warren 250Midway Products Group, Inc. 650 Findlay Products Corp. 33637 Findlay 200 P & A Industries, Inc. 33637 Findlay 200 Progressive Stamping, Inc. 33637 Ottoville 250
Jobs
101
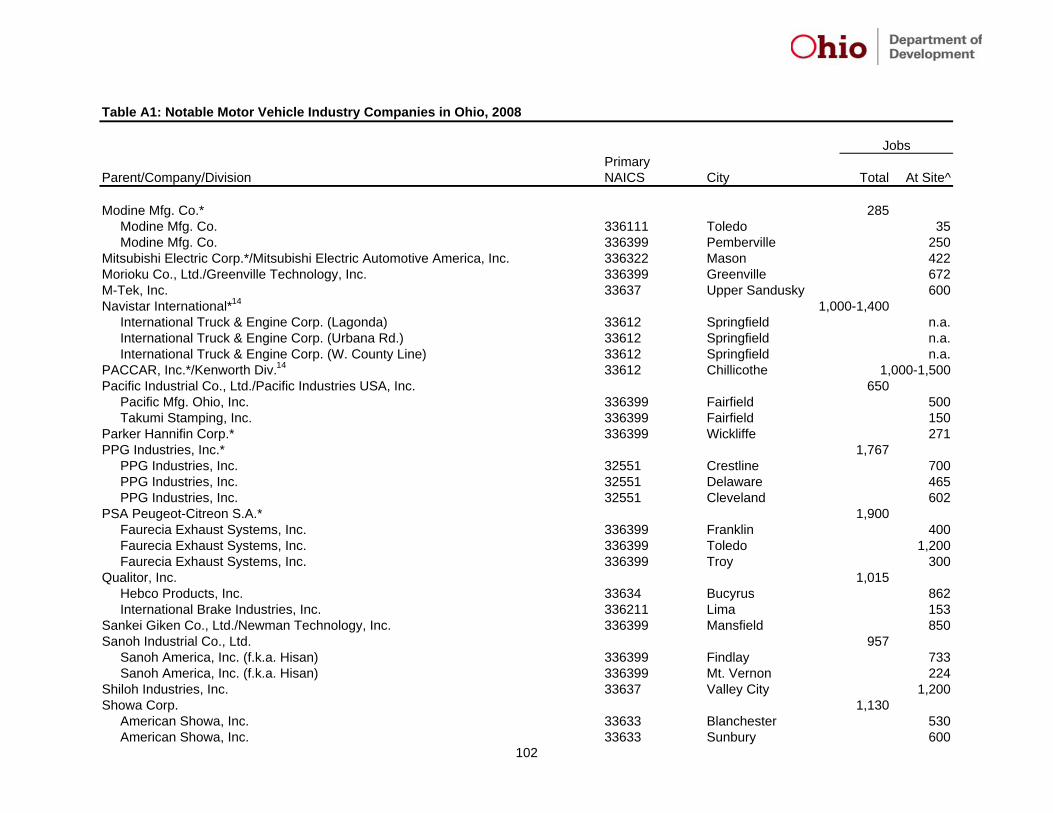
Table A1: Notable Motor Vehicle Industry Companies in Ohio, 2008
PrimaryParent/Company/Division NAICS City Total At Site^
Modine Mfg. Co.* 285 Modine Mfg. Co. 336111 Toledo 35 Modine Mfg. Co. 336399 Pemberville 250Mitsubishi Electric Corp.*/Mitsubishi Electric Automotive America, Inc. 336322 Mason 422Morioku Co., Ltd./Greenville Technology, Inc. 336399 Greenville 672M-Tek, Inc. 33637 Upper Sandusky 600Navistar International*14 1,000-1,400 International Truck & Engine Corp. (Lagonda) 33612 Springfield n.a. International Truck & Engine Corp. (Urbana Rd.) 33612 Springfield n.a. International Truck & Engine Corp. (W. County Line) 33612 Springfield n.a.PACCAR, Inc.*/Kenworth Div.14 33612 Chillicothe 1,000-1,500Pacific Industrial Co., Ltd./Pacific Industries USA, Inc. 650 Pacific Mfg. Ohio, Inc. 336399 Fairfield 500 Takumi Stamping, Inc. 336399 Fairfield 150Parker Hannifin Corp.* 336399 Wickliffe 271PPG Industries, Inc.* 1,767 PPG Industries, Inc. 32551 Crestline 700 PPG Industries, Inc. 32551 Delaware 465 PPG Industries, Inc. 32551 Cleveland 602PSA Peugeot-Citreon S.A.* 1,900 Faurecia Exhaust Systems, Inc. 336399 Franklin 400 Faurecia Exhaust Systems, Inc. 336399 Toledo 1,200 Faurecia Exhaust Systems, Inc. 336399 Troy 300Qualitor, Inc. 1,015 Hebco Products, Inc. 33634 Bucyrus 862 International Brake Industries, Inc. 336211 Lima 153Sankei Giken Co., Ltd./Newman Technology, Inc. 336399 Mansfield 850Sanoh Industrial Co., Ltd. 957 Sanoh America, Inc. (f.k.a. Hisan) 336399 Findlay 733 Sanoh America, Inc. (f.k.a. Hisan) 336399 Mt. Vernon 224Shiloh Industries, Inc. 33637 Valley City 1,200Showa Corp. 1,130 American Showa, Inc. 33633 Blanchester 530 American Showa, Inc. 33633 Sunbury 600
Jobs
102
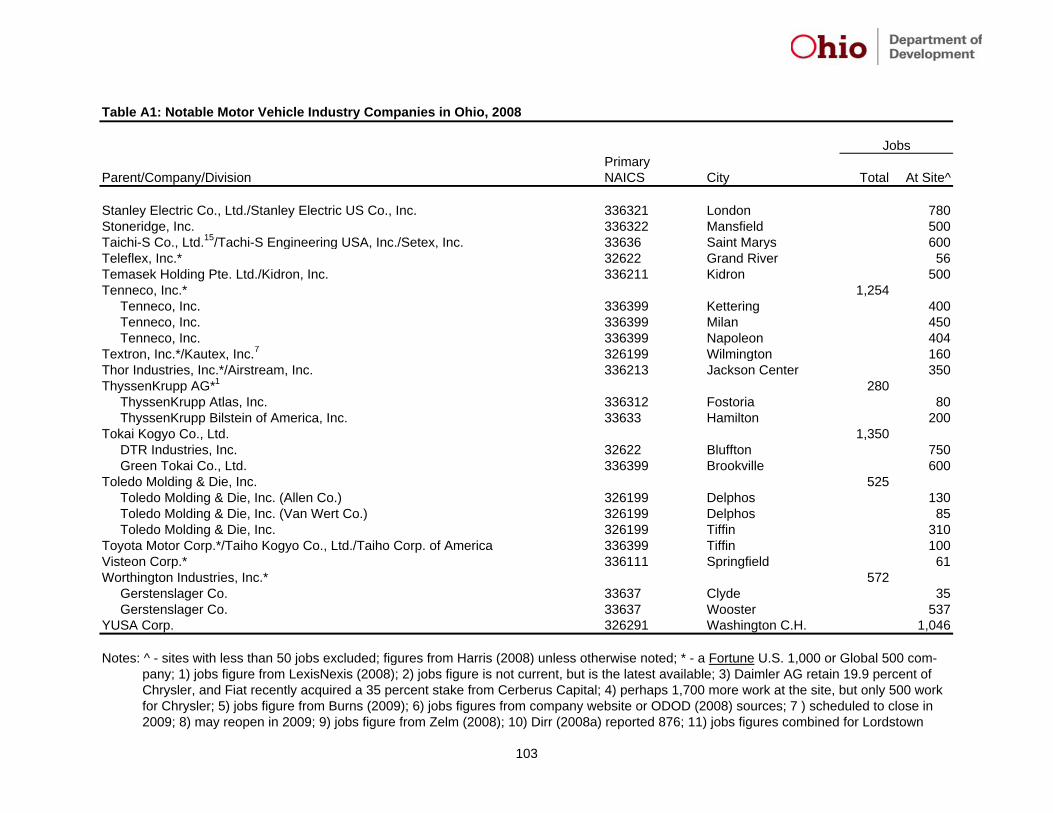
Table A1: Notable Motor Vehicle Industry Companies in Ohio, 2008
PrimaryParent/Company/Division NAICS City Total At Site^
Stanley Electric Co., Ltd./Stanley Electric US Co., Inc. 336321 London 780Stoneridge, Inc. 336322 Mansfield 500Taichi-S Co., Ltd.15/Tachi-S Engineering USA, Inc./Setex, Inc. 33636 Saint Marys 600Teleflex, Inc.* 32622 Grand River 56Temasek Holding Pte. Ltd./Kidron, Inc. 336211 Kidron 500Tenneco, Inc.* 1,254 Tenneco, Inc. 336399 Kettering 400 Tenneco, Inc. 336399 Milan 450 Tenneco, Inc. 336399 Napoleon 404Textron, Inc.*/Kautex, Inc.7 326199 Wilmington 160Thor Industries, Inc.*/Airstream, Inc. 336213 Jackson Center 350ThyssenKrupp AG*1 280 ThyssenKrupp Atlas, Inc. 336312 Fostoria 80 ThyssenKrupp Bilstein of America, Inc. 33633 Hamilton 200Tokai Kogyo Co., Ltd. 1,350 DTR Industries, Inc. 32622 Bluffton 750 Green Tokai Co., Ltd. 336399 Brookville 600Toledo Molding & Die, Inc. 525 Toledo Molding & Die, Inc. (Allen Co.) 326199 Delphos 130 Toledo Molding & Die, Inc. (Van Wert Co.) 326199 Delphos 85 Toledo Molding & Die, Inc. 326199 Tiffin 310Toyota Motor Corp.*/Taiho Kogyo Co., Ltd./Taiho Corp. of America 336399 Tiffin 100Visteon Corp.* 336111 Springfield 61Worthington Industries, Inc.* 572 Gerstenslager Co. 33637 Clyde 35 Gerstenslager Co. 33637 Wooster 537YUSA Corp. 326291 Washington C.H. 1,046
Notes: ^ - sites with less than 50 jobs excluded; figures from Harris (2008) unless otherwise noted; * - a Fortune U.S. 1,000 or Global 500 com- pany; 1) jobs figure from LexisNexis (2008); 2) jobs figure is not current, but is the latest available; 3) Daimler AG retain 19.9 percent of Chrysler, and Fiat recently acquired a 35 percent stake from Cerberus Capital; 4) perhaps 1,700 more work at the site, but only 500 work for Chrysler; 5) jobs figure from Burns (2009); 6) jobs figures from company website or ODOD (2008) sources; 7 ) scheduled to close in 2009; 8) may reopen in 2009; 9) jobs figure from Zelm (2008); 10) Dirr (2008a) reported 876; 11) jobs figures combined for Lordstown
103
Jobs

Table A1: Notable Motor Vehicle Industry Companies in Ohio, 2008
PrimaryParent/Company/Division NAICS City Total At Site^
assembly and metal fabrication plants; second shift will be cut in 2009, leaving only 1,400 in assembly (Gearino, 2009); 12) jobs figure from Crain's Cleveland Business (2008) includes headquarters; 13) list compiled from Honda's and others' websites; 14) no one credible figure available; 15) Nissan* owns 12 percent; n.a. - not available.
Sources: Blade Staff (2008), Burns (2009), Crain's Cleveland Business (2008), Dirr (2008a), Gearino (2009), Harris (2008), Jarman (2008), LexisNexis (2008), ODOD (2008), Schoenberger (2008d), Zelm (2008), and various company websites.
Prepared by: Policy Research & Strategic Planning, Ohio Dept. of Development. Telephone 1-800-848-1300, or 614-466-2116 (DL, 1/09).
104
Jobs
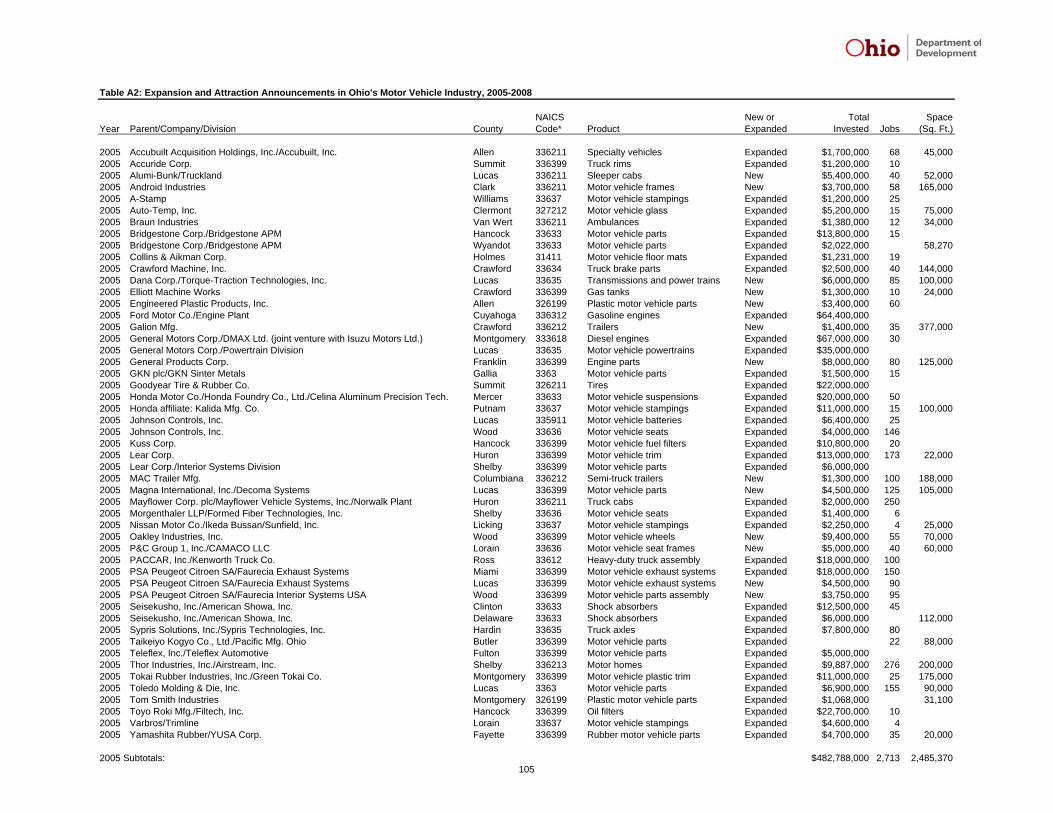
Table A2: Expansion and Attraction Announcements in Ohio's Motor Vehicle Industry, 2005-2008
NAICS New or Total SpaceYear Parent/Company/Division County Code* Product Expanded Invested Jobs (Sq. Ft.)
2005 Accubuilt Acquisition Holdings, Inc./Accubuilt, Inc. Allen 336211 Specialty vehicles Expanded $1,700,000 68 45,0002005 Accuride Corp. Summit 336399 Truck rims Expanded $1,200,000 102005 Alumi-Bunk/Truckland Lucas 336211 Sleeper cabs New $5,400,000 40 52,0002005 Android Industries Clark 336211 Motor vehicle frames New $3,700,000 58 165,0002005 A-Stamp Williams 33637 Motor vehicle stampings Expanded $1,200,000 252005 Auto-Temp, Inc. Clermont 327212 Motor vehicle glass Expanded $5,200,000 15 75,0002005 Braun Industries Van Wert 336211 Ambulances Expanded $1,380,000 12 34,0002005 Bridgestone Corp./Bridgestone APM Hancock 33633 Motor vehicle parts Expanded $13,800,000 152005 Bridgestone Corp./Bridgestone APM Wyandot 33633 Motor vehicle parts Expanded $2,022,000 58,2702005 Collins & Aikman Corp. Holmes 31411 Motor vehicle floor mats Expanded $1,231,000 192005 Crawford Machine, Inc. Crawford 33634 Truck brake parts Expanded $2,500,000 40 144,0002005 Dana Corp./Torque-Traction Technologies, Inc. Lucas 33635 Transmissions and power trains New $6,000,000 85 100,0002005 Elliott Machine Works Crawford 336399 Gas tanks New $1,300,000 10 24,0002005 Engineered Plastic Products, Inc. Allen 326199 Plastic motor vehicle parts New $3,400,000 602005 Ford Motor Co./Engine Plant Cuyahoga 336312 Gasoline engines Expanded $64,400,0002005 Galion Mfg. Crawford 336212 Trailers New $1,400,000 35 377,0002005 General Motors Corp./DMAX Ltd. (joint venture with Isuzu Motors Ltd.) Montgomery 333618 Diesel engines Expanded $67,000,000 302005 General Motors Corp./Powertrain Division Lucas 33635 Motor vehicle powertrains Expanded $35,000,0002005 General Products Corp. Franklin 336399 Engine parts New $8,000,000 80 125,0002005 GKN plc/GKN Sinter Metals Gallia 3363 Motor vehicle parts Expanded $1,500,000 152005 Goodyear Tire & Rubber Co. Summit 326211 Tires Expanded $22,000,0002005 Honda Motor Co./Honda Foundry Co., Ltd./Celina Aluminum Precision Tech. Mercer 33633 Motor vehicle suspensions Expanded $20,000,000 502005 Honda affiliate: Kalida Mfg. Co. Putnam 33637 Motor vehicle stampings Expanded $11,000,000 15 100,0002005 Johnson Controls, Inc. Lucas 335911 Motor vehicle batteries Expanded $6,400,000 252005 Johnson Controls, Inc. Wood 33636 Motor vehicle seats Expanded $4,000,000 1462005 Kuss Corp. Hancock 336399 Motor vehicle fuel filters Expanded $10,800,000 202005 Lear Corp. Huron 336399 Motor vehicle trim Expanded $13,000,000 173 22,0002005 Lear Corp./Interior Systems Division Shelby 336399 Motor vehicle parts Expanded $6,000,0002005 MAC Trailer Mfg. Columbiana 336212 Semi-truck trailers New $1,300,000 100 188,0002005 Magna International, Inc./Decoma Systems Lucas 336399 Motor vehicle parts New $4,500,000 125 105,0002005 Mayflower Corp. plc/Mayflower Vehicle Systems, Inc./Norwalk Plant Huron 336211 Truck cabs Expanded $2,000,000 2502005 Morgenthaler LLP/Formed Fiber Technologies, Inc. Shelby 33636 Motor vehicle seats Expanded $1,400,000 62005 Nissan Motor Co./Ikeda Bussan/Sunfield, Inc. Licking 33637 Motor vehicle stampings Expanded $2,250,000 4 25,0002005 Oakley Industries, Inc. Wood 336399 Motor vehicle wheels New $9,400,000 55 70,0002005 P&C Group 1, Inc./CAMACO LLC Lorain 33636 Motor vehicle seat frames New $5,000,000 40 60,0002005 PACCAR, Inc./Kenworth Truck Co. Ross 33612 Heavy-duty truck assembly Expanded $18,000,000 1002005 PSA Peugeot Citroen SA/Faurecia Exhaust Systems Miami 336399 Motor vehicle exhaust systems Expanded $18,000,000 1502005 PSA Peugeot Citroen SA/Faurecia Exhaust Systems Lucas 336399 Motor vehicle exhaust systems New $4,500,000 902005 PSA Peugeot Citroen SA/Faurecia Interior Systems USA Wood 336399 Motor vehicle parts assembly New $3,750,000 952005 Seisekusho, Inc./American Showa, Inc. Clinton 33633 Shock absorbers Expanded $12,500,000 452005 Seisekusho, Inc./American Showa, Inc. Delaware 33633 Shock absorbers Expanded $6,000,000 112,0002005 Sypris Solutions, Inc./Sypris Technologies, Inc. Hardin 33635 Truck axles Expanded $7,800,000 802005 Taikeiyo Kogyo Co., Ltd./Pacific Mfg. Ohio Butler 336399 Motor vehicle parts Expanded 22 88,0002005 Teleflex, Inc./Teleflex Automotive Fulton 336399 Motor vehicle parts Expanded $5,000,0002005 Thor Industries, Inc./Airstream, Inc. Shelby 336213 Motor homes Expanded $9,887,000 276 200,0002005 Tokai Rubber Industries, Inc./Green Tokai Co. Montgomery 336399 Motor vehicle plastic trim Expanded $11,000,000 25 175,0002005 Toledo Molding & Die, Inc. Lucas 3363 Motor vehicle parts Expanded $6,900,000 155 90,0002005 Tom Smith Industries Montgomery 326199 Plastic motor vehicle parts Expanded $1,068,000 31,1002005 Toyo Roki Mfg./Filtech, Inc. Hancock 336399 Oil filters Expanded $22,700,000 102005 Varbros/Trimline Lorain 33637 Motor vehicle stampings Expanded $4,600,000 42005 Yamashita Rubber/YUSA Corp. Fayette 336399 Rubber motor vehicle parts Expanded $4,700,000 35 20,000
2005 Subtotals: $482,788,000 2,713 2,485,370105

Table A2: Expansion and Attraction Announcements in Ohio's Motor Vehicle Industry, 2005-2008
NAICS New or Total SpaceYear Parent/Company/Division County Code* Product Expanded Invested Jobs (Sq. Ft.)
2006 Aisin Seiki Co. Ltd., et. al./Advics N. America, Inc./Advics Mfg. Ohio, Inc. Warren 33634 Brake systems Expanded $37,000,000 10 25,0002006 Asahi Glass Co., Ltd./AFG Industries, Inc. Logan 327211 Motor vehicle glass Expanded $5,700,000 1002006 ASC Industries, Inc. Summit 336399 Motor vehicle pumps Expanded $3,000,000 100 70,0002006 Atlas Industries, Inc. Sandusky 336312 Crankshafts Expanded $4,200,000 25 58,0002006 Atsumitec/Ada Technologies Hardin 336399 Motor vehicle parts Expanded $1,900,000 35 50,0002006 Behr GmbH & Co. KG/Behr America Montgomery 336391 Motor vehicle HV/AC systems Expanded $16,000,0002006 Braun Industries Van Wert 336211 Ambulances Expanded $1,400,000 12 34,0002006 Bucyrus Precision Tech. Crawford 336399 Motor vehicle parts Expanded $5,300,000 102006 Cerberus Capital Mgt. L.P./Tower Automotive, Inc. Sandusky 336211 Chassis frames Expanded $5,600,000 742006 Clarion Co., Ltd./CK Technologies Williams 326199 Plastic motor vehicle parts Expanded $6,000,000 36 60,0002006 Commercial Vehicle Group, Inc. Franklin 336399 Truck cabs New $30,000,000 80 94,0002006 Core Molding Technologies, Inc. Franklin 326199 Motor vehicle fiberglass parts Expanded $4,600,000 522006 Dayton Polymeric Products Montgomery 326199 Motor vehicle plastics Expanded $632,000 602006 Farber Specialty Vehicles Franklin 336111 Motor vehicle modifications Expanded $2,850,000 20 40,0002006 Fastener Industries, Inc./Joseph Industries, Inc. Portage 33635 Torque converters Expanded $2,700,000 34,5602006 Fleetwood Enterprises, Inc./'Fleetwood Travel Trailers Williams 336214 Recreational vehicles Expanded $755,000 2002006 F-Tech, Inc./F&P America Mfg., Inc. Miami 336399 Motor vehicle parts Expanded $20,000,000 22006 Fuserashi International Technology Medina 33637 Motor vehicle stampings Expanded $4,000,000 40,0002006 General Motors Corp. Lucas 33635 Motor vehicle transmissions Expanded $462,800,000 400,0002006 General Motors Corp. Defiance 331511 Engine blocks Expanded $109,500,0002006 Hitachi Ltd./Hitachi Metals America/AAP St. Marys Corp. Auglaize 336399 Motor vehicle parts Expanded $23,000,000 20 125,0002006 Honda Motor Co./Honda Foundry Co., Ltd./Celina Aluminum Precision Tech. Mercer 336311 Motor vehicle parts Expanded $10,200,000 21 48,0002006 Honda Motor Co./Honda of America Mfg. Shelby 336312 Gasoline engines Expanded $75,000,000 402006 Honda Motor Co./Honda of America Mfg. Logan 33635 Motor vehicle transmission parts Expanded $3,000,000 69,0002006 Honda affiliate: Kalida Mfg. Co. Putnam 336399 Motor vehicle parts Expanded $2,100,000 30 50,0002006 Honda affiliate: Tanaka Seimitsu Kogyo Co., Ltd./FT Precision, Inc. Knox 33633 Motor vehicle parts Expanded $6,033,000 632006 Honda affiliate: Toyo Denso Co., Ltd./Weastec, Inc. Highland 336399 Motor vehicle parts Expanded $10,000,000 422006 Knorr-Bremse AG/Bendix Commercial Vehicle Systems LLC Lorain 33634 Brake systems Expanded $2,900,0002006 Lacal Equipment Shelby 336399 Motor vehicle parts New $2,620,000 10 87,0002006 Morgenthaler LLP/Formed Fiber Technologies, Inc. Shelby 336399 Motor vehicle seating Expanded $5,000,000 352006 New Sabina Industries Clinton 336399 Motor vehicle parts Expanded $10,000,000 402006 Nifco, Inc./Nifco America Corp. Fairfield 326199 Plastic motor vehicle parts Expanded $1,200,000 152006 NV Bekaert SA/Bekaert Corp. Wayne 331111 Steel tire cord Expanded $4,558,000 35,1002006 PACCAR, Inc./Kenworth Truck Co. Ross 33612 Heavy-duty truck assembly Expanded $50,000,000 100,0002006 Plastic Trim LLC Greene 326199 Plastic motor vehicle parts Expanded $1,800,000 652006 PSA Peugeot Citroen SA/Faurecia Exhaust Systems Miami 336399 Motor vehicle parts Expanded $17,350,000 1502006 ThyssenKrupp AG Seneca 336312 Crankshafts Expanded $40,000,000 1002006 Tigers Polymer Corp./Tigerpoly Manufacturing, Inc. Franklin 336312 Engine parts Expanded $3,000,000 55,0002006 US Aeroteam Greene 336412 Motor vehicle/aerospace parts New $2,500,000 55 94,0002006 USUI International Butler 336399 Motor vehicle fans Expanded $6,500,000 45 125,0002006 Worthington Precision Metal, Inc. Lake 336399 Motor vehicle parts Expanded $8,000,000 502006 Yamada North America Clark 33633 Motor vehicle steering systems Expanded $26,000,000 302006 YSK Corp. Ross 336399 Motor vehicle parts Expanded $24,000,000 25 40,000
2006 Subtotals: $1,058,698,000 1,652 1,733,660
2007 Advanced Engineering Solutions Warren 336399 Motor vehicle parts Expanded $3,500,000 72 70,0002007 AO Smith Corp./GSW Mfg. Hancock 336322 Motor vehicle wiring products Expanded $1,000,000 502007 Armor Holdings, Inc. Butler 336992 Vehicle armor New $37,000,000 150 465,0002007 A-Stamp Williams 33637 Motor vehicle stampings Expanded $1,700,000 202007 Boler Co./Hendrickson USA Licking 33633 Suspension systems Expanded $1,500,000 40 40,0002007 Ernie Green Industries/Florida Production Engineering, Inc. Pickaway 336399 Motor vehicle parts Expanded $3,300,000 332007 Ford Motor Co. Hamilton 33635 Motor vehicle transmissions Expanded $200,000,0002007 F-Tech, Inc./F&P America Mfg., Inc. Miami 336399 Motor vehicle parts Expanded $3,500,000 75,0002007 General Motors Corp. Lucas 33635 Motor vehicle transmissions Expanded $332,000,000
106
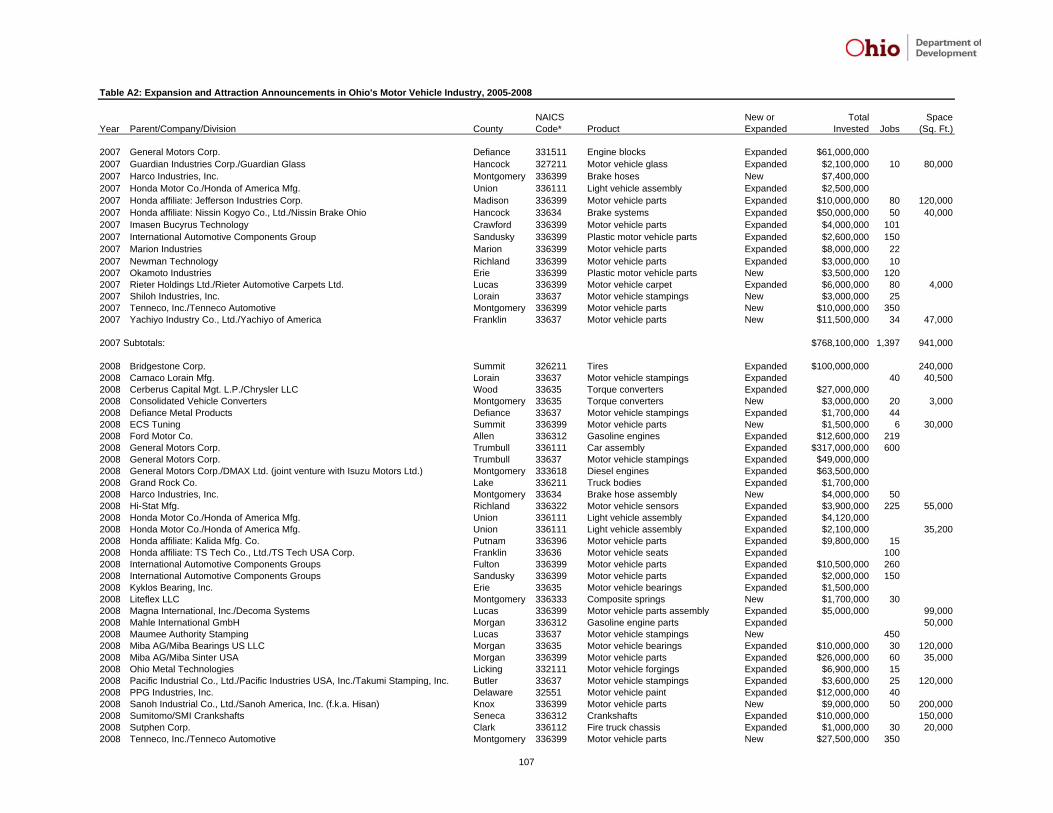
Table A2: Expansion and Attraction Announcements in Ohio's Motor Vehicle Industry, 2005-2008
NAICS New or Total SpaceYear Parent/Company/Division County Code* Product Expanded Invested Jobs (Sq. Ft.)
2007 General Motors Corp. Defiance 331511 Engine blocks Expanded $61,000,0002007 Guardian Industries Corp./Guardian Glass Hancock 327211 Motor vehicle glass Expanded $2,100,000 10 80,0002007 Harco Industries, Inc. Montgomery 336399 Brake hoses New $7,400,0002007 Honda Motor Co./Honda of America Mfg. Union 336111 Light vehicle assembly Expanded $2,500,0002007 Honda affiliate: Jefferson Industries Corp. Madison 336399 Motor vehicle parts Expanded $10,000,000 80 120,0002007 Honda affiliate: Nissin Kogyo Co., Ltd./Nissin Brake Ohio Hancock 33634 Brake systems Expanded $50,000,000 50 40,0002007 Imasen Bucyrus Technology Crawford 336399 Motor vehicle parts Expanded $4,000,000 1012007 International Automotive Components Group Sandusky 336399 Plastic motor vehicle parts Expanded $2,600,000 1502007 Marion Industries Marion 336399 Motor vehicle parts Expanded $8,000,000 222007 Newman Technology Richland 336399 Motor vehicle parts Expanded $3,000,000 102007 Okamoto Industries Erie 336399 Plastic motor vehicle parts New $3,500,000 1202007 Rieter Holdings Ltd./Rieter Automotive Carpets Ltd. Lucas 336399 Motor vehicle carpet Expanded $6,000,000 80 4,0002007 Shiloh Industries, Inc. Lorain 33637 Motor vehicle stampings New $3,000,000 252007 Tenneco, Inc./Tenneco Automotive Montgomery 336399 Motor vehicle parts New $10,000,000 3502007 Yachiyo Industry Co., Ltd./Yachiyo of America Franklin 33637 Motor vehicle parts New $11,500,000 34 47,000
2007 Subtotals: $768,100,000 1,397 941,000
2008 Bridgestone Corp. Summit 326211 Tires Expanded $100,000,000 240,0002008 Camaco Lorain Mfg. Lorain 33637 Motor vehicle stampings Expanded 40 40,5002008 Cerberus Capital Mgt. L.P./Chrysler LLC Wood 33635 Torque converters Expanded $27,000,0002008 Consolidated Vehicle Converters Montgomery 33635 Torque converters New $3,000,000 20 3,0002008 Defiance Metal Products Defiance 33637 Motor vehicle stampings Expanded $1,700,000 442008 ECS Tuning Summit 336399 Motor vehicle parts New $1,500,000 6 30,0002008 Ford Motor Co. Allen 336312 Gasoline engines Expanded $12,600,000 2192008 General Motors Corp. Trumbull 336111 Car assembly Expanded $317,000,000 6002008 General Motors Corp. Trumbull 33637 Motor vehicle stampings Expanded $49,000,0002008 General Motors Corp./DMAX Ltd. (joint venture with Isuzu Motors Ltd.) Montgomery 333618 Diesel engines Expanded $63,500,0002008 Grand Rock Co. Lake 336211 Truck bodies Expanded $1,700,0002008 Harco Industries, Inc. Montgomery 33634 Brake hose assembly New $4,000,000 502008 Hi-Stat Mfg. Richland 336322 Motor vehicle sensors Expanded $3,900,000 225 55,0002008 Honda Motor Co./Honda of America Mfg. Union 336111 Light vehicle assembly Expanded $4,120,0002008 Honda Motor Co./Honda of America Mfg. Union 336111 Light vehicle assembly Expanded $2,100,000 35,2002008 Honda affiliate: Kalida Mfg. Co. Putnam 336396 Motor vehicle parts Expanded $9,800,000 152008 Honda affiliate: TS Tech Co., Ltd./TS Tech USA Corp. Franklin 33636 Motor vehicle seats Expanded 1002008 International Automotive Components Groups Fulton 336399 Motor vehicle parts Expanded $10,500,000 2602008 International Automotive Components Groups Sandusky 336399 Motor vehicle parts Expanded $2,000,000 1502008 Kyklos Bearing, Inc. Erie 33635 Motor vehicle bearings Expanded $1,500,0002008 Liteflex LLC Montgomery 336333 Composite springs New $1,700,000 302008 Magna International, Inc./Decoma Systems Lucas 336399 Motor vehicle parts assembly Expanded $5,000,000 99,0002008 Mahle International GmbH Morgan 336312 Gasoline engine parts Expanded 50,0002008 Maumee Authority Stamping Lucas 33637 Motor vehicle stampings New 4502008 Miba AG/Miba Bearings US LLC Morgan 33635 Motor vehicle bearings Expanded $10,000,000 30 120,0002008 Miba AG/Miba Sinter USA Morgan 336399 Motor vehicle parts Expanded $26,000,000 60 35,0002008 Ohio Metal Technologies Licking 332111 Motor vehicle forgings Expanded $6,900,000 152008 Pacific Industrial Co., Ltd./Pacific Industries USA, Inc./Takumi Stamping, Inc. Butler 33637 Motor vehicle stampings Expanded $3,600,000 25 120,0002008 PPG Industries, Inc. Delaware 32551 Motor vehicle paint Expanded $12,000,000 402008 Sanoh Industrial Co., Ltd./Sanoh America, Inc. (f.k.a. Hisan) Knox 336399 Motor vehicle parts New $9,000,000 50 200,0002008 Sumitomo/SMI Crankshafts Seneca 336312 Crankshafts Expanded $10,000,000 150,0002008 Sutphen Corp. Clark 336112 Fire truck chassis Expanded $1,000,000 30 20,0002008 Tenneco, Inc./Tenneco Automotive Montgomery 336399 Motor vehicle parts New $27,500,000 350
107

Table A2: Expansion and Attraction Announcements in Ohio's Motor Vehicle Industry, 2005-2008
NAICS New or Total SpaceYear Parent/Company/Division County Code* Product Expanded Invested Jobs (Sq. Ft.)
2008 Transeo Global Vehicle Clark 336111 Armored vehicles New $200,000 69
2008 Subtotals: $727,820,000 2,878 1,197,700
Grand Totals 2005-2008: $3,037,406,000 8,640 6,357,730
Notes: * - Establishments with NAICS codes outside of the industry definition are included here when their products are made for motor vehicles.Abbreviations Used: Mfg. - manufacturing.
Source: Policy Research & Strategic Planning (2008, 2009).
Prepared by: Policy Research & Strategic Planning, Ohio Dept. of Development. Telephone 614/466-2116 (JK, DL, 1/09).
108

Table A3: Value-Added in Ohio's Motor Vehicle Industry, 2002 (in millions, except percentages)
Value- Ohio asNAICS Distribu- Added a PercentCode Industries Amount tion in Ohio in the U.S. of the U.S.
Motor Vehicle (MV) Industry $25,127.4 100.0% $176,517.9 14.2%
Transportation Equipment Industries Include: $24,683.9 98.2% $167,327.0 14.8%
3361 MV Assembly $12,686.7 50.5% $72,157.1 17.6% 33611 Automobile & Light Duty Motor Vehicles D n.a. $69,099.8 n.a. 336111 Automobiles D n.a. $28,491.9 n.a. 336112 Light Truck & Utility Vehicles $5,336.7 21.2% $40,607.9 13.1% 33612 Heavy Duty Trucks D n.a. $3,057.3 n.a.
3362 MV Bodies & Trailers $244.0 1.0% $8,741.7 2.8% 336211 MV Bodies $147.0 0.6% $2,743.6 5.4% 336212 Truck Trailers $50.2 0.2% $1,480.3 3.4% 336213&4 Motor Homes, Travel Trailers, & Campers* $46.9 0.2% $4,517.8 1.0%
3363 MV Parts $11,753.1 46.8% $86,428.2 13.6% 33631 MV Gas Engines & Engine Parts $1,100.4 4.4% $12,347.5 8.9% 336311 Carburetors, Pistons, Rings, & Valves $53.5 0.2% $1,378.2 3.9% 336312 Gasoline Engines & Engine Parts $1,046.9 4.2% $10,969.3 9.5% 33632 MV Electrical & Electronic Eqpt. $975.5 3.9% $12,949.1 7.5% 336321 Vehicular Lighting Eqpt. D n.a. $1,735.0 n.a. 336322 Other MV Electrical & Electronic Eqpt. D n.a. $11,214.1 n.a. 33633 MV Steering & Suspension Parts $792.4 3.2% $4,984.7 15.9% 33634 MV Brake Systems $1,053.4 4.2% $5,768.5 18.3%
109
Value-Added in Ohio

Table A3: Value-Added in Ohio's Motor Vehicle Industry, 2002 (in millions, except percentages)
Value- Ohio asNAICS Distribu- Added a PercentCode Industries Amount tion in Ohio in the U.S. of the U.S.
33635 MV Transmission & Power Train Parts $2,124.0 8.5% $14,437.6 14.7% 33636 MV Seating & Interior Trim $581.8 2.3% $4,779.3 12.2% 33637 MV Metal Stamping $3,278.9 13.0% $12,474.5 26.3% 33639 Other MV Parts $1,846.8 7.3% $18,687.0 9.9% 336391 Motor Vehicle Air-Conditioning D n.a. $2,748.7 n.a. 336399 All Other MV Parts D n.a. $15,938.2 n.a.
Non-transportation Industries Include: $443.6 1.8% $9,190.9 4.8%
32621 Tires $367.7 1.5% $7,665.5 4.8% 326211 Tire Mfg. (Exc. Retreading) $344.8 1.4% $7,176.7 4.8% 326212 Tire Retreading $23.0 0.1% $488.8 4.7%
335911 Storage Batteries $75.8 0.3% $1,525.4 5.0%
Notes: D - Suppressed to maintain confidentiality; n.a. - not available.
Source: U.S. Bureau of the Census (2005c, 2005d).
Prepared by: Office of Strategic Research, Ohio Dept. of Development. Telephone 614/466-2116 (DL, 4/06).
110
Value-Added in Ohio

Table A4: Detailed Light Vehicle Assembly Capacity (2008) and Production (2005 - 2007) in Ohio
Annual Units Recent Percent Percent Percent Company and City/Assembly Type Plant Daily per Employ- Vehicles of Pro- Vehicles of Pro- Vehicles of Pro- Nameplate and Model Capacity Shifts Hour ment Produced duction Produced duction Produced duction Comments
Total Light Vehicles 1,339,300 371 13,275 1,748,335 100.0% 1,669,741 100.0% 1,794,589 100.0% Production beyond capacity is achieved Total Cars1 878,900 239 9,200 870,008 49.8% 884,734 53.0% 882,222 49.2% with overtime. Total Light Trucks 460,400 132 4,075 878,327 50.2% 785,007 47.0% 912,367 50.8%
Chrysler: Light Trucks 211,600 89 1,775 377,911 21.6% 296,363 17.7% 317,099 17.7% Small sport-utility vehicles (SUVs). Toledo North: 120,900 1 46 1,275 221,195 12.7% 209,914 12.6% 220,718 12.3% Dodge Nitro 113,793 6.5% 47,906 2.9% 0 0.0% Jeep Liberty 107,402 6.1% 162,008 9.7% 220,718 12.3% Toledo South (a.k.a. Stickney): 90,700 1 43 500 156,716 9.0% 86,449 5.2% 96,381 5.4% Jeep Wrangler 62,436 3.6% 50,324 3.0% 74,781 4.2% Jeep Wrangler Unlimited 94,280 5.4% 36,125 2.2% 21,600 1.2%
Ford: Light Trucks 90,700 43 2,300 179,918 10.3% 179,293 10.7% 230,132 12.8% Avon Lake (a.k.a. Ohio Assembly): 90,700 1 43 2,300 179,918 10.3% 179,293 10.7% 27,061 1.5% Ford Econoline 179,918 10.3% 179,293 10.7% 0 0.0% Econoline to be replaced by European Transit in 201 Mercury Mariner2 27,061 1.5% Mariner production consolidated to Kansas City. Lorain Permanently closed, December, 2005 203,071 11.3% Econoline (large van) moved to Avon Lake.
GM: Light Vehicles 293,400 63 1,400 489,188 28.0% 507,418 30.4% 600,179 33.4% Lordstown3--Cars: 293,400 1 63 1,400 280,452 16.0% 278,176 16.7% 301,159 16.8% Cruze production scheduled for 2010. Chevrolet Cobalt 226,314 12.9% 232,913 13.9% 279,711 15.6% Sub-compact, to be replace by the Cruze. Pontiac Pursuit/G5/G4 54,138 3.1% 45,263 2.7% 21,448 1.2% Sub-compact, not for sale in the U.S. Moraine--Light Trucks: Permanently closed, December, 2008 208,736 11.9% 229,242 13.7% 299,020 16.7% Mid-size SUVs. Buick Rainier 2,561 0.1% 10,001 0.6% 12,298 0.7% Model production ended in 2007. Chevrolet TrailBlazer 148,658 8.5% 150,004 9.0% 201,788 11.2% GMC Envoy2 49,539 2.8% 61,528 3.7% 74,888 4.2% Isuzu Ascender2 2,502 0.1% 2,064 0.1% 4,251 0.2% Saab 9-7X 5,476 0.3% 5,645 0.3% 5,795 0.3%
Honda: Light Vehicles1 743,600 176 7,800 701,318 40.1% 686,667 41.1% 647,179 36.1% E. Liberty--Light Vehicles: 251,900 2 59 2,500 242,475 13.9% 237,973 14.3% 205,300 11.4% Accord--Car 0 0.0% 0 0.0% 5,460 0.3% An example of flexible manufacturing. Civic2--Car 118,400 156,032 8.9% 176,652 10.6% 133,724 7.5% Redesign scheduled in 2010. CR-V--Light Truck 70,500 48,867 2.8% 7,111 0.4% 0 0.0% Redesign scheduled in 2011. Element--Light Truck 63,000 37,576 2.1% 54,210 3.2% 66,116 3.7% Marysville--Light Vehicles: 491,700 2 117 5,300 458,843 26.2% 448,694 26.9% 441,879 24.6% Accord--Car 373,700 366,870 21.0% 350,393 21.0% 353,334 19.7% Acura RDX--Light Truck 24,600 25,319 1.4% 18,788 1.1% 0 0.0% The RDX is a crossover utility vehicle (CUV). Acura TL--Car 93,400 66,654 3.8% 79,513 4.8% 88,545 4.9% Redesigned for 2008.
Notes: 1 - Honda's employees and units per hour are counted in the car categories because the majority of vehicles it produces are cars; 2 - the same or slight variations of this model are made elsewhere in N. America; 3 - one shift only beginning in April, 2009, and assembly jobs will fall to 1,400.
Sources: Associated Press (2008), Gearino (2009), ODOD (2008), Ward's (2006-2008).
Prepared by: Policy Research & Strategic Planning, Ohio Dept. of Development. Phone 614/466-2116 (DL, 1/09).
2008 2006 2005
111
2007

112

Table A5: Motor Vehicle Industry Establishments and Employment, Ohio and the U.S., 2006
NAICS Estab- Employ- Estab- Employ- Estab- Employ-Code Shorter Industry Title lishments ment Mean lishments ment Mean lishments ment
Total 269,914 4,825,510 17.9 7,601,160 119,917,165 15.8 3.6% 4.0%
Motor Vehicle (MV) Industry* 658 126,396 192.1 8,871 1,088,700 122.7 7.4% 11.6%
Transportation Equipment Industries Include: 613 122,222 199.4 8,083 1,007,939 124.7 7.6% 12.1%
3361 MV Assembly 28 26,844 958.7 370 211,162 570.7 7.6% 12.7% 33611 Automobile & Light Duty Motor Vehicles 19 23,172 1,219.6 275 179,040 651.1 6.9% 12.9% 336111 Automobiles*^ 14 14,169 1,012.0 181 75,225 415.6 7.7% 18.8% 336112 Light Truck & Utility Vehicles*^ 5 9,003 1,800.7 94 103,815 1,104.4 5.3% 8.7% 33612 Heavy Duty Trucks 9 3,672 408.0 95 32,122 338.1 9.5% 11.4%
3362 MV Bodies & Trailers 95 4,936 52.0 2,157 155,649 72.2 4.4% 3.2% 336211 MV Bodies 43 2,462 57.3 820 47,566 58.0 5.2% 5.2% 336212 Truck Trailers 24 1,501 62.5 394 32,260 81.9 6.1% 4.7% 336213 Motor Homes* 4 62 15.5 91 21,533 236.6 4.4% 0.3% 336214 Travel Trailers & Campers* 24 911 38.0 852 54,290 63.7 2.8% 1.7%
3363 MV Parts 490 90,442 184.6 5,556 641,128 115.4 8.8% 14.1% 33631 MV Gas Engines & Engine Parts 54 8,459 156.6 992 76,649 77.3 5.4% 11.0% 336311 Carburetors, Pistons, Rings, & Valves 7 641 91.6 116 10,537 90.8 6.0% 6.1% 336312 Gasoline Engines & Engine Parts 47 7,818 166.3 876 66,112 75.5 5.4% 11.8% 33632 MV Electrical & Electronic Eqpt. 39 9,668 247.9 799 77,631 97.2 4.9% 12.5% 336321 Vehicular Lighting Eqpt.*^ 9 2,182 242.4 102 15,615 153.1 8.8% 14.0% 336322 Other MV Electrical & Electronic Eqpt.* 30 7,486 249.5 697 62,016 89.0 4.3% 12.1% 33633 MV Steering & Suspension Parts 24 4,884 203.5 257 39,390 153.3 9.3% 12.4% 33634 MV Brake Systems 29 6,204 213.9 241 33,782 140.2 12.0% 18.4% 33635 MV Transmission & Power Train Parts 35 13,088 373.9 535 83,756 156.6 6.5% 15.6% 33636 MV Seating & Interior Trim 37 7,315 197.7 421 52,842 125.5 8.8% 13.8% 33637 MV Metal Stamping 152 24,268 159.7 781 110,578 141.6 19.5% 21.9% 33639 Other MV Parts 120 16,556 138.0 1,530 166,500 108.8 7.8% 9.9% 336391 Motor Vehicle Air-Conditioning 5 3,177 635.4 72 17,249 239.6 6.9% 18.4% 336399 All Other MV Parts 115 13,379 116.3 1,458 149,251 102.4 7.9% 9.0%
113
Ohio as a Per-Ohio U.S. centage of the U.S.

Table A5: Motor Vehicle Industry Establishments and Employment, Ohio and the U.S., 2006
NAICS Estab- Employ- Estab- Employ- Estab- Employ-Code Shorter Industry Title lishments ment Mean lishments ment Mean lishments ment
The Related Industries* Include: 45 4,174 92.7 788 80,761 102.5 5.7% 5.2%
32621 Tires 38 3,138 82.6 663 62,478 94.2 5.7% 5.0% 326211 Tire Mfg. (Exc. Retreading) 9 2,747 305.2 138 53,985 391.2 6.5% 5.1% 326212 Tire Retreading 29 391 13.5 525 8,493 16.2 5.5% 4.6%
335911 Storage Batteries* 7 1,036 147.9 125 18,283 146.3 5.6% 5.7%
Notes: * - The Ohio employment figure is (or contains) an estimate; ^ - Employment data from Harris (2006) and PR&SP (2006) are incorporated. Abbreviations used: Eqpt. - equipment; Exc. - except; Mfg. - manufacturing; MV - motor vehicle. It should also be noted that neither the iron foundries dedicated to the motor vehicle industry, particularly Ford's in Brookpark and General Motor's (GM's) in Defiance, nor the diesel engine plants of GM and Daimler AG in Dayton and Byesville, respectively, are included in this table because their NAICS codes (331511 and 333618) exclude them, and there is no ready comparison to the nation as a whole. If such a comparison was possible, then there would have been almost 6,200 more workers in Ohio's motor vehicle industry - and thousands more throughout the nation - in 2006.
Sources: Harris (2006); ODOD (2006); U.S. Bureau of the Census (2008b).
Prepared by: Policy Research & Strategic Planning, Ohio Dept. of Development. Telephone 614/466-2116 (DL, 7/08).
114
Ohio as a Per-Ohio U.S. centage of the U.S.
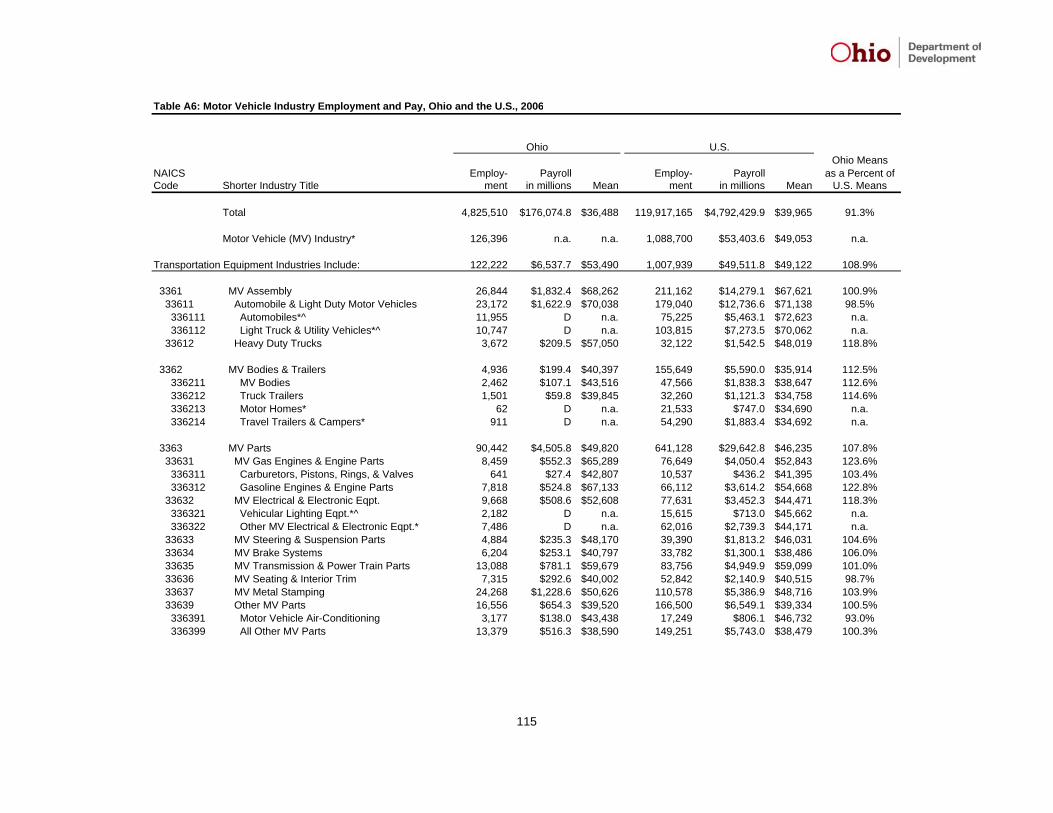
Table A6: Motor Vehicle Industry Employment and Pay, Ohio and the U.S., 2006
Ohio MeansNAICS Employ- Payroll Employ- Payroll as a Percent ofCode Shorter Industry Title ment in millions Mean ment in millions Mean U.S. Means
Total 4,825,510 $176,074.8 $36,488 119,917,165 $4,792,429.9 $39,965 91.3%
Motor Vehicle (MV) Industry* 126,396 n.a. n.a. 1,088,700 $53,403.6 $49,053 n.a.
Transportation Equipment Industries Include: 122,222 $6,537.7 $53,490 1,007,939 $49,511.8 $49,122 108.9%
3361 MV Assembly 26,844 $1,832.4 $68,262 211,162 $14,279.1 $67,621 100.9% 33611 Automobile & Light Duty Motor Vehicles 23,172 $1,622.9 $70,038 179,040 $12,736.6 $71,138 98.5% 336111 Automobiles*^ 11,955 D n.a. 75,225 $5,463.1 $72,623 n.a. 336112 Light Truck & Utility Vehicles*^ 10,747 D n.a. 103,815 $7,273.5 $70,062 n.a. 33612 Heavy Duty Trucks 3,672 $209.5 $57,050 32,122 $1,542.5 $48,019 118.8%
3362 MV Bodies & Trailers 4,936 $199.4 $40,397 155,649 $5,590.0 $35,914 112.5% 336211 MV Bodies 2,462 $107.1 $43,516 47,566 $1,838.3 $38,647 112.6% 336212 Truck Trailers 1,501 $59.8 $39,845 32,260 $1,121.3 $34,758 114.6% 336213 Motor Homes* 62 D n.a. 21,533 $747.0 $34,690 n.a. 336214 Travel Trailers & Campers* 911 D n.a. 54,290 $1,883.4 $34,692 n.a.
3363 MV Parts 90,442 $4,505.8 $49,820 641,128 $29,642.8 $46,235 107.8% 33631 MV Gas Engines & Engine Parts 8,459 $552.3 $65,289 76,649 $4,050.4 $52,843 123.6% 336311 Carburetors, Pistons, Rings, & Valves 641 $27.4 $42,807 10,537 $436.2 $41,395 103.4% 336312 Gasoline Engines & Engine Parts 7,818 $524.8 $67,133 66,112 $3,614.2 $54,668 122.8% 33632 MV Electrical & Electronic Eqpt. 9,668 $508.6 $52,608 77,631 $3,452.3 $44,471 118.3% 336321 Vehicular Lighting Eqpt.*^ 2,182 D n.a. 15,615 $713.0 $45,662 n.a. 336322 Other MV Electrical & Electronic Eqpt.* 7,486 D n.a. 62,016 $2,739.3 $44,171 n.a. 33633 MV Steering & Suspension Parts 4,884 $235.3 $48,170 39,390 $1,813.2 $46,031 104.6% 33634 MV Brake Systems 6,204 $253.1 $40,797 33,782 $1,300.1 $38,486 106.0% 33635 MV Transmission & Power Train Parts 13,088 $781.1 $59,679 83,756 $4,949.9 $59,099 101.0% 33636 MV Seating & Interior Trim 7,315 $292.6 $40,002 52,842 $2,140.9 $40,515 98.7% 33637 MV Metal Stamping 24,268 $1,228.6 $50,626 110,578 $5,386.9 $48,716 103.9% 33639 Other MV Parts 16,556 $654.3 $39,520 166,500 $6,549.1 $39,334 100.5% 336391 Motor Vehicle Air-Conditioning 3,177 $138.0 $43,438 17,249 $806.1 $46,732 93.0% 336399 All Other MV Parts 13,379 $516.3 $38,590 149,251 $5,743.0 $38,479 100.3%
115
Ohio U.S.

Table A6: Motor Vehicle Industry Employment and Pay, Ohio and the U.S., 2006
Ohio MeansNAICS Employ- Payroll Employ- Payroll as a Percent ofCode Shorter Industry Title ment in millions Mean ment in millions Mean U.S. Means
The Related Industries* Include: 4,174 n.a. n.a. 80,761 $3,891.8 $48,189 n.a.
32621 Tires 3,138 $179.5 $57,200 62,478 $3,062.6 $49,019 116.7% 326211 Tire Mfg. (Exc. Retreading) 2,747 $165.2 $60,154 53,985 $2,775.5 $51,412 117.0% 326212 Tire Retreading 391 $14.3 $36,448 8,493 $287.2 $33,811 107.8%
335911 Storage Batteries* 1,036 D n.a. 18,283 $829.2 $45,353 n.a.
Notes: * - The Ohio employment figure is (or contains) an estimate; ^ - Employment data from Harris (2006) and PR&SP (2006) are incorporated. Abbreviations used: Eqpt. - equipment; Exc. - except; Mfg. - manufacturing; MV - motor vehicle. It should also be noted that neither the iron foundries dedicated to the motor vehicle industry, particularly Ford's in Brookpark and General Motor's (GM's) in Defiance, nor the diesel engine plants of GM and Daimler AG in Dayton and Byesville, respectively, are included in this table because their NAICS codes (331511 and 333618) exclude them, and there is no ready comparison to the nation as a whole. If such a comparison was possible, then there would have been almost 6,200 more workers in Ohio's motor vehicle industry - and thousands more throughout the nation - in 2006.
Sources: Harris (2006); ODOD (2006); U.S. Bureau of the Census (2008b).
Prepared by: Policy Research & Strategic Planning, Ohio Dept. of Development. Telephone 614/466-2116 (DL, 7/08).
116
Ohio U.S.

Table A7: Establishments and Employment in Ohio's Motor Vehicle Industry by County, 2006
Estab- Employ- Estab- Employ- Estab- Employ-Area Name lishments ment* Area Name lishments ment* Area Name lishments ment*
Ohio 661 135,899 Greene 2 33 Morrow 5 809Guernsey^ 1 550 Muskingum 1 28
Adams 0 0 Hamilton 16 2,400 Noble 1 333Allen 10 2,682 Hancock 19 4,223 Ottawa 5 77Ashland 2 43 Hardin 2 333 Paulding 3 336Ashtabula 9 350 Harrison 0 0 Perry 0 0Athens 0 0 Henry 4 958 Pickaway 1 143Auglaize 5 673 Highland 3 143 Pike 1 333Belmont 2 333 Hocking 0 0 Portage 4 697Brown 0 0 Holmes 4 134 Preble 2 69Butler 9 1,107 Huron 4 476 Putnam 4 366Carroll 1 3 Jackson 1 333 Richland 15 4,373Champaign 4 1,357 Jefferson 0 0 Ross 3 1,833Clark 17 2,179 Knox 4 621 Sandusky 11 1,446Clermont 6 2,053 Lake 10 302 Scioto 2 333Clinton 4 1,068 Lawrence 0 0 Seneca 6 733Columbiana 8 341 Licking 7 1,428 Shelby 9 4,590Coshocton 0 0 Logan 5 4,037 Stark 22 1,751Crawford 7 803 Lorain 18 3,293 Summit 30 6,586Cuyahoga^ 77 11,035 Lucas 34 11,890 Trumbull 18 10,458Darke 4 333 Madison 6 1,418 Tuscarawas 6 179Defiance^ 7 3,136 Mahoning 11 194 Union 1 5,600Delaware 6 716 Marion 5 523 Van Wert 8 872Erie 6 3,047 Medina 9 640 Vinton 0 0Fairfield 4 145 Meigs 0 0 Warren 8 1,495Fayette 2 171 Mercer 2 333 Washington 2 10Franklin 36 3,670 Miami 8 1,204 Wayne 14 2,620Fulton 8 1,428 Monroe 1 7 Williams 14 1,638Gallia 1 143 Montgomery^ 31 11,826 Wood 15 2,715Geauga 0 0 Morgan 1 143 Wyandot 7 1,217
Notes: * - Employment figures are estimates or incorporate estimates - because their sum is slightly larger than the actual state total, they tend to be a little high; ^ - Figures include Ford's casting plant in Cuyahoga, GM's casting plant in Defiance, Daimler's diesel plant in Muskingum, and GM's and Isuzu's DMAX diesel plant in Montgomery.
Sources: Harris (2006), ODOD (2006), and U.S. Bureau of the Census (2008b).
Prepared by: Policy Research & Strategic Planning, Ohio Dept. of Development. Telephone 800/848-1300, or 614/466-2116. (DL, 7/08).
117

118

Table A8a: Motor Vehicle Industry Employment Trends in Ohio, 1998-2006
NAICSCode Shorter Industry Title 1998 1999 2000 2001 2002 2003 2004 2005 2006 Number Percent
11-92 Total 4,806,046 4,867,368 5,001,980 4,932,943 4,743,151 4,770,283 4,762,205 4,762,618 4,825,510 19,464 0.4%31-33 Manufacturing 994,788 982,853 988,612 936,161 829,456 838,725 814,662 792,783 787,946 -206,842 -20.8%32621-3363 Motor Vehicle (MV) Industry 156,440 155,187 157,766 144,540 122,766 133,279 131,612 126,487 126,396 -30,045 -19.2%
Transportation Equipment Industries Include: 152,201 150,613 153,126 139,578 117,328 128,411 127,358 122,193 122,222 -29,979 -19.7% 3361 MV Assembly 36,728 34,184 34,023 33,797 28,698 27,365 28,584 27,323 26,844 -9,884 -26.9% 33611 Automobile & Light Duty Motor Vehicles*^ 31,149 28,246 28,036 28,580 24,778 24,018 25,230 23,619 23,172 -7,977 -25.6% 336111 Automobiles*^ 15,249 13,846 13,837 13,167 11,978 13,053 13,210 12,261 14,169 -1,080 -7.1% 336112 Light Truck & Utility Vehicles*^ 15,900 14,400 14,199 15,413 12,800 10,965 12,020 11,359 9,003 -6,897 -43.4% 33612 Heavy Duty Trucks*^ 5,579 5,938 5,987 5,217 3,920 3,347 3,354 3,704 3,672 -1,907 -34.2%
3362 MV Bodies & Trailers 4,765 5,719 5,899 4,884 4,171 3,603 4,264 4,552 4,936 171 3.6% 336211 MV Bodies 2,724 3,681 3,452 3,033 2,606 1,988 2,137 2,334 2,462 -262 -9.6% 336212 Truck Trailers 1,046 1,011 1,370 917 716 764 1,222 1,171 1,501 455 43.5% 336213&4 Motor Homes, Travel Trailers, & Campers 995 1,027 1,077 934 849 851 905 1,047 973 -22 -2.2%
3363 MV Parts 110,708 110,710 113,204 100,897 84,459 97,443 94,510 90,318 90,442 -20,266 -18.3% 33631 MV Gas Engines & Engine Parts 9,949 10,053 10,407 9,185 8,462 10,108 9,453 8,621 8,459 -1,490 -15.0% 336311 Carburetors, Pistons, Rings, & Valves* 1,154 1,086 1,149 837 340 514 642 652 641 -513 -44.5% 336312 Gasoline Engines & Engine Parts* 8,795 8,967 9,258 8,348 8,122 9,594 8,811 7,969 7,818 -977 -11.1% 33632 MV Electrical & Electronic Eqpt. 16,791 15,332 15,531 13,456 5,813 9,949 9,051 8,506 9,668 -7,123 -42.4% 336321 Vehicular Lighting Eqpt.* 2,403 2,342 2,267 1,914 708 1,320 1,084 1,032 2,182 -221 -9.2% 336322 Other MV Electrical & Electronic Eqpt.* 14,388 12,990 13,264 11,542 5,105 8,629 7,967 7,474 7,486 -6,902 -48.0% 33633 MV Steering & Suspension Parts 8,174 8,907 9,219 8,282 6,260 6,164 5,642 4,927 4,884 -3,290 -40.2% 33634 MV Brake Systems 8,199 7,344 7,234 6,127 5,554 8,066 7,304 6,361 6,204 -1,995 -24.3% 33635 MV Transmission & Power Train Parts 12,132 12,444 13,259 12,593 11,462 13,404 13,751 13,305 13,088 956 7.9% 33636 MV Seating & Interior Trim 4,703 5,086 5,421 5,372 5,503 7,268 7,177 7,317 7,315 2,612 55.5% 33637 MV Metal Stamping 29,995 30,166 30,607 26,588 25,573 26,378 25,088 24,037 24,268 -5,727 -19.1% 33639 Other MV Parts^ 20,765 21,378 21,526 19,294 15,832 16,106 17,044 17,244 16,556 -4,209 -20.3% 336391 Motor Vehicle Air-Conditioning*^ 3,980 3,521 3,859 3,576 3,193 3,208 3,621 3,103 3,177 -803 -20.2% 336399 All Other MV Parts* 16,785 17,857 17,667 15,718 12,639 12,898 13,423 14,141 13,379 -3,406 -20.3%
The Related Industries Include: 4,239 4,574 4,640 4,962 5,438 4,868 4,254 4,294 4,174 -66 -1.5% 32621 Tires 3,248 3,613 3,683 4,053 4,456 3,718 3,179 3,261 3,138 -110 -3.4% 326211 Tire Mfg. (Exc. Retreading) 2,913 3,274 3,314 3,588 3,996 3,182 2,722 2,746 2,747 -166 -5.7% 326212 Tire Retreading 335 339 369 465 460 536 457 515 391 56 16.7% 335911 Storage Batteries* 991 961 957 909 982 1,150 1,075 1,033 1,036 45 4.5%
Notes: * - Employment figures may be (or contain) estimates. ^ - Employment information from Harris (1998-2006) and/or OSR (2004, 2006) may be incorporated. Abbreviations used: Eqpt. - equipment; Exc. - except; Mfg. - manufacturing; MV - motor vehicle.
Sources: Harris (1998-2006); ODOD (2004, 2006, 2008), U.S. Bureau of the Census (2000-2002, 2003b, 2004, 2005b, 2006a, 2006b, 2007b, 2008b).
Prepared by: Policy Research & Strategic Planning, Ohio Dept. of Development. Telephone 614/466-2116 (DL, 8/08).
119
Changes:1998-2006

Table A8b: Motor Vehicle Industry Employment Trends in the U.S., 1998-2006
NAICSCode Shorter Industry Title 1998 1999 2000 2001 2002 2003 2004 2005 2006 Number Percent
11-92 Total 108,117,731 110,705,661 114,064,976 115,061,184 112,400,654 113,398,043 115,074,924 116,317,003 119,917,165 11,799,434 10.9%31-33 Manufacturing 16,945,834 16,659,930 16,473,994 15,950,424 14,393,609 14,132,020 13,821,976 13,667,337 13,631,683 -3,314,151 -19.6%32621-3363 Motor Vehicle (MV) Industry 1,261,160 1,265,715 1,295,227 1,183,040 1,075,597 1,116,495 1,131,767 1,112,879 1,088,700 -172,460 -13.7%
Transportation Equipment Industries Include: 1,165,631 1,170,050 1,198,065 1,087,564 988,398 1,032,461 1,049,744 1,033,204 1,007,939 -157,692 -13.5% 3361 MV Assembly 235,483 233,917 235,413 215,132 216,886 211,454 216,793 214,536 211,162 -24,321 -10.3% 33611 Automobile & Light Duty Motor Vehicles 204,054 199,924 199,974 187,713 196,197 183,401 187,216 182,188 179,040 -25,014 -12.3% 336111 Automobiles 123,172 105,855 101,962 97,321 112,453 74,821 79,087 74,410 75,225 -47,947 -38.9% 336112 Light Truck & Utility Vehicles 80,882 94,069 98,012 90,392 83,744 108,580 108,129 107,778 103,815 22,933 28.4% 33612 Heavy Duty Trucks 31,429 33,993 35,439 27,419 20,689 28,053 29,577 32,348 32,122 693 2.2%
3362 MV Bodies & Trailers 128,687 141,610 150,461 132,765 114,410 132,617 143,888 147,634 155,649 26,962 21.0% 336211 MV Bodies 44,387 48,322 51,428 48,089 39,280 43,704 44,969 46,204 47,566 3,179 7.2% 336212 Truck Trailers 32,656 35,975 38,396 28,261 22,008 23,716 25,698 29,000 32,260 -396 -1.2% 336213&4 Motor Homes, Travel Trailers, & Campers 51,644 57,313 60,637 56,415 53,122 65,197 73,221 72,430 75,823 24,179 46.8%
3363 MV Parts 801,461 794,523 812,191 739,667 657,102 688,390 689,063 671,034 641,128 -160,333 -20.0% 33631 MV Gas Engines & Engine Parts 104,197 103,848 105,256 98,182 80,507 92,286 91,805 80,904 76,649 -27,548 -26.4% 336311 Carburetors, Pistons, Rings, & Valves 18,579 18,689 20,242 18,345 14,511 13,134 12,649 10,948 10,537 -8,042 -43.3% 336312 Gasoline Engines & Engine Parts 85,618 85,159 85,014 79,837 65,996 79,152 79,156 69,956 66,112 -19,506 -22.8% 33632 MV Electrical & Electronic Eqpt. 118,129 111,989 113,031 104,769 83,434 89,283 87,042 85,313 77,631 -40,498 -34.3% 336321 Vehicular Lighting Eqpt. 16,343 16,780 16,501 16,126 13,752 15,637 14,742 14,962 15,615 -728 -4.5% 336322 Other MV Electrical & Electronic Eqpt. 101,786 95,209 96,530 88,643 69,682 73,646 72,300 70,351 62,016 -39,770 -39.1% 33633 MV Steering & Suspension Parts 48,499 47,467 50,001 44,251 36,109 39,098 37,272 37,810 39,390 -9,109 -18.8% 33634 MV Brake Systems 41,357 43,812 43,115 39,484 36,478 41,419 40,905 39,373 33,782 -7,575 -18.3% 33635 MV Transmission & Power Train Parts 115,906 113,184 118,268 105,316 92,395 93,687 94,626 90,795 83,756 -32,150 -27.7% 33636 MV Seating & Interior Trim 46,977 50,847 53,783 50,433 47,931 54,858 56,891 57,390 52,842 5,865 12.5% 33637 MV Metal Stamping 126,060 127,248 129,416 115,931 111,908 115,517 114,664 111,168 110,578 -15,482 -12.3% 33639 Other MV Parts 200,336 196,128 199,321 181,301 168,340 162,242 165,858 168,281 166,500 -33,836 -16.9% 336391 Motor Vehicle Air-Conditioning 22,168 22,210 21,894 19,406 12,985 15,431 17,913 16,750 17,249 -4,919 -22.2% 336399 All Other MV Parts 178,168 173,918 177,427 161,895 155,355 146,811 147,945 151,531 149,251 -28,917 -16.2%
The Related Industries Include: 95,529 95,665 97,162 95,476 87,199 84,034 82,023 79,675 80,761 -14,768 -15.5% 32621 Tires 72,784 72,608 74,325 72,481 68,862 66,587 64,007 62,621 62,478 -10,306 -14.2% 326211 Tire Mfg. (Exc. Retreading) 65,298 64,810 66,133 63,931 60,905 58,188 55,064 54,323 53,985 -11,313 -17.3% 326212 Tire Retreading 7,486 7,798 8,192 8,550 7,957 8,399 8,943 8,298 8,493 1,007 13.5% 335911 Storage Batteries 22,745 23,057 22,837 22,995 18,337 17,447 18,016 17,054 18,283 -4,462 -19.6%
Note: Abbreviations used: Eqpt. - equipment; Exc. - except; Mfg. - manufacturing; MV - motor vehicle.
Sources: U.S. Bureau of the Census (2000-2002, 2003b, 2004, 2005b, 2006a, 2006b, 2007b, 2008b).
Prepared by: Policy Research & Strategic Planning, Ohio Dept. of Development. Telephone 614/466-2116 (DL, 8/08).
120
Changes:1998-2006

Table A9: Total and Motor Vehicle Industry Gross Domestic Product for Ohio and the U.S., 1997-2006 (in billions of chained dollars, except percentages, and standardized on 2000)
Percent Percent Percent Percent Ohio::U.S.Dollar Change As Dollar Change As Dollar Change Dollar Change NAICS Concen-Value from Percent Value from Percent Value from Value from 3361- tration
Year (billions) Prior Yr. of Total (billions) Prior Yr. of Total (billions) Prior Yr. (billions) Prior Yr. 3363 Total Ratio
1997 $14.56 4.2% $105.34 1.2% $350.60 $8,620.96 13.8% 4.1% 3.401998 $16.98 16.6% 4.7% $111.77 6.1% 1.2% $362.72 3.5% $9,004.67 4.5% 15.2% 4.0% 3.771999 $15.72 -7.4% 4.3% $114.61 2.5% 1.2% $368.48 1.6% $9,404.25 4.4% 13.7% 3.9% 3.502000 $16.79 6.8% 4.5% $118.11 3.1% 1.2% $372.01 1.0% $9,749.10 3.7% 14.2% 3.8% 3.722001 $14.06 -16.3% 3.8% $104.60 -11.4% 1.1% $365.74 -1.7% $9,836.58 0.9% 13.4% 3.7% 3.612002 $17.41 23.9% 4.7% $127.51 21.9% 1.3% $373.46 2.1% $9,981.85 1.5% 13.7% 3.7% 3.652003 $16.93 -2.8% 4.5% $136.97 7.4% 1.3% $378.72 1.4% $10,225.68 2.4% 12.4% 3.7% 3.342004 $17.63 4.2% 4.6% $125.43 -8.4% 1.2% $387.44 2.3% $10,580.22 3.5% 14.1% 3.7% 3.842005 $17.61 -0.1% 4.5% $129.78 3.5% 1.2% $389.96 0.7% $10,899.70 3.0% 13.6% 3.6% 3.792006 $19.28 9.4% 5.0% $143.98 10.9% 1.3% $388.92 -0.3% $11,240.11 3.1% 13.4% 3.5% 3.87
Net Changes, 1997-2006
Numeric $4.72 0.8% $38.64 0.1% $38.32 $2,619.15 -0.4% -0.6% 0.47Percent 32.4% 36.7% 10.9% 30.4%
Notes: State GDP is analogous to national GDP, but not identical with it due to minor technical differences. Real GDP adjusts for inflation, allowing comparisons of the volume of goods produced from year to year.
Source: U.S. Bureau of Economic Analysis (2008a).
Prepared by: Policy Research & Strategic Planning, Ohio Dept. of Development. Telephone 614/466-2116 (DL, 8/08).
Total GDP
121
Motor Vehicles, Bodies, Trailers & Parts(NAICS 3361-3363) GDP
Ohio U.S. Ohio as a Per-cent of the U.S.
Ohio U.S.

Table A10: Trends in Value-Added by Group for Ohio and the U.S., 1997-2006 (in millions of dollars)
3362: 3362: 3361: 3362:3361: Bodies & 3363: 3361: Bodies & 3363: As- Bodies & 3363: Sum-
Year Assembly Trailers* Parts Summary Assembly Trailers Parts Summary sembly Trailers* Parts mary
1997 $10,760.0 $281.9 $11,275.6 $22,317.5 $72,575.0 $7,693.7 $73,797.9 $154,066.6 14.8% 3.7% 15.3% 14.5%1998 $13,493.2 $331.0 $10,977.3 $24,801.4 $66,288.7 $8,474.4 $77,370.5 $152,133.6 20.4% 3.9% 14.2% 16.3%1999 $13,344.9 $331.2 $11,665.1 $25,341.2 $77,424.7 $10,158.9 $85,426.3 $173,009.9 17.2% 3.3% 13.7% 14.6%2000 $12,092.3 $339.9 $11,197.9 $23,630.2 $61,627.7 $9,871.3 $84,481.3 $155,980.3 19.6% 3.4% 13.3% 15.1%2001 $10,408.9 $273.1 $9,362.9 $20,044.9 $54,172.8 $8,417.3 $74,532.3 $137,122.4 19.2% 3.2% 12.6% 14.6%2002 $12,686.7 $244.0 $11,753.1 $24,683.9 $72,157.1 $8,741.7 $86,428.2 $167,327.0 17.6% 2.8% 13.6% 14.8%2003 $9,606.0 $272.5 $12,292.3 $22,170.8 $78,239.9 $9,475.8 $84,401.2 $172,117.0 12.3% 2.9% 14.6% 12.9%2004 $10,541.7 $703.1 $13,504.4 $24,749.2 $71,100.6 $11,186.5 $83,006.0 $165,293.2 14.8% 6.3% 16.3% 15.0%2005 $10,800.6 $945.8 $12,361.1 $24,107.5 $67,605.8 $12,292.5 $81,289.8 $161,188.0 16.0% 7.7% 15.2% 15.0%2006 $10,908.5 $1,122.4 $11,298.8 $23,329.8 $66,035.3 $13,482.8 $80,497.4 $160,015.6 16.5% 8.3% 14.0% 14.6%
Average percentages for the 10-year period: 16.7% 4.9% 14.3% 14.7%
Note: * - Data for this group are unreliable, as indicated by the relatively large standard errors of the estimates (not shown).
Sources: U.S. Bureau of the Census (2003a, 2005a, 2005e, 2007a, 2008a).
Prepared by: Policy Research & Strategic Planning, Ohio Dept. of Development. Telephone 800/848-1300 or 614/466-2116 (DL, 7/08).
Ohio U.S. Ohio as a Percentage of the U.S.
122

Table A11: Light Vehicle Production in Ohio and the U.S., 1987-2007
Cars % Cars %Light Light of Light Light Light of Light Light Light
Year Cars Trucks Vehicles Vehicles Cars Trucks Vehicles Vehicles Cars Trucks Vehicles
1987 923,710 * 802,660 1,726,370 53.5% 7,099,829 3,528,206 ^ 10,628,035 66.8% 13.0% 22.7% 16.2%1988 874,064 * 877,939 1,752,003 49.9% 7,137,397 3,809,960 ^ 10,947,357 65.2% 12.2% 23.0% 16.0%1989 845,942 * 822,295 1,668,237 50.7% 6,824,639 3,781,396 10,606,035 64.3% 12.4% 21.7% 15.7%1990 843,476 * 631,178 1,474,654 57.2% 6,077,885 3,463,527 9,541,412 63.7% 13.9% 18.2% 15.5%1991 966,663 * 677,811 * 1,644,474 58.8% 5,439,864 3,176,719 8,616,583 63.1% 17.8% 21.3% 19.1%1992 914,951 * 564,887 * 1,479,838 61.8% 5,666,891 3,808,159 9,475,050 59.8% 16.1% 14.8% 15.6%1993 1,005,870 795,541 1,801,411 55.8% 5,982,120 4,608,017 10,590,137 56.5% 16.8% 17.3% 17.0%1994 959,856 812,660 1,772,516 54.2% 6,601,223 5,332,048 11,933,271 55.3% 14.5% 15.2% 14.9%1995 988,869 907,288 1,896,157 52.2% 6,339,892 5,306,197 11,646,089 54.4% 15.6% 17.1% 16.3%1996 1,084,599 855,430 1,940,029 55.9% 6,082,835 5,749,418 11,832,253 51.4% 17.8% 14.9% 16.4%1997 1,105,007 893,447 1,998,454 55.3% 5,933,921 6,196,565 12,130,486 48.9% 18.6% 14.4% 16.5%1998 1,016,129 840,416 1,856,545 54.7% 5,554,373 6,448,290 12,002,663 46.3% 18.3% 13.0% 15.5%1999 1,055,762 918,210 1,973,972 53.5% 5,637,949 7,387,029 13,024,978 43.3% 18.7% 12.4% 15.2%2000 1,022,393 841,636 1,864,029 54.8% 5,542,217 7,228,497 12,770,714 43.4% 18.4% 11.6% 14.6%2001 1,016,218 722,869 1,739,087 58.4% 4,879,119 6,545,570 11,424,689 42.7% 20.8% 11.0% 15.2%2002 989,509 847,787 1,837,296 53.9% 5,018,777 7,260,805 12,279,582 40.9% 19.7% 11.7% 15.0%2003 927,925 956,952 1,884,877 49.2% 4,510,469 7,576,559 12,087,028 37.3% 20.6% 12.6% 15.6%2004 797,009 943,622 1,740,631 45.8% 4,229,625 7,730,729 11,960,354 35.4% 18.8% 12.2% 14.6%2005 882,222 912,367 1,794,589 49.2% 4,321,272 7,625,381 11,946,653 36.2% 20.4% 12.0% 15.0%2006 884,734 785,007 1,669,741 53.0% 4,366,996 6,893,281 11,260,277 38.8% 20.3% 11.4% 14.8%2007 870,008 878,327 1,748,335 49.8% 3,924,268 6,828,042 10,752,310 36.5% 22.2% 12.9% 16.3%
Notes: * - Model year production, which does not coincide with the calendar year. Research for a prior report showed that combining and comparing model and calendar year data introduces only minimal distortions. Therefore, comparisons of Ohio with the U.S. for these years are useful, but not entirely valid. ^ - Factory shipments of class 1 & 2 trucks - almost the same as production.
Source: Ward's (1988-2008).
Prepared by: Policy Research & Strategic Planning, Ohio Dept. of Development (DL, 8/08).
123
Ohio U.S. Ohio as Percent of U.S.

Table A12: Trends in Capital Expenditures by Group for Ohio and the U.S., 1997-2006 (in millions of dollars)
3362: 3362: 3361: 3362:3361: Bodies & 3363: 3361: Bodies & 3363: As- Bodies & 3363: Sum-
Year Assembly Trailers* Parts Summary Assembly Trailers Parts Summary sembly Trailers* Parts mary
1997 $454.1 $26.6 $1,888.5 $2,369.3 $5,406.6 $441.1 $9,489.4 $15,337.1 8.4% 6.0% 19.9% 15.4%1998 $364.1 $12.6 $1,669.7 $2,046.4 $5,383.8 $377.8 $9,830.8 $15,592.3 6.8% 3.3% 17.0% 13.1%1999 $745.7 $16.6 $1,323.6 $2,086.0 $4,773.5 $463.7 $9,464.3 $14,701.4 15.6% 3.6% 14.0% 14.2%2000 $840.2 $13.6 $1,118.0 $1,971.8 $4,777.8 $588.1 $8,863.0 $14,229.0 17.6% 2.3% 12.6% 13.9%2001 $462.6 $6.7 $1,099.9 $1,569.2 $4,461.3 $503.3 $8,390.4 $13,355.0 10.4% 1.3% 13.1% 11.8%2002 $318.6 $8.3 $1,366.9 $1,693.8 $4,802.2 $328.0 $7,534.3 $12,664.5 6.6% 2.5% 18.1% 13.4%2003 $285.3 $4.6 $932.7 $1,222.6 $5,186.7 $386.8 $7,377.3 $12,950.7 5.5% 1.2% 12.6% 9.4%2004 $421.3 $14.6 $1,123.6 $1,559.5 $4,686.8 $441.5 $6,259.2 $11,387.5 9.0% 3.3% 18.0% 13.7%2005 $453.8 $22.7 $803.2 $1,279.7 $4,283.1 $391.2 $6,759.4 $11,433.6 10.6% 5.8% 11.9% 11.2%2006 $570.5 $11.1 $1,543.9 $2,125.4 $4,042.8 $393.5 $6,884.3 $11,320.6 14.1% 2.8% 22.4% 18.8%
Average percentages for the 10-year period: 10.3% 3.2% 15.9% 13.5%
Note: * - Data for this group are unreliable, as indicated by the relatively large standard errors of the estimates (not shown).
Sources: U.S. Bureau of the Census (2003a, 2005a, 2005e, 2007a, 2008a).
Prepared by: Policy Research & Strategic Planning, Ohio Dept. of Development. Telephone 800/848-1300 or 614/466-2116 (DL, 7/08).
124
Ohio as a Percentage of the U.S.U.S.Ohio

Table A13a: Motor Vehicle Industry Establishment Trends in Ohio, 1998-2006
NAICSCode Shorter Industry Title 1998 1999 2000 2001 2002 2003 2004 2005 2006 Number Percent
11-92 Total 270,343 270,766 270,509 269,944 271,181 270,255 271,733 270,968 269,914 -429 -0.2%31-33 Manufacturing 18,052 17,930 17,704 17,597 17,189 17,082 16,887 16,617 16,401 -1,651 -9.1%32621-3363 Motor Vehicle (MV) Industry 641 630 627 612 606 648 653 645 658 17 2.7%
Transportation Equipment Industries Include: 581 567 572 555 558 600 607 602 613 32 5.5% 3361 MV Assembly 23 23 22 23 24 21 27 29 28 5 21.7% 33611 Automobile & Light Duty Motor Vehicles 14 15 15 16 16 14 18 19 19 5 35.7% 336111 Automobiles 10 10 11 12 13 10 14 14 14 4 40.0% 336112 Light Truck & Utility Vehicles 4 5 4 4 3 4 4 5 5 1 25.0% 33612 Heavy Duty Trucks 9 8 7 7 8 7 9 10 9 0 0.0%
3362 MV Bodies & Trailers 74 69 71 70 72 80 82 80 95 21 28.4% 336211 MV Bodies 38 37 37 38 38 42 38 35 43 5 13.2% 336212 Truck Trailers 16 14 16 13 14 16 20 18 24 8 50.0% 336213&4 Motor Homes, Travel Trailers, & Campers 20 18 18 19 20 22 24 27 28 8 40.0%
3363 MV Parts 484 475 479 462 462 499 498 493 490 6 1.2% 33631 MV Gas Engines & Engine Parts 49 48 51 49 46 49 55 49 54 5 10.2% 336311 Carburetors, Pistons, Rings, & Valves 11 11 11 12 6 6 7 7 7 -4 -36.4% 336312 Gasoline Engines & Engine Parts 38 37 40 37 40 43 48 42 47 9 23.7% 33632 MV Electrical & Electronic Eqpt. 57 54 55 53 50 44 41 38 39 -18 -31.6% 336321 Vehicular Lighting Eqpt. 9 10 11 10 11 9 8 8 9 0 0.0% 336322 Other MV Electrical & Electronic Eqpt. 48 44 44 43 39 35 33 30 30 -18 -37.5% 33633 MV Steering & Suspension Parts 19 21 21 21 24 23 22 23 24 5 26.3% 33634 MV Brake Systems 26 24 25 21 26 33 33 29 29 3 11.5% 33635 MV Transmission & Power Train Parts 37 36 33 30 34 40 38 35 35 -2 -5.4% 33636 MV Seating & Interior Trim 26 25 25 26 24 31 32 34 37 11 42.3% 33637 MV Metal Stamping 146 143 140 135 130 154 156 159 152 6 4.1% 33639 Other MV Parts 124 124 129 127 128 125 121 126 120 -4 -3.2% 336391 Motor Vehicle Air-Conditioning 6 6 6 6 7 6 6 5 5 -1 -16.7% 336399 All Other MV Parts 118 118 123 121 121 119 115 121 115 -3 -2.5%
The Related Industries Include: 60 63 55 57 48 48 46 43 45 -15 -25.0% 32621 Tires 54 57 50 51 41 42 40 37 38 -16 -29.6% 326211 Tire Mfg. (Exc. Retreading) 12 12 10 11 10 11 12 10 9 -3 -25.0% 326212 Tire Retreading 42 45 40 40 31 31 28 27 29 -13 -31.0% 335911 Storage Batteries 6 6 5 6 7 6 6 6 7 1 16.7%
Abbreviations used: Eqpt. - equipment; Exc. - except; Mfg. - manufacturing; MV - motor vehicle.
Source: Harris (2004, 2006), ODOD (2004, 2006), U.S. Bureau of the Census (2000-2002, 2003b, 2004, 2005b, 2006a, 2006b, 2007b, 2008b).
Prepared by: Policy Research & Strategic Planning, Ohio Dept. of Development. Telephone 614/466-2116 (DL, 8/08).
1998-2006Changes:
125

Table A13b: Motor Vehicle Industry Establishment Trends in the U.S., 1998-2006
NAICSCode Shorter Industry Title 1998 1999 2000 2001 2002 2003 2004 2005 2006 Number Percent
11-92 Total 6,941,822 7,008,444 7,070,048 7,095,302 7,200,770 7,254,745 7,387,724 7,499,702 7,601,160 659,338 9.5%31-33 Manufacturing 366,249 360,244 354,498 352,619 344,341 341,849 339,083 333,460 331,062 -35,187 -9.6%32621-3363 Motor Vehicle (MV) Industry 9,464 9,341 9,118 8,974 8,668 9,012 9,061 8,945 8,871 -593 -6.3%
Transportation Equipment Industries Include: 8,458 8,337 8,112 7,998 7,833 8,160 8,240 8,168 8,083 -375 -4.4% 3361 MV Assembly 411 418 410 410 395 367 377 380 370 -41 -10.0% 33611 Automobile & Light Duty Motor Vehicles 324 329 324 321 308 273 275 281 275 -49 -15.1% 336111 Automobiles 216 218 217 221 207 172 183 180 181 -35 -16.2% 336112 Light Truck & Utility Vehicles 108 111 107 100 101 101 92 101 94 -14 -13.0% 33612 Heavy Duty Trucks 87 89 86 89 87 94 102 99 95 8 9.2%
3362 MV Bodies & Trailers 2,116 2,103 2,081 2,062 2,001 2,142 2,195 2,164 2,157 41 1.9% 336211 MV Bodies 814 832 822 811 753 837 826 814 820 6 0.7% 336212 Truck Trailers 410 392 394 393 388 394 408 391 394 -16 -3.9% 336213&4 Motor Homes, Travel Trailers, & Campers 892 879 865 858 860 911 961 959 943 51 5.7%
3363 MV Parts 5,931 5,816 5,621 5,526 5,437 5,651 5,668 5,624 5,556 -375 -6.3% 33631 MV Gas Engines & Engine Parts 1,048 1,003 982 984 971 1,042 1,021 1,005 992 -56 -5.3% 336311 Carburetors, Pistons, Rings, & Valves 148 145 135 138 127 128 127 115 116 -32 -21.6% 336312 Gasoline Engines & Engine Parts 900 858 847 846 844 914 894 890 876 -24 -2.7% 33632 MV Electrical & Electronic Eqpt. 1,135 1,109 1,072 1,034 922 880 854 828 799 -336 -29.6% 336321 Vehicular Lighting Eqpt. 104 111 109 100 100 99 103 102 102 -2 -1.9% 336322 Other MV Electrical & Electronic Eqpt. 1,031 998 963 934 822 781 751 726 697 -334 -32.4% 33633 MV Steering & Suspension Parts 211 212 207 204 221 233 229 246 257 46 21.8% 33634 MV Brake Systems 282 278 266 260 253 262 262 251 241 -41 -14.5% 33635 MV Transmission & Power Train Parts 550 532 509 507 513 536 534 533 535 -15 -2.7% 33636 MV Seating & Interior Trim 366 350 335 338 332 392 407 399 421 55 15.0% 33637 MV Metal Stamping 789 784 754 740 719 790 788 792 781 -8 -1.0% 33639 Other MV Parts 1,550 1,548 1,496 1,459 1,506 1,516 1,573 1,570 1,530 -20 -1.3% 336391 Motor Vehicle Air-Conditioning 62 70 69 69 72 87 86 80 72 10 16.1% 336399 All Other MV Parts 1,488 1,478 1,427 1,390 1,434 1,429 1,487 1,490 1,458 -30 -2.0%
The Related Industries Include: 1,006 1,004 1,006 976 835 852 821 777 788 -218 -21.7% 32621 Tires 874 867 868 838 707 722 692 656 663 -211 -24.1% 326211 Tire Mfg. (Exc. Retreading) 160 162 160 161 149 153 145 138 138 -22 -13.8% 326212 Tire Retreading 714 705 708 677 558 569 547 518 525 -189 -26.5% 335911 Storage Batteries 132 137 138 138 128 130 129 121 125 -7 -5.3%
Note: Abbreviations used: Eqpt. - equipment; Exc. - except; Mfg. - manufacturing; MV - motor vehicle.
Source: U.S. Bureau of the Census (2000-2002, 2003b, 2004, 2005b, 2006a, 2006b, 2007b, 2008b).
Prepared by: Policy Research & Strategic Planning, Ohio Dept. of Development. Telephone 614/466-2116 (DL, 8/08).
126
Changes:1998-2006

Table A14: Exports as a Percentage of Imports - Motor Vehicles, Engines and Parts by Area and Type, 1997-2007
Activity 1997 1998 1999 2000 2001 2002 2003 2004 2005 2006 2007
Total 52.5% 48.7% 42.1% 41.0% 39.7% 38.7% 38.4% 39.1% 41.1% 41.7% 46.7% Passenger cars, new & used 23.2% 20.4% 17.1% 15.3% 16.7% 18.0% 19.3% 20.1% 24.7% 25.1% 32.7% Trucks, buses & special purpose vehicles 65.7% 66.4% 44.1% 50.3% 39.3% 43.1% 51.7% 56.9% 59.5% 61.9% 73.1% Engines & engine parts 58.1% 54.9% 61.6% 68.5% 71.7% 67.7% 63.3% 59.5% 58.6% 62.1% 65.1% Other parts & accessories 98.6% 93.9% 85.2% 83.0% 80.2% 72.0% 63.7% 62.7% 58.2% 59.3% 57.7%
Canada: 80.4% 78.7% 72.0% 71.6% 70.2% 74.6% 76.2% 73.9% 75.7% 80.8% 86.9% Passenger cars, new & used 36.9% 31.5% 27.3% 27.2% 28.3% 32.8% 35.2% 29.4% 33.5% 35.9% 41.2% Trucks, buses & special purpose vehicles 57.6% 67.5% 52.0% 53.7% 48.2% 57.9% 71.0% 80.4% 78.3% 93.5% 110.9% Engines & engine parts 138.1% 129.5% 136.1% 138.1% 152.6% 146.4% 141.5% 133.9% 147.1% 172.9% 158.9% Other parts & accessories 184.6% 184.9% 186.6% 177.6% 167.0% 161.3% 145.7% 150.3% 143.3% 146.0% 152.2%
Other areas: 37.3% 32.8% 25.5% 26.2% 26.4% 23.9% 23.0% 24.4% 26.6% 27.0% 32.1% Passenger cars, new & used 15.9% 14.6% 11.6% 10.0% 12.1% 12.5% 13.6% 16.3% 21.1% 21.1% 29.5% Trucks, buses & special purpose vehicles 81.5% 64.5% 30.0% 44.1% 27.3% 23.4% 27.3% 29.1% 34.6% 28.1% 37.3% Engines & engine parts 32.7% 27.9% 31.9% 41.8% 44.7% 42.8% 38.7% 36.2% 33.6% 34.5% 40.2% Other parts & accessories 65.6% 59.7% 47.4% 50.0% 50.4% 41.6% 35.7% 34.3% 31.8% 34.4% 33.1%
Sources: U.S. Bureau of Economic Analysis (2008b).
Prepared by: Policy Research & Strategic Planning, Ohio Dept. of Development. Phone 614/466-2116 (DL, 8/08).
127

128

Table A15a: U.S. Sales of Imported and Domestic Light Vehicles, 1988-2007
U.S. Japanese All U.S. Japanese All U.S. Japanese All Year & type Brand Brand Others Total Brand Brand Others Total Brand Brand Others Total
1988: Cars 6,909,660 592,024 38,239 7,539,923 393,412 1,813,980 796,300 3,003,692 7,303,072 2,406,004 834,539 10,543,615 Trucks 4,397,119 116,717 3,006 4,516,842 72,353 634,778 20,780 727,911 4,469,472 751,495 23,786 5,244,753 Total 11,306,779 708,741 41,245 12,056,765 465,765 2,448,758 817,080 3,731,603 11,772,544 3,157,499 858,325 15,788,368
1989: Cars 6,294,220 778,680 5,180 7,078,080 340,986 1,701,322 657,617 2,699,925 6,635,206 2,480,002 662,797 9,778,005 Trucks 4,276,907 131,347 2,037 4,410,291 52,762 582,902 21,096 656,760 4,329,669 714,249 23,133 5,067,051 Total 10,571,127 910,027 7,217 11,488,371 393,748 2,284,224 678,713 3,356,685 10,964,875 3,194,251 685,930 14,845,056
1990: Cars 5,816,642 1,060,585 19,661 6,896,888 296,778 1,533,339 573,204 2,403,321 6,113,420 2,593,924 592,865 9,300,209 Trucks 4,070,242 162,660 1,640 4,234,542 19,150 583,717 23,498 626,365 4,089,392 746,377 25,138 4,860,907 Total 9,886,884 1,223,245 21,301 11,131,430 315,928 2,117,056 596,702 3,029,686 10,202,812 3,340,301 618,003 14,161,116
1991: Cars 4,993,456 1,124,401 18,930 6,136,787 254,572 1,348,123 435,204 2,037,899 5,248,028 2,472,524 454,134 8,174,686 Trucks 3,625,545 188,420 1,329 3,815,294 9,970 522,736 16,597 549,303 3,635,515 711,156 17,926 4,364,597 Total 8,619,001 1,312,821 20,259 9,952,081 264,542 1,870,859 451,801 2,587,202 8,883,543 3,183,680 472,060 12,539,283
1992: Cars 5,098,605 1,160,967 26,344 6,285,916 202,476 1,313,806 410,915 1,927,197 5,301,081 2,474,773 437,259 8,213,113 Trucks 4,204,150 277,127 446 4,481,723 12,822 402,794 6,923 422,539 4,216,972 679,921 7,369 4,904,262 Total 9,302,755 1,438,094 26,790 10,767,639 215,298 1,716,600 417,838 2,349,736 9,518,053 3,154,694 444,628 13,117,375
1993: Cars 5,454,470 1,264,601 22,596 6,741,667 166,500 1,216,952 392,740 1,776,192 5,620,970 2,481,553 415,336 8,517,859 Trucks 4,907,793 379,373 5 5,287,171 10,112 373,179 10,544 393,835 4,917,905 752,552 10,549 5,681,006 Total 10,362,263 1,643,974 22,601 12,028,838 176,612 1,590,131 403,284 2,170,027 10,538,875 3,234,105 425,885 14,198,865
1994: Cars 5,734,817 1,447,223 73,263 7,255,303 73,720 1,209,002 452,492 1,735,214 5,808,537 2,656,225 525,755 8,990,517 Trucks 5,521,991 473,573 0 5,995,564 9,028 399,545 16,720 425,293 5,531,019 873,118 16,720 6,420,857 Total 11,256,808 1,920,796 73,263 13,250,867 82,748 1,608,547 469,212 2,160,507 11,339,556 3,529,343 542,475 15,411,374
1995: Cars 5,433,959 1,594,725 100,023 7,128,707 74,065 967,906 464,286 1,506,257 5,508,024 2,562,631 564,309 8,634,964 Trucks 5,622,090 441,007 0 6,063,097 7,840 380,923 29,501 418,264 5,629,930 821,930 29,501 6,481,361 Total 11,056,049 2,035,732 100,023 13,191,804 81,905 1,348,829 493,787 1,924,521 11,137,954 3,384,561 593,810 15,116,325
1996: Cars 5,283,829 1,840,015 129,738 7,253,582 43,727 722,403 506,042 1,272,172 5,327,556 2,562,418 635,780 8,525,754 Trucks 6,004,180 459,689 10,165 6,474,034 6,525 414,715 34,085 455,325 6,010,705 874,404 44,250 6,929,359 Total 11,288,009 2,299,704 139,903 13,727,616 50,252 1,137,118 540,127 1,727,497 11,338,261 3,436,822 680,030 15,455,113
1997*: Cars 4,947,704 1,827,257 141,808 6,916,769 106,608 737,506 511,191 1,355,305 5,054,312 2,564,763 652,999 8,272,074 Trucks 5,778,757 473,971 14,712 6,267,440 2,949 533,953 45,305 582,207 5,781,706 1,007,924 60,017 6,849,647 Total 10,726,461 2,301,228 156,520 13,184,209 109,557 1,271,459 556,496 1,937,512 10,836,018 3,572,687 713,016 15,121,721
1998*: Cars 4,671,055 1,891,048 199,278 6,761,381 83,370 706,939 587,789 1,378,098 4,754,425 2,597,987 787,067 8,139,479 Trucks 6,181,040 518,411 43,804 6,743,255 3,207 603,078 51,746 658,031 6,184,247 1,121,489 95,550 7,401,286 Total 10,852,095 2,409,459 243,082 13,504,636 86,577 1,310,017 639,535 2,036,129 10,938,672 3,719,476 882,617 15,540,765
129
Domestic Built Imports Totals

Table A15a: U.S. Sales of Imported and Domestic Light Vehicles, 1988-2007
U.S. Japanese All U.S. Japanese All U.S. Japanese All Year & type Brand Brand Others Total Brand Brand Others Total Brand Brand Others Total
1999*: Cars 4,863,463 1,870,805 245,089 6,979,357 206,340 783,597 728,990 1,718,927 5,069,803 2,654,402 974,079 8,698,284 Trucks 6,567,196 715,372 137,463 7,420,031 4,109 685,956 85,158 775,223 6,571,305 1,401,328 222,621 8,195,254 Total 11,430,659 2,586,177 382,552 14,399,388 210,449 1,469,553 814,148 2,494,150 11,641,108 4,055,730 1,196,700 16,893,538
2000*: Cars 4,651,346 1,922,657 256,502 6,830,505 216,786 885,094 914,240 2,016,120 4,868,132 2,807,751 1,170,742 8,846,625 Trucks 6,675,664 895,081 80,060 7,650,805 38,306 737,590 76,429 852,325 6,713,970 1,632,671 156,489 8,503,130 Total 11,327,010 2,817,738 336,562 14,481,310 255,092 1,622,684 990,669 2,868,445 11,582,102 4,440,422 1,327,231 17,349,755
2001*: Cars 4,132,495 1,953,838 238,663 6,324,996 193,241 865,424 1,038,964 2,097,629 4,325,736 2,819,262 1,277,627 8,422,625 Trucks 6,664,127 967,980 86,357 7,718,464 51,799 793,396 136,085 981,280 6,715,926 1,761,376 222,442 8,699,744 Total 10,796,622 2,921,818 325,020 14,043,460 245,040 1,658,820 1,175,049 3,078,909 11,041,662 4,580,638 1,500,069 17,122,369
2002*: Cars 3,736,251 1,927,076 214,318 5,877,645 185,726 952,315 1,087,543 2,225,584 3,921,977 2,879,391 1,301,861 8,103,229 Trucks 6,609,603 954,593 82,568 7,646,764 66,032 819,295 181,048 1,066,375 6,675,635 1,773,888 263,616 8,713,139 Total 10,345,854 2,881,669 296,886 13,524,409 251,758 1,771,610 1,268,591 3,291,959 10,597,612 4,653,279 1,565,477 16,816,368
2003*: Cars 3,391,080 1,941,147 195,203 5,527,430 194,047 844,482 1,044,522 2,083,051 3,585,127 2,785,629 1,239,725 7,610,481 Trucks 6,600,737 1,129,552 71,103 7,801,392 94,839 892,164 240,177 1,227,180 6,695,576 2,021,716 311,280 9,028,572 Total 9,991,817 3,070,699 266,306 13,328,822 288,886 1,736,646 1,284,699 3,310,231 10,280,703 4,807,345 1,551,005 16,639,053
2004*: Cars 3,114,964 2,094,307 147,602 5,356,873 253,039 852,346 1,043,674 2,149,059 3,368,003 2,946,653 1,191,276 7,505,932 Trucks 6,664,465 1,389,089 61,176 8,114,730 102,052 824,785 319,421 1,246,258 6,766,517 2,213,874 380,597 9,360,988 Total 9,779,429 3,483,396 208,778 13,471,603 355,091 1,677,131 1,363,095 3,395,317 10,134,520 5,160,527 1,571,873 16,866,920
2005*: Cars 3,075,058 2,189,281 216,194 5,480,533 234,455 969,341 982,737 2,186,533 3,309,513 3,158,622 1,198,931 7,667,066 Trucks 6,441,730 1,546,113 77,530 8,065,373 117,187 773,429 324,699 1,215,315 6,558,917 2,319,542 402,229 9,280,688 Total 9,516,788 3,735,394 293,724 13,545,906 351,642 1,742,770 1,307,436 3,401,848 9,868,430 5,478,164 1,601,160 16,947,754
2006*: Cars 3,068,116 2,107,786 300,188 5,476,090 198,446 1,207,354 938,964 2,344,764 3,266,562 3,315,140 1,239,152 7,820,854 Trucks 5,675,676 1,522,237 138,883 7,336,796 117,425 938,955 290,370 1,346,750 5,793,101 2,461,192 429,253 8,683,546 Total 8,743,792 3,630,023 439,071 12,812,886 315,871 2,146,309 1,229,334 3,691,514 9,059,663 5,776,332 1,668,405 16,504,400
2007*: Cars 2,708,404 2,259,309 285,637 5,253,350 185,388 1,240,663 939,012 2,365,063 2,893,792 3,499,972 1,224,649 7,618,413 Trucks 5,397,480 1,484,315 200,929 7,082,724 111,103 982,240 294,742 1,388,085 5,508,583 2,466,555 495,671 8,470,809 Total 8,105,884 3,743,624 486,566 12,336,074 296,491 2,222,903 1,233,754 3,753,148 8,402,375 5,966,527 1,720,320 16,089,222
Note: * - Wards changed how data are presented. Therefore, figures for 1997 and after are not entirely comparable with earlier years. n.a. - Not available.
Sources: Ward's (1993, 1998, 1999, 2001, 2003, 2005, 2006, 2008).
Prepared by: Policy Research & Strategic Planning, Ohio Dept. of Development. Telephone 614/466-2116 (DL, 8/08).
Totals
130
Domestic Built Imports

Table A15b: Percentages of U.S. Sales of Imported and Domestic Light Vehicles, 1988-2007
U.S. Japanese All U.S. Japanese All U.S. Japanese All Year & type Brand Brand Others Total Brand Brand Others Total Brand Brand Others Total
1988: Cars 43.8% 3.7% 0.2% 47.8% 2.5% 11.5% 5.0% 19.0% 46.3% 15.2% 5.3% 66.8% Trucks 27.9% 0.7% 0.0% 28.6% 0.5% 4.0% 0.1% 4.6% 28.3% 4.8% 0.2% 33.2% Total 71.6% 4.5% 0.3% 76.4% 3.0% 15.5% 5.2% 23.6% 74.6% 20.0% 5.4% 100.0%
1989: Cars 42.4% 5.2% 0.0% 47.7% 2.3% 11.5% 4.4% 18.2% 44.7% 16.7% 4.5% 65.9% Trucks 28.8% 0.9% 0.0% 29.7% 0.4% 3.9% 0.1% 4.4% 29.2% 4.8% 0.2% 34.1% Total 71.2% 6.1% 0.0% 77.4% 2.7% 15.4% 4.6% 22.6% 73.9% 21.5% 4.6% 100.0%
1990: Cars 41.1% 7.5% 0.1% 48.7% 2.1% 10.8% 4.0% 17.0% 43.2% 18.3% 4.2% 65.7% Trucks 28.7% 1.1% 0.0% 29.9% 0.1% 4.1% 0.2% 4.4% 28.9% 5.3% 0.2% 34.3% Total 69.8% 8.6% 0.2% 78.6% 2.2% 14.9% 4.2% 21.4% 72.0% 23.6% 4.4% 100.0%
1991: Cars 39.8% 9.0% 0.2% 48.9% 2.0% 10.8% 3.5% 16.3% 41.9% 19.7% 3.6% 65.2% Trucks 28.9% 1.5% 0.0% 30.4% 0.1% 4.2% 0.1% 4.4% 29.0% 5.7% 0.1% 34.8% Total 68.7% 10.5% 0.2% 79.4% 2.1% 14.9% 3.6% 20.6% 70.8% 25.4% 3.8% 100.0%
1992: Cars 38.9% 8.9% 0.2% 47.9% 1.5% 10.0% 3.1% 14.7% 40.4% 18.9% 3.3% 62.6% Trucks 32.1% 2.1% 0.0% 34.2% 0.1% 3.1% 0.1% 3.2% 32.1% 5.2% 0.1% 37.4% Total 70.9% 11.0% 0.2% 82.1% 1.6% 13.1% 3.2% 17.9% 72.6% 24.0% 3.4% 100.0%
1993: Cars 38.4% 8.9% 0.2% 47.5% 1.2% 8.6% 2.8% 12.5% 39.6% 17.5% 2.9% 60.0% Trucks 34.6% 2.7% 0.0% 37.2% 0.1% 2.6% 0.1% 2.8% 34.6% 5.3% 0.1% 40.0% Total 73.0% 11.6% 0.2% 84.7% 1.2% 11.2% 2.8% 15.3% 74.2% 22.8% 3.0% 100.0%
1994: Cars 37.2% 9.4% 0.5% 47.1% 0.5% 7.8% 2.9% 11.3% 37.7% 17.2% 3.4% 58.3% Trucks 35.8% 3.1% 0.0% 38.9% 0.1% 2.6% 0.1% 2.8% 35.9% 5.7% 0.1% 41.7% Total 73.0% 12.5% 0.5% 86.0% 0.5% 10.4% 3.0% 14.0% 73.6% 22.9% 3.5% 100.0%
1995: Cars 35.9% 10.5% 0.7% 47.2% 0.5% 6.4% 3.1% 10.0% 36.4% 17.0% 3.7% 57.1% Trucks 37.2% 2.9% 0.0% 40.1% 0.1% 2.5% 0.2% 2.8% 37.2% 5.4% 0.2% 42.9% Total 73.1% 13.5% 0.7% 87.3% 0.5% 8.9% 3.3% 12.7% 73.7% 22.4% 3.9% 100.0%
1996: Cars 34.2% 11.9% 0.8% 46.9% 0.3% 4.7% 3.3% 8.2% 34.5% 16.6% 4.1% 55.2% Trucks 38.8% 3.0% 0.1% 41.9% 0.0% 2.7% 0.2% 2.9% 38.9% 5.7% 0.3% 44.8% Total 73.0% 14.9% 0.9% 88.8% 0.3% 7.4% 3.5% 11.2% 73.4% 22.2% 4.4% 100.0%
1997*: Cars 32.7% 12.1% 0.9% 45.7% 0.7% 4.9% 3.4% 9.0% 33.4% 17.0% 4.3% 54.7% Trucks 38.2% 3.1% 0.1% 41.4% 0.0% 3.5% 0.3% 3.9% 38.2% 6.7% 0.4% 45.3% Total 70.9% 15.2% 1.0% 87.2% 0.7% 8.4% 3.7% 12.8% 71.7% 23.6% 4.7% 100.0%
1998*: Cars 30.1% 12.2% 1.3% 43.5% 0.5% 4.5% 3.8% 8.9% 30.6% 16.7% 5.1% 52.4% Trucks 39.8% 3.3% 0.3% 43.4% 0.0% 3.9% 0.3% 4.2% 39.8% 7.2% 0.6% 47.6% Total 69.8% 15.5% 1.6% 86.9% 0.6% 8.4% 4.1% 13.1% 70.4% 23.9% 5.7% 100.0%
131
Domestic Built Imports Totals
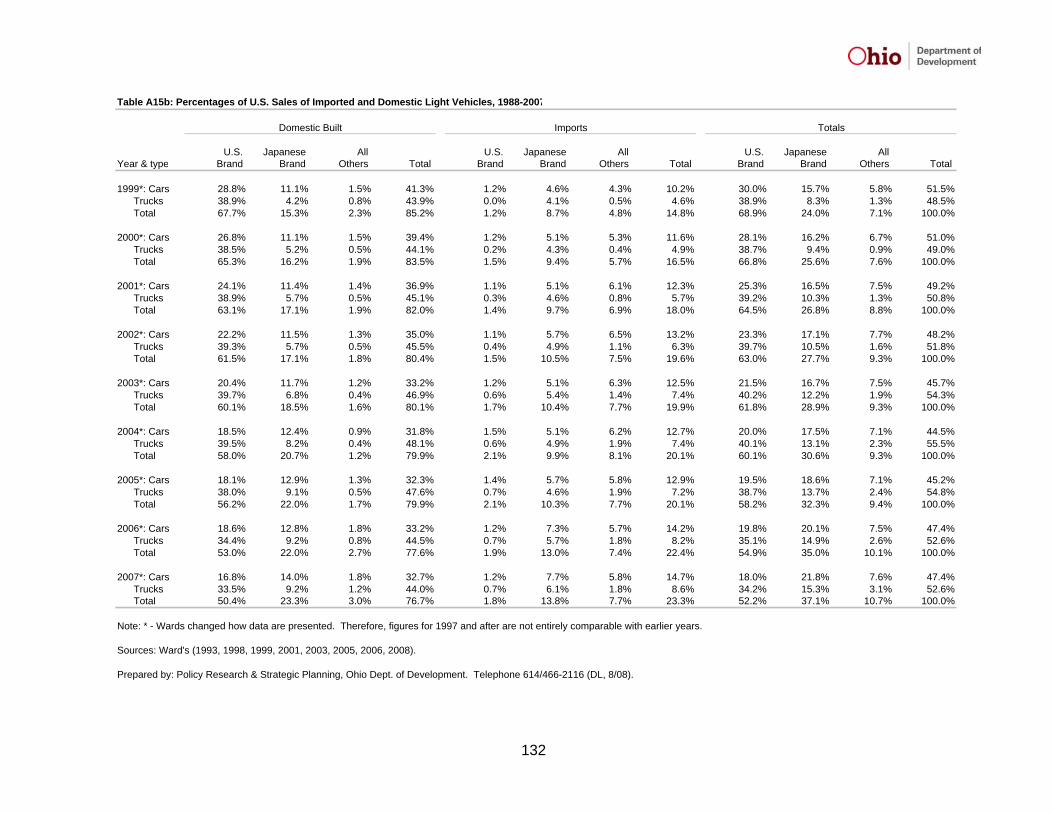
Table A15b: Percentages of U.S. Sales of Imported and Domestic Light Vehicles, 1988-2007
U.S. Japanese All U.S. Japanese All U.S. Japanese All Year & type Brand Brand Others Total Brand Brand Others Total Brand Brand Others Total
1999*: Cars 28.8% 11.1% 1.5% 41.3% 1.2% 4.6% 4.3% 10.2% 30.0% 15.7% 5.8% 51.5% Trucks 38.9% 4.2% 0.8% 43.9% 0.0% 4.1% 0.5% 4.6% 38.9% 8.3% 1.3% 48.5% Total 67.7% 15.3% 2.3% 85.2% 1.2% 8.7% 4.8% 14.8% 68.9% 24.0% 7.1% 100.0%
2000*: Cars 26.8% 11.1% 1.5% 39.4% 1.2% 5.1% 5.3% 11.6% 28.1% 16.2% 6.7% 51.0% Trucks 38.5% 5.2% 0.5% 44.1% 0.2% 4.3% 0.4% 4.9% 38.7% 9.4% 0.9% 49.0% Total 65.3% 16.2% 1.9% 83.5% 1.5% 9.4% 5.7% 16.5% 66.8% 25.6% 7.6% 100.0%
2001*: Cars 24.1% 11.4% 1.4% 36.9% 1.1% 5.1% 6.1% 12.3% 25.3% 16.5% 7.5% 49.2% Trucks 38.9% 5.7% 0.5% 45.1% 0.3% 4.6% 0.8% 5.7% 39.2% 10.3% 1.3% 50.8% Total 63.1% 17.1% 1.9% 82.0% 1.4% 9.7% 6.9% 18.0% 64.5% 26.8% 8.8% 100.0%
2002*: Cars 22.2% 11.5% 1.3% 35.0% 1.1% 5.7% 6.5% 13.2% 23.3% 17.1% 7.7% 48.2% Trucks 39.3% 5.7% 0.5% 45.5% 0.4% 4.9% 1.1% 6.3% 39.7% 10.5% 1.6% 51.8% Total 61.5% 17.1% 1.8% 80.4% 1.5% 10.5% 7.5% 19.6% 63.0% 27.7% 9.3% 100.0%
2003*: Cars 20.4% 11.7% 1.2% 33.2% 1.2% 5.1% 6.3% 12.5% 21.5% 16.7% 7.5% 45.7% Trucks 39.7% 6.8% 0.4% 46.9% 0.6% 5.4% 1.4% 7.4% 40.2% 12.2% 1.9% 54.3% Total 60.1% 18.5% 1.6% 80.1% 1.7% 10.4% 7.7% 19.9% 61.8% 28.9% 9.3% 100.0%
2004*: Cars 18.5% 12.4% 0.9% 31.8% 1.5% 5.1% 6.2% 12.7% 20.0% 17.5% 7.1% 44.5% Trucks 39.5% 8.2% 0.4% 48.1% 0.6% 4.9% 1.9% 7.4% 40.1% 13.1% 2.3% 55.5% Total 58.0% 20.7% 1.2% 79.9% 2.1% 9.9% 8.1% 20.1% 60.1% 30.6% 9.3% 100.0%
2005*: Cars 18.1% 12.9% 1.3% 32.3% 1.4% 5.7% 5.8% 12.9% 19.5% 18.6% 7.1% 45.2% Trucks 38.0% 9.1% 0.5% 47.6% 0.7% 4.6% 1.9% 7.2% 38.7% 13.7% 2.4% 54.8% Total 56.2% 22.0% 1.7% 79.9% 2.1% 10.3% 7.7% 20.1% 58.2% 32.3% 9.4% 100.0%
2006*: Cars 18.6% 12.8% 1.8% 33.2% 1.2% 7.3% 5.7% 14.2% 19.8% 20.1% 7.5% 47.4% Trucks 34.4% 9.2% 0.8% 44.5% 0.7% 5.7% 1.8% 8.2% 35.1% 14.9% 2.6% 52.6% Total 53.0% 22.0% 2.7% 77.6% 1.9% 13.0% 7.4% 22.4% 54.9% 35.0% 10.1% 100.0%
2007*: Cars 16.8% 14.0% 1.8% 32.7% 1.2% 7.7% 5.8% 14.7% 18.0% 21.8% 7.6% 47.4% Trucks 33.5% 9.2% 1.2% 44.0% 0.7% 6.1% 1.8% 8.6% 34.2% 15.3% 3.1% 52.6% Total 50.4% 23.3% 3.0% 76.7% 1.8% 13.8% 7.7% 23.3% 52.2% 37.1% 10.7% 100.0%
Note: * - Wards changed how data are presented. Therefore, figures for 1997 and after are not entirely comparable with earlier years.
Sources: Ward's (1993, 1998, 1999, 2001, 2003, 2005, 2006, 2008).
Prepared by: Policy Research & Strategic Planning, Ohio Dept. of Development. Telephone 614/466-2116 (DL, 8/08).
Domestic Built Imports Totals
132

Table A16: Projections of Motor Vehicle Industry Employment,* Ohio and the U.S., 2006-2016
NAICSCode Shorter Industry Title Actual Projected Number Percent
Ohio: Total 5,842,100 6,132,800 290,700 5.0%31-33 Manufacturing 795,500 654,700 -140,800 -17.7% 3361-3 MV Core Groups Subtotal 127,000 96,900 -30,100 -23.7% 3361 MV Assembly 28,100 23,800 -4,300 -15.3% 3362 MV Bodies & Trailers 8,500 7,100 -1,400 -16.5% 3363 MV Parts 90,400 66,000 -24,400 -27.0%
U.S.: Total 150,620,100 166,220,300 15,600,200 10.4%31-33 Manufacturing 14,197,300 12,694,500 -1,502,800 -10.6% 3361-3 MV Core Groups Subtotal 1,070,400 917,700 -152,700 -14.3% 3361 MV Assembly 236,100 225,800 -10,300 -4.4% 3362 MV Bodies & Trailers 180,200 176,100 -4,100 -2.3% 3363 MV Parts 654,100 515,800 -138,300 -21.1%
Note: * - Projections have not been made for tires (NAICS 32621) or storage batteries (335911).
Sources: Figueroa and Woods (2007), ODJFS-LMI (2008).
Prepared by: Policy Research & Strategic Planning, Ohio Dept. of Development. Telephone 614/466-2116 (DL, 12/08).
ChangesJobs
133