the occurrence and amount of microplastics …
TRANSCRIPT

THE OCCURRENCE AND AMOUNT OF MICROPLASTICS INGESTED BY
FISHES IN THE WATERSHEDS OF THE GULF OF MEXICO
by
Melissa B. Phillips, B.A.
A thesis submitted to the Graduate Council of
Texas State University in partial fulfillment
of the requirements for the degree of
Master of Science in Interdisciplinary Studies
with a Major in Interdisciplinary Studies
December 2014
Committee Members:
Timothy H. Bonner, Chair
Gwendolyn Hustvedt
Joseph Veech

COPYRIGHT
by
Melissa B. Phillips
2014

FAIR USE AND AUTHOR’S PERMISSION STATEMENT
Fair Use
This work is protected by the Copyright Laws of the United States (Public Law
94-553, section 107). Consistent with fair use as defined in the Copyright Laws,
brief quotations from this material are allowed with proper acknowledgment. Use
of this material for financial gain without the author’s express written permission
is not allowed.
Duplication Permission
As the copyright holder of this work I, Melissa B. Phillips, authorize duplication of
this work, in whole or in part, for educational or scholarly purposes only.
iv
ACKNOWLEDGEMENTS
A very special thank you goes to my major advisor Dr. Timothy Bonner for
welcoming me into his research lab, and being so supportive and encouraging throughout the
data collecting, lab work, analysis and writing phase of this thesis. The fact that he took a
chance on a student from another program with crazy ideas of looking for plastic in fish
meant that I could pursue a long held dream and passion. I couldn’t have wished for a better
place to end up at Texas State than Dr. Bonner’s lab. Not only have I been able to relate my
studies in Sustainability to fish, but I have also been on countless research trips to the
furthest reaches of Texas, which has made my experience here unforgettable.
I would also like to thank my committee members Dr. Veech and Dr. Gwendolyn
Hustvedt for their guidance and contribution to my thesis and success as a graduate student.
A special thanks goes to Dr. Hustvedt’s continued support. Without her I probably would
never have managed to maneuver the application process, let alone have such a fulfilling and
exciting experience. She listened to my plastic pipe dreams, making them a reality by
steering me towards Dr. Bonner. Her energy is contagious, she has been a joy to work with
and as a strong woman scientist she is a huge inspiration to me.
I would like to thank all those who helped with the endless months of fish dissecting
especially Michael Parham. Without Mike’s enthusiasm and dedication I would still be
dissecting fish. With that being said I must extend huge amounts of thanks to my colleagues
in the Bonner lab: Cody Craig, David Ruppel, Harlan Nicholls, Ginny Dautreuil, Myranda
Clarke, Chris Vaughn, Emily Cowles and Corey Scanes. They welcomed me into
Freeman’s with open arms and I have shared many laughs with them along the way.
v
Additionally I’d like to thank Port Mansfield Fishing Tournament for allowing me to gut
hundreds of fish during the weigh in and Cerium Labs for the chemical analysis of the
microplastics.
Next, my boyfriend, Jack, with whom there is never a dull moment. We embarked
on our Texan adventure together and moving here has resulted in new horizons, new friends
and wonderful memories. With that I would like to thank my wonderful family for being so
supportive of my decision to move away and go back to school. My brother, Charles,
especially has always been a friend, a joker and someone to lean on. I am lucky to have
such inspirational parents, Sue and Mark Phillips, as mentors and I hope to make them as
proud of me as I am of them. This is dedicated to them.

vi
TABLE OF CONTENTS
Page
ACKNOWLEDGEMENTS .............................................................................................. iv
LIST OF TABLES ........................................................................................................... vii
LIST OF FIGURES ........................................................................................................ viii
ABSTRACT ...................................................................................................................... ix
CHAPTER
1. THE OCCURRENCE AND AMOUNT OF MICROPLASTICS INGESTED BY
FISHES IN THE WATERSHEDS OF THE GULF OF MEXICO ............................... 1
Introduction .................................................................................................................... 1
Materials and Methods ................................................................................................... 4
Results ............................................................................................................................ 8
Discussion .................................................................................................................... 11
Sustainability and Management ................................................................................... 14
LITERATURE CITED ..................................................................................................... 23

vii
LIST OF TABLES
Table Page 1. Species, number, and maximum (max) sizes of individuals examined from
10 sites and nine freshwater drainages of Texas and the Laguna Madre, an
estuary along the southeast coast of Texas.. ............................................................. 17
2. Percent occurrences and types of microplastic ingestion in freshwater habitats,
amongst urbanized and non-urbanized streams, and trophic guilds, taken
from 10 sites and nine freshwater drainages of Texas.. ......................................... 20
3. Percent occurrence and types of microplastic ingestion in marine habitats,
amongst harbour, bay and offshore fishes and trophic guilds taken from
the Laguna Madre, an estuary along the southeast coast of Texas. ................... 21

viii
LIST OF FIGURES
Figure Page 1. Generalized locations (freshwater and marine) by drainage of fishes
harvested for gut content examination. ............................................................... 22

ix
ABSTRACT
Occurrence and types of microplastics in the digestive system of freshwater fishes could be
an emerging environmental crisis because of the proliferation of plastic pollution in aquatic
environments. Recent studies report increasing amounts of microplastics in marine systems
and in the gut tracts of marine fishes. To date, only one study has reported percent
occurrence of microplastics (12%) in the digestive system of freshwater fishes. Purposes of
this study were to quantify occurrences and types of microplastics ingested by fishes within
the western freshwater drainages of the Gulf Mexico and an estuary of the Gulf of Mexico.
My study objectives were (1) to enumerate and identify microplastics from fishes taken from
10 sites and nine freshwater drainages of Texas and harbor, bay, and gulf sites within or near
the Laguna Madre of southeast Texas, (2) to compare percent occurrence of microplastics
among habitat and trophic guilds of fishes, and (3) to compare percent occurrence of
microplastics between urbanized and non-urbanized streams and thus test the hypothesis that
fishes from urbanized streams will have greater percent occurrence of microplastics than
fishes from non-urbanized streams. Among 535 fishes examined in this study, percent
occurrence of microplastics was 8% in freshwater fishes and 10% in marine fishes. Plastic
types included polyester, polystyrene, polypropylene, acrylate, and nylon. Percent
occurrence of microplastics ingested by fishes in non-urbanized streams (5%) was less than
that of one urbanized streams (Neches River; 29%). Percent occurrence by habitat (i.e.,
benthic, pelagic) and trophic guilds (herbivore/omnivore, invertivore, carnivore) were
similar. Percent occurrences of microplastics reported herein are similar for freshwater
fishes and towards the lower end of the range of microplastic ingestion in marine fishes
(range: 8 - 33%). Occurrences of microplastics in the fishes pose several environmental
concerns. For fish health, microplastics absorb toxins and can be passed through the
digestive system, into the circulatory system, and accumulate in tissue. Long-term effects
are unknown for the fish or the effects on human consumers.

1
I. THE OCCURRENCE AND AMOUNT OF MICROPLASTICS INGESTED
BY FISHES IN THE WATERSHEDS OF THE GULF OF MEXICO
Introduction
Plastic pollution is ubiquitous on land and in water globally and is increasing. The
number of disposable plastic products created to date in the 21st century is greater than the
number produced in the 20th century (MacBride 2012). Annual plastic production has
increased from 1.5 million tonnes in the 1950s to 288 million tonnes in 2012 (PlasticsEurope
2013). In the U.S. only 9% of that was recycled (EPA 2014). Plastic production continues
to accelerate and developing countries are starting to adopt the use-and-dispose culture now
common in the developed world. Plastic litter in the ocean has been of concern since the
1970s, when the first reports of microplastic ingestion in fishes were published (Carpenter et
al. 1972). Plastic is prolific throughout the marine environment (Barnes et al. 2009) and as
much as 70% of marine debris is plastic where it persists and accumulates due to its durable
nature (Derraik 2002, Lusher et al. 2013).
Effects of large plastic items (i.e., macroplastics), such as entanglement, ingestion
and death, are widely reported in fish and wildlife (Moser and Lee 1992, Derraik 2002,
Moore 2008, Witherington et al. 2012). However, a larger proportion of plastic pollution is
microscopic (< 5 mm; Eriksen et al. In press). Some microplastics, for instance microbeads,
are manufactured to be of a microscopic size, typically polyethylene and polypropylene and
used in skin exfoliators and cosmetics and in air-blasting technology (Derraik 2002, Gregory
2009, Fendall and Sewell 2009, Eriksen et al. 2013). Additionally plastics are derived from
macroplastic fragmenting and disintegrating into smaller particles through a process of
photo-degradation caused by the ultraviolet rays of the sun, mechanical forces, and weather
(Derraik 2002, Thompson et al. 2004, Cole et al. 2011). These macroplastics are made of a
variety of plastics; the most abundant forms being polyolefins (polyethylene and
2
polypropylene) primarily used for single-use packaging (Browne et al. 2010b). Another
source of microplastics appears to be acrylic, polyester, and polyamide fibers from textile
(Browne et al. 2011). Densities of plastic vary considerably, depending on the type of
polymer and the manufacturing process. Size and density of plastic determine its position in
the water column (Browne et al. 2010b) and potentially its environmental effects including
ingestion by fishes.
Recent studies report the occurrence of microplastics in freshwater systems.
Microplastics occur in Lake Geneva, Switzerland (Faure et al., 2012), the Laurentian Great
Lakes of North America (Eriksen et al. 2013), freshwater inflows into Jade Bay, Germany
(Dubaish and Liebezeit 2013) and the remote Lake Hovsgol, Mongolia (Free et al. 2014) at
amounts comparable to those in marine systems. Abundance of microplastic pollution and
urban population density are directly related with one source microplastics coming from
wastewater treatment effluent (Browne et al. 2011, Free et al. 2014). Concerns and
subsequent effects of incidental ingesting by freshwater and marine aquatic animals are
emerging environmental issues. Bioavailability of the smaller-sized microplastics is more
likely than macroplastics, especially to fishes that mistakenly or incidentally ingest while
feeding in the water column or along the benthos (Browne et al. 2010a).
Percent occurrence of plastics in the stomach contents of marine fishes range from
2.6% in the North Sea (Foekema et al. 2013) to 60% along the North Atlantic coast of USA
(Carpenter et al. 1972). Other areas include Brazilian estuaries (percent occurrence: 8%
among sciaenids, (Dantas et al. 2012); 18 to 33% among ariids, (Possatto et al. 2011), North
Pacific Gyre (35% among meso- and epipelagic fishes, Boerger et al. 2010), and English
Channel (37% among demersal and pelagic fishes, (Lusher et al. 2013). The studies of the
percent occurrence of microplastics in freshwater fishes is limited with one study reporting
12% in urbanized streams in France (Sanchez et al. 2014).
3
Occurrence of microplastics in the stomachs of fish poses several environmental
concerns. Ingested microplastics are passed through in the feces, retained in the digestive
tract, or translocated from the gut into body tissues via the epithelial lining (Browne et al.
2010a). Microplastics consist of synthetic organic polymers that can serve as a transport
medium for persistent organic pollutants (POPs). Polymers act as a sponge and absorb
toxins, such as polychlorinated biphenyls (PCBs), dioxins, pesticides, flame-retardants and
carcinogens from the marine environment (Rochman 2013). More recently, research has
also confirmed toxic substances pass from microplastics to the carrier and accumulate in
tissues (Rochman et al. 2013). The negative effect that plastic can have on fish health can
be due to the toxic nature of the plastic itself, or because of the pollutants absorbed (by
plastic) from the environment. Due to the toxic consequences of microplastic ingestion to
the food web and the ever increasing amount of plastic polluting a wide array of waterways,
it is important to understand the extent of the problem, so as to effectively mitigate and take
preventative measures. The implementation of effective resource recovery and waste
management is crucial to ameliorate the negative effects of plastic ingestion by fish.
The purpose of my study is to document occurrence, frequency, amount, and types of
plastic ingested by fishes in freshwater drainages of the Gulf of Mexico and by marine fishes
within a large bay system of the Gulf of Mexico. To further illustrate the link between
highly human-altered areas and plastic pollution, this study compares ingestion amounts in
fishes from urbanized and non-urbanized streams. Among freshwater drainages, I predict
that plastic consumption will be similar to the range of ingestion amounts reported in marine
studies conducted in estuaries (8 to 33%; Dantas et al. 2012,Possatto et al. 2011) and
freshwater (12%; Sanchez et al. 2014). In addition, I predict that not all trophic guilds of
fishes (e.g., benthic omnivore, pelagic piscivore) will ingest plastics equally but rather
consume different amounts depending on the location of plastics within aquatic

4
environments (i.e., benthic, pelagic, surface) where the fishes feed. Within the large bay
system, I predict that fishes within and near the Laguna Madre (Southeast coast of Texas)
will consume less plastic than reported elsewhere, given that the Laguna Madre is a
hypesaline bay system which has limited freshwater inflows and is located next to the Wild
Horse Desert. Study objectives are to quantify plastic ingestion among fish communities
and among fish-feeding guilds, to compare amounts of plastic ingestion between urbanized
and non-urbanized streams, and to chemically identify the primary sources of plastics
consumed by fishes in freshwater drainages of the Gulf of Mexico and by marine fishes
within or near the Laguna Madre.
Materials and Methods
Gut contents of fishes were extracted from individuals harvested for purposes other
than these study objectives. Freshwater fishes were obtained from voucher and teaching
collections, taken between September 2013 and January 2014 and housed at Texas State
University. Freshwater fishes were taken by permit (Texas Parks and Wildlife Scientific
Collection Permit Number SPR-0601-159) and Institute of Animal Care and Use Committee
(IACUC) protocols (Texas State University IACUC numbers 1036-1102-32 and 0530-0620-
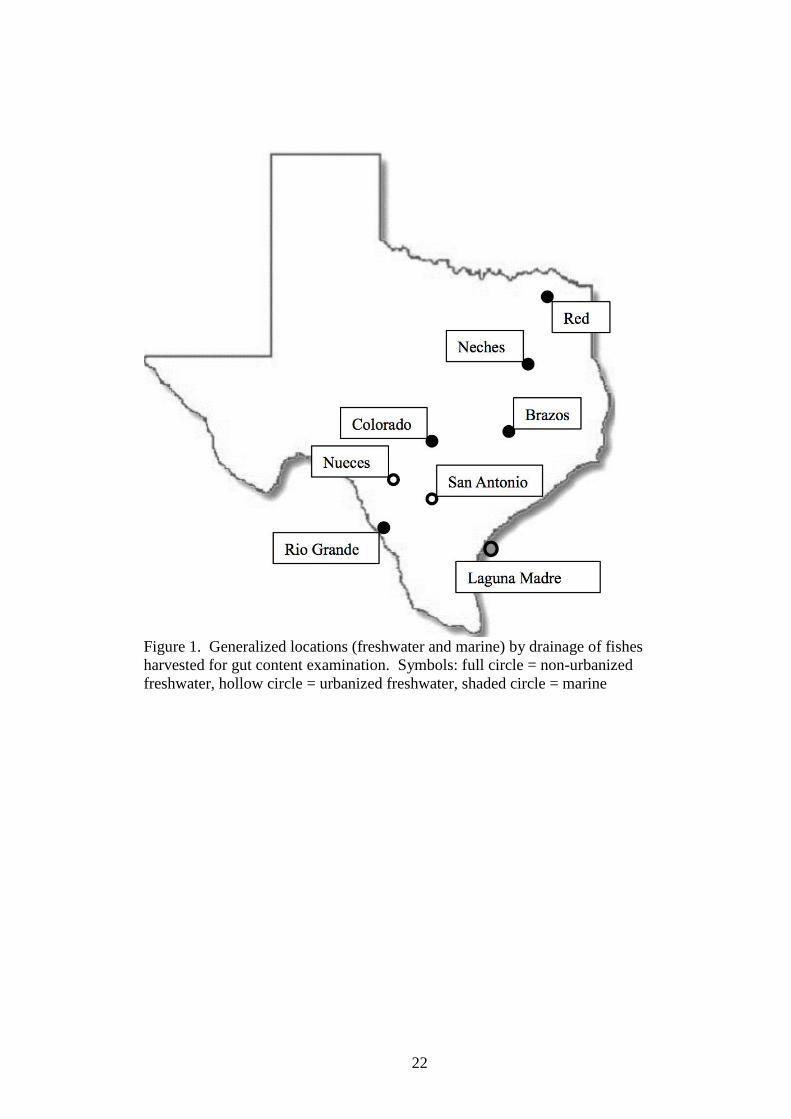
15. Streams were upper Las Moras Creek (Rio Grande drainage) Nueces River (Nueces
River drainage), upper San Antonio River (San Antonio River drainage), James River
(Colorado River drainage), Mill Creek and lower Brazos River (Brazos River drainage),
Banita Creek (Angelina River drainage), Big Sandy Creek (Neches River Drainage), Caddo
Lake (Cypress River-Red River drainage), Red River (Red River drainage) (Figure 1).
Sampling locations were within urban areas on the Upper San Antonio River (City of San
Antonio, Texas) and on Banita Creek (City of Nacogdoches, Texas). At each site, fishes
were harvested with seines or electrofishing. Fishes were taken from all available habitats;

5
however, a few larger specimens (>200 mm), usually ictalurids, centrarchids, and cichlids,
were not retained. Otherwise, fishes retained were a representative sample of the
community existing at time of collection. Fishes were anesthetized with a lethal dose of
MS-222 (>80 mg/l) and fixed in 10% buffered formalin. After at least two weeks in 10%
formalin, fish were transferred to 70% ethanol. In the laboratory, freshwater fishes were
identified to species, weighed (g), and measured (mm; total length). Gastrointestinal (GI)
tracts from esophagus to the anus were removed. Marine fishes were donated by anglers in
a bay and offshore fishing tournament (Port Mansfield Fishing Tournament) held on the
Laguna Madre along the southern coast of Texas in July 2013. Fishes were harvested by
hook-and-line angling with live or plastic baits from the Laguna Madre or from the Gulf of
Mexico near Laguna Madre. On the day of harvest, fishes were maintained in edible
condition until reaching the weigh-in station at Port Mansfield, Texas, which usually
includes holding fish in an ice bath. At weigh-in, fish were identified to species, weighed
(g), and measured (mm; total length or fork length if caudal fin is lunate). Abdomen was
opened, and the alimentary canal from esophagus to anus was removed, placed in a plastic
bag, and frozen.
Initially, all individuals collected from a site were targeted for GI tract examinations.
After examining 67 Red Shiners Cyprinella lutrensis and 48 Pinfish Lagodon rhomboides,
selection process changed to selecting up to 10 individuals per species or habitat guild per
site in order to capture variability among a greater number of species and habitat guilds
while restricting effort in examining a large number of the same species. For each individual
selected, the GI tract was placed on a sterile petri dish underneath a dissecting scope with
adequate lighting. Petri dish and sterilized dissecting utensils were examined for foreign
material before each use. Stomach or upper GI tract was sliced longitudinally to expose the
contents. Stomach was delineated by a pyloric sphincter muscle. For fish without a distinct

6
sphincter muscle, the upper GI tract to the first loop of the intestine was examined. Care
was taken to ensure that instruments did not scrape or generate plastic shavings on the
bottom of the petri dish. Stomach or upper GI tracts were searched for any suspicious
objects that did not resemble prey and removed with forceps. Search time depended on
exhaustive sampling of the food contents. Initially, a large number of white, red, and blue
elongated fibers were found commonly in the first 100 individuals examined. A swipe of
nearby countertops contained identical white, red, and blue elongated fibers. Source of
fibers was attributed to the settling of particles in the air. To avoid areal contamination,
times were restricted to 10 minutes of continuous search. Occurrences of white, red, and
blue elongated fibers, which were similar to length, diameter, and texture of room particles,
were not considered ingested items. Once other suspected plastic items were found, the item
was categorized following similar descriptions of Lusher et al. (2013) and Free et al. (2014):
nurdle (e.g., irregularly shaped cube with smooth to jagged edges and without a flat plane),
filament (e.g., thin thread-like structure), shard (e.g., irregular shaped cube with at least one
smooth plane), and film (e.g., thin with two smooth planes). For each item, longest length
and width were measured to estimate area of the item. For each fish, number and area of
each plastic category were recorded.
A commercial company (Cerium Laboratories, Austin, Texas) used Fourier
transform infrared (FTIR) spectroscopy to identify and confirm categories of suspicious
items found in the gut contents of fish. Use of FTIR to identify all items was cost-
prohibitive, so up to 8 representative samples from nurdle, filament, shard, and film
categories were examined. All nurdle samples were identified as sand. The nurdle category
was removed from subsequent analyses. Filament, shard, and film categories were
confirmed as a plastic but not in all samples tested. Organic tissue (i.e, non-plastic) was
found in 55% of the filament samples tested, 25% of the shard samples tested, and 57% of

7
the film category tested. Organic tissue was largely prey or fish tissues that appeared to be a
plastic item. The remaining organic tissue was cellulosic filaments. These filaments did not
appear to be similar to the filamentous air particles in the laboratory. The source of cotton
items still could be from contamination or ingested from aquatic sources. Regardless, issues
surrounding plastics in the environment are likely not the same for cotton fibers in the
environment. As such, cotton and other organic tissues were excluded from subsequent
analyses.
Percent occurrence of microplastics was calculated for all fish examined in this
study, for freshwater and marine fishes separately, for each freshwater drainage basin, and
for each habitat and feeding guild. Percent occurrence is based on whether the fish ingested
plastic. Habitat and feeding guilds were assigned following Goldstein and Simon’s (1999)
Guild Structure. Percent occurrences of microplastics from fishes in each urbanized stream
(Upper San Antonio River and Banita Creek) were compared to those from non-urbanized
streams (N = 5) with a one-tail Z-test (α = 0.05) to test the prediction that percent occurrence
of microplastics was greater in fish within urbanized streams than in non-urbanized streams.
Since FTIR spectroscopy was conducted on only a representative sample of the categories, a
correction factor was developed and applied to the raw data before any analysis. The
correction factor was necessary to adjust for organic tissue being selected and considered as
a plastic. Percent occurrences with correction factor consisted of calculating a correction for
each plastic category. Among items tested with FTIR spectroscopy, filament category
consisted of 44.4% confirmed plastic items (and 55.6% organic), shard category consisted of
75.0% confirmed plastic categories, and films consisted of 42.9% confirmed plastic
categories. Each of these percentages was converted to a proportion and multiplied by the
numbers of fish reported to contain a plastic item. For example, 15 of the 419 freshwater
fishes contained one or more film items and thus uncorrected percent occurrence for film in

8
freshwater fishes would be 3.6% (15 out of 419). However, corrected percent occurrence
would be 1.5% [e.g., (15 * 0.429) / 419 * 100)] because only 42.9% of the initially recorded
film items actually were film items. Correction factors, using the same procedures, were
developed for fishes that contained two and three categories of plastics. For example, a fish
with at least one filament item (0.444) and one film item (0.429) would be corrected to
0.190 fish with a filament and film items, which is the product of 0.444 and 0.429. Counts
and surface area of items reported herein were not corrected for the occurrence of organic
tissue in the categories. Uncorrected total counts of plastics items are provided but should
be viewed with caution. Organic tissue was not obviously distinct in size and therefore
unlikely skews size estimates reported here but again should be viewed with caution.
Results
Among 535 individuals, 51 species, and 17 families examined, plastics were detected
in stomach contents of 46 individuals (8.6%), 33 species (65%), and 13 families (71%) taken
from freshwater and saltwater environments (Table 1). Filamentous plastics occurred in
2.6% of individuals and consisted of polyester and polystyrene. Mean surface area (± 1 SD)
of filamentous plastics was 222 um2 (± 372.2) with a maximum size of 4,500 um2.
Maximum number of filamentous plastics in a stomach was 4. Shard plastics occurred in
3.4% of individuals and consisted of polystyrene, polypropylene, acrylate, and nylon
(polyamide). Mean surface area (± 1 SD) of shard plastics was 147.6 um2 (± 192.2) with a
maximum size of 1,500 um2. Maximum number of shard plastics in a stomach was 12.
Film plastics occurred in 3.9% of individuals and consisted of polyester and cellulosic
materials. Mean surface area (± 1 SD) of film plastics was 576 um2 (± 2,940.4) with a
maximum size of 22,500 um2. Maximum number of film plastics in a stomach was 10.
Among the 46 individuals with a plastic item, 22 (48%) contained at least 2 plastic types and
9
4 (9%) contained three plastic types. Maximum number of plastic types in a stomach was
12.
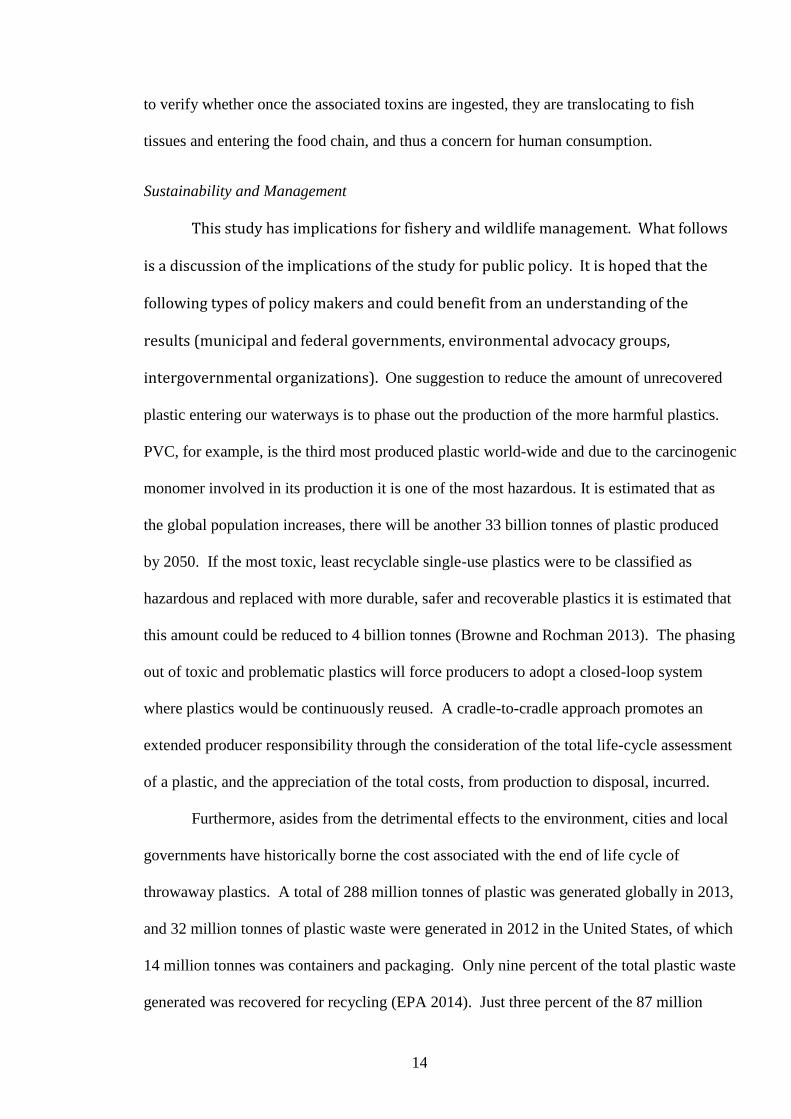
A total of 419 freshwater fishes was examined, representing 44 species and 12
families (Table 2). Among these, plastics were detected in 34 individuals (8.2%), 26 species
(59%), and 9 families (75%). Percent occurrence among individuals by plastic type was
1.3% for filament plastics, 2.7% for shard plastics, and 3.1% for film plastics. Percent
occurrences of plastics were 6.8 and 29% in the two urbanized streams and ranged from 0.0
to 11% in non-urbanized streams. Percent occurrence of plastics in fishes from urbanized
area of the Neches River (29.2%) was greater (P > 0.95) than those taken from non-
urbanized streams (mean ± 1 SD; 4.6 ± 3.9). Percent occurrence of plastics in fishes from
urbanized area of the San Antonio River (6.8%) did not differ (P = 0.90) than those taken
from non-urbanized streams.
Among urban streams, percent occurrences among individuals by plastic type were
0.5 and 2.1% for filament plastics, 4.5 and 13% for shard plastics, and 1.8 and 20% for film
plastics. Mean surface area (± 1 SD; maximum area) was 286 um2 (± 345.3; 1380 um2) for
filament plastics, 129.8 um2 (± 133; 1,500 um2) for shard plastics, and 192.1 um2 (± 240;
1,400 um2) for film plastics. Maximum number within a stomach was 2 for filament
plastics, 12 for shard plastics, and 10 for film plastics. Among the 20 individuals with a
plastic item, 12 (35%) contained at least two plastic types. Percent occurrence within the
benthic habitat guild was 19%, ranging from 13% in herbivores-omnivore trophic guild to
21% in invertivore trophic guild. Percent occurrence within the pelagic habitat guild was
7.7%, ranging from 6.3% in invertivore-carnivore trophic guild to 21% in herbivore-
omnivore trophic guild.
Among non-urban streams, percent occurrences among individuals by plastic type
ranged from 0 to 5.0% for filament plastics, from 0 to 4.5% for shard plastics, and from 1.3

10
to 3.9% for film plastics. Mean surface area (± 1 SD; maximum area) was 73 um2 (± 98.6;
400 um2) for filament plastics, 160 um2 (± 245.2; 694 um2) for shard plastics, and 235 um2
(± 332.2; 1,400 um2) for film plastics. Maximum number within a stomach was 2 for
filament plastics, 4 for shard plastics, and 5 for film plastics. Among the 13 individuals with
a plastic item, 4 (12%) contained at least two plastic types and 1 (3%) contained three plastic
types. Maximum number of plastic types in a stomach was 5. Percent occurrence within the
benthic habitat guild was 5.9%, ranging from 5.8 in invertivore trophic guild to 7.5% in
invertivore-carnivore trophic guild. Percent occurrence within the pelagic habitat guild was
5.6%, ranging from 2.4% in invertivore-carnivore trophic guild to 8% in herbivore-omnivore
trophic guild.
A total of 116 marine fishes was examined, representing eight species and five
families (Table 3). Among these, plastics were detected in 12 individuals (10.4%), seven
species (58%), and four families (80%). Percent occurrence among individuals by plastic
type was 3.8% for filament plastics, 2.6% for shard plastics, and 2.6% for film plastics.
Percent occurrences of plastics were 5.9% in the harbour fishes, 13.5% in the bay fishes and
22% in the offshore fishes.
In marine fish, percent occurrences among individuals by plastic type ranged from
2.9% in the harbour fishes to 14.8% in the offshore fish for filament plastics, 1.9% in
harbour fishes to 4.3% in bay fishes for shard plastics, and 2.8% in barbour fishes to 7.1% in
offshore fishes for film plastics. The mean surface area (± 1 SD; maximum area) was 313
um2 (± 473.9; 4,500 um2) for filament plastics, 186 um2 (± 290.1; 832 um2) for shard
plastics, and 1,565 um2 (± 5,588.7; 22,500 um2) for film plastics. Maximum number within
a stomach was 4 for filament plastics, 2 for shard plastics, and 6 for film plastics. Among
the 12 individuals with a plastic item, 6 (50%) contained at least two plastic types and 3
(33%) contained three plastic types. Percent occurrence within the benthic invertivore-

11
carnivore trophic guild was 12%. Percent occurrence within the pelagic habitat guild was
10%, ranging from 6% in invertivore trophic guild to 17.5% in carnivore trophic guild.
Discussion
Although percent occurrences were low, occurrences of microplastic ingestion was
ubiquitous among all water bodies, taxonomic groups, and trophic guilds quantified in this
study. Predictions about percent occurrence of microplastic ingestion among freshwater and
marine fishes, between non-urbanized and urbanized streams, and among trophic guilds
were supported. Percent occurrence of microplastic ingestion among freshwater fishes
(8%) and marine fishes (10%) in the study area was within the low range of reported plastic
ingestion elsewhere (8 to 33%; Dantas et al. 2012,Possatto et al. 2011). Percent occurrence
of microplastics ingested by fishes in non-urbanized streams (5%) was less than that of one
urbanized streams (Neches River; 29%). Estimates within urbanized streams (6.8 to 29%)
were similar to percent occurrence of microplastic ingestion in other urbanized streams
(12%; Sanchez et al. 2014). Within urbanized streams, 19% of the all fishes of the benthic
habitat guild ingested microplastics, whereas only 8% of all fishes with the pelagic habitat
guild ingested microplastics. Benthic and pelagic guilds were similar (<6%) within non-
urbanized streams and within the marine system (10 – 12%) and consistent with other
studies that did not detect differences among habitat or trophic guilds (Boerger et al. 2010).
Sizes of microplastics reported in this study were similar to those reported as the
most abundant in the environment and in the stomach contents of fish. Though reported in
area, the maximum linear length was 5.5 mm. Microplastics, ranging in linear length from
0.33 to 4.75 mm, comprise up to 92% of the available plastics in marine environments,
although estimates of the smaller microplastics were constrained by mesh size of tow (0.33
mm) (Eriksen et al. In press). As such, estimates of available microplastics likely

12
underrepresented the total amounts of water column microplastics available. Size
distributions of microplastics within the aquatic systems assessed in this study are not
known at this time although it would be useful to know the amount of ingestion relative to
the amount available in the environment. As reported in other studies, plastic sizes in fish
stomachs ranged from <5 mm (Foekema et al. 2013) to 14.3 mm, with the most common
size class being 1 to 2 mm (Luther 2012). A large proportion of fishes examined in this
study are small-bodied fishes (<100 mm). Gape size among the most common family
(Cyprinidae) is <6% of total length (calculated from three representative species within the
family; Perkin et al. 2009), which constrains consumption of microplastics >6 mm.
Polymers ingested by fish in this study were polypropylene (PP), polyester (PET),
polyethulacrylate, polystyrene, and nylon (polyamide). Similar polymers were present in the
gut tracts of fishes taken from the English Channel (Lusher et al. 2013) and the North Sea
(Foekema et al. 2013). Sources of polymers classified as film and shard are reported to be
from packaging and sturdy plastic material (Browne et al. 2010b). Sources of polymers
classified as filament (e.g. nylon) are reported to be from wastewater treatment facilities and
soil from terrestrial habitats where sewage sludge had been applied (Browne et al. 2011,
Dubaish and Liebezeit 2013). Combination of all three categories in fishes examined in this
study supports that land-base and water-base sources of plastics are entering the aquatic
systems.
The extent of the effect of plastic contamination on fish health is not yet completely
understood. All of the polymers identified in this study possess harmful monomers of
varying degrees. The crude oil derived chemicals, released during production, use and
disposal of plastics, are hazardous to the foodweb and the environment and (Lithner et al.
2011). Polystyrene, used in food packaging, is made of the endocrine disrupter styrene,
which is used in many other polymers, including polyester (Lithner et al. 2011). Two of the

13
polymers, polyester and poly(methylacrylate), are made with hazard level IV (out of five
levels) monomers, which are associated with cell mutation, respiratory irritation and are
hazardous to the aquatic environment (Lithner et al. 2011). Though polymers such as
polyethylene and nylon (polyamide) are thought to be more benign these materials are likely
to absorb pollutants in the environment (Rochman 2013). Pesticides and organic pollutants
such as polychlorinated biphenyls, known to disrupt physiological processes, such as cell
division and immunity, are found in high concentrations in plastic in the marine
environment (Teuten et al. 2009). The negative effects of toxins on fish health is
demonstrated in a study, in which Japanese Medaka Oryzias latipes were exposed to small
particles of low-density polyethylene (LDPE), a polymer that has a high affinity to organic
pollutants and is most commonly found in aquatic debris, making it of high environmental
relevance. The LDPE had previously been deployed in an urban bay for three months and
after a two-month exposure the fish tissues were analyzed showing a greater concentration
of PBTs. The fish showed signs of liver stress, including glycogen depletion, fatty
vacuolation and single cell necrosis (Rochman et al. 2013).
On the whole, microplastic found in freshwater and marine fishes is in relatively low
abundance; however, as the population of Texas grows, plastic consumption will increase
resulting in more plastic pollution. I present this study as an early indication of an
environmental concern that can be avoided with mitigation. Freshwater fishes in Texas are
consuming microplastic waste that has been shown to have detrimental effects to fish health.
Whilst more research into the effects of plastic ingestion on fish in the wild is necessary, the
data thus far sufficiently emphasizes both the physical and chemical threats of plastic
pollution. The information in the present study, along with the extensive research into the
many hazardous impacts of plastic pollution in our environment, is sufficient evidence to
compel more effective action and mitigation. The next step for the scientific community is
14
to verify whether once the associated toxins are ingested, they are translocating to fish
tissues and entering the food chain, and thus a concern for human consumption.
Sustainability and Management
This study has implications for fishery and wildlife management. What follows
is a discussion of the implications of the study for public policy. It is hoped that the
following types of policy makers and could benefit from an understanding of the
results (municipal and federal governments, environmental advocacy groups,
intergovernmental organizations). One suggestion to reduce the amount of unrecovered
plastic entering our waterways is to phase out the production of the more harmful plastics.
PVC, for example, is the third most produced plastic world-wide and due to the carcinogenic
monomer involved in its production it is one of the most hazardous. It is estimated that as
the global population increases, there will be another 33 billion tonnes of plastic produced
by 2050. If the most toxic, least recyclable single-use plastics were to be classified as
hazardous and replaced with more durable, safer and recoverable plastics it is estimated that
this amount could be reduced to 4 billion tonnes (Browne and Rochman 2013). The phasing
out of toxic and problematic plastics will force producers to adopt a closed-loop system
where plastics would be continuously reused. A cradle-to-cradle approach promotes an
extended producer responsibility through the consideration of the total life-cycle assessment
of a plastic, and the appreciation of the total costs, from production to disposal, incurred.
Furthermore, asides from the detrimental effects to the environment, cities and local
governments have historically borne the cost associated with the end of life cycle of
throwaway plastics. A total of 288 million tonnes of plastic was generated globally in 2013,
and 32 million tonnes of plastic waste were generated in 2012 in the United States, of which
14 million tonnes was containers and packaging. Only nine percent of the total plastic waste
generated was recovered for recycling (EPA 2014). Just three percent of the 87 million
15
tonnes of municipal solid waste (MSW) recovered in the United States in 2012 was plastic.
Though the growth of recycling has increased since 1990, only 14% of plastic containers
and packaging were recycled in 2013. The most recycled plastics are plastic bottles made of
polyethylene terephthalate (PET; 31% recycled) and high density polyethylene (HDPE; 28%
recycled). The numbers are even less impressive in Texas, where of the 1.2 million tonnes
(0.8%) of plastic material reported as diverted from MSW facilities.
Like many anthropogenic effects, the issue of plastic pollution and microplastic
contamination of fauna is recognized as problematic. However, sufficient action and
prevention are yet to be put into place. Though there is no international regulation
surrounding plastic production, there are those that recognize the extent to which plastic
pollution poses a threat to our environment. An outcome of the Fifth International Marine
Debris Conference (5IMDC) was the Honolulu Strategy, a framework for a comprehensive
and global effort to reduce the ecological, human health, and economic impacts of marine
debris globally (NOAA and UNEP 2011). Though not intending to impose regulations on
the international community, the framework goal is to improve collaboration and
coordination among concerned stakeholders across the globe, employing strategies to reduce
land-based sources of marine debris, such as education of solid waste management and
minimization, as well as regular cleanups of coastal watersheds and waterways.
On a more local level, City of Austin, Texas, has adopted the goal of becoming Zero
Waste and has put a Universal Recycling Ordinance (URO) in place, setting October 2017
as a deadline by which all residential and commercial properties will be required to provide
recycling services to their tenants and employees. Banning plastic shopping bags is another
measure Austin has taken to reach the overall 2040 deadline to divert 90% of MSW from the
landfill. The reduction of the ecologic and economic impacts from plastic pollution is being
increasingly addressed on both a local and global scale. Aggressive goals like those

16
aforementioned are needed, without which as the population in Texas and globally rapidly
increases the incidence of plastic pollution and microplastics finding their way into the
rivers, streams and oceans will become more prolific.

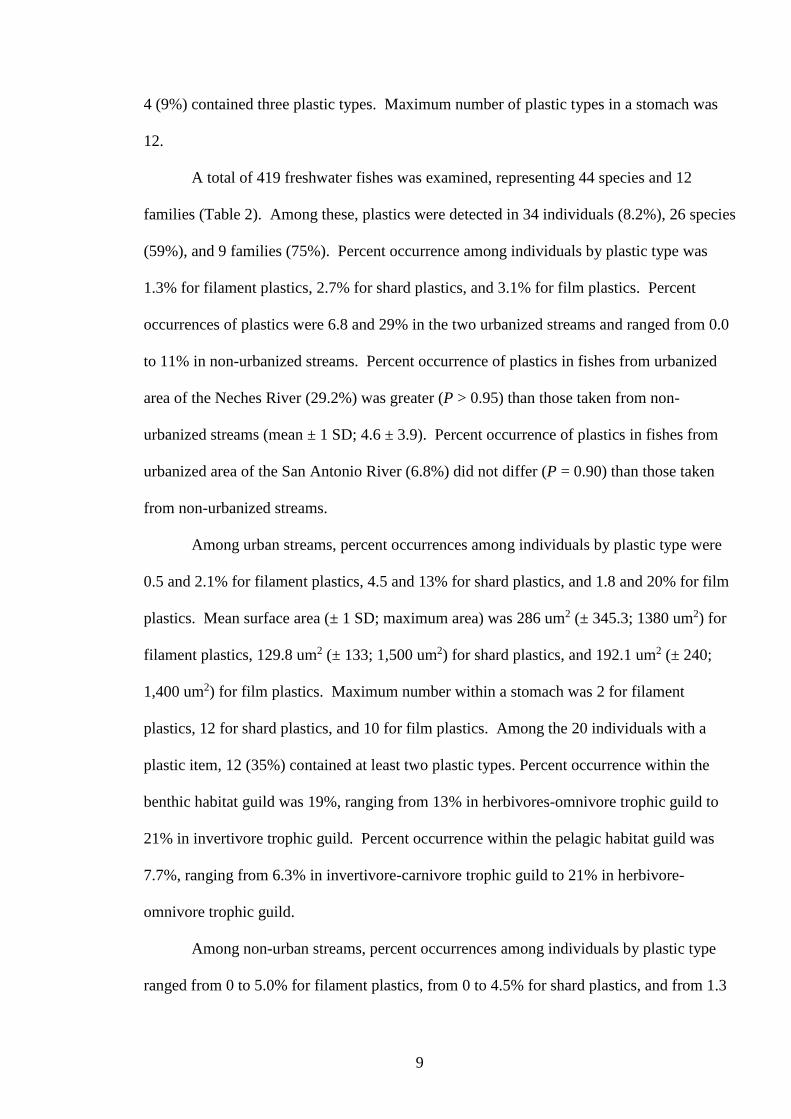
Table 1. Species, number, and maximum (max) sizes of individuals examined from 10 sites and nine freshwater drainages of Texas and the
Laguna Madre, an estuary along the southeast coast of Texas. Symbols: F = freshwater, M = marine, x = occurrence of plastic.
Family Species Common name Max Length (mm) Site N Plastic Present
Clupeidae Brevoortia patronus Gulf Menhaden 83 F 9
Dorosoma cepedianum Gizzard Shad 40 F 16 x
Dorosoma petenense Threadfin Shad 81 F 5 x
Cyprinidae Campostoma anomalum Central Stoneroller 90 F 31 x
Cyprinella lepida Plateau Shiner 71 F 5
Cyprinella lutrensis Red Shiner 62 F 67 x
Cyprinella venusta Blacktail Shiner 79 F 38 x
Notemigonus crysoleucas Golden Shiner 88 F 7
Notropis amabilis Texas Shiner 63 F 16 x
Notropis volucellus Mimic Shiner 60 F 32 x
Opsopoeodus emiliae Pugnose Minnow 58 F 2
Pimephales promelas Fathead Minnow 68 F 1
Pimephales vigilax Bullhead Minnow 89 F 3 x
Notropis sabinae Sabine Shiner 62 F 12 x
Notropis stramineus Sand Shiner 49 F 7 x
Catostomidae Erimyzon oblongus Creek Chubsucker 75 F 1
Minytrema melanops Spotted Sucker 100 F 1
Characidae Astyanax mexicanus Mexican Tetra 85 F 12 x
Ictaluridae Ameiurus melas Black Bullhead 61 F 1
Ameiurus natalis Yellow Bullhead 55 F 7 x
Ictalurus punctatus Channel Catfish 98 F 10 x
Noturus gyrinus Tadpole Madtom 64 F 2 x
Mugilidae Mugil Cephalus Striped Mullet 75 F 9
Fundulidae Fundulus notatus Blackstripe Topminnow 70 F 2 x
17

Table 1 continued
Family Species Common name Max Length (mm) Site N Plastic Present
Poeciliidae
Centrarchidae
Gambusia affinis
Lepomis auritus
Western Mosquitofish
Redbreast Sunfish
53
118
F
F
5
8
x
x
Lepomis cyanellus Green Sunfish 142 F 6 x
Lepomis gulosus Warmouth 85 F 1
Lepomis humilis Orangespotted Sunfish 42 F 4 x
Lepomis macrochirus Bluegill 120 F 12 x
Lepomis megalotis Longear Sunfish 120 F 23 x
Lepomis microlophus Redear Sunfish 200 F 5 x
Lepomis miniatus Redspotted Sunfish 105 F 6
Micropterus punctatus Spotted Bass 116 F 1
Micropterus salmoides Largemouth Bass 145 F 12 x
Pomoxis annularis White Crappie 75 F 4
Pomoxis nigromaculatus Black Crappie 250 F 3
Percidae Etheostoma artesiae Redspot Darter 53 F 11 x
Carangidae Caranx hippos Crevalle Jack 84 F 9
Lutjanidae Lutjanus campechanus Red Snapper 635 M 2 x
Lutjanus griseus Mangrove Snapper 213 M 5 x
Sparidae Lagodon rhomboides Pinfish 248 M 48 x
Sciaenidae Pogonias cromis Black Drum 654 M 1
Micropogonias undulatus Atlantic Croaker 175 M 1
Sciaenops ocellatus Redfish 702 M 28 x
Cynoscion nebulosus Spotted Seatrout 654 M 20 x
Cichlidae Herichthys cyanoguttatus Rio Grande Cichlid 127 F 6 x
18
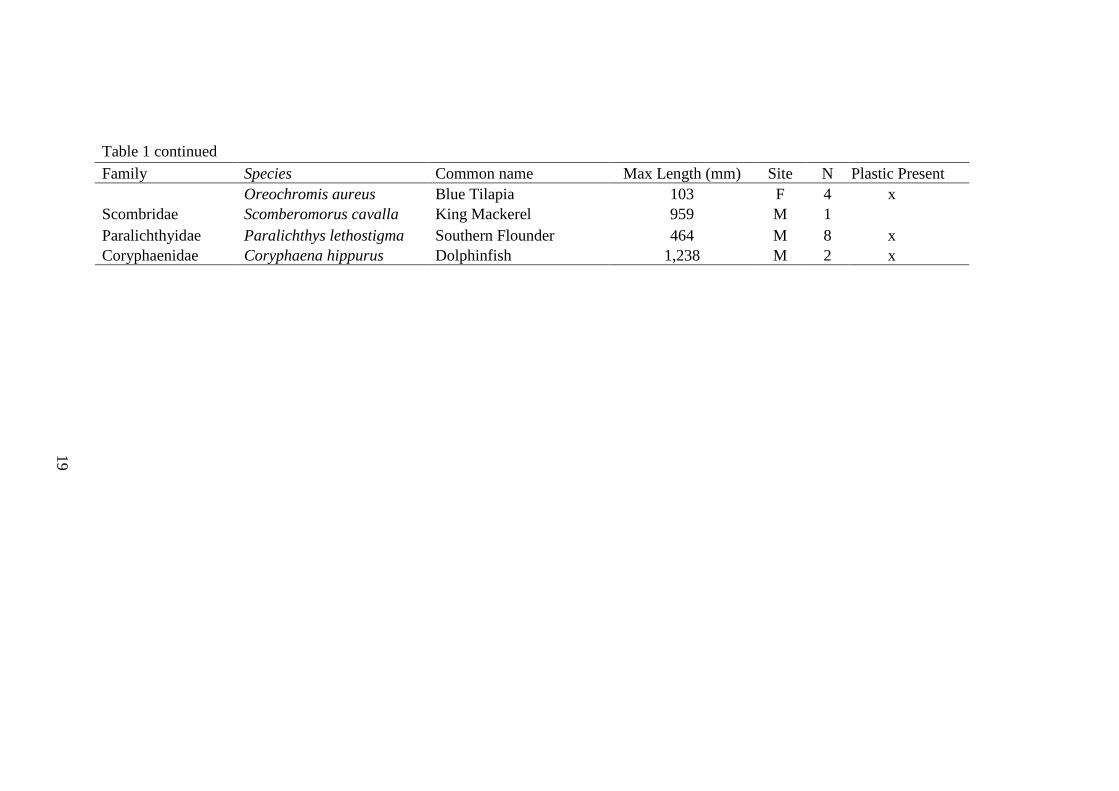
Table 1 continued
Family Species Common name Max Length (mm) Site N Plastic Present
Oreochromis aureus Blue Tilapia 103 F 4 x
Scombridae Scomberomorus cavalla King Mackerel 959 M 1
Paralichthyidae Paralichthys lethostigma Southern Flounder 464 M 8 x
Coryphaenidae Coryphaena hippurus Dolphinfish 1,238 M 2 x
19

20
Table 2. Percent occurrences and types of microplastic ingestion in freshwater
habitats, amongst urbanized and non-urbanized streams, and trophic guilds, taken
from 10 sites and nine freshwater drainages of Texas. Symbols: herb = herbivore,
omn = omnivore, invert = invertivore, carn = carnivore.
Total % % of fish with a plastic type*
N of total Filament Shard Film
Freshwater Fishes 419 8.1 1.9 3.6 3.9
Urbanized Streams
Neches River 41 29.2 0.5 13.1 20.1
San Antonio River 119 6.8 2.1 4.5 1.8
Benthic 63 19.0 2.3 10.1 10.7
invert/carn 9 16.8 3.7 12.0 4.8
invertivore 40 21.2 0.9 10.7 15.1
herb/omn 14 13.0 4.5 5.4 4.4
Pelagic 91 7.7 1.2 3.6 3.4
invert/carn 7 6.3 6.3
invertivore 84 7.8 0.8 4.0 3.7
herb/omn 6 21.0 3.2 17.9 8.5
Non-urbanized Streams
Brazos River 100 3.7 0.9 1.5 1.3
Colorado River 11 3.9 3.9
Nueces River 73 4.4 1.5 3.2
Red River 61 10.8 5.0 4.5 3.0
Rio Grande 14 0
Benthic 113 5.9 2.7 1.7 2.4
invert/carn 10 7.5
7.5
invertivore 88 7.2 2.5 4.8 1.1
herb/omn 15 5.9 17.8
Pelagic 151 5.6 1.3 2.0 2.4
invert/carn 18 2.4 2.4
invertivore 107 5.2 1.8 1.4 2.2
herb/omn 26 8.0 3.4 2.9 1.6
* Percentages do not sum to % of total because of consumption of multiple plastic types

21
Table 3. Percent occurrence and types of microplastic ingestion in marine habitats,
amongst harbour, bay and offshore fishes and trophic guilds taken from the Laguna
Madre, an estuary along the southeast coast of Texas. Symbols: invert = invertivore,
carn = carnivore.
% of fish with a plastic type*
Total N % of total Filament Shard Film
Marine Fishes 116 10.4 3.8 2.6 2.6
Harbour 54 5.9 2.9 1.9 2.8
Bay 56 13.5 6.4 4.3 4.7
Offshore 6 22.0 14.8
7.1
Benthic-Invert/car 9 11.8 7.1
6.9
Pelagic 107 10.2 5.0 3.2 3.7
carnivore 5 17.5 8.9
8.6
invert/carn 49 14.1 6.9 4.9 4.1
invertivore 53 6.0 2.9 2.0 2.9
* Percentages do not sum % of total because of consumption of multiple plastic types
22
Figure 1. Generalized locations (freshwater and marine) by drainage of fishes
harvested for gut content examination. Symbols: full circle = non-urbanized
freshwater, hollow circle = urbanized freshwater, shaded circle = marine

23
LITERATURE CITED
Barnes, D. K. A., F. Galgani, R. C. Thompson, and M. Barlaz. 2009. Accumulation
and fragmentation of plastic debris in global environments. Philosophical
transactions of the Royal Society of London. Series B, Biological sciences
(364):1985–1998.
Boerger, C. M., G. L. Lattin, S. L. Moore, and C. J. Moore. 2010. Plastic ingestion
by planktivorous fishes in the North Pacific Central Gyre. Marine Pollution
Bulletin 60(12):2275–2278.
Browne, M. A., P. Crump, S. J. Niven, E. Teuten, A. Tonkin, T. Galloway, and R.
Thompson. 2011. Accumulation of microplastic on shorelines woldwide:
Sources and sinks. Environmental Science and Technology 45(21):9175–
9179.
Browne, M. A., A. Dissanayake, T. S. Galloway, D. M. Lowe, and R. C.
Thompson. 2010a. Ingested Microscopic Plastic Translocates to the
Circulatory System of the Mussel , Mytilus edulis ( L .) 42(13):5026–5031.
Browne, M. a., T. S. Galloway, and R. C. Thompson. 2010b. Spatial patterns of
plastic debris along estuarine shorelines. Environmental Science and
Technology 44(9):3404–3409.
Browne, M. A., and C. M. Rochman. 2013. Classify plastic waste as hazardous:6–
8.
Cole, M., P. Lindeque, C. Halsband, and T. S. Galloway. 2011. Microplastics as
contaminants in the marine environment: A review. Marine Pollution Bulletin
62(12):2588–2597.
Dantas, D. V., M. Barletta, and M. F. da Costa. 2012. The seasonal and spatial
patterns of ingestion of polyfilament nylon fragments by estuarine drums
(Sciaenidae). Environmental Science and Pollution Research 19(2):600–606.
Derraik, J. G. B. 2002. The pollution of the marine environment by plastic debris :
a review. Marine Pollution Bulletin 44:842–852.
Dubaish, F., and G. Liebezeit. 2013. Suspended microplastics and black carbon
particles in the Jade system, southern North Sea. Water, Air, and Soil
Pollution 224(2):1352.
EPA. 2014. Plastics Common Wastes & Materials US EPA.
Eriksen, M., S. Mason, S. Wilson, C. Box, A. Zellers, W. Edwards, H. Farley, and
S. Amato. 2013. Microplastic pollution in the surface waters of the Laurentian
Great Lakes. Marine Pollution Bulletin 77(1-2):177–182.
Fendall, L. S., and M. a Sewell. 2009. Contributing to marine pollution by washing
your face: microplastics in facial cleansers. Marine pollution bulletin
58(8):1225–8.
24
Foekema, E. M., C. de Gruijter, M. T. Mergia, J. a van Franeker, a T. J. Murk, and
a a Koelmans. 2013. Plastic in north sea fish. Environmental science &
technology 47(15):8818–24.
Free, C. M., O. P. Jensen, S. a. Mason, M. Eriksen, N. J. Williamson, and B.
Boldgiv. 2014. High-levels of microplastic pollution in a large, remote,
mountain lake. Marine Pollution Bulletin 85(1):156–163.
Gregory, M. R. 2009. Environmental implications of plastic debris in marine
settings--entanglement, ingestion, smothering, hangers-on, hitch-hiking and
alien invasions. Philosophical transactions of the Royal Society of London.
Series B, Biological sciences 364(1526):2013–2025.
Lithner, D., A. Larsson, and G. Dave. 2011. Environmental and health hazard
ranking and assessment of plastic polymers based on chemical composition.
The Science of the total environment 409(18):3309–24.
Lusher, a. L., M. McHugh, and R. C. Thompson. 2013. Occurrence of
microplastics in the gastrointestinal tract of pelagic and demersal fish from the
English Channel. Marine Pollution Bulletin 67(1-2):94–99.
MacBride, S. 2012. Recycling reconsidered [electronic resource]: The present
failure and future promise of environmental action in the United States.
Cambridge, Mass.: MIT Press, c2012
Moore, C. J. 2008. Synthetic polymers in the marine environment: A rapidly
increasing, long-term threat. Environmental Research 108(2):131–139.
Moser, M., and D. Lee. 1992. A fourteen-year survey of plastic ingestion by
western North Atlantic seabirds. Colonial Waterbirds 15(1):83–94.
NOAA, and UNEP. 2011. The Honolulu Strategy.
PlasticsEurope. 2013. Plastics-The Facts 2013: An analysis of European latest
plastics production, demand and waste data. Pages 1–40 Octubre 2013. Plastic
Europe.
Possatto, F. E., M. Barletta, M. F. Costa, J. a. Ivar do Sul, and D. V. Dantas. 2011.
Plastic debris ingestion by marine catfish: An unexpected fisheries impact.
Marine Pollution Bulletin 62(5):1098–1102.
Rochman, C. M. 2013. Plastics and priority pollutants: A multiple stressor in
aquatic habitats. Environmental Science and Technology 47(6):2439–2440.
Rochman, C. M., E. Hoh, T. Kurobe, and S. J. Teh. 2013. Ingested plastic transfers
hazardous chemicals to fish and induces hepatic stress. Scientific reports
3:3263.
Sanchez, W., C. Bender, and J. M. Porcher. 2014. Wild gudgeons (Gobio gobio)
from French rivers are contaminated by microplastics: preliminary study and
first evidence. Environmental research 128:98–100.

25
Teuten, E. L., J. M. Saquing, D. R. U. Knappe, M. a Barlaz, S. Jonsson, A. Björn,
S. J. Rowland, R. C. Thompson, T. S. Galloway, R. Yamashita, D. Ochi, Y.
Watanuki, C. Moore, P. H. Viet, T. S. Tana, M. Prudente, R.
Boonyatumanond, M. P. Zakaria, K. Akkhavong, Y. Ogata, H. Hirai, S. Iwasa,
K. Mizukawa, Y. Hagino, A. Imamura, M. Saha, and H. Takada. 2009.
Transport and release of chemicals from plastics to the environment and to
wildlife. Philosophical transactions of the Royal Society of London. Series B,
Biological sciences 364(1526):2027–45.
Thompson, R. C., Y. Olsen, R. P. Mitchell, A. Davis, S. J. Rowland, A. W. G.
John, D. McGonigle, and A. E. Russell. 2004. Lost at sea: where is all the
plastic? Science (New York, N.Y.) 304(5672):838.
Witherington, B., S. Hirama, and R. Hardy. 2012. Young sea turtles of the pelagic
Sargassum-dominated drift community: habitat use, population density, and
threats. Marine Ecology Progress Series 463:1–22.