the nutrition for sport knowledge questionnaire (nskq ...€¦ · the nutrition for sport knowledge...
TRANSCRIPT
Trakman et al. Journal of the International Society of Sports Nutrition (2017) 14:26 DOI 10.1186/s12970-017-0182-y
RESEARCH ARTICLE Open Access
The nutrition for sport knowledgequestionnaire (NSKQ): development andvalidation using classical test theory andRasch analysis
Gina Louise Trakman1*, Adrienne Forsyth1, Russell Hoye2 and Regina Belski1,3Abstract
Background: Appropriate dietary intake can have a significant influence on athletic performance. There is a growingconsensus on sports nutrition and professionals working with athletes often provide dietary education. However, dueto the limitations of existing sports nutrition knowledge questionnaires, previous reports of athletes’ nutrition knowledgemay be inaccurate.
Methods: An updated questionnaire has been developed based on a recent review of sports nutrition guidelines. Thetool has been validated using a robust methodology that incorporates relevant techniques from classical test theory (CTT)and Item response theory (IRT), namely, Rasch analysis.
Results: The final questionnaire has 89 questions and six sub-sections (weight management, macronutrients,micronutrients, sports nutrition, supplements, and alcohol). The content and face validity of the tool havebeen confirmed based on feedback from expert sports dietitians and university sports students, respectively.The internal reliability of the questionnaire as a whole is high (KR = 0.88), and most sub-sections achieved anacceptable internal reliability. Construct validity has been confirmed, with an independent T-test revealing asignificant (p < 0.001) difference in knowledge scores of nutrition (64 ± 16%) and non-nutrition students(51 ± 19%). Test-retest reliability has been assured, with a strong correlation (r = 0.92, p < 0.001) betweenindividuals’ scores on two attempts of the test, 10 days to 2 weeks apart. Three of the sub-sections fit theRasch Unidimensional Model.
Conclusions: The final version of the questionnaire represents a significant improvement over previous tools. Eachnutrition sub-section is unidimensional, and therefore researchers and practitioners can use these individually, asrequired. Use of the questionnaire will allow researchers to draw conclusions about the effectiveness of nutritioneducation programs, and differences in knowledge across athletes of varying ages, genders, and athletic calibres.
Keywords: Nutrition knowledge, Sports nutrition, Questionnaire, Measure, Valid, Classical test theory, Rasch analysis
* Correspondence: [email protected] of Rehabilitation, Nutrition and Sport, School of Allied Health,College of Science, Health and Engineering, La Trobe University, Melbourne3086, AustraliaFull list of author information is available at the end of the article
© The Author(s). 2017 Open Access This article is distributed under the terms of the Creative Commons Attribution 4.0International License (http://creativecommons.org/licenses/by/4.0/), which permits unrestricted use, distribution, andreproduction in any medium, provided you give appropriate credit to the original author(s) and the source, provide a link tothe Creative Commons license, and indicate if changes were made. The Creative Commons Public Domain Dedication waiver(http://creativecommons.org/publicdomain/zero/1.0/) applies to the data made available in this article, unless otherwise stated.
Trakman et al. Journal of the International Society of Sports Nutrition (2017) 14:26 Page 2 of 11
BackgroundAppropriate dietary intake can improve athletic per-formance, enhance adaptations to training and augmentrecovery from exercise [1, 2]. However, athletes havebeen known to consume diets that do not to meet theirenergy and nutrient needs [3], and a mismatch betweencontemporary expert recommendations and athletes’dietary practices have previously been demonstrated [4].Nutrition education programs improve nutrition know-ledge [5–7] and higher levels of knowledge are corre-lated with better diet quality [7–9]. Accordingly,professionals working with sports people often providenutrition advice [10]. Parks et al. [11] reported that thenumber of dietitians employed by collegiate athletic de-partments has quadrupled since 2010. However, globallythere is limited information regarding athletes’ access torelevant and appropriate nutrition advice; ostensibly, thismay vary according to the level of professionalism oftheir respective sport and their immediate support net-work. Hamilton et al. [12] reported that elite athletes inNew Zealand had higher levels of knowledge than non-elite athletes. In contrast, Andrews et al. [13] found nodifferences between sub-elite and elite Australian soccerplayers. Trakman et al. [14] conducted a systematic lit-erature review on nutrition knowledge of athletes andcoaches and reported a possible relationship betweenathletic calibre and knowledge. However, the authorsconcluded that due to the heterogeneity and poor qualityof Nutrition Knowledge Questionnaires (NKQ’s), ath-letes’ nutrition knowledge (and the factors that influencethis) are difficult to ascertain [0–22]. The poor quality ofNKQs is also likely to influence researchers’ ability to ac-curately quantify the correlation between knowledge anddietary intake [8, 15] and impact practitioners’ ability toevaluate nutrition education programs.Trakman et al. [14] noted that a key factor affecting
the quality of NKQs was a lack of adequate validation.The maximum validation score of a sports nutritionknowledge questionnaire (SNKQ) used with athleteswas three out of six. More recently, Furber et al. [16]developed an SNKQ for British track and field athletesundertaking four of the six recommended validationmethods; face validity testing and item analysis werenot performed. Of note, the rating system used byTrakman et al. [14] was based solely on classical testtheory (CTT). The CTT framework focuses on thequestionnaire as a whole. It is based on correlationsand assumes that all questions are equal indicators ofan individual’s nutrition knowledge [17]. A key aspectof CTT is the use of the Cα statistic to measure in-ternal reliability; however, Cα is only suitable for scaleswith 20 or fewer items and is frequently incorrectlyused on much longer questionnaires [18]. Moreover, itis not an inherent property of a questionnaire and
needs to be re-assessed each time a new sample com-pletes the tool [18].An alternative to CTT is Rasch analysis. Rasch analysis
is a technique that was first developed in education, hasbeen utilised to develop psychological assessment tools[19] and health related patient-reported outcomes (HR-PRO) [12, 20], and more recently has been utilised tovalidate questionnaires that assess knowledge of the en-ergy content of meals and balanced meals [21, 22]. Raschanalysis offers several advantages over CTT; it allowsshorter scales with multiple response formats to be de-veloped, and because it does not rely on measures ofcentral tendency, it is said to be more ‘stable’ acrossvarying populations [23]. The aim of Rasch analysis is tocreate a unidimensional (i.e. assessing one concept)questionnaire. During Rasch analysis it is necessary totest that the questionnaire concurs with the assumptionsthat (1) difficult items are less likely to be answered cor-rectly, and (2) individuals with higher levels of know-ledge are more likely to answer questions correctly.These expectations are tested by assessing a range ofstatistics which provide feedback on: the differences be-tween observed and expected responses; whether the dif-ficulty of items is consistent across participants (i.e.whether items are good at discriminating between well-scoring and poor-scoring respondents); and whetheritems are answered consistently on the basis of partici-pant characteristics, such as age and gender. The presentstudy will use a novel method that evaluates items basedboth on CTT and Rasch analysis. To our knowledge, noSNKQ has been validated using Rasch analysis.In addition to issues pertaining to validation, many
existing SNKQs have problems with their actual content.While 13 (out of 36) studies in the review by Trakmanet al. [14] covered 75% of the nutrition sub-sections thatwere deemed relevant, the comprehensiveness assessmentwas limited because the researchers did not assess theextent to which each topic was assessed or the quality ofindividual items. Indeed, many items appear to test out-dated dietary recommendations that are not in line withrecently published guidelines such as the AmericanCollege of Sports Medicine (ACSM), the InternationalOlympic Committee (IOC), and the International Societyfor Sports Nutrition (ISSN) review on Sport Nutrition[24] and the multiple ISSN, IOC review papers and con-sensus statements on nutrition and athletic performance[1, 2, 25–33]. As above, current guidelines expound thatcarefully choosing the amount, type and timing of foodsand fluids will optimise an athlete’s adaptations to train-ing, performance outcomes, and recovery from exercise.They emphasise the importance of individualising nutri-tion, especially with regards to carbohydrate intake andhydration, and acknowledge that some supplements (e.g.creatine, caffeine, and bicarbonate) can enhance athletes’
Trakman et al. Journal of the International Society of Sports Nutrition (2017) 14:26 Page 3 of 11
performance, but encourage a prudent approach to sup-plementation [1, 2, 25, 26, 34]. The present study hasbased questions on these recommendations.Further to the issues pertaining to the quality and con-
tent of existing SNKQ’s, many tools have limited culturalapplicability and/or focus on measuring the knowledgeof a single sport. This limits the ability of tools to beused to compare knowledge of athletes from differentcountries and knowledge of athletes between sports.The aim of this study was to address the deficiencies
in existing SNKQ’s by developing a new SNKQ that:
(1)Has been validated using a robust methodology thatincludes both CTT techniques and Rasch analysis
(2)Assesses knowledge of current consensusrecommendations on sports nutrition
(3)Assesses knowledge of all relevant aspects of sportsnutrition and is generalizable to multiple sports
(4)Is likely to be understood by individuals fromvarious cultural backgrounds
It was hypothesized that the questionnaire would rep-resent a significant improvement on currently availablemeasures. From a research perspective, a high-qualitynutrition knowledge measure will allow for more accur-ate assessment of factors that influence knowledge and amore a more reliable assessment of the impact of nutri-tion knowledge on diet quality. Moreover, for individualsworking with athletes, a quality measure is likely to havepractical implications, allowing for the evaluation of nu-trition education programs and therefore developmentof more targeted education strategies that are based ongaps in knowledge.
MethodsEthics approval and consent to participateThe research was approved (S16/267) by the La TrobeUniversity’s SHE College Human Ethics Sub-Committee(SHE CHESC). Participants in the expert panel reviewand think-out-loud focus groups read the Participant In-formation Statement and signed the Consent Form. Par-ticipants who were involved in steps six to eight read theParticipant Information Statement and provided consentelectronically.
Novel eight-step validation processA novel eight-step validation method for the develop-ment of a nutrition knowledge questionnaire was de-signed based on an extensive review of the literature andused to validate this questionnaire [35]. The steps in-clude: (1) Definition of Sports Nutrition Knowledge (2)Generation of items to represent sports nutrition know-ledge (3) Choice of scoring system (4) Assessment ofcontent validity by panel of experts (5) Assessment of
face validity by student athletes (6) CTT analysis: Re-moval of items on the basis of item difficulty, item dis-crimination and distractor utility (7) Rasch analysis:Assessment of dimensionality and removal of item onthe basis of not meeting assumptions that difficult ques-tions are less likely to be answered correctly, and well-scoring participants are more likely to answer individualitems correctly (8) Assessment of construct validity bycomparing nutrition and non-nutrition students; assess-ment of test-retest reliability (consistency over time) byassessing correlation of test on two attempts; and re-checking of steps six and seven. The steps that make thismethodology novel are the quantitative assessment ofcontent validity, the assessment of distractor utility (howfeasible incorrect multiple choice options are) and theinclusion of Rasch analysis.Figure 1 provides a summary of the methods and
results.
RecruitmentExperts (step four) were recruited using purposive sam-pling between April and May 2016 and student-athletes(step five) were recruited using convenience sampling inJune 2016. For steps six and seven, Australian FootballLeague (AFL) Victoria community football players, LaTrobe University student-athletes and other recreationalathletes were invited to complete the questionnaire viaemail, Facebook groups, and online athlete forums. Datacollection occurred between July 2016 and October2016. For step eight, La Trobe University undergraduateand postgraduate business, health science and nutritionstudents were recruited via email and their LearningManagement System (LMS) notice boards and recre-ational athletes were invited to participate via email andtheir team Facebook pages. Data collection took placefrom November 2016 until January 2017.
Sample size calculationsTo calculate a CVI (step four) three to 10 experts areneeded [36]. The ideal number of participants for focusgroups (step five) are six to 10 [37]. Parmenter et al.[38] recommend that to carry out CTT analysis at leastone more person than the number of items are re-quired. Pallant [23] recommends that to carry outRasch analysis, 240 participants are ideal. At steps 6and 7, the questionnaire had 178 items; a target of 200participants was set to account for both the CTT andRasch estimates. For step eight, a power analysis for anindependent sample t-test was conducted in G-POWERto determine a sufficient sample size using an alpha of0.05, a power of 0.80, a large effect size (d = 0.8), andtwo tails. Based on these assumptions, the desired sam-ple size for each group (nutrition versus non-nutritionstudents) was 51 [39, 40].
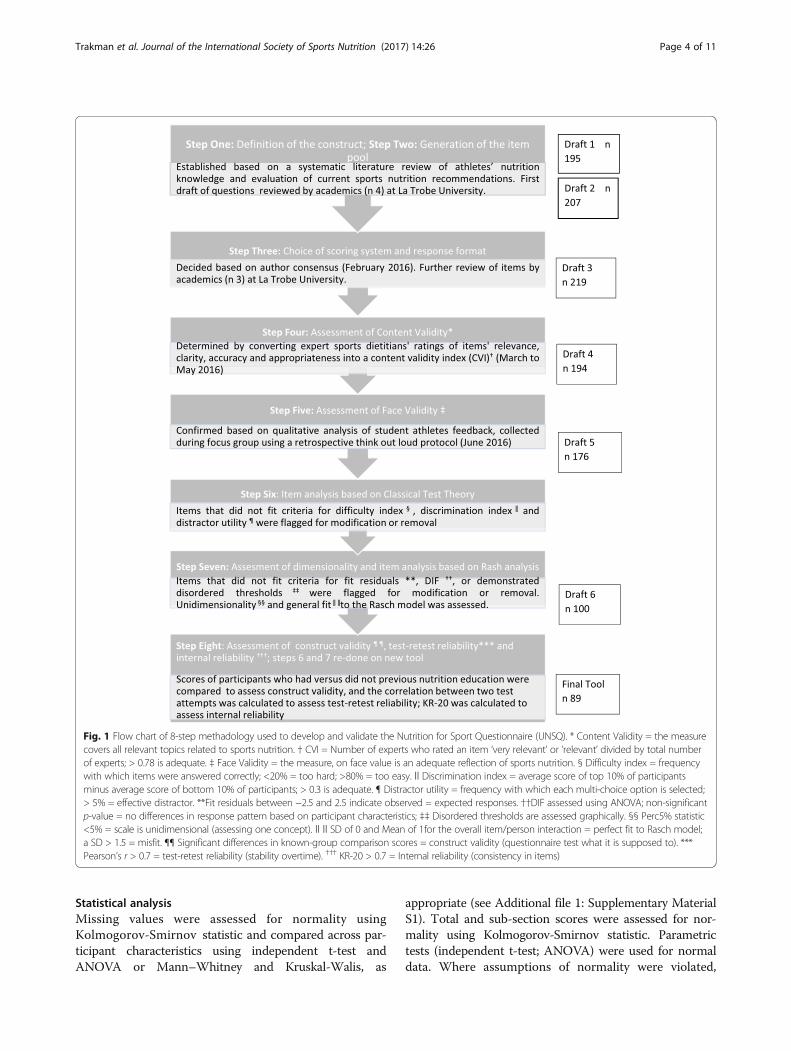
Fig. 1 Flow chart of 8-step methadology used to develop and validate the Nutrition for Sport Questionnaire (UNSQ). * Content Validity = the measurecovers all relevant topics related to sports nutrition. † CVI = Number of experts who rated an item ‘very relevant’ or ‘relevant’ divided by total numberof experts; > 0.78 is adequate. ‡ Face Validity = the measure, on face value is an adequate reflection of sports nutrition. § Difficulty index = frequencywith which items were answered correctly; <20% = too hard; >80% = too easy. ǁ Discrimination index = average score of top 10% of participantsminus average score of bottom 10% of participants; > 0.3 is adequate. ¶ Distractor utility = frequency with which each multi-choice option is selected;> 5% = effective distractor. **Fit residuals between −2.5 and 2.5 indicate observed = expected responses. ††DIF assessed using ANOVA; non-significantp-value = no differences in response pattern based on participant characteristics; ‡‡ Disordered thresholds are assessed graphically. §§ Perc5% statistic<5% = scale is unidimensional (assessing one concept). ǁ ǁ SD of 0 and Mean of 1for the overall item/person interaction = perfect fit to Rasch model;a SD > 1.5 = misfit. ¶¶ Significant differences in known-group comparison scores = construct validity (questionnaire test what it is supposed to). ***Pearson’s r > 0.7 = test-retest reliability (stability overtime). ††† KR-20 > 0.7 = Internal reliability (consistency in items)
Trakman et al. Journal of the International Society of Sports Nutrition (2017) 14:26 Page 4 of 11
Statistical analysisMissing values were assessed for normality usingKolmogorov-Smirnov statistic and compared across par-ticipant characteristics using independent t-test andANOVA or Mann–Whitney and Kruskal-Walis, as
appropriate (see Additional file 1: Supplementary MaterialS1). Total and sub-section scores were assessed for nor-mality using Kolmogorov-Smirnov statistic. Parametrictests (independent t-test; ANOVA) were used for normaldata. Where assumptions of normality were violated,
Trakman et al. Journal of the International Society of Sports Nutrition (2017) 14:26 Page 5 of 11
non-parametric tests (Mann–Whitney U test; Kruskal-Wallis) were used. Normal results were reported asmean ± SD, non-normal results were reported as medianand IQR. For correlations, Pearson’s r was used for para-metric data, and Spearman’s r was used for non-parametric data. Individuals with and without nutritioneducation were compared across participant characteris-tics using chi-square test, to account for potential con-founding. Differences in scores based on age, gender,country of birth, level of education, and history of play-ing sports were also assessed.
ResultsParticipantsTen experts were invited to be involved in the contentvalidity assessment. Six sports dietitians agreed to par-ticipate and three of these returned feedback forms; tworespondents were Australian and the other was Swiss.They worked in private consultancy, research and educa-tion, and industry. Eight students participated in theretrospective think-out-loud focus group. One studentwho was unable to attend the session met with the re-searcher on a separate occasion. For the item analysisbased on CTT and Rasch scaling (steps six and seven),462 athletes started the questionnaire; after excludingdata with more than 11% missing values (n = 259) andparticipants who did not meet the eligibility criteria forage (n = 15) there were 188 usable responses (Table 1).For the assessment of construct validity, test-retest reli-ability and re-evaluation of CTT and Rasch parameters(step eight), 287 students and athletes started the ques-tionnaire and there were 181 usable responses, including28 responses from individuals who had completed thequestionnaire on two occasions (Table 2).There did not appear to be any differences between indi-
viduals who completed and did not complete the question-naire (See Additional file 1: Supplementary Material S2).Individuals who studied nutrition were more likely to
be female, have a tertiary education and were younger(See Additional file 1: Supplementary Material S3).
The final questionnaireSports nutrition knowledge was defined as “Knowledgeof concepts and processes related to nutrition for optimalathletic performance including knowledge of weight man-agement; hydration and fuelling strategies for before, dur-ing and after training/performance; supplementation andalcohol use”. The original test plan (see Additional file 1:Supplementary Material S3) follows logically from this.Each correct answer was awarded a point. The finalquestionnaire had 89 items and six unidimensional sub-sections; weight management (n = 13); macronutrients(n = 30); micronutrients (n = 13); sports nutrition(n = 13); supplements (n = 12) and alcohol (n = 8). The
sports nutrition section covers hydration, the pre-completion meal, nutrition during exercise and recoverynutrition. The item response formats include agree/dis-agree/not sure, multiple choice, and effective/not effect-ive/not sure. The questionnaire is designed to beadministered online and includes pictures to reduce re-sponder fatigue. The number of items at each stage ofvalidation is represented in Fig. 1.
ValidityThe experts reported that the questionnaire covered allrelevant topics and therefore content validity was con-firmed (step four). Most items that were rated poorly foraccuracy, relevance, appropriateness and clarity were re-moved (n = 25) although some exceptions were made.The number of items that did not meet the CVI andexamples of changes made based on expert’s feedback areincluded as Additional file 1: Supplementary Material S4.Student athletes were able to identify what each section
was attempting to capture. Where there were issues withwording of questions, items were removed (n = 17) ormodified (n = 16), so face validity was confirmed (step five).Examples of changes made based on students’ feedback areincluded as Additional file 1: Supplementary Material S5.Construct validity was demonstrated (step eight) be-
cause there was a significant difference in the totalscores for those who had nutrition education and thosewho did not have nutrition education (P < 0.001) (Table 3).Individuals with nutrition education also scored betteracross all sub-sections except alcohol (Table 3). No otherparticipant characteristics were found to have a significanteffect on scores (See Additional file 1: SupplementaryMaterial S6).Internal reliability of sub-sections ranged from 0.51 to
0.78 (Table 3). All sections except alcohol achieved orapproached adequate values for internal reliability giventhe number of items in each sub-section. Test re-test re-liability ranged from 0.35 to 0.81; all sections except sup-plementation achieved or approached adequate valuesfor test-retest reliability (Table 3).
Item analysis based on CTTItem analysis using CTT was carried out at steps 7 and8. Most items that did not meet the criteria for item dif-ficulty, item discrimination and distractor utility were re-moved or modified, although some exceptions weremade, and the final tool included 15 items that did notmeet these criteria. Examples of changes made on thebasis of item analysis are included as Additional file 1:Supplementary Materials S7 and S8.
Fit to the rash modelBased on the Rasch analysis conducted on the tool ad-ministered at step eight, the questionnaire as a whole
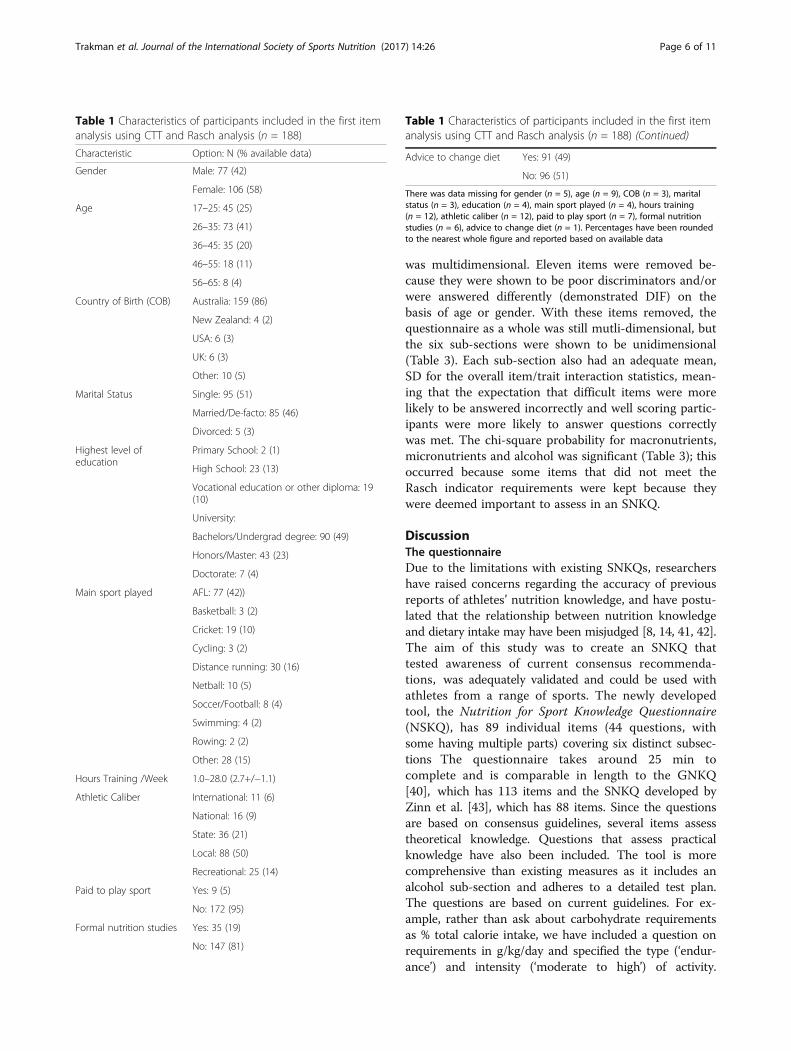
Table 1 Characteristics of participants included in the first itemanalysis using CTT and Rasch analysis (n = 188)
Characteristic Option: N (% available data)
Gender Male: 77 (42)
Female: 106 (58)
Age 17–25: 45 (25)
26–35: 73 (41)
36–45: 35 (20)
46–55: 18 (11)
56–65: 8 (4)
Country of Birth (COB) Australia: 159 (86)
New Zealand: 4 (2)
USA: 6 (3)
UK: 6 (3)
Other: 10 (5)
Marital Status Single: 95 (51)
Married/De-facto: 85 (46)
Divorced: 5 (3)
Highest level ofeducation
Primary School: 2 (1)
High School: 23 (13)
Vocational education or other diploma: 19(10)
University:
Bachelors/Undergrad degree: 90 (49)
Honors/Master: 43 (23)
Doctorate: 7 (4)
Main sport played AFL: 77 (42))
Basketball: 3 (2)
Cricket: 19 (10)
Cycling: 3 (2)
Distance running: 30 (16)
Netball: 10 (5)
Soccer/Football: 8 (4)
Swimming: 4 (2)
Rowing: 2 (2)
Other: 28 (15)
Hours Training /Week 1.0–28.0 (2.7+/−1.1)
Athletic Caliber International: 11 (6)
National: 16 (9)
State: 36 (21)
Local: 88 (50)
Recreational: 25 (14)
Paid to play sport Yes: 9 (5)
No: 172 (95)
Formal nutrition studies Yes: 35 (19)
No: 147 (81)
Table 1 Characteristics of participants included in the first itemanalysis using CTT and Rasch analysis (n = 188) (Continued)
Advice to change diet Yes: 91 (49)
No: 96 (51)
There was data missing for gender (n = 5), age (n = 9), COB (n = 3), maritalstatus (n = 3), education (n = 4), main sport played (n = 4), hours training(n = 12), athletic caliber (n = 12), paid to play sport (n = 7), formal nutritionstudies (n = 6), advice to change diet (n = 1). Percentages have been roundedto the nearest whole figure and reported based on available data
Trakman et al. Journal of the International Society of Sports Nutrition (2017) 14:26 Page 6 of 11
was multidimensional. Eleven items were removed be-cause they were shown to be poor discriminators and/orwere answered differently (demonstrated DIF) on thebasis of age or gender. With these items removed, thequestionnaire as a whole was still mutli-dimensional, butthe six sub-sections were shown to be unidimensional(Table 3). Each sub-section also had an adequate mean,SD for the overall item/trait interaction statistics, mean-ing that the expectation that difficult items were morelikely to be answered incorrectly and well scoring partic-ipants were more likely to answer questions correctlywas met. The chi-square probability for macronutrients,micronutrients and alcohol was significant (Table 3); thisoccurred because some items that did not meet theRasch indicator requirements were kept because theywere deemed important to assess in an SNKQ.
DiscussionThe questionnaireDue to the limitations with existing SNKQs, researchershave raised concerns regarding the accuracy of previousreports of athletes’ nutrition knowledge, and have postu-lated that the relationship between nutrition knowledgeand dietary intake may have been misjudged [8, 14, 41, 42].The aim of this study was to create an SNKQ thattested awareness of current consensus recommenda-tions, was adequately validated and could be used withathletes from a range of sports. The newly developedtool, the Nutrition for Sport Knowledge Questionnaire(NSKQ), has 89 individual items (44 questions, withsome having multiple parts) covering six distinct subsec-tions The questionnaire takes around 25 min tocomplete and is comparable in length to the GNKQ[40], which has 113 items and the SNKQ developed byZinn et al. [43], which has 88 items. Since the questionsare based on consensus guidelines, several items assesstheoretical knowledge. Questions that assess practicalknowledge have also been included. The tool is morecomprehensive than existing measures as it includes analcohol sub-section and adheres to a detailed test plan.The questions are based on current guidelines. For ex-ample, rather than ask about carbohydrate requirementsas % total calorie intake, we have included a question onrequirements in g/kg/day and specified the type (‘endur-ance’) and intensity (‘moderate to high’) of activity.
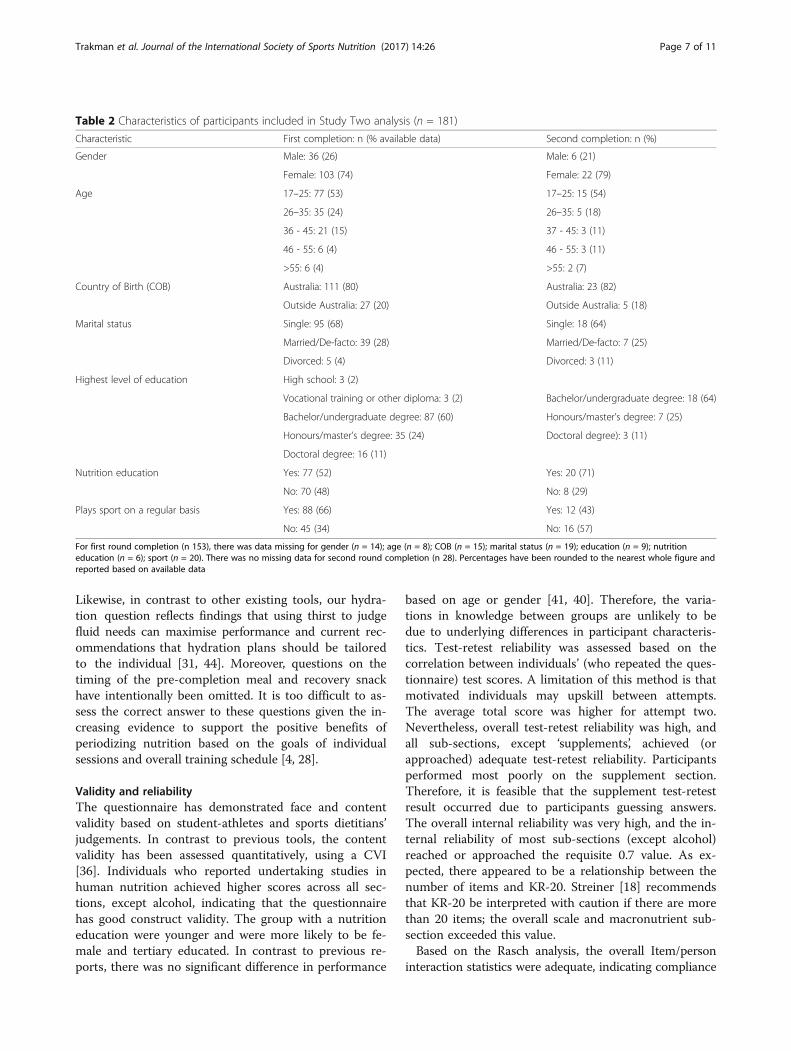
Table 2 Characteristics of participants included in Study Two analysis (n = 181)
Characteristic First completion: n (% available data) Second completion: n (%)
Gender Male: 36 (26) Male: 6 (21)
Female: 103 (74) Female: 22 (79)
Age 17–25: 77 (53) 17–25: 15 (54)
26–35: 35 (24) 26–35: 5 (18)
36 - 45: 21 (15) 37 - 45: 3 (11)
46 - 55: 6 (4) 46 - 55: 3 (11)
>55: 6 (4) >55: 2 (7)
Country of Birth (COB) Australia: 111 (80) Australia: 23 (82)
Outside Australia: 27 (20) Outside Australia: 5 (18)
Marital status Single: 95 (68) Single: 18 (64)
Married/De-facto: 39 (28) Married/De-facto: 7 (25)
Divorced: 5 (4) Divorced: 3 (11)
Highest level of education High school: 3 (2)
Vocational training or other diploma: 3 (2) Bachelor/undergraduate degree: 18 (64)
Bachelor/undergraduate degree: 87 (60) Honours/master’s degree: 7 (25)
Honours/master’s degree: 35 (24) Doctoral degree): 3 (11)
Doctoral degree: 16 (11)
Nutrition education Yes: 77 (52) Yes: 20 (71)
No: 70 (48) No: 8 (29)
Plays sport on a regular basis Yes: 88 (66) Yes: 12 (43)
No: 45 (34) No: 16 (57)
For first round completion (n 153), there was data missing for gender (n = 14); age (n = 8); COB (n = 15); marital status (n = 19); education (n = 9); nutritioneducation (n = 6); sport (n = 20). There was no missing data for second round completion (n 28). Percentages have been rounded to the nearest whole figure andreported based on available data
Trakman et al. Journal of the International Society of Sports Nutrition (2017) 14:26 Page 7 of 11
Likewise, in contrast to other existing tools, our hydra-tion question reflects findings that using thirst to judgefluid needs can maximise performance and current rec-ommendations that hydration plans should be tailoredto the individual [31, 44]. Moreover, questions on thetiming of the pre-completion meal and recovery snackhave intentionally been omitted. It is too difficult to as-sess the correct answer to these questions given the in-creasing evidence to support the positive benefits ofperiodizing nutrition based on the goals of individualsessions and overall training schedule [4, 28].
Validity and reliabilityThe questionnaire has demonstrated face and contentvalidity based on student-athletes and sports dietitians’judgements. In contrast to previous tools, the contentvalidity has been assessed quantitatively, using a CVI[36]. Individuals who reported undertaking studies inhuman nutrition achieved higher scores across all sec-tions, except alcohol, indicating that the questionnairehas good construct validity. The group with a nutritioneducation were younger and were more likely to be fe-male and tertiary educated. In contrast to previous re-ports, there was no significant difference in performance
based on age or gender [41, 40]. Therefore, the varia-tions in knowledge between groups are unlikely to bedue to underlying differences in participant characteris-tics. Test-retest reliability was assessed based on thecorrelation between individuals’ (who repeated the ques-tionnaire) test scores. A limitation of this method is thatmotivated individuals may upskill between attempts.The average total score was higher for attempt two.Nevertheless, overall test-retest reliability was high, andall sub-sections, except ‘supplements’, achieved (orapproached) adequate test-retest reliability. Participantsperformed most poorly on the supplement section.Therefore, it is feasible that the supplement test-retestresult occurred due to participants guessing answers.The overall internal reliability was very high, and the in-ternal reliability of most sub-sections (except alcohol)reached or approached the requisite 0.7 value. As ex-pected, there appeared to be a relationship between thenumber of items and KR-20. Streiner [18] recommendsthat KR-20 be interpreted with caution if there are morethan 20 items; the overall scale and macronutrient sub-section exceeded this value.Based on the Rasch analysis, the overall Item/person
interaction statistics were adequate, indicating compliance
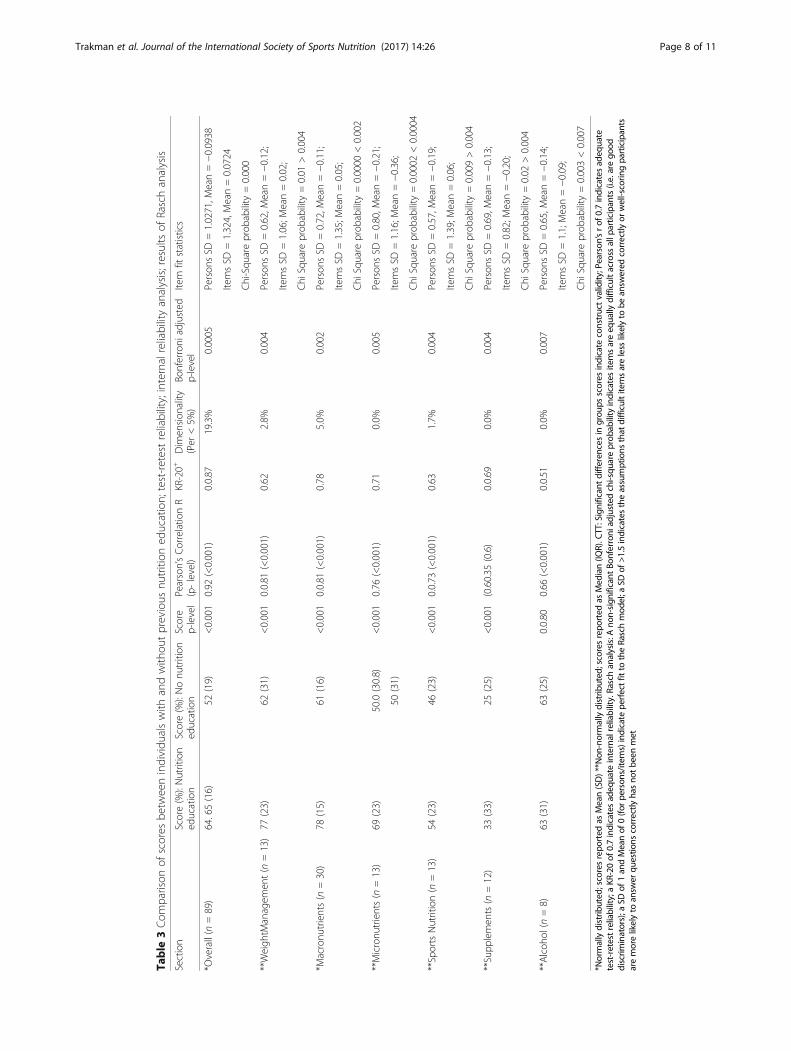
Table
3Com
parison
ofscores
betw
eenindividu
alswith
andwith
outprevious
nutrition
education;
test-retestreliability;internalreliabilityanalysis;resultsof
Raschanalysis
Section
Score(%):Nutrition
education
Score(%):Nonu
trition
education
Score
p-level
Pearson’sCorrelatio
nR
(p-level)
KR-20+
Dim
ension
ality
(Per
<5%
)Bo
nferroni
adjusted
p-level
Item
fitstatistics
*Overall(n
=89)
64.65(16)
52(19)
<0.001
0.92
(<0.001)
0.0.87
19.3%
0.0005
Person
sSD
=1.0271,M
ean=−0.0938
ItemsSD
=1.324,Mean=0.0724
Chi-Squ
areprob
ability
=0.000
**Weigh
tManagem
ent(n
=13)
77(23)
62(31)
<0.001
0.0.81
(<0.001)
0.62
2.8%
0.004
Person
sSD
=0.62,M
ean=−0.12;
ItemsSD
=1.06;M
ean=0.02;
Chi
Square
prob
ability
=0.01
>0.004
*Macronu
trients(n
=30)
78(15)
61(16)
<0.001
0.0.81
(<0.001)
0.78
5.0%
0.002
Person
sSD
=0.72,M
ean=−0.11;
ItemsSD
=1.35;M
ean=0.05;
Chi
Square
prob
ability
=0.0000
<0.002
**Micronu
trients(n
=13)
69(23)
50.0(30.8)
<0.001
0.76
(<0.001)
0.71
0.0%
0.005
Person
sSD
=0.80,M
ean=−0.21;
50(31)
ItemsSD
=1.16;M
ean=−0.36;
Chi
Square
prob
ability
=0.0002
<0.0004
**SportsNutrition(n
=13)
54(23)
46(23)
<0.001
0.0.73
(<0.001)
0.63
1.7%
0.004
Person
sSD
=0.57,M
ean=−0.19;
ItemsSD
=1.39;M
ean=0.06;
Chi
Square
prob
ability
=0.009>0.004
**Supp
lemen
ts(n
=12)
33(33)
25(25)
<0.001
(0.60.35
(0.6)
0.0.69
0.0%
0.004
Person
sSD
=0.69,M
ean=−0.13;
ItemsSD
=0.82;M
ean=−0.20;
Chi
Square
prob
ability
=0.02
>0.004
**Alcoh
ol(n
=8)
63(31)
63(25)
0.0.80
0.66
(<0.001)
0.0.51
0.0%
0.007
Person
sSD
=0.65,M
ean=−0.14;
ItemsSD
=1.1;Mean=−0.09;
Chi
Square
prob
ability
=0.003<0.007
*Normallydistrib
uted
;scoresrepo
rted
asMean(SD)**N
on-normallydistrib
uted
;scoresrepo
rted
asMed
ian(IQ
R).C
TT:Significan
tdiffe
rences
ingrou
psscores
indicate
constructvalidity;Pearson
’srof
0.7indicatesad
equate
test-retestreliability;aKR
-20of
0.7indicatesad
equate
internalreliability.Raschan
alysis:A
non-sign
ificant
Bonferroni
adjusted
chi-squ
areprob
ability
indicatesite
msareeq
ually
difficultacross
allp
articipan
ts(i.e.arego
oddiscrim
inators);a
SDof
1an
dMeanof
0(fo
rpe
rson
s/ite
ms)indicate
perfectfit
totheRaschmod
el;a
SDof
>1.5indicatestheassumptions
that
difficultite
msareless
likelyto
bean
swered
correctly
orwell-scorin
gpa
rticipan
tsaremorelikelyto
answ
erqu
estio
nscorrectly
hasno
tbe
enmet
Trakman et al. Journal of the International Society of Sports Nutrition (2017) 14:26 Page 8 of 11
Trakman et al. Journal of the International Society of Sports Nutrition (2017) 14:26 Page 9 of 11
with the expectations that difficult questions were lesslikely to be answered correctly, and individuals who per-formed well overall were more likely to answer individualquestions correctly. The questionnaire as a whole wasmulti-dimensional, but with problematic items removed,each section was shown to be unidimensional. Therefore,sections can be used independently, as required. Wherethe whole tool is used, sub-sections rather than total scoreshould be reported.All items were written so that units and food names
were generic and likely to be understood by individualsof varying cultural backgrounds; however, additionalevaluation is required to confirm the functionality of thetool in groups who differ from the present cohort. Thefact that country of birth did not influence scores, andthe use of Rasch analysis, which produces questionnairesthat are independent of the sample used for validation,give some indication that the tool is likely to also bevalid in other groups.
LimitationsA limitation of this study is that we were unable to cal-culate response rates because we distributed the ques-tionnaire using Facebook groups and online athleteforums, making total exposure unclear. The completionrates for step 7 (where item analysis and Rasch analysiswas undertaken) were relatively low (~45%), but theredid not appear to be any relationship between partici-pant characteristics (other than sport played, country ofbirth) and completion rate (S2). The completion rate forstep eight (~66%) was adequate [45]. The sample size isanother potential limitation. For step seven, there were188 responses for a 176 item measure; for step eight,there were 181 responses for a 100 item measure. Thetarget sample size for both studies was 200. However,there is some evidence to recommend that samples assmall as 30–50 are appropriate for CTT [46]. Similarly,Chen et al. [47] modelled Rasch with varying samplesizes and found that stable results can be achieved withsamples of around 100.A limitation of the questionnaire itself is that the
length may be prohibitive, especially for athletes balan-cing training and work/study who are often time-poor.In addition, some items were poor discriminators. Thiswas reflected by low item discrimination in CTT and thesignificant chi-square probability of the micronutrient,macronutrient and alcohol sections. For several ques-tions, the poor item discrimination can be explained bythe item’s relatively high or low difficulty index. That is,when a question is answered correctly (or incorrectly) bya large proportion of individuals, the overall range of re-sponses is minimal, and therefore it is hard to achieve ameaningful difference between high and low scoring in-dividuals. Many of these items were kept because they
tested important concepts, providing valuable feedbackon gaps in knowledge. Item discrimination is worth re-evaluating using larger samples of predominantly ath-letes (not including nutrition students). Likewise, futurestudies may focus on creating a short-form tool that canbe used for rapid assessment of nutrition knowledge. Ashort-form tool would be useful in research settingswhere the correlation between knowledge and other fac-tors is being assessed. A short-form tool may also haveutility in the elite setting as a ‘screening’ tool for profes-sionals working with athletes, i.e. to identify individualswho need nutrition education and extra support.At present the NSKQ has only been validated in an
Australian population. Future studies could focus on val-idation to confirm reliability and validity in other regions.
StrengthsA key advantage of the questionnaire is that it has beenvalidated using a robust methodology. To our know-ledge, this is one of very few NKQ to be assessed againstthe Rasch Model. Likewise, it is the only tool to assesscontent validity qualitatively and to assess distractor util-ity - a distractor that is too obviously wrong will signifi-cantly increase the chances of respondents guessing acorrect answer; this type of analysis is valuable. Import-antly, the authors have considered the limitations of thestatistics and accordingly made decisions that focusedon the quality of the overall tool. In addition, the ques-tions (and their correct answers) are based on the mostrecent evidence and recommendations with regards tosports nutrition; they are generalizable to most sportsand enable comparison across disciplines. The tool usesfood terms and measurement units that are likely to beunderstood by athletes from a range of countries. More-over, the tool is detailed and therefore can assess gaps inknowledge. The NSKQ has been designed to be adminis-tered online and can provide participants with immediatefeedback with regards to correct answers to questions.This is likely to be especially helpful for athletes who donot have access to professional support. The online formatprovides unique opportunity to direct participants to rep-utable and relevant resources based on their outcomes.
ConclusionsAn 89-point general and sports nutrition knowledgequestionnaire with six distinct sub-sections has been de-veloped and validated using multiple relevant methods.Three (weight management, sports nutrition, supple-ments) of the six sub-sections fit the Rasch model. Thesteps the researchers have taken to ensure the tool iscurrent and adequately validated were robust, and thequestionnaire represents an improvement on availablemeasures. Coaches, scientists and nutrition counsellorswill benefit from this tool because it will allow them to
Trakman et al. Journal of the International Society of Sports Nutrition (2017) 14:26 Page 10 of 11
target their education based on gaps in athletes’ know-ledge. In a team sports setting, the NSKQ may also beuseful as a screening tool, to identify players who requireadditional educational support. Widespread utilisation ofthe tool in the long-term will allow for more accurateevaluation of nutrition knowledge, education programsand comparisons across athletes of varying genders,ages, education levels, and calibres.
Additional file
Additional file 1: Supplementary Material S1. Methods used formissing variables analysis. In the original design, the demographic questionswere asked last; therefore, it was not possible to complete a full assessmentof factors that led participants to drop-out. Using available data, missingvalues (%) were compared across several participant characteristics. Thecontinuous variables age, hours training per week, years playing sport, andcountry of birth were transformed into categorical variables. Country of birthwas transformed into a dichotomous variable (Born in Australia/Not Born inAustralia). The dependent variable, missing data, was assessed for normalityusing the Kolmogorov-Smirnov statistic. Assumptions of normality wereviolated (Statistic 0.245, df 462, p < 0.001). Therefore non-parametric testswere used; Mann-Whitney was used dichotomous variables (gender [male/female], being born in Australia [yes/no], being paid to play sport [yes/no],previously having undertaken nutrition studies [yes/no], previously havingbeen given advice to change diet [yes/no]) and Kruskal-Wallis was used forcategorical variables with three or more response options (sport played,highest level of education, highest level sport played, years playing sport,hours training). Supplementary Material S2. Relationship between missingvalues (%) and participant characteristics. Supplementary Material S3.Original ‘Universal Sports Nutrition Knowledge Questionnaire’ test plan.Supplementary Material S4. Summary of items that did not meet therequisite 0.3 value for CVI. Supplementary Material S5. Examples ofchanges made to the questionnaire based on the student athletes’feedback. Supplementary Material S6. Comparison of scores acrossparticipant demographics at step 8. Supplementary Material S7. Examplesof changes made based on item analysis using classical test theory at step7. Supplementary Material S8. Examples of changes made to questionnairebased on CTT and Rasch re-analysis (step 8). (DOCX 36 kb)
AbbreviationsNKQ: Nutrition knowledge questionnaire; SNKQ: Sports nutrition knowledgequestionnaire
AcknowledgementsWe would like to thank all the participants who were involved in the variousstages of the study. A special thanks to the Sports Dietitians who took partin the expert panel review, and to Dr. Brooke Lea Devlin, who contributed toan internal review of an early version of the questionnaire.
FundingThis work was supported by an Australian Government Research TrainingProgram Scholarship (GT).
Availability of data and materialsThe data used/and or analyses during the current study are available fromthe corresponding author on reasonable request. The final version of theUNSQ is available from the corresponding author.
Authors contributionsGT designed the study, drafted the first version of the questionnaire,undertook all data analysis, wrote the majority of the manuscript andoversaw the manuscript preparation. AF assisted with the study design,decision making regarding modifications to the questionnaire, andmanuscript preparation. RH assisted with the study design and manuscriptpreparation. RB is the Chief Investigator of the study, assisted with the studydesign, decision making regarding modifications to the questionnaire, andmanuscript preparation. All authors read and approved the final manuscript.
Ethics approval and consent to participateThe research was approved (S16/267) by the La Trobe University’s SHE CollegeHuman Ethics Sub-Committee (SHE CHESC). Participants in the expert panelreview and think-out-loud focus groups read the Participant InformationStatement and signed the Consent Form. Participants who were involvedinsteps six to eight read the Participant Information Statement and providedconsent electronically.
Consent for publicationNo individual’s data has been collected or reported.
Competing interestsThe authors declare that they have no competing interests.
Publisher’s NoteSpringer Nature remains neutral with regard to jurisdictional claims in publishedmaps and institutional affiliations.
Author details1Department of Rehabilitation, Nutrition and Sport, School of Allied Health,College of Science, Health and Engineering, La Trobe University, Melbourne3086, Australia. 2Department of Management and Marketing, La TrobeBusiness School, College of Arts, Social Sciences and Commerce, La TrobeUniversity, Melbourne 3086, Australia. 3Department of Health Professions,School of Health Sciences, Faculty of Health, Arts and Design, SwinburneUniversity of Technology, Hawthorn 3122, Australia.
Received: 16 February 2017 Accepted: 27 July 2017
References1. Rodriguez NR, DiMarco NM, Langley S. Position of the American dietetic
association, dietitians of Canada, and the American college of sports medicine:nutrition and athletic performance. J Am Diet Assoc. 2009;3:509–27.
2. Kreider RB, Wilborn CD, Taylor L, Campbell B, Almada AL, Collins R, CookeM, Earnest CP, Greenwood M, Kalman DS, et al. ISSN exercise & sportnutrition review: research & recommendations. J Int Soc Sports Nutr. 2010;doi:10.1186/1550-2783-7-7.
3. Spronk I, Heaney SE, Prvan T, O'Connor HT. Relationship between generalnutrition knowledge and dietary quality in elite athletes. Int J Sport NutrExerc Metab. 2015;3:243–51.
4. Heikura IA, Stellingwerff T, Mero AA, Uusitalo ALT, Burke LM. A mismatchbetween athlete practice and current sports nutrition guidelines amongelite female and male middle-and long-distance athletes. Int J Sport NutrExerc Metab. 2017;4:351–60.
5. Kunkel ME, Bell LB, Luccia BHD. Gem no. 330. Peer nutrition educationprogram to improve nutrition knowledge of female collegiate athletes. JNutr Educ. 2001;2:114–5.
6. Collison SB, Kuczmarski MF, Vickery CE. Impact of nutrition education onfemale athletes. Am J Health Behav. 1996;1:14–23.
7. Cholewa JM, Landreth A, Beam S, Jones T, MacDonald CJ. The effectsof a sports nutrition education intervention on nutritional status, sportnutrition knowledge, body composition, and performance in NCAAdivision I baseball players. J Int Soc Sports Nutr. 2015. doi:10.1186/1550-2783-12-S1-P44.
8. Spronk I, Kullen C, Burdon C, O'Connor H. Relationship between nutritionknowledge and dietary intake. Br J Nutr. 2014;10:1713–26.
9. Alaunyte I, Perry JL, Aubrey T. Nutritional knowledge and eating habits ofprofessional rugby league players: does knowledge translate into practice?J Int Soc Sports Nutr. 2015;12:18.
10. Clark KS. Sports nutrition counseling: documentation of performance. TopClin Nutr. 1999;2:34–40.
11. Parks RB, Helwig D, Dettmann J, Taggart T, Woodruff B, Horsfall K, BrooksMA. Developing a performance nutrition curriculum for collegiate athletics.J Nutr Educ Behav. 2016;6:419–24.
12. Hamilton CB, Maly MR, Giffin JR, Clark JM, Speechley M, Petrella RJ,Chesworth BM. Validation of the questionnaire to identify knee symptoms(QuIKS) using Rasch analysis. Health Qual Life Outcomes. 2015. doi:10.1186/s12955-015-0358-6.
Trakman et al. Journal of the International Society of Sports Nutrition (2017) 14:26 Page 11 of 11
13. Andrews MC, Itsiopoulos C. Room for improvement in nutrition knowledgeand dietary intake of male football (soccer) players in Australia. Int J SportNutr Exerc Metab. 2016;1:55–64.
14. Trakman G, Forsyth A, Devlin B, Belski R. A systematic review of athletes’and coaches’ nutrition knowledge and reflections on the quality of currentnutrition knowledge measures. Nutr. 2016. doi:10.3390/nu8090570.
15. Heaney S, O’Connor H, Michael S, Gifford J, Naughton G. Nutritionknowledge in athletes: a systematic review. Int J Sport Nutr Exerc Metab.2011;21:248–61.
16. Furber MJW, Roberts JD, Roberts MG. A valid and reliable nutritionknowledge questionnaire for track and field athletes. BMC Nutr. 2017.doi:10.1186/s40795-017-0156-0.
17. Petrillo J, Cano SJ, McLeod LD, Coon CD. Using classical test theory, itemresponse theory, and Rasch measurement theory to evaluate patient-reported outcome measures: a comparison of worked examples. ValueHealth. 2015;1:25–34.
18. Streiner DL. Starting at the beginning: an introduction to coefficient alphaand internal consistency. J Pers Assess. 2003;1:99–103.
19. Lambert SD, Pallant JF, Boyes AW, King MT, Britton B, Girgis A. A Raschanalysis of the Hospital Anxiety and Depression Scale (HADS) among cancersurvivors. US: Am Psychol Assoc. 2013;25:379–90.
20. Tennant A, Conaghan PG. The Rasch measurement model in rheumatology:what is it and why use it? When should it be applied, and what should onelook for in a Rasch paper? Arthritis Care Res (Hoboken). 2007;8:1358–62.
21. Mötteli S, Barbey J, Keller C, Bucher T, Siegrist M. Measuring practicalknowledge about balanced meals: development and validation of the briefPKB-7 scale. Eur J Clin Nutr. 2015. doi:10.1038/ejcn.2015.173.
22. Mötteli S, Barbey J, Keller C, Bucher T, Siegrist M. Measuring practicalknowledge about balanced meals: development and validation of the briefPKB-7 scale| NOVA. Univ Newcastle Digit Repository. 2016. doi:10.1038/ejcn.2015.173.
23. Pallant J. Scale development, Rasch analysis and item response theory.Melbourne Australian consortium for Social & Political Research inc (ACSPRI).Melbourne: ACCPRI; 2016.
24. Potgieter S. Sport nutrition: a review of the latest guidelines for exercise andsport nutrition from the American College of Sport Nutrition, theInternational Olympic Committee and the International Society for SportsNutrition. South Afr J Clin Nutr. 2013;1:6–16.
25. Buford TW, Kreider RB, Stout JR, Greenwood M, Campbell B, Spano M,Ziegenfuss T, Lopez H, Landis J, Antonio J. International Society of SportsNutrition position stand: creatine supplementation and exercise. J Int SocSports Nutr. 2007. doi:0.1186/1550-2783-4-6.
26. Goldstein ER, Ziegenfuss T, Kalman D, Kreider R, Campbell B, Wilborn C, TaylorL, Willoughby D, Stout J, Graves BS, Wildman R, Ivy JL, Spano M, Smith AE,Antonio J. International society of sports nutrition position stand: caffeine andperformance. J Int Soc Sports Nutr. 2010. doi:10.1186/1550-2783-7-5.
27. International Olympic Comitte. IOC consensus statement on sports nutrition2010. Int J Sport Nutr Exerc Metab. 2010;1003:552.
28. Burke LM, Hawley JA, Wong SH, Jeukendrup AE. Carbohydrates for trainingand competition. J Sports Sci. 2011;29(sup1):S17–27.
29. Loucks AB, Kiens B, Wright HH. Energy availability in athletes. J Sports Sci.2011;29(sup1):S7–S15.
30. Phillips SM, Van Loon LJ. Dietary protein for athletes: from requirements tooptimum adaptation. J Sports Sci. 2011;29(sup1):S29–38.
31. Shirreffs SM, Sawka MN. Fluid and electrolyte needs for training,competition, and recovery. J Sports Sci. 2011;29(sup1):S39–46.
32. Slater G, Phillips SM. Nutrition guidelines for strength sports: sprinting,weightlifting, throwing events, and bodybuilding. J Sports Sci. 2011;29(sup1):S67–77.
33. Sundgot-Borgen J, Garthe I. Elite athletes in aesthetic and Olympic weight-class sports and the challenge of body weight and body compositions.J Sports Sci. 2011;29(sup1):S101–14.
34. Maughan R, Greenhaff P, Hespel P. Dietary supplements for athletes:emerging trends and recurring themes. J Sports Sci. 2011;29(sup1):S57–66.
35. Trakman GT, Forsyth A, Hoye R, Belski R. Developing and validating anutrition knowledge questionnaire: Key methods and considerations. PublicHealth Nutr. 2017. doi:10.1017/S1368980017001471.
36. Polit DF, Beck CT, Owen SV. Is the CVI an acceptable indicator of contentvalidity? Appraisal and recommendations. Res Nurs Health. 2007;4:459–67.
37. Krueger RA, Casey MA. Focus groups: a practical guide for applied research.New York: Sage publications; 2014.
38. Parmenter K, Wardle J. Evaluation and design of nutrition knowledgemeasures. J Nutr Educ. 2000;5:269–77.
39. Faul F, Erdfelder E, Lang A-G, Buchner A. G* power 3: a flexible statisticalpower analysis program for the social, behavioral, and biomedical sciences.Behav Res Methods. 2007;2:175–91.
40. Parmenter K, Wardle J. Development of a general nutrition knowledgequestionnaire for adults. Eur J Clin Nutr. 1999;4:298–308.
41. Heaney S, O’Connor H, Michael S, Gifford J, Naughton G. Nutritionknowledge in athletes: a systematic review. Int J Sport Nutr Exerc Metab.2011;3:248–61.
42. Spendlove JK, Heaney SE, Gifford JA, Prvan T, Denyer GS, O'Connor HT.Evaluation of general nutrition knowledge in elite Australian athletes.Br J Nutr. 2012;12:1871–80.
43. Zinn C, Schofield G, Wall C. Development of a psychometrically valid andreliable sports nutrition knowledge questionnaire. J Sci Med Sport. 2005;3:346–51.
44. Goulet ED. Effect of exercise-induced dehydration on time-trial exerciseperformance: a meta-analysis. Br J Sports Med. 2011; doi:10.1136/bjsm.2010.077966.
45. Fincham JE. Response rates and responsiveness for surveys, standards, andthe journal. Am J Pharm Educ. 2008. doi:0.5688/aj720243
46. Cappelleri JC, Lundy JJ, Hays RD. Overview of classical test theory and itemresponse theory for quantitative assessment of items in developing patient-reported outcome measures. Clin Ther. 2014;5:648–62.
47. Chen W-H, Lenderking W, Jin Y, Wyrwich KW, Gelhorn H, Revicki DA. IsRasch model analysis applicable in small sample size pilot studies forassessing item characteristics? An example using PROMIS pain behavioritem bank data. Qual Life Res. 2014;2:485–93.
• We accept pre-submission inquiries
• Our selector tool helps you to find the most relevant journal
• We provide round the clock customer support
• Convenient online submission
• Thorough peer review
• Inclusion in PubMed and all major indexing services
• Maximum visibility for your research
Submit your manuscript atwww.biomedcentral.com/submit
Submit your next manuscript to BioMed Central and we will help you at every step: