the noise of ejectors - magic naca...
TRANSCRIPT

.,
.~
MINISTRY OF AVIATION
AERONAUTICAL RESEARCH COUNCIL
REPORTS AND MEMORANDA
The Noise of EjectorsBy D. MIDDLETON
R. & M. No. 3389
LONDON: HER MAJESTY'S STATIONERY OFFICE
1965PRICE £1 Is. 6d. NET

The Noise of EjectorsBy D. MIDDLETON
Reports and Memoranda No. JJ89*
October) I96J
Summary.
An extensive model-test programme has been carried out on the noise properties of a series of fifteenaxi-symmetric ejectors, using a two-inch diameter cold jet as the primary discharge and inducing the secondaryflow from atmosphere. These ejectors had (Dld)2 ratios of 2,3 and 4, and (Lid) ratios which lay between 3 and32, (D and L are the diameter and length of a particular ejector and d the diameter of the cylindrical primarynozzle). Parallel experiments at the Royal Aircraft Establishment, Farnborough, have investigated the staticaerodynamic properties of these ejectors.
This report concentrates on the features of the broad-band discharge, after making a full survey of thetypes of noise present. No noise came from the ejector casing, and radiation of noise from the ejector intakewas prevented by the use of an absorber box. Radiation from the exhaust for certain choked conditions wasfound to contain shock noise similar in nature to the unshrouded case and some unstable high-frequency broadband noise was detected. Further discrete noise could emanate when the flow was entirely subsonic, and thoughthe walls of the ejector were excited by the internal airflow this was not the source of this noise which had the
properties of a non-linear oscillation within the shroud. The acoustic efficiency of this type of noise dependedon the modes of excitation and was greatest for the shorter shrouds operating at pressure ratios of less than about1· 4. In many cases this noise was of sufficient strength to dominate the broad-band efflux noise. In certain
cases the contribution due to the discrete noise could be removed by analytic means to leave an estimate of thebroad-band discharge. It is shown that this latter noise appeared to be more related to the mixing conditionsof the primary jet than to the conditions of the mixed stream at discharge. Defining the attenuation of anejector as the difference between the peak (broad-band) noise levels measured along a line parallel to the jetaxis with and without the ejector in position, such attenuation increased with increase in ejector length to amaximum of about 7 db but was independent of diameter.
A survey and assessment of other published noise work on ejectors is included.
LIST OF CONTENTSSection
1. Introduction (including a survey of other published work)
2. The Experimental Facilities
2.1 The Acoustics Laboratory and Control Room
2.2 The experimental models
2.3 Noise-measuring equipment
* Replaces A.A.S.U. Report No. 247-A.R.C. 25 187.
LIST OF CONTENTS-continuedSection
3. The Reliability of Measurements
3.1 Calibration of noise-measuring equipment
3.2 The accuracy and repeatability of noise measurements
3.3 The accuracy of measurements of quantities other than noise
4. The Identification of Noise Sources
4.1 Noise radiated through ejector walls
4.2 Noise radiated from ejector intakes
5. The Types of Noise Emitted
5.1 Shock noise
5.2 Excess broad-band high-frequency emission
5.3 Discrete-frequency emission from subsonic flow
5.4 Broad-band discharge noise
6. Conclusions
7. Acknowledgements
References
Appendix
Tables
Illustrations-Figs. 1-25
Detachable Abstract Cards
1. Introduction.
Although for the air traveller the introduction of the jet engine into civil aviation has brought
appreciable benefits, people on the ground have discovered that another consequence has been thenoisiness of the airliner exhaust during and shortly after take-off. Any method to make the reduction
of such noise commercially feasible is therefore to be welcomed, and in recent years much theoretical
and practical research has gone into the manner of generation, transmission and suppression of
jet noise.The classical papers of Lighthill-- 2 which set down the fundamental relationships governing the
production of noise by aerodynamic means, show by dimensional analysis that for jets of moderate
Mach number the sound output can be expected to be proportional to some high power, usually
near the eighth, of the jet velocity. This relationship has heen substantiated by many experimentersworking on a large number of circular jets operating under a wide range of conditions".
In an ejector system, the basic form of which is shown in Fig. 1, the discharge from the primarynozzle mixes with the entrained airflow within the sleeve. As the discharge consists of an augmentedjet presenting a lower efflux velocity to the surrounding air, such a scheme seems attractive from thenoise-reduction point of view, and as thrust may actually be augmented by the pumping action anapplication to commercial power plants may exist.
2

In an arrangement such as this there are clearly many parameters which affect the flow and
therefore the noise. Even restricting the problem to a consideration of the mixing of cold flows
within cylindrical sleeves for a given design of primary nozzle, there remain such variables as the
ejector length and diameter, longitudinal position relative to the primary discharge, and inlet design.
To investigate the noise properties of such a set of ejectors, a series of experiments has been in
progress in the Department of Aeronautics and Astronautics in the University of Southampton.
Coupled with these tests aerodynamic experiments have been carried out at the Royal Aircraft
Establishment, Farnborough, with primary nozzle and ejectors identical in construction to those
used at Southampton. These measurements of inflow velocities, static-pressure distributions along
the ejector, and outlet velocity profiles, are reported by Reid", and provide the 'steady' aerodynamic
data for study in conjunction with the pressure fluctuations of the corresponding noise field.
Before describing the present tests a survey of other published noise work on ejectors is made.
The assessment and comparison of results from different research groups is never easy due to
differences in the techniques of measuring and analysing the noise. This is especially true in ejector
work because of the large number of variables and the fact that the ejector length can be significant
compared with the radius of the arc around which noise levels are customarily taken.
Most measurements of ejector noise have been made on basic designs which would not require
much redevelopment to form practical units in conjunction with the turbo-jet power plants of
modern airliners. Because of drag and weight problems this usually implied a rather short ejector,
and reports often mentioned the desirability of a form which could retract during cruise conditions.
Table 9 gives the experimental details as far as deducible from the available unclassified reports.
The earliest report on ejector noise is that of North and Coles", Due to the shortness of the
sixteen ejectors they tested in association with a conical nozzle little mixing occurred within the
shrouds and the noise levels were practically unaltered. A single exception will be referred to later
in this section.Because of this lack of success most of the other ejector reports issued by the N.A.C.A., and
latterly the N.A.S.A., dealt only with ejectors used in conjunction with nozzles which themselves
possessed noise-reducing characteristics. Ciepluch, North, Coles and Antl" dealt with tests on an
ejector with a 'mixing nozzle' but no acoustic data for this nozzle alone were presented and it was not
possible therefore to assess the effect of the ejector. Coles, Mihaloew and Callaghan7 showed that
the ejectors generally produced noise levels lower at all angles than the twelve lobe nozzle with
which they were tested, and which by itself gave about 3 db attenuation. The ejectors were also
tested with an eight-lobe nozzle which alone gave some 7 db reduction in noise. Increasing the
ejector length increased the attenuation in each case and an increase in ejector diameter also lowered
the noise. The longitudinal location of the ejector had no significant effect on the levels. Further
tests using an ejector with an eight-lobe nozzle are reported by Coles, Mihaloew and Swann".
Corcos" mentioned 'unpublished Douglas Aircraft Company and N.A.C.A. data' which showed
that 'an ejector placed immediately at the exit of a plain nozzle is capable of decreasing the radiated
noise energy by a factor as high as five' [7 db]. 'This occurs only when ... secondary and primary
air have been sufficiently mixed. "Sufficient" mixing requires a long ejector (the ejector length
should be approximately eight times its diameter) ... The gains obtained by ejectors and by
corrugated nozzles are to a certain extent additive in that a combination of a corrugated (or multiple)
nozzle and an ejector reduce the aerodynamic noise of a jet still further. In fact it has been found
that even very short ejectors were effective complements of corrugated nozzles'. Powell'? 'gratefully
3(91137) A2

acknowledges unpublished data' from Douglas Aircraft Company in stating that an average reduction
of 12} db was found from a series of six ejector designs.
Further mention of tests on ejectors used with suppressor nozzles was made by Gordonll , this
review article stating that 'the suppressor, aerodynamic and acoustic testing done by N.A.C.A.
provided invaluable assistance in the design optimisation of the CJ -805-3 suppressor', (the 'daisy'
corrugated nozzle and ejector used for the Convair 880 airliner.) Discussing its design, Bertaux'P
stated that during tests 'as the length of the shroud was increased, the noise reduction capability
of the suppressor was severely compromised'.
Results from hath a full-scale engine and a small-scale hot jet have been described by Greatrexl''.
Figures given for the reduction in peak overall noise along a line 'nearly' parallel to the jet axis for a
conical nozzle, showed that attenuation increased with ejector length but no dependence on area
ratio was noted. When used in conjunction with a seven-tube nozzle the attenuation of an ejector
again increased with length hut it decreased with area-ratio increase. The reductions in noise were
up to about 8 db and this was for an ejector length/nozzle diameter of about 13. The paper surmisedthat due to the low estimated velocity of the induced air in the flight case only a low attenuation
would ensue.
The only unclassified report on air-to-ground noise tests known to the present Author is that of
Coles, Mihaloew and Swann" and this stated that in the flight case the addition of the ejector to an
eight-Iohed nozzle made little difference either to the peak noise recorded in each octave during the
fly-over or in the value of the attenuation. Figures of 2~ db at a relati ve jet velocity of 1000 ft/sec
rising to 7 ~ db at 1500 ft/sec were achieved for the reduction of peak overall noise.
The tests so far mentioned have all been with a hot turbo-jet engine as the unit providing the
primary discharge. Early model work at Southampton University hy Foxwell'! on two-dimensional
choked ejectors using cold air revealed shock noise similar to that reported by Powell'! in the
unshrouded case. Although roughening the flow reduced the screech it failed to remove it and the
tests were discontinued. This may explain the amelioration mentioned by North and Coles",
i.e. 'recent unpublished ejector data obtained with a model air jet ... which gave significant
decreases in total sound power at nozzle pressure ratios in excess of 3·0' and why in view of the
generally low attenuations achieved in the reported tests, Callaghan!", in reviewing the noise work
of the N.A.C.A., wrote 'of many combinations of nozzle and ejectors, best results so far indicate
that as much as 15 to 16 db reduction of the overall level is possible'.
One of the sixteen ejectors reported on by North and Coles" gave 'an acoustic resonance', their
third-octave analysis showing a clearly defined discrete frequency of about 160 cis and its harmonicsmaking the noise levels were everywhere higher than those of the unmodified nozzle. Coles,
Mihaloew and Swann" stressed in their work that 'although some ejector configurations have
shown resonant characteristics at certain operating conditions that resulted in noise level increases
none of the present ejector configurations showed any at any engine speed'. With respect to this
they cite Coles and Callaghan!" but this latter report mentioned neither ejectors nor discretefrequencies. This phenomenon is different from shock noise as it can occur when the flow is
unchoked. Indeed, both types of discrete-frequency phenomena have been observed on the tests
about to be described. Prior to this present paper noise analysis using bands narrower than one-third
of an octave appears never to have been made on ejector noise and it is therefore suggested that discrete*~--~~-- ~._. --~~-~--------------- - -- --~---_.. -----
,~ The precise meaning of the word 'discrete', as used in this context, is discussed in Section 5.3.
4
frequencies may have been present in strength insufficient to make their presence obvious in theseearlier recordings yet adequate to affect the noise-level readings. In view of this it would appeardesirable to treat these published results with a certain amount of reserve, although the generalimplications of this section have been included in Section 6 which is devoted to conclusions.
2. The Experimental Facilities.
2.1. The Acoustics Laboratory and Control Room.
All noise measurements were made in the Acoustics Laboratory of the Department. Fig. 3 showsa sketch of the laboratory together with adjoining Control Room. The shell of the laboratory wasapproximately 40 feet by 30 feet by 15 feet with a stepped inner frame covered with fibre-glass.Thus the walls and ceiling were highly sound-absorptive and their irregular shape prevented theformation of standing waves from any reflected sound. For the floor, iron gratings layover transverse
beams some two feet above the shell and the wells between each pair of beams were also lined withfibre-glass to prevent reflections. With this design conditions similar to those in a free field existed in a
volume approximately 37 feet x 27 feet x 9 feet.A compressed-air system was used to supply the primary jet. Room air, after being drawn through
twin two-stage compressors which had cooler and water trap after each stage, passed through silica
gel driers to be stored in twin reservoirs under pressures of up to 250 pounds per square inch.A supply system led from these storage tanks to the settling chamber in the laboratory. This chamberwas some six feet long with an internal diameter of 6·25 inches and at the downstream end of this
the primary nozzle was bolted. Thus the air discharged horizontally some seventy inches above thefloor gratings. As the diameter of the primary nozzle was fractionally under two inches, the areacontraction of over 10: 1 from the chamber to the nozzle meant that negligible difference existedbetween the stagnation pressure at the nozzle and the static pressure in the settling chamber.The value of the stagnation pressure was therefore determined from the reading of a mercurymanometer situated in the control room, and which was connected to a static tapping in the chamberwall.
Throughout this report, pressures ratios of '1· 35', '1· 65', etc. will be quoted. Unless the contraryis explicitly stated, such figures refer to the ratio of the total pressure, (i.e. gauge pressure plusatmospheric pressure), to atmospheric pressure. (This is, of course, the correct value when applyingthe usual isentropic relationships to an unshrouded subsonic jet as then the static pressure is equalto the atmospheric pressure. However, when an ejector is added, the static pressure at the pointof discharge of the jet into the sleeve is lower than atmospheric pressure, and it is indeed the differencebetween the two which provides the driving head for the induced secondary flow). This designationwas the method adopted by Reid-, and it has been found convenient to follow this system and thereby
afford a direct comparison between the two sets of results. Thus the true pressure ratio at thenozzle was higher than the one given. Although the difference depended on the actual ejector used,
it is worth mentioning as a guide that a 'pressure ratio of 1· 65' was roughly equal to the true chokingpressure ratio of 1· 89 given by a value of y of 1· 4 (e.g. Fig. 6a).
The humidity of the air in the laboratory was determined during each test by a whirling hygrometer,the 'dry' bulb of which was used as indication of the air temperature. For the jet itself, a ventilatedpsychrometer was fitted to a tapping at the downstream end of the settling chamber. The reading ofthe 'dry' thermometer was taken as the stagnation temperature of the jet, this proving a far moreconvenient method than employing a pitot-therrnocouple. Since the compressed air was stored at
5
'room temperature', little difference was to be expected between the laboratory temperature and the
stagnation temperature of the jet. It was found to never exceed ± 6°F and was generally within
± 2°F. A Fortin barometer in the control room gave the value of the atmospheric pressure.
2.2. The Experimental Models.
The primary nozzle and the metal ejectors were duplications of those used in the parallel aero
dynamic experiments conducted by the Royal Aircraft Establishment, Farnborough, (Reid").
The precise details of the primary nozzle, which was axi-syrnmetric, are given in Fig. 2. A section
of 20-gauge brass tubing of two inches external diameter formed the cylindrical part of the nozzle,
and this was attached to the converging approach section which was of mild steel. The internalprofile of this latter was a quadrant in the plane through the axis. Close to the exit plane of the
nozzle two tappings were let into the wall to measure the static pressures in the internal and external
flows just prior to mixing. The leads from these were buried in the wall of the nozzle to prevent
interference with either flow and went to water or mercury manometers mounted on the settling
chamber support. The nozzle flange was so designed that it provided a firm seating in the end of the
settling chamber. The nozzle was held in position by bolts through a retaining ring, as Fig. 2 shows.
For the ejectors three different diameters were available for each of five different lengths, making
a total of fifteen. The ratios of the areas of the secondary flow annulii to the primary nozzle area were
roughly 1· 0, 2·0 and 3·0, and the ejector lengths were equal to 3, 6, 12, 20 and 32 primary-nozzle
diameters. These fifteen therefore covered the whole range of practical constant-area axi-symmetric
ejectors, although to extend some results it was found necessary to test some wooden ejectors, and
these are dealt with in Section 5.3. The full details of the metal ejectors and the nomenclature
adopted in this report are given in Table 1.
To provide smooth inflow conditions, brass bell mouths were fitted to each of the metal ejectors,
and each had a one-inch radius in the meridian plane. The ejectors themselves were of 14-gauge
mild sheet steel, rolled and welded, except for ejectors Bl, B2, B4 and B5 which were of 16-gauge
seamless brass. Prior to use, the metal ejectors were scoured internally in the Department of Chemistry
in the University. The wooden ejectors were of teak, with bellmouths made of mahogany.
An ejector was supported at two positions. The upstream end was held between bifurcated arms
extending from two horizontal rods mounted out from lugs on the flange of the settling chamber.
The downstream end was supported by a stand resting on two I-beams bolted to the floor to give a
rigid base. The longitudinal distance of the ejector inlet from the nozzle efflux plane was controlled
by interlocking templates and these were also used to make the flow axis of the primary nozzle and
the upstream end of the longitudinal axis of the ejector coincide. At the downstream end the axes
were brought into coincidence using a sighting arrangement, and the ejector was then locked
in position.
2.3. Noise-Measuring Equipment.
As subsequent sections of this report confirm, it was found necessary to make very assiduous
investigations of the noise field produced by the ejectors. Such an approach required the use of a
considerable amount of equipment as analyses were carried out according to the most suitable way
of studying the particular noise pattern under consideration. The main pieces of equipment and their
capabilities are therefore discussed in this section and the Appendix lists the full range of noise
equipment used.
6
The pressure transducer was a Bruel and Kjaer half-inch condenser microphone. This has alinear free-field frequency response covering the range 20 cis to 40 kc/s, using normal incidence,and its upper sound pressure level limit was considerably in excess of any noise level measured inthese experiments. The variation of microphone sensitivity with temperature was negligible andthe slight variation with ambient pressure could be allowed for. This cartridge was immediately
succeeded by a cathode follower as pre-amplifier, and the signal was taken from the Acoustics
Laboratory to the Audio-Frequency Spectrometer in the Control Room using twenty metres of
cable (two ten-metre lengths connected in series).This spectrometer consisted of input circuit and amplifier, filter circuit and output amplifier, and
a meter circuit. The upper frequency limit of the spectrometer was higher than that of the
microphone so that the total noise recorded by the microphone at given location could be determined
by selection of the 'overall' position on the scanning dial. Also incorporated were thirty contiguousone-third octave filters, covering the range 35·5 cis to 35,500 cis, and these could be selected eithersingly or in ten consecutive groups of three to give octave levels. Designed for subjective work infull-scale tests, the three weighted networks, 'A', 'B' and 'C' of this instrument were not used inthese experiments. The use of a hand-switch enabled the output from any filter, or the overall noise,to be observed for any desired length of time.
Rather than read the third-octave, octave or overall noise level on the spectrometer dial, it wassometimes more convenient to use the Bruel and Kjaer Level Recorder. The signal from the spectrometer when fed to this recorder actuated a stylus which marked the surface of calibrated waxedpaper as the latter unwound, so that a permanent visual record of the noise signal was obtained.In general an electrical switchdrive connector was used with the motor of the level recorder todrive the selector switch of the spectrometer through the filter bands.
It was frequently necessary to make magnetic-tape recordings for subsequent analysis, and forthis the 'overall' output from the spectrometer was fed into a Vortexion Tape Recorder. At itsmaximum speed this was linear up to about 14 kc/s. For broad-band analysis the tape could bereplayed back into the spectrometer, whilst for narrow-band analysis to investigate discrete frequencyphenomena, either the Hewlett-Packard Wave Analyser (with sweep drive to the Moseley AutografRecorder), or the Muirhead-Pametrada Wave Analyser could be used. The former, which had a
constant bandwidth of about 7 cis was used when an indication of the frequencies of discrete signalswas required, and the latter, with a constant percentage bandwidth of about 4%, (for 3 db down),
when actual noise levels were wanted.Two further instruments tried for narrow-band analysis were the Bruel and Kjaer Frequency
Analyser, (which had its own associated level recorder and recording paper), and the Kay
Sona-Graph Sound Spectrograph. The advantage of the former was that as it was an automaticfrequency scanner it eliminated any failure to detect a peak through chance omission resulting fromhand selection of frequencies on the Pametrada Analyser. However as its maximum selectivity was6%the resolution was not as good as that of the Pametrada instrument.
Examples of the outputs from the Hewlett-Packard Wave Analyser, the Bruel and KjaerFrequency Analyser and the Kay Sona-Graph Sound Spectrograph are shown in Fig. 4. The outputfrom the last is an analysis of 2·4 seconds of magnetic tape with time as the horizontal scale and alinear vertical scale covering the frequency range from 85 cis to 6000 cis. The strength of the signalis proportional to the degree of charring produced on the surface of the specially prepared paper sothat discrete frequencies occur as darker bands. This type of analysis was advantageous if a signal
7
changed with time, as for example when the pressure ratio of the jet was steadily increased. (In the
particular example shown in Fig. 4, the Hewlett-Packard Analyser, as set, went slightly non-linear
after 4000 cis. A d.c. signal and a deflection corresponding to the 50 cis mains hum explain the
initial steep descent on the left-hand side of this trace.)
The final instrument to use the spectrometer as amplifier was the E.M.I. Panoramic Waveform
Analyser, in which the input actuated a beam traversing a six-inch cathode-ray tube. The horizontal
distance moved was proportional to the frequency, and the vertical deflection was related to the
amplitude of the signal. Both scales could be varied, though a tendency to 'drift' was present.
This machine was a convenient means of visually monitoring the noise output, showing for example
the possible presence of discrete-frequency components. A 1000 cis signal and its harmonics
calibrated the frequency scale, and polaroid photographs of the display were sometimes taken,
(e.g. Figs. 10a and 1Ob), usually using six consecutive sweeps of the beam across the screen, to give
the requisite density of image.
3. The Reliability of Measurements.
In the experiments to be described it became evident that a precise knowledge of the capability
of each piece of equipment was necessary. An accurate calibration of all quantitative measuring
devices was required to allow an investigation both of the consistency of noise levels and the
significance of any differences.
3.1. The Calibration of Noise-Measuring Equipment.
All readings were related to the spectrometer dial, which was specified as indicating true
root-mean-square pressures within a general accuracy of 0·2 db. Except in positions affected by
the jet stream the needle of the dial was usually steady to within ± 0·1 db.
Although it was not possible to use the same microphone and cathode follower, or the same
lO-metre cables, throughout the tests, all other pieces of equipment remained unchanged. For
absolute sensitivity, the microphone cartridges were calibrated in sets of three at a frequency of
400 cis using the reciprocity technique reported by Rayleighl". For day-to-day work, it was found
more convenient to check the whole system using the Bruel and Kjaer pistonphone. This generated
a fixed-frequency noise of known level, and the difference between the indicated level on the
spectrometer and thc standard level was the correction factor for the particular microphone. This
factor was always within about O' 2 db of the figure quoted by the makers, equal to the guaranteed
accuracy of the pistonphone. The pressure response of a microphone, as determined by a Bruel and
Kjaer electrostatic actuator, agreed precisely with the curve supplied by the makers. Attempts to
calibrate the microphone using a Bruel and Kjaer Noise Source were not pursued as this broad-band
noise generator was only accurate to within about ± 1 db.
The Vortexion Tape Recorder was used exclusively at its maximum tape speed of 15 in.jsec.
A record-replay response curve was obtained using an oscillator as input signal generator, and then
replaying from the recorder to the spectrometer. Checks using signal height on a cathode-ray
oscilloscope gave very satisfactory agreement.
The Pametrada Wave Analyser was the only narrow-band analyser used for quantitative work,
and this had a frequency range from 20 cis to 20,800 cis. The 'in tune' filter was the narrowest One
available but reading the dial was not easy because of the relatively large fluctuations in signal
8
strength. As a consequence the 'narrow-band' filter series were used for the analysis of tape loops,but even then analysis was not easy below about 300 cis. Using a sine-wave input the averagebandwidth was found to be 4·1 % (3 db down points). All narrow-band analyses in this report arepresented, after correction, as spectrum levels. Checks also showed that no erasure of the highfrequency end of the spectrum occurred during the time taken to analyse a tape loop.
As the averaging meter in the level recorder had a different specification from the more accurateone of the spectrometer, a comparison was made. It was found possible to get differences in levelquite consistent ones, between the temporal averaging of the fluctuations of the spectrometerdial needle and the spatial averaging of the fluctuations of the stylus trace of the recorder, and theseare given in Table 2. The slight difference existing between automatic and hand switching throughthe octaves was due to initial stylus 'overswing' in the automatic case.
For a typical traverse, the overall noise was read on the spectrometer dial, and the octave levelswere related to this by obtaining a level recorder trace using automatic switching. A typical example
of such a trace is shown in Fig. 5, the vertical deflection of the stylus being 1 db Imm. Even withlarge damping it was possible to encounter large fluctuations in the lowest octaves, but repeatedanalyses gave very consistent levels. The noise levels of the main energy-bearing frequencies were
certainly well-defined, and when the scale shift from this model to a full-scale ejector system is
taken into account, the lowest octaves become even less important. A paper speed of 1 cmlsec and
an octave sampling time of 1· 44 sec was used. This enabled a constant pressure to be maintained
throughout the complete spectrum sweep time of 16· 2 sec and it was also possible to complete a
given run, as described in Sections 3.2 and 5.4, with one quantity of stored air. This would not have
been possible had slower sweep speeds been used or had all readings been taken visually from thespectrometer dial. This method also ensured that a permanent record was obtained. Third-octaveanalysis was only rarely employed, for as it was generally easy to make reasonably accurate spectrumlevel estimates from the octave levels, the additional information provided by the use of the thirdoctave filters was only marginal. A comparison of summed third-octave levels with measuredoctave levels showed that they agreed well.
Examples of the recorder output obtained whilst conditions in the jet were changing with timeare also shown in Fig. 5, these particular ones being replays from tape recordings. The traces are Ofoverall noise as the pressure was steadily increased, for the three cases of primary nozzle alone, withan ejector, and with the same ejector modified. (The flatness of the right-hand portion on the firstof these indicates that in this particular case the tape recorder became overloaded.) Results such asthese will be dealt with in Section 5.
3.2. The Accuracy and Repeatability of Noise Measurements.
To measure the noise a rectangular Cartesian system of position was adopted with intercepts Of24 inches between stations. This meant that the whole noise field could be covered with easyinterpolation of values at intermediate locations and without the assumption implicit in measurements made on a single locus that the microphone is in the acoustic far field. In this report linesa, b, c and d were parallel to the discharge at 2, 4, 6 and 8 feet from the jet axis. Locations downstream were numbered from 0, square with the primary-nozzle exit plane, and upstream positionshad an asterisk added. The co-ordinate system is shown in Fig. 3, including the correspondingpositions on the other side of the jet, the lines there being designated with a dash. It was not possible
to take measurements at all the indicated points due to encountering the jet itself, the presence of
9
other rigs and the 'pancaking effect' of the jet on the far wall of the laboratory to produce reverse
flow in outer areas. An intake box, whose use is described later, also produced a screening effect over
a small area. These effects are all sketched in Fig. 3.
The microphone was mounted at the height of the centre-line of the jet and all measurements
were taken in this horizontal plane. Initial measurements showed an interference effect in the noise
spectrum. Checks with the self-supporting 'goose-neck' type of cathode follower proved that this
was due to reflections from the mounting surface behind the microphone. By using an extension
piece to this mounting the effect was removed and no other trouble with standing waves or
reflections was experienced. Accurate siting of the microphone was obtained using a plumb-line
over markers on the grating floor. A test showed that octave levels were only slightly affected and
overall levels negligibly by any likely error in the angle which the microphone diaphragm subtended
to the noise source.
A survey of the ambient noise in the laboratory was made. The overall level was about 55 to 60 db,
depending on the precise microphone position and with third-octave levels appreciably lower, this
meant that the background noise levels were quite acceptable. It was also found that sudden noises
from external sources were never of sufficient intrusiveness to affect recordings when the jet was in
action. Lagging the outside of the settling chamber, the largest untreated surface in the laboratory,
made no difference to the jet-noise results obtained.
Before each series of measurements, readings of the atmospheric pressure, the temperature andhumidity in the laboratory and the stagnation temperature and humidity of the jet were taken.
A pistonphone check of the microphone sensitivity and a reading of the ambient noise level in the
laboratory were also made.A 'run', as considered in Section 5.4, usually meant the measurement of exhaust noise in a single
traverse along a line a, b, c or d. As the edge of the jet was approached, a greater unsteadiness
appeared in the signal, with sudden 'one-sided' fluctuations appearing in the trace of the lower
octaves as the intermittent edge of the jet was entered. As this occurred before the overall noise
level began to fluctuate greatly and these lowest octaves were significantly below the overall levels
and other octave levels of interest, these results have not been excluded from the results in the
appropriate tables. Inspection of the tabulation generally reveals which levels have been 'wind
influenced'. A Bruel and Kjaer Nose Cone was tested on the microphone to discover whether the
range of measuring stations could be increased by protection of the diaphragm but as only a very
limited improvement was noted the idea was abandoned.
The accuracy of a traverse was assessed by repeating a run. The overall noise levels measured
together with those taken in the corresponding positions on the other side of the rig are compared
in Table 3a. This part of the table also lists the spread of the octave levels measured amongst these
three runs. Agreement was good, and a further investigation with measurements at all positions
unaffected hy the presence of other rigs confirmed to a high degree the symmetry of the
noise field.Consideration was also given to the sensitivity of the noise field to the precise position of ejector,
and runs on ejector A3 were made in quick succession at a pressure ratio of 1· 65 as follows:
To test the effect of skewness of the ejector, (i.e. the ejector axis was no longer parallel with the
axis of the unshrouded primary jet), the ejector efflux end was displaced upwards, downwards,
towards the measurement line and away from the measurement line. In each of these four cases
the displacement was by half an inch.
10
To test the effect of lateral location of the ejector (i.e. the ejector axis was parallel to, but no longercoincident with, the axis of the unshrouded primary jet), the ejector was moved away from themeasurement line and also towards it, in each case the shift being a quarter of an inch.
To test the effect of the longitudinal location of the ejector, the ejector was moved towards andaway from the primary nozzle by a fifth of an inch, effectively altering (lld 1) to 0·6 and 0·4 instead of0·5. .
The results of these tests are compared with the 'normal' tests in Table 3b by showing the spreadproduced. Although the displacements were somewhat greater than any mis-positioning which couldbe anticipated in normal practice, the alterations in noise levels were trifling. These tests show that thenoise emitted was essentially a stable quantity and that reliance could be placed on the recordedsound pressure levels. A slight rider to this conclusion exists and this is considered in Section 5.3.
3.3. The Accuracy of Measurements of Quantities other than Noise.
Due to the flexibility of the floor gratings the Acoustics Laboratory was not well-suited to thetaking of measurements which involved heavy pieces of equipment or rigid mountings. As aconsequence the tests were almost exclusively limited to noise investigations though checks were infact made of the inflow velocity at the mouths of several ejectors. The agreement with the results of
Reid" were generally excellent as shown in Fig. 6a, and it was possible to reproduce the irregularityin the Mach number curve shown in his Fig.8b for ejector Bl. The only noteworthy difference found
on any occasion was with ejector C1 which had a slight but definite irregularity in the inflow curve
at a pressure ratio of about 1· 25. This is shown in Fig. 6b.
4. The Identification of Noise Sources.
As Section 3.2 has shown, the extraneous noise was sufficiently small to leave unaffected the noiselevels measured when the ejector system was operating, and any emission must have been confined to
radiation from the ejector casing, ('noise from the sides')
radiation from the ejector intake, ('noise from the entrance')
radiation from the ejector efflux ('noise from the exit')
The investigation of these sources was the next requirement.
4.1. Noise Radiated through Ejector Walls.
In order to investigate the quantity of noise coming from the walls, a long ejector was selected toprovide a large radiating surface. The noise levels measured during a traverse along line b whenejector B5 was mounted within an iron tube the annulus being packed with sand were no differentfrom those taken when this ejector was mounted normally. The tube was as large as the mountingsystem would allow, some 54 inches long and 6~- inches in diameter. Fig. 7 compares both theiroverall noise along line b and the spectra at a typical position. Had the noise been coming throughthe side, the addition of the weighty sand would have affected the transmission according to the'Mass Law' with a fall-off in level approximating to 6 db per octave rise, as has been measuredbefore in this laboratory when noise was being radiated through the walls of a structure carryinginternal airflow (Middleton'"). It was therefore clear that in the present experiments no noisewas coming from the ejector walls.
11

4.2. Noise Radiated from Ejector Intakes.
In the curve of overall noise shown in Fig. 7, the bulge occurring square with the ejector intake
suggested that some noise was being emitted from the intake. To investigate this effect an 'intake box'
was constructed, and it is partially shown in Figs. 2 and 3. In two interlocking parts it was made of
half-inch thick ply with a one-and-a-half-inches thick lining of the poly-urethane foam 'Volag' to act as
sound absorber. It was mounted from the upper bar supporting the ejector clamping arrangement,
and the ejector passed through a hole in the square face with the gap sealed by the soft collar of Volag
nestling around the ejector. With such a design it was possible to use the same box for all three
diameters of ejector. The face was 19 inches square, and the side walls stretched back 61 inches so
that with these dimensions screening of the ejector exit only occurred for the few measuring positions
indicated in Fig. 3.
Use of the intake box made it necessary to ensure that no restriction of the secondary airflow
was introduced, and checks showed that the same static depressions at the ejector inlet occurred
for the same value of total head as had been obtained previously. Thus the aerodynamic performance
of the ejector was unimpaired. The resulting trace of overall noise for line b is shown in Fig. 8together with third-octave spectra at positions bO and b9. These results show that the 'bulge' around
the intake location had been eradicated, whilst further downstream the noise was unaffected. This
latter must therefore be solely due to radiatio~ from the efflux.
As a result of this test it was decided to do all investigations of the efflux noise with this suppressor
in position, for if this were not done the contribution from the intake noise would confuse the
results. On the other hand an investigation of the intake noise in its own right was not possible since
the radiation from the efflux end produced too great a masking effect. From Fig. 8 it can be seen that
for this particular ejector 3 db was the most by which the overall noise was increased by the intake
noise, so that the intake noise could only equal the remaining noise and was in general exceeded by it.
5. The Types of Noise Emitted.
The previous sections have shown that broad-band noise radiated through the ejector casing was
not a significant factor, and that the effect of noise from the intake could be eliminated. The problem
thus remained of identifying the types of noise emitted from the efflux.
5.1. Shock Noise.
It was soon evident that at sufficiently high operating condition, strong 'shrieks' were present.
For the un shrouded primary nozzle, they were manifest at pressure ratios of about 2· 1 and above
and their onset was accompanied by a sharp change in the rate of increase of noise as indicated by
the trace of overall noise oersus pressure in Fig. 5. The display on the panoramic analyser at a given
pressure ratio was similar to the photograph shown in Fig. lOa and narrow-band analyses of the
noise at the bO position are given in Fig. 11 for pressure ratios of 1· 8 and 2·6. It is clear that thescreech heard and the increase in noise output of the order of 10 db were due to the strong discrete
frequency components which the narrow-band analysis indicated.
This screech phenomenon was first reported by Powell" working on axi-symmetric jets and hesubsequently extended this to two-dimensional jets-? which were easier to study experimentally.
Such shrieking can only occur when the jet is operating at a pressure ratio above the choking value
of 1· 89 and the mechanism can be considered as follows:
'When air discharges from a convergent nozzle, the speed of flow at the mouth cannot be greater
than the local speed of sound. When the total pressure upstream of the nozzle is raised above the
12
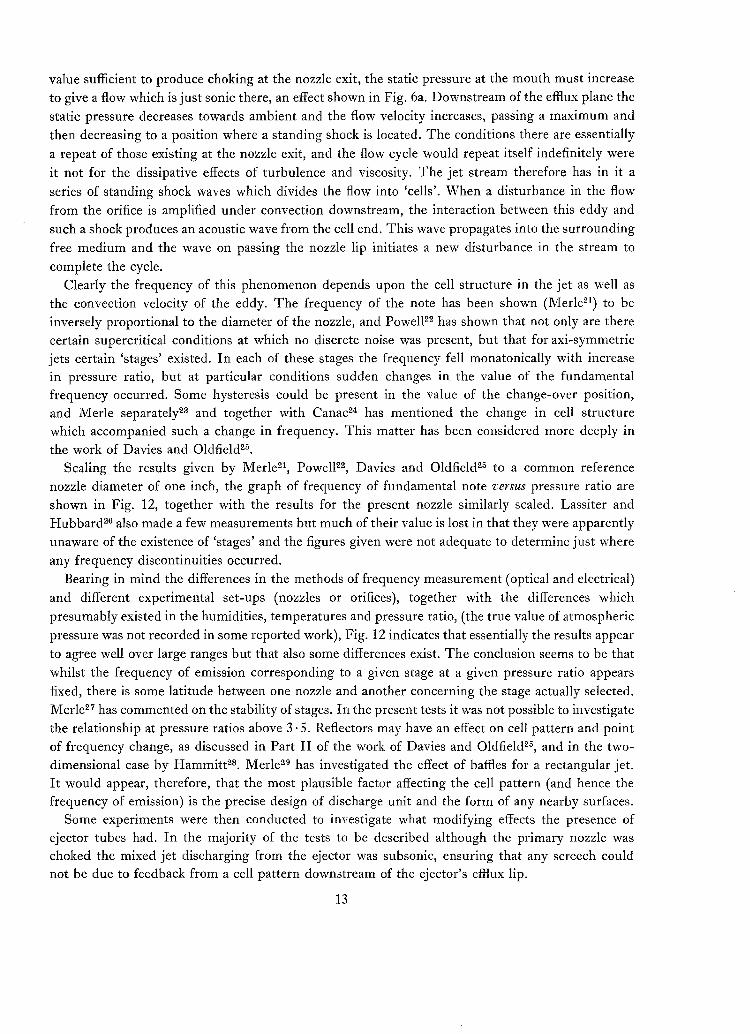
value sufficient to produce choking at the nozzle exit, the static pressure at the mouth must increaseto give a flow which is just sonic there, an effect shown in Fig. 6a. Downstream of the efflux plane thestatic pressure decreases towards ambient and the flow velocity increases, passing a maximum and
then decreasing to a position where a standing shock is located. The conditions there are essentially
a repeat of those existing at the nozzle exit, and the flow cycle would repeat itself indefinitely were
it not for the dissipative effects of turbulence and viscosity. The jet stream therefore has in it a
series of standing shock waves which divides the flow into 'cells'. When a disturbance in the flow
from the orifice is amplified under convection downstream, the interaction between this eddy and
such a shock produces an acoustic wave from the cell end. This wave propagates into the surroundingfree medium and the wave on passing the nozzle lip initiates a new disturbance in the stream to
complete the cycle.Clearly the frequency of this phenomenon depends upon the cell structure in the jet as well as
the convection velocity of the eddy. The frequency of the note has been shown (Merle'"] to beinversely proportional to the diameter of the nozzle, and Powell'f has shown that not only are therecertain supercritical conditions at which no discrete noise was present, but that for axi-symrnetricjets certain 'stages' existed. In each of these stages the frequency fell monatonically with increasein pressure ratio, but at particular conditions sudden changes in the value of the fundamentalfrequency occurred. Some hysteresis could be present in the value of the change-over position,and Merle separately'" and together with Canacs! has mentioned the change in cell structurewhich accompanied such a change in frequency. This matter has been considered more deeply inthe work of Davies and Oldfield'".
Scaling the results given by Merle-", Powell-", Davies and Oldfield'" to a common referencenozzle diameter of one inch, the graph of frequency of fundamental note uersus pressure ratio areshown in Fig. 12, together with the results for the present nozzle similarly scaled. Lassiter andHubbard'" also made a few measurements but much of their value is lost in that they were apparently
unaware of the existence of 'stages' and the figures given were not adequate to determine just whereany frequency discontinuities occurred.
Bearing in mind the differences in the methods of frequency measurement (optical and electrical)
and different experimental set-ups (nozzles or orifices), together with the differences which
presumably existed in the humidities, temperatures and pressure ratio, (the true value of atmosphericpressure was not recorded in some reported work), Fig. 12 indicates that essentially the results appear
to agree well over large ranges but that also some differences exist. The conclusion seems to be that
whilst the frequency of emission corresponding to a given stage at a given pressure ratio appearsfixed, there is some latitude between one nozzle and another concerning the stage actually selected.Merle-? has commented on the stability of stages. In the present tests it was not possible to investigatethe relationship at pressure ratios above 3·5. Reflectors may have an effect on cell pattern and pointof frequency change, as discussed in Part II of the work of Davies and Oldfield'", and in the twodimensional case by Hammitt'". Merle-" has investigated the effect of baffles for a rectangular jet.It would appear, therefore, that the most plausible factor affecting the cell pattern (and hence thefrequency of emission) is the precise design of discharge unit and the form of any nearby surfaces.
Some experiments were then conducted to investigate what modifying effects the presence ofejector tubes had. In the majority of the tests to be described although the primary nozzle waschoked the mixed jet discharging from the ejector was subsonic, ensuring that any screech couldnot be due to feedback from a cell pattern downstream of the ejector's efflux lip.
13

That the phenomenon was again present with ejector tubes is shown by the photograph in
Fig. lOa which is for ejector BI. Its existence in the present series of tests was first reported by
Middleton and Richards'". As with the unshrouded case, a well-defined fundamental together with
its simple harmonics were present. In general the higher harmonics were of weaker strength but
could often be detected up to the upper frequency limit of the analysing equipment. Powell's work'"
indicated that for an unshrouded jet the ratios of their strengths were a function of measuring
position. In the shrouded case such directivity effects must have been somewhat modified by the
fact that the acoustic wave had to be propagated back to the orifice not through quiescent atmosphere
but through the secondary flow, the subsonic annulus surrounding the supersonic primary flow.
As mixing between the streams was taking place this must have further blurred the picture. Fig. 13contains the plot of frequency of the fundamental note against pressure ratio both for the unshrouded
jet and for a typical ejector. Other ejectors gave different curves, and it is clear that the cell pattern
must have undergone considerable quantitative modification from the unshrouded case.
Evidence is exceedingly scanty supporting the existence of shock noise when full-scale axial-flow
turbo-jet engines are operating at suitable pressure ratios. This is not simply due to temperature
effects as Lassiter and Hubbard'" reported discrete frequencies on a hot model jet, although they
were relatively much weaker. This suggests that the strength of the mechanism is dependent on the
amount of roughness or initial turbulence in the system. Powell''! discussed the possibility of
eliminating the discrete components by roughening the flow and so steps were taken to investigate
this approach.Using the primary nozzle without any ejector, it was found that by glueing a thin coat of sand
to the convergent approach section of the nozzle some amelioration was produced. A particular
result was a reduction of 5 db in the overall noise thereby bringing it to within 2 db of the broad-band
contribution. The new spectrum is shown in Fig. 11. A similar coating to the external face of the
primary nozzle made no difference nor did a lining of emery paper within the internal cylindrical
section save for a rise in frequency consistent with the decrease in effective nozzle diameter. When
used with an ejector this modified nozzle still produced discrete frequencies. Roughening made no
detectable difference to the broad-band noise. It is clear from these results and from the earlier
Southampton tests of Foxwell'! which have been already mentioned, that complete elimination of
such frequencies might only be possible with a system which had undergone appreciable modification.
As a consequence it was decided to restrict work to the unmodified arrangement with narrow-band
analysis as necessary.
5.2. Excess Broad-Band High-Frequency Emission.
Under certain conditions a further type of noise was found superimposed on the spectrum.
Unlike the discrete-frequency phenomenon already discussed, it was broad band in character with a
lower bound usually between about 5 and 10 kc/s. The level of the noise sometimes varied with time.
Although this noise was first discovered when an ejector was being used, its existence was confirmed
on the unshrouded primary nozzle and also on the machined nozzle previously used for other jet
work in the laboratory. The phenomenon was also detected with an independent recording system of
crystal microphone, transistorised cathode follower and separate recorder. Thus it was not peculiar to
the particular configuration under investigation, nor was it due to a fault in the manner of recording.
Typical examples of this additional high-frequency noise are shown in Fig. 14a which illustrate
that the 'excess noise' appeared to have a lower frequency limit dependent on pressure ratio. Any
14
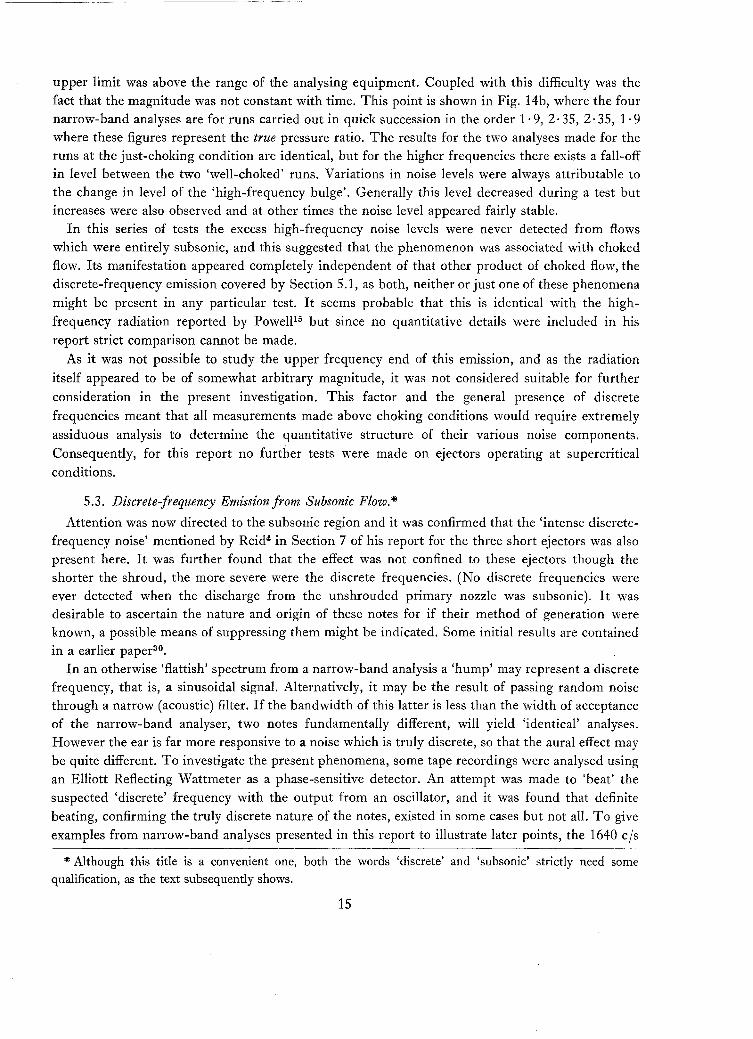
upper limit was above the range of the analysing equipment. Coupled with this difficulty was thefact that the magnitude was not constant with time. This point is shown in Fig. 14b, where the fournarrow-band analyses are for runs carried out in quick succession in the order 1· 9, 2· 35, 2· 35, 1· 9where these figures represent the true pressure ratio. The results for the two analyses made for theruns at the just-choking condition are identical, but for the higher frequencies there exists a fall-offin level between the two 'well-choked' runs. Variations in noise levels were always attributable to
the change in level of the 'high-frequency bulge'. Generally this level decreased during a test butincreases were also observed and at other times the noise level appeared fairly stable.
In this series of tests the excess high-frequency noise levels were never detected from flowswhich were entirely subsonic, and this suggested that the phenomenon was associated with choked
flow. Its manifestation appeared completely independent of that other product of choked flow, thediscrete-frequency emission covered by Section 5.1, as both, neither or just one of these phenomena
might be present in any particular test. It seems probable that this is identical with the high
frequency radiation reported by Powell'> but since no quantitative details were included in his
report strict comparison cannot be made.
As it was not possible to study the upper frequency end of this emission, and as the radiation
itself appeared to be of somewhat arbitrary magnitude, it was not considered suitable for further
consideration in the present investigation. This factor and the general presence of discrete
frequencies meant that all measurements made above choking conditions would require extremely
assiduous analysis to determine the quantitative structure of their various noise components.
Consequently, for this report no further tests were made on ejectors operating at supercritical
conditions.
5.3. Discrete-frequency Emission from Subsonic Flow.*Attention was now directed to the subsonic region and it was confirmed that the 'intense discrete
frequency noise' mentioned by Reid! in Section 7 of his report for the three short ejectors was alsopresent here. It was further found that the effect was not confined to these ejectors though theshorter the shroud, the more severe were the discrete frequencies. (No discrete frequencies wereever detected when the discharge from the unshrouded primary nozzle was subsonic). It wasdesirable to ascertain the nature and origin of these notes for if their method of generation wereknown, a possible means of suppressing them might be indicated. Some initial results are contained
in a earlier paper'".In an otherwise 'flattish' spectrum from a narrow-band analysis a 'hump' may represent a discrete
frequency, that is, a sinusoidal signal. Alternatively, it may be the result of passing random noisethrough a narrow (acoustic) filter. If the bandwidth of this latter is less than the width of acceptance
of the narrow-band analyser, two notes fundamentally different, will yield 'identical' analyses.However the ear is far more responsive to a noise which is truly discrete, so that the aural effect may
be quite different. To investigate the present phenomena, some tape recordings were analysed usingan Elliott Reflecting Wattmeter as a phase-sensitive detector. An attempt was made to 'beat' the
suspected 'discrete' frequency with the output from an oscillator, and it was found that definite
beating, confirming the truly discrete nature of the notes, existed in some cases but not all. To give
examples from narrow-band analyses presented in this report to illustrate later points, the 1640 cis* Although this title is a convenient one, both the words 'discrete' and 'subsonic' strictly need some
qualification, as the text subsequently shows.
15

signal and its harmonics in Fig. 15 were found to be discrete but none of the others and none of the
ones for ejector C4 in Fig. 17. On the other hand, 'discreteness' was not necessarily restricted to one
'mode' as another spectrum gave two frequencies, quite close together, as being each discrete.
This pair in fact occurred in a spectrum which also contained shock noise. All the tests carried out
on 'shock' frequencies showed them to be discrete phenomena. Thus the word 'discrete' in the title
of this section needs to be treated with reserve. Its repeated use in the text which follows, is not
therefore intended to signify precisely the nature of a given note. Correct at least in some cases, it is
certainly a convenient term to describe any 'extrusions' in a spectrum.
To ensure that the discrete frequencies measured were not due to interference effects in
propagation, (for example, standing waves produced by interaction between noise emitted from the
ejector intake and efflux ends), measurements were taken of the noise spectrum at more than one
position in the laboratory. It was found that the discrete notes had exactly the same frequencyalthough their amplitude and that of the broad-band noise on which they were superimposed varied
according to position. Significant discrete-frequency radiation was found to come from both the
upstream and downstream ends of the ejector. It was also shown that, within the response capabilities
of a probe microphone which was inserted into the wall of an ejector, the discrete frequencies within
the tube were the same as those recorded externally. No further attempt to establish the directionality
of the discrete-frequency noise was made, and measurements of this phenomenon were now restricted
to the noise output recorded at position bf). A typical photograph of the resultant display on the
panoramic analyser is shown in Fig. lOb.
A trace of the overall noise measured as the stagnation pressure was steadily increased is shown for
ejector A2 in Fig. 5. The difference between the noise output of an ejector and that of the primary
nozzle which is also shown in Fig. 5 is most marked. As the driving pressure was steadily increased,
the low note dominating the jet roar, and whieh appeared to be present from the moment the discharge
commenced, rose in frequency. Harmonics were also present, and at certain stages in the increase
in operating condition, frequencies seemed to 'cut in' or die away, producing quite sudden changes
in the aural quality and in the level of the noise. Thus quite complicated spectra could result. The
quick changes in level are clear in the appropriate trace in Fig. 5, and the frequency changes which
occurred are demonstrated in the Sona-Graph trace of Fig. 4. This latter is, in fact, an analysis of a
2·4 seconds period in the tape recording of which this level recorder trace is a replay, and it was
possible in the analysis to correlate the frequency changes with alterations in the overall level.
Further increase in pressure was accompanied by a steady increase in the broad-band discharge
noise, and the discrete components tended to become engulfed by this noise. However, in some
cases the components were sufficiently intrusive to be still detectable when the primary nozzle had
choked so that a 'mixed spectrum' resulted, i.e. a spectrum which contained discrete frequencies
associated with shock noise as well as discrete frequencies which were an extension from the subsonic
range. No confusion ever arose as to which type was which. Although not entirely correct it is therefore
convenient to refer to this type of frequency as a 'subsonic flow discrete frequency' in contrast to
the 'supersonic flow discrete frequencies' of Section 5.1.
The plot of overall noise against pressure ratio obtained from step-by-step increase in operatingcondition for this ejector A2 is contained in Fig. 9. When the pressure was decreased, slight hysteresis
was sometimes revealed. Even allowing for the fact that the equivalent trace in Fig. 5 lacks a precise
pressure scale, differences are seen to exist between these two results taken at position bfl, This is due
to the fact that since the pressure was being increased continuously the conditions within the shroud
16

never achieved the 'steady' states corresponding to stepwise increases, and one could thereforeanticipate differences between these two acoustic outputs. The response time of the recorder stylus
might also have some effect on the trace in Fig. 5. A plot of the overall noise from the unshroudedprimary nozzle, as measured at position b2, is also included in Fig. 9. It is evident that this discretenoise could be of sufficient magnitude to more than off-set any reduction in the broad-band noisewhich the ejector system might achieve over the unmodified jet.
Two mechanisms might be envisaged as possibly responsible for the production of such tones.The first was that turbulence in the internal flow caused pressure fluctuations on the inner face ofthe ejector and the recorded sound was due to this excitation of the tube. Weyers'" has in factreported this effect in measurements on tubes made of Mylar. A second mechanism was that sometype of 'organ-piping' was occurring, the word here meaning any periodic motion associated with theairflows inside the ejector. Clearly these methods are not mutually exclusive and it might be that eachcontributed to the production of these notes.
To determine the type of oscillation, some simple tests were carried out, using ejector A2. A crystalstrain gauge to measure any bending or twisting strain in the plane of the surface and anaccelerometer to measure vibrations perpendicular to the surface were mounted on the ejector.
The usual supports for the ejector were adapted for use on an antivibration block in the Structuresand Vibration Laboratory of the Department. The stud from a Goodman's Vibration Generator was
mounted through a hole 0·4 inch from the unflanged end of the ejector and a Muirhead-WiganDecade Oscillator used to excite the vibrator. The strain-gauge output was taken both to the SolartronResolved Component Indicator and to the Tektronix Dual-Beam Oscilloscope, this latter also
monitoring the input frequency. Although it can only be used with a sine-wave input and thus notwith jet noise, the advantage of the Resolved Component Indicator was that by measuring phasechange as well as signal magnitude it was possible to locate a resonant peak even if the transducer
were on a node. This analysis became rather lengthy due to the very large frequency range to becovered and was replaced by noting the magnitude of the deflection of the output signal on theoscilloscope. In this way the frequencies of the tube up to 5000 cis were located. A similar check wasmade using the accelerometer. The ejector was next excited using the output from a Dawes WhiteNoise Generator, and the output on a tape was then narrow-band-analysed by the Pametrada WaveAnalyser. This procedure was repeated after moving one of the supports for the ejector. The resultsshowed that due to the change in constraint small alterations had occurred in the values of thefrequencies, especially the lower ones. The ejector was then remounted in its usual manner relativeto the primary nozzle and the noise, accelerometer and strain-gauge outputs were measured for apressure ratio of 1· 35. With the ejector re-erected with only one support, these outputs werere-taken for the same pressure ratio. The results from these strain-gauge and noise tests are shown inFig. 15 but no allowance has been made for the non-linearity of the strain-gauge response. Theaccelerometer results, being similar to those of the straingauge have been omitted*. It is clear fromthis figure that whilst the modes of vibration of the tubes were dependent on the constraints ofthe mounting the noise output was not thus dependent. Therefore although the walls of the tubewere excited by the internal airflow, the frequencies of their vibration were not identical with theacoustic discrete frequencies and the phenomenon was not due to mechanical vibration.
* 'Similar' here means that many of the frequencies shown by one were also shown by the other. However,each possessed spectrum peaks not apparent in the second.
17
(91137) B
To investigate whether the amplitude of the shell vibration had any effect on the radiated noise,
a half-inch thick layer of 'Aquaplas', which has high natural damping properties, was placed around
the ejector A2. Previously the freely suspended tube when struck had given quite a 'metallic ring'
but it now sounded completely 'dead'. However, at given operating condition of the jet the noise
level and the spectrum were identical with the unmodified ejector results.
The noise level and the spectrum shape were also completely unaffected when the system was
mass-controlled by encasing the ejector within a two-inch thick annulus of sand. A check on ejector
BS showed that its discrete frequencies were so weak as to be virtually undetectable, and so the
earlier tests covered by Section 4.1 had in fact dealt with the sole question of transmission of broad
band noise through the ejector shell. These earlier tests and the present ones together show that
neither broad-band nor discrete-frequency noise was radiated from the ejector walls.
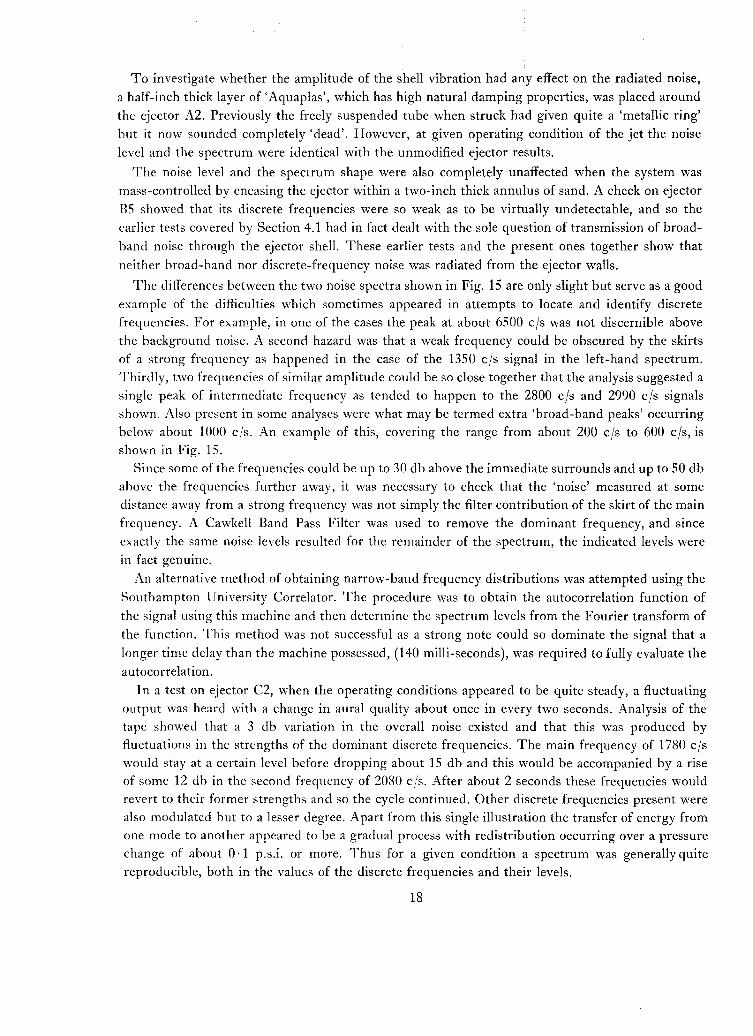
The differences between the two noise spectra shown in Fig. 15 are only slight but serve as a good
example of the difficulties which sometimes appeared in attempts to locate and identify discrete
frequencies. For example, in one of the cases the peak at about 6500 cis was not discernible above
the background noise. A second hazard was that a weak frequency could be obscured by the skirts
of a strong frequency as happened in the case of the 1350 cis signal in the left-hand spectrum.
Thirdly, two frequencies of similar amplitude could be so close together that the analysis suggested a
single peak of intermediate frequency as tended to happen to the 2800 cis and 2990 cis signalsshown. Also present in some analyses were what may be termed extra 'broad-band peaks' occurring
below about 1000 cis. An example of this, covering the range from about 200 cis to 600 cis, isshown in Fig. 15.
Since some of the frequencies could be up to 30 db above the immediate surrounds and up to 50 db
above the frequencies further away, it was necessary to check that the 'noise' measured at somedistance away from a strong frequency was not simply the filter contribution of the skirt of the main
frequency. A Cawkell Band Pass Filter was used to remove the dominant frequency, and since
exactly the same noise levels resulted for the remainder of the spectrum, the indicated levels were
in fact genuine.
An alternative method of obtaining narrow-band frequency distributions was attempted using the
Southampton University Correlator. The procedure was to obtain the autocorrelation function of
the signal using this machine and then determine the spectrum levels from the Fourier transform of
the function. This method was not successful as a strong note could so dominate the signal that a
longer time delay than the machine possessed, (140 milli-seconds), was required to fully evaluate the
autocorrelation.
In a test on ejector C2, when the operating conditions appeared to be quite steady, a fluctuating
output was heard with a change in aural quality about once in every two seconds. Analysis of the
tape showed that a 3 db variation in the overall noise existed and that this was produced by
fluctuations in the strengths of the dominant discrete frequencies. The main frequency of 1780 ciswould stay at a certain level before dropping about 15 db and this would be accompanied by a rise
of some 12 db in the second frequency of 2080 cis. After about 2 seconds these frequencies would
revert to their former strengths and so the cycle continued. Other discrete frequencies present were
also modulated but to a lesser degree. Apart from this single illustration the transfer of energy fromone mode to another appeared to be a gradual process with redistribution occurring over a pressure
change of about 0·1 p.s.i. or more. Thus for a given condition a spectrum was generally quitereproducible, both in the values of the discrete frequencies and their levels.
18
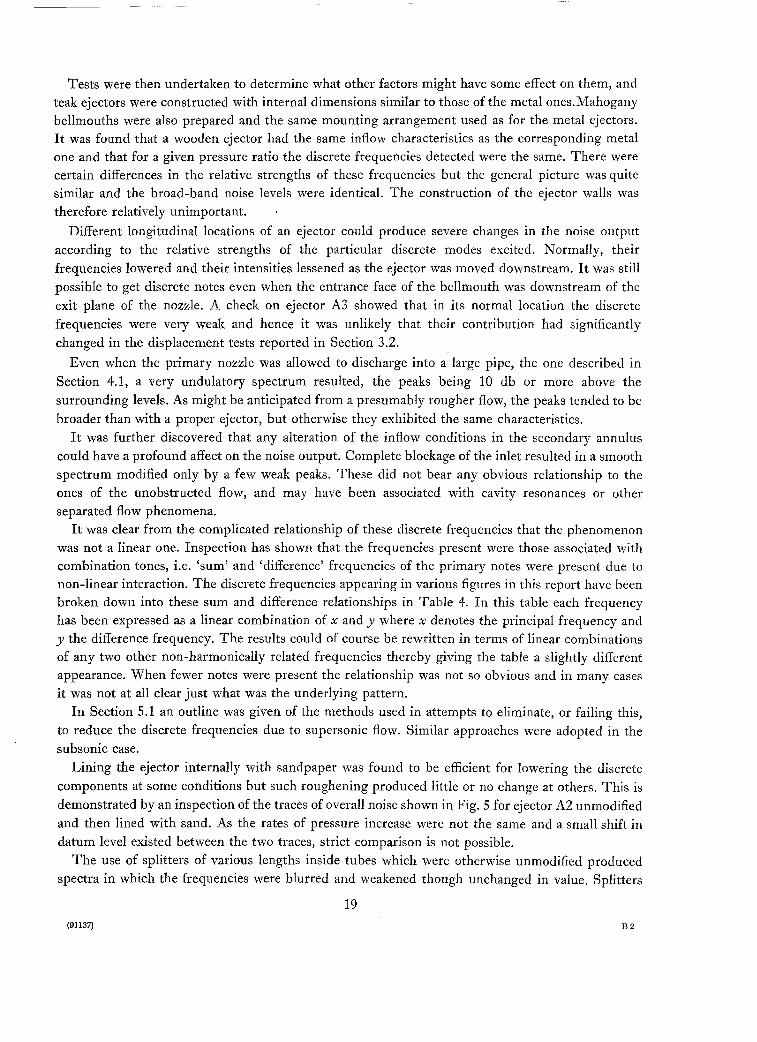
Tests were then undertaken to determine what other factors might have some effect on them, andteak ejectors were constructed with internal dimensions similar to those of the metal ones. Mahoganybellmouths were also prepared and the same mounting arrangement used as for the metal ejectors.It was found that a wooden ejector had the same inflow characteristics as the corresponding metalone and that for a given pressure ratio the discrete frequencies detected were the same. There werecertain differences in the relative strengths of these frequencies but the general picture was quitesimilar and the broad-band noise levels were identical. The construction of the ejector walls wastherefore relatively unimportant.
Different longitudinal locations of an ejector could produce severe changes in the noise outputaccording to the relative strengths of the particular discrete modes excited. Normally, theirfrequencies lowered and their intensities lessened as the ejector was moved downstream. It was stillpossible to get discrete notes even when the entrance face of the bellmouth was downstream of theexit plane of the nozzle. A check on ejector A3 showed that in its normal location the discrete
frequencies were very weak and hence it was unlikely that their contribution had significantly
changed in the displacement tests reported in Section 3.2.
Even when the primary nozzle was allowed to discharge into a large pipe, the one described inSection 4.1, a very undulatory spectrum resulted, the peaks being 10 db or more above the
surrounding levels. As might be anticipated from a presumably rougher flow, the peaks tended to bebroader than with a proper ejector, but otherwise they exhibited the same characteristics.
It was further discovered that any alteration of the inflow conditions in the secondary annuluscould have a profound affect on the noise output. Complete blockage of the inlet resulted in a smoothspectrum modified only by a few weak peaks. These did not bear any obvious relationship to theones of the unobstructed flow, and may have been associated with cavity resonances or otherseparated flow phenomena.
It was clear from the complicated relationship of these discrete frequencies that the phenomenonwas not a linear one. Inspection has shown that the frequencies present were those associated withcombination tones, i.e. 'sum' and 'difference' frequencies of the primary notes were present due tonon-linear interaction. The discrete frequencies appearing in various figures in this report have beenbroken down into these sum and difference relationships in Table 4. In this table each frequencyhas been expressed as a linear combination of x and y where x denotes the principal frequency andy the difference frequency. The results could of course be rewritten in terms of linear combinationsof any two other non-harmonically related frequencies thereby giving the table a slightly differentappearance. When fewer notes were present the relationship was not so obvious and in many casesit was not at all clear just what was the underlying pattern.
In Section 5.1 an outline was given of the methods used in attempts to eliminate, or failing this,to reduce the discrete frequencies due to supersonic flow. Similar approaches were adopted in thesubsonic case.
Lining the ejector internally with sandpaper was found to be efficient for lowering the discretecomponents at some conditions but such roughening produced little or no change at others. This is
demonstrated by an inspection of the traces of overall noise shown in Fig. 5 for ejector A2 unmodifiedand then lined with sand. As the rates of pressure increase were not the same and a small shift indatum level existed between the two traces, strict comparison is not possible.
The use of splitters of various lengths inside tubes which were otherwise unmodified producedspectra in which the frequencies were blurred and weakened though unchanged in value. Splitters
19(91137) B2
were also tested in conjunction with an ejector known to be almost free from discrete notes and a
considerable change in the directivity and strength of the noise field ensued, presumably due to the
introduction of dipole radiation as well as changes in the basic aerodynamic parameters.
The final method was an attempt to absorb these frequencies using a foam plastic as the internal
lining for the ejectors. A half-inch thick coat for ejector Cl reduced its dimensions to approximately
those of ejector AI, and the discrete output was much less than that from either of these ejectors
when unmodified. In contrast, when the foam linings were tested in conjunction with tubes whose
discrete frequencies were weak, the noise level increased.
The conclusion from this work was that no physical method existed of removing these discrete
frequencies which did not entail a most drastic modification of the whole system.
5.4. Broad-Band Discharge Noise.
The foregoing sections have shown that the study of the broad-band noise from the effiux of
ejectors was severely complicated by the presence of other types of noise, the only one to be success
fully eliminated being the noise from the inlet by the use of an intake box. All tests on ejectors weretherefore carried out using the intake muffier as the only significant modification to the corresponding
ejector set-up of Reid". In view of Sections 5.1 and 5.2 the jet had generally to be subsonic, although
in certain cases operation slightly above the choking pressure ratios was found to be permissible.
Even in the subsonic cases the discrete-frequency phenomena described in Section 5.3 could be
so severe that it was impossible to estimate the level of the broad-band spectrum on which these
discrete frequencies were superimposed. These frequencies were strongest for the shorter shrouds
but, as this section will show, extrapolation from the longer shrouds indicated that the anticipated
broad-band attenuation from these short ejectors would be very small and less than the likely error
involved in such estimation. Noise tests on ejectors were therefore restricted to those conditions
where it was possible to make a reasonable assessment of the contribution of the discrete frequenciesto the overall noise.
The procedure adopted for noise measurement has been described in Sections 3.1 and 3.2. Complete
surveys over lines a, b, c and d were made for the primary nozzle operating at pressure ratios of
1·2, 1· 35 and 1·65, and as there was no evidence of shock noise or 'high-frequency bulge', measure
ments were also taken at a pressure ratio of 2· O. This range covered the greater proportion of the
effiux velocities encountered in ejector tests. Inspection of the results showed that interpolation oflevels at any point within the area of measurement presented no difficulty, and more comprehensive
tests at a particular point showed that over the velocity range encountered the value of n was constant
in the assumed relationship:
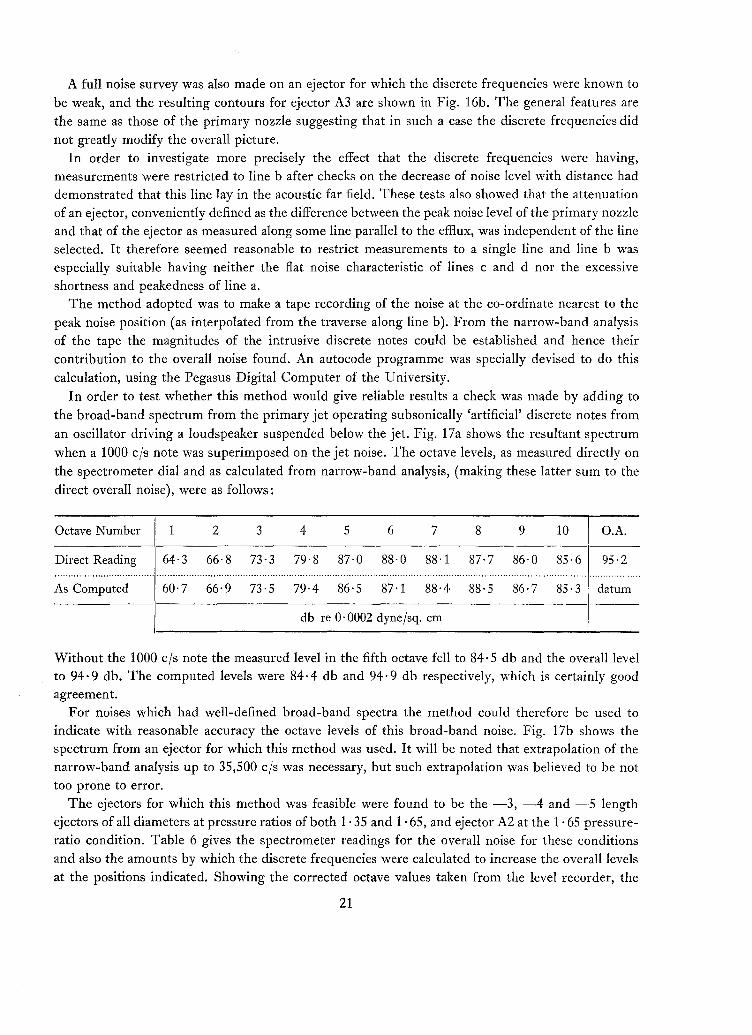
Sound pressure in octave bandwidth is proportional to the nth power of the jet velocity.
For the position selected, approximately that of peak noise on line b, this value of n lay between
about 6·5 and 10 (depending on the particular octave) and the overall noise had a velocity index of
about 8·5, which is similar to Lighthill's value of 8 for the integrated sound power output.The contours of overall noise obtained from the spectrometer dial readings are shown in Fig. 16a
for a pressure ratio of 1· 65, and the corrected octave levels for all four operating conditions are
given for line b in Table 5. These results illustrate that the noise field from the primary nozzle is in
qualitative agreement with the profuse literature now available on the noise from simple jets,
e.g. von Gierke", together with the work of Gerrard'" for cold subsonic jets and Pietrasanta's results'"
for full-scale hot turbo-jets.
20
A full noise survey was also made on an ejector for which the discrete frequencies were known tobe weak, and the resulting contours for ejector A3 are shown in Fig. 16b. The general features arethe same as those of the primary nozzle suggesting that in such a case the discrete frequencies didnot greatly modify the overall picture.
In order to investigate more precisely the effect that the discrete frequencies were having,measurements were restricted to line b after checks on the decrease of noise level with distance haddemonstrated that this line lay in the acoustic far field. These tests also showed that the attenuationof an ejector, conveniently defined as the difference between the peak noise level of the primary nozzleand that of the ejector as measured along some line parallel to the efflux, was independent of the lineselected. It therefore seemed reasonable to restrict measurements to a single line and line b wasespecially suitable having neither the flat noise characteristic of lines c and d nor the excessiveshortness and peakedness of line a.
The method adopted was to make a tape recording of the noise at the co-ordinate nearest to thepeak noise position (as interpolated from the traverse along line b). From the narrow-band analysisof the tape the magnitudes of the intrusive discrete notes could be established and hence theircontribution to the overall noise found. An autocode programme was specially devised to do this
calculation, using the Pegasus Digital Computer of the University.In order to test whether this method would give reliable results a check was made by adding to
the broad-band spectrum from the primary jet operating subsonically 'artificial' discrete notes from
an oscillator driving a loudspeaker suspended below the jet. Fig. 17a shows the resultant spectrum
when a 1000 cis note was superimposed on the jet noise. The octave levels, as measured directly onthe spectrometer dial and as calculated from narrow-band analysis, (making these latter sum to the
direct overall noise), were as follows:
Octave Number
Direct Reading
As Computed
1 2 3 4 5 6 7 8 9 10 O.A.
64·3 66·8 73·3 79·8 87·0 88·0 88·1 87·7 86·0 85·6 95·2
60·766·973·579·486·5 87·1 88·488·5 86·785·3 datum
db re 0·0002 dyne/sq. em
Without the 1000 cIs note the measured level in the fifth octave fell to 84·5 db and the overall levelto 94·9 db. The computed levels were 84·4 db and 94·9 db respectively, which is certainly goodagreement.
For noises which had well-defined broad-band spectra the method could therefore be used toindicate with reasonable accuracy the octave levels of this broad-band noise. Fig. 17b shows thespectrum from an ejector for which this method was used. It will be noted that extrapolation of thenarrow-band analysis up to 35,500 cis was necessary, but such extrapolation was believed to be nottoo prone to error.
The ejectors for which this method was feasible were found to be the -3, -4 and -5 lengthejectors of all diameters at pressure ratios of both 1· 35 and 1· 65, and ejector A2 at the 1· 65 pressureratio condition. Table 6 gives the spectrometer readings for the overall noise for these conditionsand also the amounts by which the discrete frequencies were calculated to increase the overall levelsat the positions indicated. Showing the corrected octave values taken from the level recorder, the
21
parameter in Table 7 is ejector length whilst in Table 8 it is ejector diameter. In the right-hand
column in these two tables some octave levels are shown, these being the levels after the discrete
contribution had been filtered out at the specified position. In this column a value identical with the
corresponding position in the main table indicates the strength was insufficient to alter it by as much
as half a decibel whilst the absence of any figure means that no discrete note was detected in that
octave.
The results immediately demonstrate that the longer the ejector the smaller the quantity of noise
radiated. To assess the effect of tube diameter, Fig. 18 has been plotted. It shows that ejectors of
similar length tend to produce similar amounts of noise, and this is emphasised when the influence
of the discrete notes is removed by altering the level by the indicated amounts. The comparison of
the broad-band spectra for ejectors of equal length is made in Fig. 19 and their similarity is most
marked. It is unfortunate that it was not a practical proposition to attempt to filter out the discrete
freq uencics at all positions, (checks having shown that their contribution could be different at different
locations), and so strict comparison was limited to this study at the co-ordinate near the peak noise
position. However, Table 8 shows that the unfiltered spectra at any other positions are similar for all
three diameters.The work of Reid" demonstrated that at given operating pressure ratio, the difference between static
depression at the mouth of one ejector and another of the same length was not sufficiently large toproduce any big difference in the true Mach number of their primary discharges. The variation for
the -3, -4 and --5 tubes, to which the discussion is now limited, was quite small. Thus for a givenapplied pressure, the primary jet discharged into these sleeves at virtually the same velocity, although
the efflux velocity at the end of the ejector was sensitive to tube diameter as well as tube length.
As summarised recently by Lighthi1l35 , 36, when dealing with the discharge from a given shape of
exit, it has usually been possible to relate the radiated noise to some velocity measure in the jet.
Such factors as velocity profile, scale of turbulence and other parameters mainly govern the relation
ship between the noise from one type of nozzle and another. Therefore a plot of the filtered peak noise
levels against the logarithm of the peak final efflux velocities is given in Fig. 20. It is Fig. 21, however,
showing the peak-to-peak reduction in broad-band noise plotted against ejector length which gives
the good collapse of the data. From this graph it may be concluded that little additional attenuation
would result from employing ejector tubes of cven greater length. It is also clear as mentioned earlier,
that the reduction in the broad-band noise to be expected from the shorter ejectors is so small that
its magnitude would be less than the likely error in the method. No dependence of attenuation
characteristics on operating condition is revealed as a single curve, independent of pressure ratio,
may be fitted to these results.
The similarity of the broad-band noise field from ejectors of given length and operating at a given
pressure ratio, together with the fact shown in Fig. 20 that the noise levels were appreciably higher
than would be anticipated from a simple jet of equivalent velocity suggests that the noise measured
was essentially that of the primary jet discharging and mixing within the sleeve. The chief modifying
factor would he its passage along the ejector itself, and the lined ejector tests of Section 5.3 haveshown that the internal noise can be affected in this way.
6. Conclusions.
As was stressed in the part of Section 1 reviewing the published work on ejector noise, a correlation
of the results is not easy. The early work of North and Coles" referred to the reduction achieved in
22

total acoustic power but as this obscures directivity effects it has become more customary to referto the noise-reducing ability of a suppressor in simple terms such as the difference in peak soundpressure levels measured along the same line or arc for the device and an unmodified nozzle.Sometimes it has been possible to use units more adapted to the response of the ear by transformingthe spectra to get subjective units like 'PN db'. Due to the question of frequency shift from the presentsmall-scale cold jet to a full-scale hot jet, in the present report it has been more convenient to dealonly in objective units.
The following table shows how different the attenuations may appear when quoted in differentways even though the discussion is limited solely to objective units. In each case the attenuation isdefined as the difference between the maximum overall sound pressure level measured for theprimary nozzle and for the ejector along the indicated locus, and is quoted to the nearest j db.
The conditions are:
(i) a line parallel to the jet axis
(ii) an arc, centred on the primary nozzle, and of radius 90 nozzle diameters
(iii) as (ii), except that for the ejector the arc is centred on its downstream end.
'Attenuation' dbEjector Pjpo
(i) (ii) (iii)
A2 1·65 1 1 0-2A3 1· 35, 1· 65 2t It 3B5 1· 35, 1· 65 7 61. I 102
I
For the three ejectors shown, the discrete-frequency components were weak and would not thereforehave a large effect on the figures quoted. As Section 5,4 has stated, the attenuation obtained from (i)was independent of the line selected. The difference between the results for methods (ii) and (iii)would naturally decrease as the radius of the arc increased. The figure of ninety used above is thelargest one that the confines of the measurement area would allow. The actual figures for methods(ii) and (iii) were obtained by interpolation from contours similar to those of Fig. 16.
The foregoing work may be summarised by the following conclusions.
(1) A relatively small quantity of broad-band noise was radiated from anejector intake. It wasprincipally high frequency, suggesting it came from the initial part of the primary jet as it dischargedand mixed with the induced secondary flow. At a given position the noise from the intake wasgenerally dominated by the contribution from the exhaust, and a separate study of its own propertieswas therefore not feasible. In the present tests it was effectively suppressed using the absorber boxdescribed in the text.
(2) In addition to the usual broad-band discharge some broad-band noise of high frequencyappeared under certain conditions. It was detected when the primary nozzle was operating both withand without any ejector. Its magnitude appeared to vary in an arbitrary manner with time, and as asignificant proportion appeared to lie above the frequency range of the available instrumentation, itsstudy was not pursued. Its presence seemed to be confined to pressure ratios above choking, and so toexclude the effect, quantitative measurements of the broad-band noise from ejectors were restrictedto subsonic conditions.
23

(3) Shock noise appeared in the noise from the primary nozzle when operating at supersonic
conditions. The variation of frequency of the fundamental note with pressure ratio agreed well with
the work of some of the earlier experimenters. Differences existing amongst these workers may be
due to differences in their experimental arrangements.
(4) This shock noise was also found to be present when the primary jet was operating super
sonically within an ejector. The variation of frequency with operating condition differed for different
ejectors suggesting modifications to the cell pattern by the ejector. Various references'': 16 support the
view that the phenomenon may have been present in associated unpublished data.
(5) A second source of discrete-frequency noise has been shown to exist. Although, for a given
ejector, these frequencies may have been detected at operating conditions which continued into the
supersonic range, they were usually strongest at the lower conditions, say below a pressure ratio of
about 1· 4. The shorter the ejector tested, the stronger were these notes, with increases of up to about
20 db recorded over the broad-band noise. They were independent of the material of the ejector,
and had the characteristics of a non-linear oscillation within the shroud. At a given condition, several
frequencies were usually present, related by 'sum' and 'difference' expressions. Not all these peaks
in the narrow-band analyses were found to represent truly discrete frequencies, but had more the
characteristic of random noise passed through narrow filters. The frequencies changed with pressure
ratio and the acoustic efficiency of the system depended on the particular dominant frequencies.
On one occasion the periodic transfer of energy between modes was observed, but usually the
emission was quite stable at a given condition.
This phenomenon of discrete-frequency noise from an ejector system operating subsonically has
been observed previously" on full-scale turbo-jet engines and it may therefore have been present,
though undetected, in other tests. It may be the relative contributions of this factor which accounts
for some of the different conclusions reached by different workers.
(6) The walls of an ejector were excited by the passage of the internal flow, but such vibrations
did not contribute to the radiated noise. No noise was found to transmit from the ejector walls.
(7) Attempts were made to remove both types of discrete frequency by roughening the flow in
various ways. Although in some cases reductions of up to 7 db were achieved no method produced
complete elimination. An absorptive lining inside the ejector also reduced the strengths of the
discrete notes.
(8) Although in many cases the strengths of these discrete notes were sufficient to more than
off-set any reduction obtained in the broad-band emission, it was sometimes possible to achieve an
estimate of the broad-band spectrum. When this was done, it was found that within the limits of the
experiment, the broad-band noise field was independent of the ejector diameter and it did not depend
crucially on the spacing distance.
(9) The broad-band noise attenuation increased as the length of the ejector increased. The
difference between the peak noise level of the unshrouded jet and those of the longest ejectors
tested, measured along a line parallel to the jet axis, was about 7 db. Extrapolation of the results
suggested that only marginal increases would result from even longer ejectors.
(10) Conclusions (8) and (9) together show that the initial mixing conditions and length of ejector
playa more important role than the final efflux velocity. The radiated noise was greater than that
expected from a simple jet with the same mean velocity as that of the augmented flow.
24
(11) In contrast to most suppressor nozzles, (e.g. Greatrex and Browns") and other work onejectors", the attenuation appeared constant rather than increasing with operating condition.
(12) Supporting the conclusions of other workers on ejector noise, this report shows that anappreciable lowering of noise output, say to 10 db or more below that of an unmodified nozzle, mayonly be achieved with ejectors of moderate length if they are used with primary nozzles which themselves have noise-reducing properties. Even this presupposes that the roughness and other factorsin a full-scale hot turbo-jet are sufficient to inhibit the occurence of strong discrete frequencies andthis has not always been the case.
7. Acknowledgements.
Professor E. J. Richards was the general supervisor of this programme of noise work. Mr. R. J.Hale assisted in the design of the rig and his experimental work provided the data for Fig. 13.Thanks are also due to the staff of the departmental workshop, the staff of the Aero-Electronicssection, and to those who loaned equipment. The co-operation of Mr. C. H. E. Warren and Mr. J.Reid of the Royal Aircraft Establishment, Farnborough, is also acknowledged.
25

No. Author(s)
M. J. Lighthill
REFERENCESTitle, etc.
On sound generated aerodynamically. I. General theory.Proc. Roy. Soc. (A), Vol. 211, p. 564. 1952.
2 M. J. Lighthill
3 C. M. Harris (Editor)
4- J. Reid
5 W. J. North and W. D. Coles
6 C. C. Ciepluch, W. J. North,W. D. Coles and R. J. Anti
7 W. D. Coles, J. A. Mihaloew andE. E. Callaghan
8 W. D. Coles, J. A. Mihaloew andW. H. Swann
9 G. M. Corcos
10 A. Powell ..
11 B. J. Gordon
12 W. S. Bertaux
13 F. B. Greatrex
14 J. Foxwell ..
On sound generated aerodynamically. II. Turbulence as a sourceof sound.
Proc. Roy. Soc. (A), Vol. 222, p. 1. 1954.
Handbook of noise control. (Chapter 33, by H. E. von Gierke)McGraw Hill Book Co. 1957.
The effect of a cylindrical shroud on the performance of astationary convergent nozzle.
A.R.C. R. & M. 3320. January, 1962.
Effect of exhaust-nozzle ejectors on turbojet noise generation.N.A.C.A. Tech. Note 3573. October, 1955.
Acoustic, thrust and drag characteristics of several full-scalenoise suppressors for turbojet engines.
N.A.C.A. Tech. Note 4261. April, 1958.
Turbojet engine noise reduction with mixing nozzle-ejectorcombinations.
N.A.C.A. Tech. Note 4317. August, 1958.
Ground and in-flight acoustic and performance characteristics ofjet-engine exhaust noise suppressors.
N.A.S.A. Tech. Note D-874. August, 1961.
Some measurements bearing on the principles of operation of jetsilencing devices.
A.R.C. 20213. March, 1958.
Considerations concerning an upper limit to jet noise reduction.]. Acoust. Soc. Amer., Vol. 31, p. 1138. 1959.
A review of work in jet engine noise control at the General ElectricCompany.
Noise Control, Vol. 7, No.3, p. 14. 1961.
The design and development of the General Electric CJ 805-3thrust reverser and noise suppressor.
Society of Automotive Engineers, Preprint 162B. 1960.
By-pass engine noise.Society of Automotive Engineers, Preprint 162C. 1960.
Unpublished data.Department of Aeronautics and Astronautics, University of
Southampton. 1958.
26

No.
15 A. Powell
Author(s)
REFERENCES-continued
Title, etc.
A 'schlieren' study of small-scale air jets and some noise measurements on two-inch diameter air jets.
A.R.C. 14726. December, 1951.
16 E. E. Callaghan
17 W. D. Coles and E. E. Callaghan
18 J. W. S. Rayleigh ..
19 D. Middleton
20 A. Powell ..
21 M. Merle ..
22 A. Powell ..
23 M. Merle ..
24 F. Canac and M. Merle ..
25 M. G. Davies and D. E. S. Oldfield
26 L. W. Lassiter and H. H. Hubbard
27 M. Merle ..
28 A. G. Hammitt
Noise suppressors for jet engines.Noise Control, Vol. 5, No.1, p. 18. 1959.
Full-scale investigation of several jet-engine noise-reductionnozzles.
N.A.C.A. Report 1387. 1958.
The theory of sound (2 Vols.). MacMillan. 1894.
The testing and development of a ground muffler for jet engineexhaust noise.
A.R.C. C.P. 610. December, 1962.
On the noise emanating from a two-dimensional jet above thecritical pressure.
A.R.C. 15472. June, 1952.
andes sonores emises par un jet d'air.Comptes Rendus, Vol. 240, p. 2055. 1955.
On the mechanism of choked jet noise.Proc. Phys. Soc., Vol. 66B, p. 1039. 1953. (also A.R.C. 15623.
December, 1952).
Sur la structure d'un jet d'air agrande vitesse.Comptes Rendus. Vol, 240, p. 1972. 1955.
Relation dans les jets d'air agrande vitesse, entre la forme, lesdimensions de la buse et la nature des emissions acoustiques.
Comptes Rendus, Vol. 248, p. 1953. 1959.
Tones from a choked axisymmetric jet. I. Cell structure, eddyvelocity and source locations. II. The self excited loop and modeof oscillation.
Acustica, Vol. 12, p. 257. 1962.
The near noise field of static jets and some model studies ofdevices for noise reduction.
N.A.C.A. Report 1261. 1956.
Sur la frequence des ondes sonores ernises par un jet d'air agrande vitesse.
Comptes Rendus, Vol. 243, p. 490. 1956.
The oscillation and noise of an overpressure sonic jet.]. Aero. Space Sci., Vol. 28, p. 673. 1961.
27

No. Author(s)
29 M. Merle
30 D. Middleton and E. J. Richards
31 A. Powell ..
32 P. F. R. Weyers
33 J. H. Gerrard
34 A. C. Pietrasanta .,
35 M. J. Lighthill
36 M. J. Lighthill
REFERENCES-continued
Title, etc.
Role d'un baffle sur l'emission sonore d'un jet d'air sonique.Paper 048, Congress Report Vol. 1, Fourth International Congress
on Acoustics, Copenhagen. 1962.
Discrete frequency noise from ejector nozzles.Paper L21, Congress Report Vol. 1, Fourth International Congress
on Acoustics, Copenhagen. 1962.
The reduction of choked jet noise.Proc. Phys. Soc., Vol. 67B, p. 313.1954.
Vibration and near-field sound of thin-walled cylinders causedby internal turbulent flow.
NASA Tech. Note D--430. June, 1960.
An investigation of the noise produced by a subsonic air jet.
]. Ae. Sci., Vol. 23, p. 855. 1956.
Noise measurements around some jet aircraft.
J. Acoust. Soc. Amer., Vol. 28, p. 434. 1956.
Sound generated aerodynamically.The Bakerian Lecture, 1961. A.R.C. 23326. November, 1961.
Jet noise.Wright Brothers Memorial Lecture, Institute of Aerospace
Sciences. 1963.
37 F. B. Greatrex and D. M. Brown Progress in jet engine noise reduction.Advances in Aeronautical Sciences, (2 Vols.). (Proceedings of First
International Congress in the Aeronautical Sciences, Madrid.1958.) Pergamon Press. 1960.
28

APPENDIX
List of Equipment used in the Measurement and Analysis of Noise and Vibration
Company
Bruel and KjaerLaboratories Ltd.
Cawkell Research &Electronics Ltd.
Dawe Instruments Ltd.
Electrical and MusicalInstruments Ltd.
Equipment Title
Half-inch Condenser Microphone CartridgeCathode FollowerCathode Follower (goose-neck style)Microphone Extension Cables (2 x 10 metres)Audio-frequency SpectrometerFrequency Analyser*Level RecorderLevel Recorder*Recording PaperRecording Paper*Automatic Frequency Scanner DriveMicrophone Calibration EquipmentPistonphoneNoise SourceBeat Frequency OscillatorElectrostatic ActuatorProbe Microphone KitNose Cone
Band Pass Filter
White Noise Generator
Panoramic Waveform AnalyserEmitape Recording Tape
Designation
Type 4133Type 2615Type 2614Type 4142Type 2111Type 2107Type 2304Type 2305Type QP 2351Type QP 1130Type AQ 0002Type 4142Type 4220Type 4240Type 1014Type VA 0033Type VA 0040Type VA 0052
Type FV4
Type 419B
Type 1950/2
Elliot Bros. (Electrical Portable Reflecting WattmeterMeasurement Division)
Model 5999
General ElectricCompany Ltd.
Goodmans IndustriesLtd.
Hewlett Packard Co.
Vibration Crystal StraingaugeAccelerometer, screened
Vibration Generator
Oscilloscope CameraWave AnalyserSweep Drive
Cat. No. SP 1100Cat. No. SP 1000
Model VA7
Model 196AModel302AModel 297A
(spec. H03-297A)
* Signifies equipment on loan.
29

Company
Kay Electric Co.
Massa Laboratories Inc.
F. L. Moseley Co.
Muirhead & Co. Ltd.
Polaroid Corporation
Solatron LaboratoryInstruments Ltd.
Tektronix Inc.
Vortexion Ltd.
University ofSouthampton
Ferranti Ltd.
Equipment Title
Sona-Graph Sound Spectrograph ModelRecorder* (Recorder, Amplifier Analyser,Power Supply)
Crystal Microphone*
Autograf Recorder
Muirhead-Pametrada Wave AnalyserMuirhead-Pametrada Supply UnitMuirhead-Wigan Decade Oscillator
Picture Roll (3000 speed)
Resolved Component Indicator
Dual-Beam Oscilloscope
Tape Recorder
Corre1atorLoudspeaker unit
Pegasus Digital Computer
Designation
Cat. No. 662A
Model M-211
Model2D2
D-489-EMD-489-05D-890-A
Type 47
Model VP 250
Type 502
Type W.V.A./4
* Signifies equipment on loan.
30

TABLE 1
Primary Nozzle and Ejector Nomenclature
L
p"'----------,rP d D
0===-=======...!::..=========::!61. Physical Dimensions.
d Internal diameter of primary nozzle, 1·928 in.
I , Approach length of an ejector, 0·964 in.
(Except for the specific cases mentioned in this report, the value of I jd = 0·5 was maintained throughout.)
L Length of cylindrical part of an ejector minus the approach length
-1 ejectors are defined as those with L = 5·78 in.
-2 ejectors are defined as those with L = 11· 56 in.
-3 ejectors are defined as those with L = 23·11 in.
-4 ejectors are defined as those with L = 38·52 in.
--5 ejectors are defined as those with L = 61·63 in.
D Internal diameter of cylindrical part of an ejector
A ejectors are defined as those with D = 2· 840 in.
B ejectors are defined as those with D = 3· 340 in.
C ejectors are defined as those with D = 3· 840 in.
The full table is therefore:
Area Ratio Length ratio Ljd
(~r 3·0 6·0 12·0 20·0 32·0
2·17 Al A2 A3 A4 AS3·01 Bl B2 B3 B4 B53·98 Cl C2 C3 C4 C5
II. Aerodynamic Parameters.
P Stagnation pressure in jet
P Static pressure at primary-nozzle exit plane
Po Atmospheric pressure
y Ratio of specific heats of air
31

TABLE 2
List of Corrections for Noise Results
All noise results in this report have been corrected by the amounts indicated below.
Absolute noise levels are all quoted in db relative to 0·0002 dyne/sq. em.
Levels from the spectrometer dial are quoted to 0·1 db, and from the level recorder to l db.
(1) Microphone cartridge frequency response:-taken as linear in view of the calibration curve.
(2) Correction to tape recorder record-replay signal to obtain linear response:-taken from calibration curve obtained as described in the text.
(3) Corrections from level-recorder spectrum to true spectrometer levels when employing manual selectionof octaves:
Octave mid-frequency cis 50 100 200 400 800 1600 3150 6300 12500 25000 O.A.
db correction +5 +3 +2 +1 +t o o o o o Datum
(4) Corrections from level-recorder spectrum to true spectrometer levels when employing automatic switching
through the octaves.
Octave mid-frequency cis 50 100 200 400 800 1600 3150 6300 12500 25000 O.A.
db correction +3l +3 +2 +1 +l o o o o o Datum
(5) Correction of microphone-spectrometer dial readings to obtain absolute noise level:-obtained from reciprocity technique and also checks with pistonphone. Overall levels on the recorder
were always adjusted to the corrected overall level shown by the spectrometer dial and the octave levelsshifted by this amount together with correction (3) or (4) as appropriate.
Note. The corrections from level-recorder spectrum to true spectrometer levels for one-third octave bandswere not obtained. The only results to quote third-octave levels, (Figs. 7 and 8) were merely for comparingrelative levels.
32

TABLE 3
The Reliability of Noise Results
(a) The Repeatability of Noise Levels and the Symmetry of the Noise Field
Results of traverses along line b, line b repeated, and line b' on the other side of the rig
(Ejector A3, P/Po = 1·35)
Position I 2* I 1* I 0 1 I 2 I 3 4 5 6 7 _~__I__~-:I. Comparison of Overall Noise Levels; db re 0·0002 dyne/sq. em.
Line b 89·0 91·0 93·5 95·9 96·9 95·8 94·8 93·2 92·0 90·4 89·3b repeat 88·7 90·8 93·6 95·5 96·4 95·4 94·4 92·9 91·4 89·9 88·4Line b' 88·5 90·8 93·6 95·7 96·4 95·3 94·4 93·2 91·9 89·9 89·0
II. The Scatter of the Octave Levels; db.
50 4 1 3 2 1 2 1 5t 4t 4 4t17 100 2 .1 2.1 t t 1 t 1 1 t td"d 2 2<l) d 200 1 2t 1 0 1 1 2 2 It 1 .1;j 0 20" u 400 .1 0 It 1 .1 It 1.l 1 It 1 0<l) <l) 2 2 2<l:: rJl 800 It 1 1 1 t It 1 t t 1 1I ... -z"d <l)·s P.. 1600 t .1 .1 1 1 1 1 1 t 1 .1
2 2 2rJl 3150 2 0 0 1 1 It 1 1 1 1 0<l) <l)
~ c:l 6300 3 1.l 2.1 2t 3 2t 2t It 1 1 2t 17 2 2
0 12500 4 2t 2.1 3 2.1 3 3 3 It It 22 2
25000 3t 2 2.1 2 2t 2 It 2t 1 It 2.12 2
(b) The Effect of Mis-positioning the Ejector.
Ejector A3 placed in 8 non-standard locations, (P/Po = 1,65) (described in Section 3.2)
Position: b 5 6 7 8
I. Scatter in the Overall Levels, relative to the 'Standard Position' Noise Results; db.
Fromto
-0·4+0·2
-0,4+0·6
-0,1+0·9
0·0+1·0
(91137)
II. The Scatter of the Octave Levels; db.
50 5t 4t 2 It17 100 3.1 4 1 2.1d"d 2 2<l) l:: 200 2 2 3 2;j 00" u 400 2t 2 It 3<l) <l)
<l:: rJl 800 3 1.1 2 3I ... 2'"0 <l)
1600 2t 2 1 2·s P..rJl 3150 It It .1 2.1
<l) ~ 2 2
~o 6300 2 2 It 3t>..... ou 12500 1 It 1 3t0
25000 1 2 1.l 3t2
33c
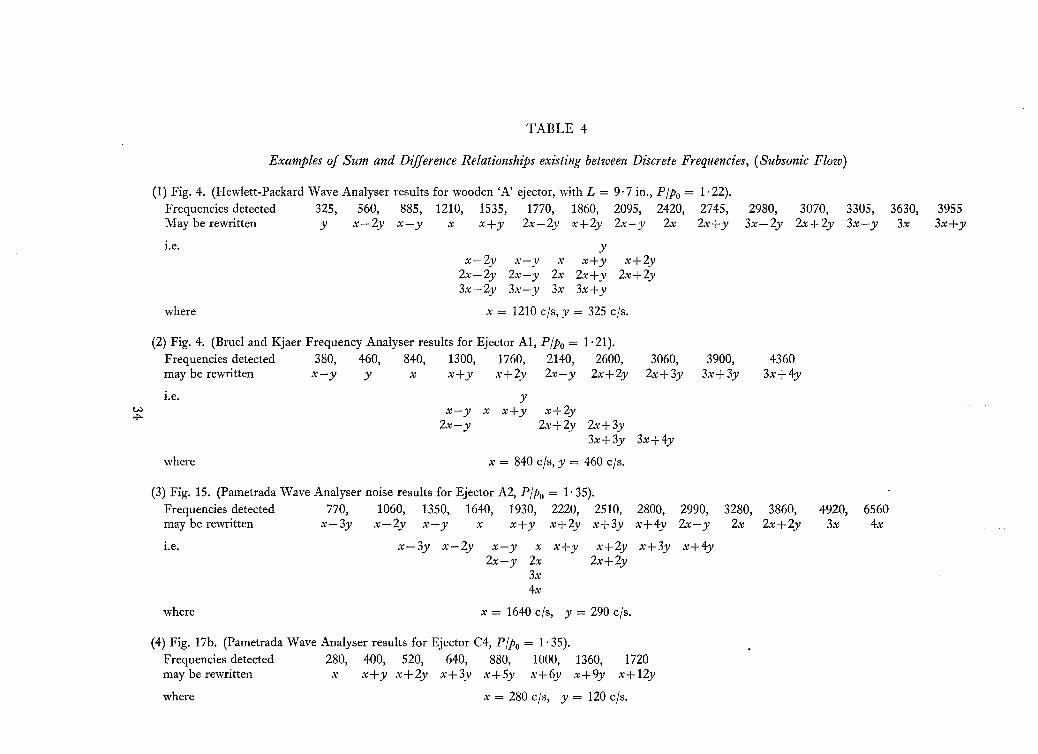
TABLE 4
Examples of Sum and Difference Relationships existing between Discrete Frequencies, (Subsonic Flow)
(1) Fig. 4. (Hewlett-Packard Wave Analyser results for wooden 'A' ejector, with L = 9·7 in., Flpo = 1·22).Frequencies detected 325, 560, 885, 1210, 1535, 1770, 1860, 2095, 2420, 2745,May be rewritten y x-2y x-y x x+y 2x-2y x+2y 2x-y 2x 2x+y
2980, 3070, 3305, 3630,3x-2y 2x+2y 3x-y 3x
39553x+y
I.e,
where
Yx-2y x-y x x+y x+2y
2x-2y 2x-y 2x 2x+y 2x+2y3x-2y 3x-y 3x 3x+y
x = 1210 cis, y = 325 cis.
(2) Fig. 4. (Bruel and Kjaer Frequency Analyser results for Ejector AI, Flpo = 1· 21).Frequencies detected 380, 460, 840, 1300, 1760, 2140, 2600,may be rewritten x-y y x x+y x+2y 2x-y 2x+2y
3060,2x+3y
3900,3x+3y
43603x+4y
i.e. yw x-y x x+y x+2y"""' 2x-y 2x+2y 2x+3y
3x+3y 3x+4y
where x = 840 cis, y = 460 cis.
(3) Fig. 15. (Pametrada Wave Analyser noise results for Ejector A2, Flpo = 1· 35).Frequencies detected 770, 1060, 1350, 1640, 1930, 2220, 2510, 2800,may be rewritten x-3y x-2y x-y x x+y x+2y x+3y x+4y
I.e. x-3y x-2y x-y x x+y x+2y x+3y2x-y 2x 2x+2y
3x4x
2990,2x-y
x+4y
3280,2x
3860,2x+2y
4920,3x
65604x
where x = 1640 cis, y = 290 cis.
(4) Fig. 17b. (Pametrada Wave Analyser results for Ejector C4, Flpo = 1'35).Frequencies detected 280, 400, 520, 640, 880, 1000, 1360, 1720may be rewritten x x+y x+2y x+3y x+5y x+6y x+9y x+12y
where x = 280 cis, y = 120 cis.

TABLE 5
Primary-Nozzle Noise Results
Noise levels along line b expressed in db re 0·0002 dyne/sq. em.
Position 2* 0 1 2 4 5 6 7 8Pressure
1* 3 ratio--------------------
50 sot 57t 57t 59t 61t 61 58t 56t 57t 59>-. 100 56 58t 61 65t 63 62t 61 61 60t 59U"Ol::i l::i 200 62 65 67 69 68t 68 70 68 67t 66tv 0::l U 400 68 70 73t 74t 74i 74t 76 74 74t 74C"'vv UJ 800 70 74t 78t 79t 80 80 80 79 78 78~ ~
"0 v 1600 74 78 80t 82t 83 82 82 79t 78 77 1·2·s ~v 3150 75 78t 81 83 82t 81 79 77 75t 74tv-I> U 6300 74t 78 81 82t 82 78t 75t 73 73t 72t'" >-...... U 12500 72t 76 79t 80t 79 74 71 69 69t 68U0
25000 70 75 79 80 78t 72 68 65 64t 63--------------------
Overall S.P.L. 81t 85 88 89t 89t 88 86t 85 84 82tI
50 63 64t 67 67 69t 68t 65t 62 63 58t.~
>-. 100 68t 66t 67t 69t 70 69t 67t 67t 66 66tU'"t:ll::i ~ 200 70t 70 73t 75t 75t 76t 76 77 75 75<1) 0::l U 400 74t 75 79t 81 82 84 84 84t 83 82tC"'<1)<1) rn
800 78 81 85 86t 88t 90 89t 89 87t 86t~.0 i:l 1600 82t 85 88t 90t 92t 93 91 90 87 85 1·35.... 0-S rn 3150 84 86 89 91 92t 92t 88t 87 85 83t<1)<1) .....I> U 6300 84 86 89t 91 92 89t 85t 85 82t 82~ ~U 12500 82t 86 89 91 91 86 81 80 78 760
25000 80t 84t 87t 89t 88 82t 78 75t 74 71------------------
Overall S.P.L. 89t 92t 96 98 98t 98 96 95 93t 92
50 64 65t 70 73 77t 78 73t 71 71 67t.~
>-. 100 67t 70t 72t 77 78 76t 77t 75t 76 79u'"t:l~ ~ 200 75 76t 78t 81t 82 83 85 85 83t 83v 0::l U 400 80t 82 86 88 89 91t 93 93 92 91C"'vv UJ 800 85t 88 92 94 95t 99 lOOt 100 98 96t 1·65~.0 i:l 1600 90 92 96 98 lOOt 101t 102t 100 98 97.... 0-S UJ 3150 91t 93t 97 99t 101t 101 99 95t 93 93vv-~ ~ 6300 92 94 98 100 101t 99t 95 93 91 90t
..... U 12500 92t 94t 98 100 99t 94t 91t 89t 86t 87U0
25000 90 94 96t 98 98 91t 87 85 82 80t--------------------
Overall S.P.L. 98t 101 104 106 107t 107t 106t 105 103t 102
35
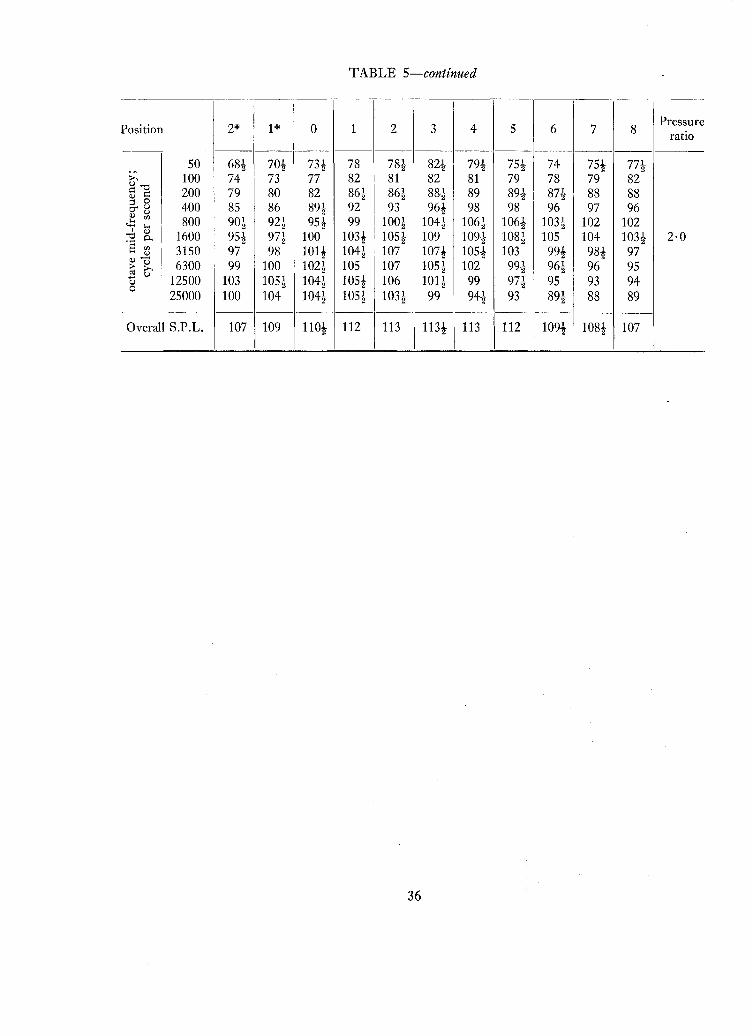
TABLE 5-continued
~-~~_. ".- -- ----
Position 2* 1* 0 1 2 3 4 5 6 7 8Pressure
ratio------------------------------------------
50 68t 70t 73t 78 78t 82t 79i 7St 74 7St 77t>. 100 74 73 77 82 81 82 81 79 78 79 82U-o~ ~ 200 79 80 82 86t 86t 88t 89 89t 87t 88 88<l) 0;:l U 400 8S 86 89t 92 93 96t 98 98 96 97 96O"'<l)
~ (f) 800 90t 92t 9St 99 lOOt 104t 106t 106t 103t 102 102..........I <l)
1600 9St 97t 100 l03t lOSt 109 109t 108t 105 104 103t 2·0:'20..S (f) 3lS0 97 98 101t 104t 107 107t lOSt 103 99t 98t 97v<l)-:> U 6300 99 100 102t 105 107 lOSt 102 99t 96t 96 95ro >.+-' U 12500 103 lOSt 104t lOSt 106 101t 99 97t 95 93 94U0
25000 100 104 104t lOSt 103t 99 94t 93 89t 88 890 ______-- __...._~_----------------------Overall S.P.L. 107 109 uo; 112 113 113t 113 112 109! 108t 107
36
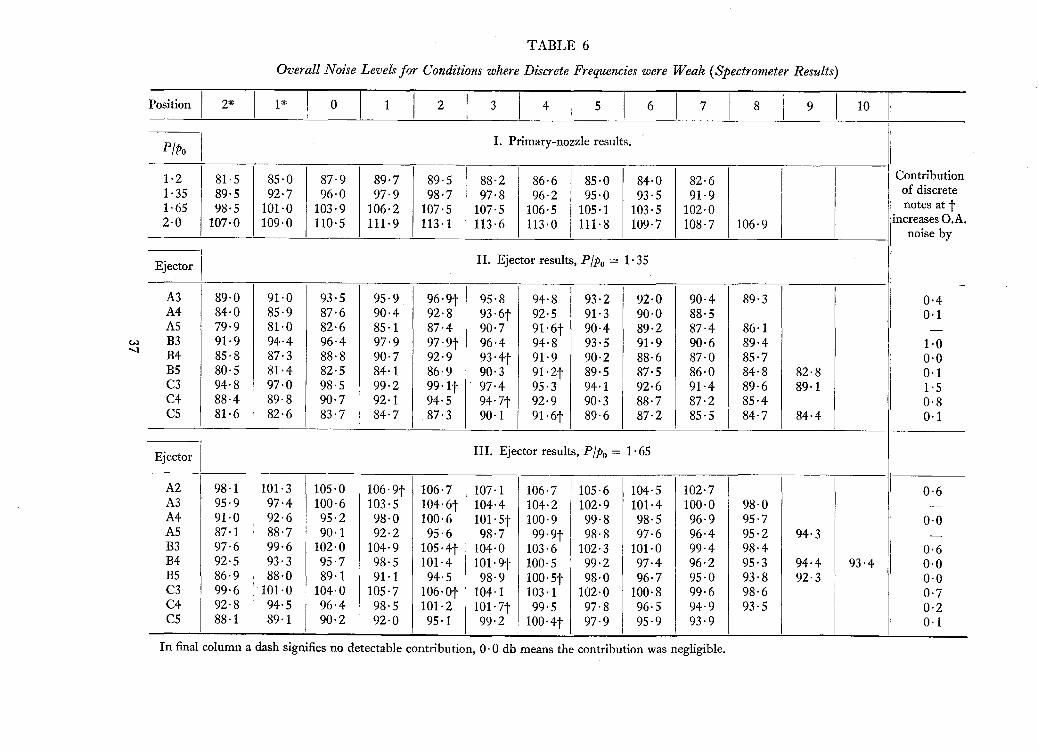
TABLE 6
Overall Noise Levels for Conditions where Discrete Frequencies were Weak (Spectrometer Results)
10 II987654321o1*I
P/Po II. Primary-nozzle results.
1·2 81·5 85·0 87·9 89·7 89·5 88·2 86·6 85·0 84·0 82·6 I I Contribution1·35 89·5 92·7 96·0 97·9 98·7 97·8 96·2 95·0 93·5 91·9 I
of discrete1·65 98·5 101·0 103·9 106·2 107·5 107·5 106·5 105·1 103·5 102·0
I
notes at t2·0 107·0 109·0 110·5 111·9 113·1 113·6 113·0 111·8 109·7 108·7 106·9 increases a.A.
noisebyI
Ejector I II. Ejector results, P/Po = 1·35
A3 89·0 91·0 93·5 I 95·9 96'9t 95·8 94·8I
93·2 92·0 90·4 89·3 0·4A4 84·0 85·9 87·6 I 90·4 92·8 93·6t 92·5 91·3 90·0 88·5 0·1AS 79·9 81·0 82·6 85·1 87·4 90·7 91'6t 90·4 89·2 87·4 86·1 -B3 91·9 94·4 96·4 97·9 97·9t 96·4 94·8 93·5 91·9 90·6 89·4 1·0B4 85·8 87·3 88·8 90·7 92·9 93'4t 91·9 90·2 88·6 87·0 85·7 0·0B5 80·5 81·4 82·5 84·1 86·9 90·3 91·2t 89·5 87·5 86·0 84·8 82·8 0·1C3 94·8 97·0 98·5 99·2 99·1t 97·4 95·3 94·1 92·6 91·4 89·6 89·1 1·5C4 88·4 89·8 90·7 92·1 94·5 94·7t 92·9 90·3 88·7 87·2 85·4 0·8C5 81·6 82·6 83·7 84·7 87·3 90·1 91·6t 89·6 87·2 85·5 84·7
I 84·4 0·1
Ejector I III. Ejector results, P/Po = 1·65
A2 98·1 101·3 105·0 106·9t 106·7 107·11
106'7 105·6 104·5 102·7 0·6A3 95·9 97·4 100·6 103·5 104'6t 104·4 104·2 102·9 101·4 100·0 98·0 -A4 91·0 92·6 95·2 98·0 100·6 101·5t 100·9 99·8 98·5 96·9 95·7 0·0AS 87·1 88·7 90·1 92·2 95·6 98·7 99·9t 98·8 97·6 96·4 95·2 94·3 -B3 97·6 99·6 102·0 104·9 105·4t 104·0 103·6 102·3 101·0 99·4 98·4 0·6B4 92·5 93·3 95·7 98·5 101·4 101·9t 100·5 99·2 97·4 96·2 95·3 94·4 93·4 0·0B5 86·9 88·0 89·1 91·1 94·5 98·9 100'5t 98·0 96·7 95·0 93·8 92·3 0·0C3 99·6 ·101·0 104·0 105·7 106'0t 104·1 103·1 102·0 100·8 99·6 98·6 0·7C4 92·8 94·5 96·4 98·5 101·2 101·7t 99·5 97·8 96·5 94·9 93·5 0·2
IC5 88·1 89·1 90·2 92·0 95·1 99·2 100·4t 97·9 95·9 93·9I
0·1
Position I 2*
In final columna dash signifies no detectablecontribution, 0·0 db means the contributionwas negligible.

TABLE 7
Effect of Ejector Length
(B Ejectors, P/Po = 1· 35)
Noise levels along line b, expressed in db re 0·0002 dyne/sq. em,
2
t
3 4 5 6 7 8 9
Over
671. II
---
50 57l 61 63 2 71t 73l 70 68t 65 64 69t100 67l 69 71 72 74 74 72t 72 71 71l 70l200 81t 85 82l 80 80 79l 81 80l 80 78t 77 78400 82l 85 87 85l 87 86t 86 86 85 83t 82 83l800 85l 89t 91 93 92 89t 90 89l 87l 86 84t 91
1600 87 90 92 93 94l 92t 91 90 87 85t 84 93t3150 84t 86 871 891 901 87t 86 84 83 801 80 906300 79 81 821 85 86t 84 801 78 76t 75 74
12500 73 75 78t 81l 82t 80 75 72t 70l 681 6725000 69 71 751 791 821 771 72 68 66 631 62-------------------------------
allS.P.L. 92 94t 961 98 98 961 95 931 92 901 891 97
Ejector B4 t50 541 59 65 691 67 701 69t 691 691 64 70..
>-. 100 67 681 69t 69l 71 71 70t 69t 70 681 67U"d~ ~ 200 76l 77 76 751 771 77t 77 76 77t 75 74t 76t(1) 0::l U 400 78 78t 791 78t 81 82 81l 80 80t 781 77t 810'(1)~ Cfl 800 78t 81l 83t 84l 86 86 84l 83t 83t 82 80 85l...... ....I (1)
1600 79 82 831 84! 871 87t 86l 841 83t 81t 791::2 Poa Cfl 3150 77 79l 81t 83 86t 86t 85 81l 79t 77 76(1)(1)-;.. U 6300 74 77 79t 81l 85t 86 83 78t 77 731 72tn GU 12500 71 73t 76 78t 83l 84 79l 74t 721 691 680
25000 66l 70 73 76 82t 83t 76t 71t 69t 66t 63t---------------------------
OverallS.P.L. 86 87t 89 90t 93 93t 92 90 88t 87 85t 93t
Ejector B5
50 53 57..>-. 100 61t 65tg ~ 200 72 721~ 0 2~ ~ 400 73l 74t<l::: 800 73 73t~ ~ 1600 73 74a ~ 3150 72t 73~ -g, 6300 71t 72tt) U 12500 69l 70o 25000 68 66t
58t 5765 65t71t 7173t 7374t 75t74t 7774t 76t73t 7669t 71t64 67
6065727679t8180t8076t74
t
63t 6668 69t73 74t78 78t81t 8283t 83t84 84t84 84t82 8281 81
66 68t 66t67t 69 67t74 74 7478 78t 7881t 80t 79t83t 81 79t82t 79 75t82 77t 73t77t 72t 6975t 69t 65
62 621681 67731 7377 75t79 7778 7676 74751 7269t 6763t 61
74t7882
ov~-.- ~--::-~-=----:-1~-9-1---;-;--=---:--:----:-Absence of a figure in the final column indicates that no discrete frequency was located in that octave.
38

TABLE 8
Effect of Ejector Diameter
(-3 Ejectors, P/Po = 1·65)
Noise levels along line b, expressed in db re 0·0002 dyne/sq. em.
Position 2* I 1* 0 1 I 2 3 I 4I
5I
6 7 8 I 9 Broadband
Ejector A3 tnoiseatt
50 59t 67 65t 69t 74 77t 75t 73 72t 69 68t.~>. 100 70 70 71t 75 78t 79 78t 77t 75 75t 75t(,)"0I:: I:: 200 77t 78 79t 83 83t 85 85 85t 86 85 83o 0::l u 400 81 82t 85t 87 88t 90t 92 91t 91t 92 90c:r oo (/J
800 85t 88 91 93t 94t 96 98t 97t 96t 96 93to.l::~ li:l 1600 90 91t 94i 97t 99 100 lOOt 98t 96 95t 92t.~ 0..
S ~ 3150 91 92 95 98 99 99t 99 95 92 91t 88o(J 6300 88t 90 93 96t 97 97 94 90 86 86 82t;j ~..... 12500 85 87t 91t 95 95 93t 89 84 81 80t 78o0
25000 82 85 90 94t 92t 90 85 80 77 76t 74-------------------------
OverallS.P.L. 96 97t lOOt 103t 104t 104t 104 103 101t 100 98
Ejector B3 t
50 63t 67 70 72t 75t 80 78 77 73t 70t 74.~
>. 100 72t 73t 76 78 81 79t 79t 79 78 77 78t(,)"0I:: I:::: 200 85t 85t 84t 84t 86 86t 87t 88 87 85t 85t 85o 0::l (,) 400 86 88 90t 91 91t 91t 93t 94t 93 91t 91t 90c:r oo (/J 800 90 92 96 97 97t 96t 98 98 96t 94t 93t 97~ I-l
"0 0 1600 92t 95t 97 100 101 99t lOOt 99 96 94t 93 99t·s ~ 3150 91t 93t 96 99 99 97 96t 93t 91t 90 89t 990 ......:> u 6300 86t 88t 91t 94t 96 93t 90t 87t 85 84 82ts ~(,) 12500 82t 84t 89 92 93 89 84t 81t 79 77t 76t0
25000 80t 82 87 93 93 87 81t 78 75t 73t 72t-------------------------
OverallS.P.L. 97t 99t 102 105 105t 104 103t 102t 101 99t 98t 105
Ejector C3 t50 66t 67t 73t 74 79 80t 78 74t 80 71t 77
.~
>. 100 75t 76 78 82t 82 81 79t 79 79 78t 79(,)"0I:: I:: 200 88t 90 89 87 88 87 88 87t 87 86 86 86o 0::l (,) 400 90t 92 94 94t 95t 94t 94 93 93 92 91t 92tc:r oo (/J 800 94 96t 99t 100 100 97t 97t 97 96 95 94t 99o.l::~ li:l 1600 95 96 99t lOOt 102 100 99 97t 95t 94t 94t 101t·s ~ 3150 91t 91t 95 98 99 96t 94 91t 90t 90 89t 9800 ......:> u 6300 85t 87 90t 93t 95t 93t 88 85t 84t 84 82o:l >...... u 12500 81t 82t 87 91t 92 89 82 80t 79 77 77u0
25000 78t 79 84 90t 91 86t 79 76 75 73 71t------------------------
OverallS.P.L. 99t 101 104 105t 106 104 103 102 101 99t 98t 105t
Absence of a figure in the final column indicates that no discrete frequency was located in that octave.
39
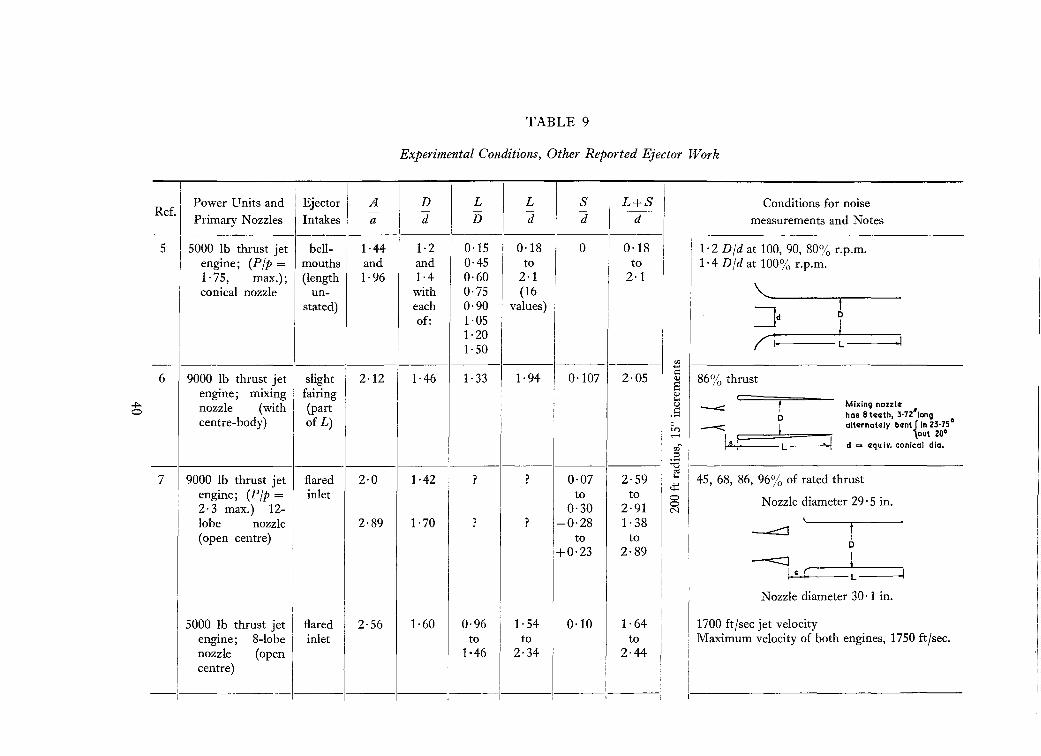
+o
TABLE 9
Experimental Conditions, Other Reported Ejector Work
I I Ejector II
IPower Units and A D L L I S L+S Conditions for noise
Ref. I - I
Primary Nozzles Intakes a d D d I d d measurements and Notes
I I5 I 5000 lb thrust jet bell- 1·44 1·2 0·15 0·18 0 0·18 I 1·2 Did at 100, 90, 80% r.p.m.
I i i
I engine; (Pip = I mouths and and 0·45 toI
to
I
1·4 Did at 100% r.p.m,
I
1,75, max.): I (length 1·96 1·4 0·60 2·1 2·1conical nozzle un- with 0·75 (16 I "-
stated) each 0·90 values) I
~df
I
of: 1·05 I D
II I
I1·20 I; I1·50
II L
I
-I rJl....9000 lb thrust jet slight 2·12 1·46 1·33 1·94 0·107 2·05
.:86% thrust6 I
<l)
Sengine; mixing fairing <l)t....
Inozzle (with (partI I
o <-:«: Mixing nozzl.. I
.S D has 8 t .... th, 3·72 longcentre-body) of L) 0 -< I olt..rnot..ly bcnt{ in 23·75"
U") out 20'
I
,....;
1·1 -IrJl~ L d = ..quiv. conical dio.;:l
:.ae<l I
7 9000 lb thrust jet flared 2·0 1·42 ? ?I
0·07 2·59 ....
I45, 68, 86, 96% of rated thrust
~engine; (Pip = inlet to to 0
2· 3 max.) 12- 0·30 2·91 0
\
Nozzle diameter 29· 5 in.I N
I lobe nozzle 2·89 1·70 ? ? -0·28 1·38 I.
I (open centre) to to ~ 1+0·23 2·89
D
--=::::::J II s ( L I
i Nozzle diameter 30·1 in.i
I 5000 lb thrust jet flared 2·56 1·60 0·96
I1·54 0·10 1·64 1700 ftlsec jet velocity
I
engine; 8-lobe inlet to to to
I
Maximum velocity of both engines, 1750 ft/sec.nozzle (open 1-46 I 2·34 2·44
I centre) II
I I
Ii
iI
II I

8 Static tests: Single radiussed ? I ? I 1·15 I ? ? ? 85, 90, 96% max. r.p.m.jet engine, ap- to (L = 39 in., D = 34 in.) (approx. 1100, 1300, 1600 ft/sec velocity)prox, 7000 lb 0·375 in.thrust, (Pip = at A=(dz/d,y wh2r~2'1), of twin- leading 000 dz = dia. of circumscribing e ircleengined aircraft edge
000dl = die. of equlv, ccnlcc! nozzle-
with 8-lobednozzles 0 7 tu be nozz le
,-
Flight tests: two Level fly-overs at 1000 ft altitude. Take-offs andengines in use or simulated take-offs. 300 ft and 635 ft altitude,1 engine at con- relative jet velocities 1000-1600 ft/sec approx.dition, the otherthrottled.
13 'Full-scale Avon not 'about 2' ? ? 3·8 ? ? 1600 ft/sec jet velocity with measurementsengine and small stated and to 'nearly parallel to jet axis'. Results for the 2scale jet engine, 'about 4' 13·0 engines are not separately indicated.5 in. nozzle dia- (9meter.' values)
c =-Tests also done Aerofoi I section
with '7-tube = =---nozzle' )[ = 3·0

(IV)
_(iil)_~
For a glv~n primary naz zte discharging into a cylindrical st..ve
t he g~ometrical factors influoncing tho flow devolopm~nt ere:
(i) Spacing distance(il) lntcke d~slgn
(iii) Ejector length
li'!J Ej~ctcr dlam~tllr
FIG. 1. Ejector mixing processes.
~,~("\' ,l;,,_~rl )\)~lntakCZ' box':.',.' ":,': wolls of liz In. ply.Sound - '..S,absorbent )'" Volagc'J Ej.ctor supported at positions
45' ,," Ind i cqtedI I(capabl~of.axlal j
_,~latlon=)==!::=!==;===.
Motol
------~L+ l ~Static tappings
~-.-1'=="7==="T~&[interncl and oxt.rnal)
-Retainingring
\app; ngs lorstagnationtempercturesand pressuresjust upstrecmof here
SI2ttI Ing__ ._chomber
6'Z5 In. dia
ZO gaug. brasstube
_ Prima.l"i' _n ozz le 2·0 in. old
~ll = 0·96 In.
FIG. 2. Rig design-primary nozzle with generic ejector.
42

Genlral area of otf'r2r noise r ICJ5, I2tC.
»"> ---- ----""'-- __ -----",
Ir regular walls with sound-absorptive lining >(ceiling similar) /
Floor covered with gratings \
--j----lc--+-_;--_1----T_-+-_-j-~'____+_-_+_-1__f=;;;J;:rl)r.__+>--Li~e ';
Ic f
b~
a )f
\ Settling~hambe~ , /\------~-~ ====~~ :~:(/: r3i~-"",,----;-\
(, l_: __:__ ~_: __:__:__:__:__:_~_J rr:')1) <
I \
(....... ------ --...... _---., --~"---- ------ ..... -...--- -..---
1ft
~o~~;~e}manometer
High-pressure -ll-4~-rf--"--"---:;"-iI;;L---
air supply
Controlroom
FIG. 3. Plan view, Acoustics Laboratory and Control Room.
43(91137) E
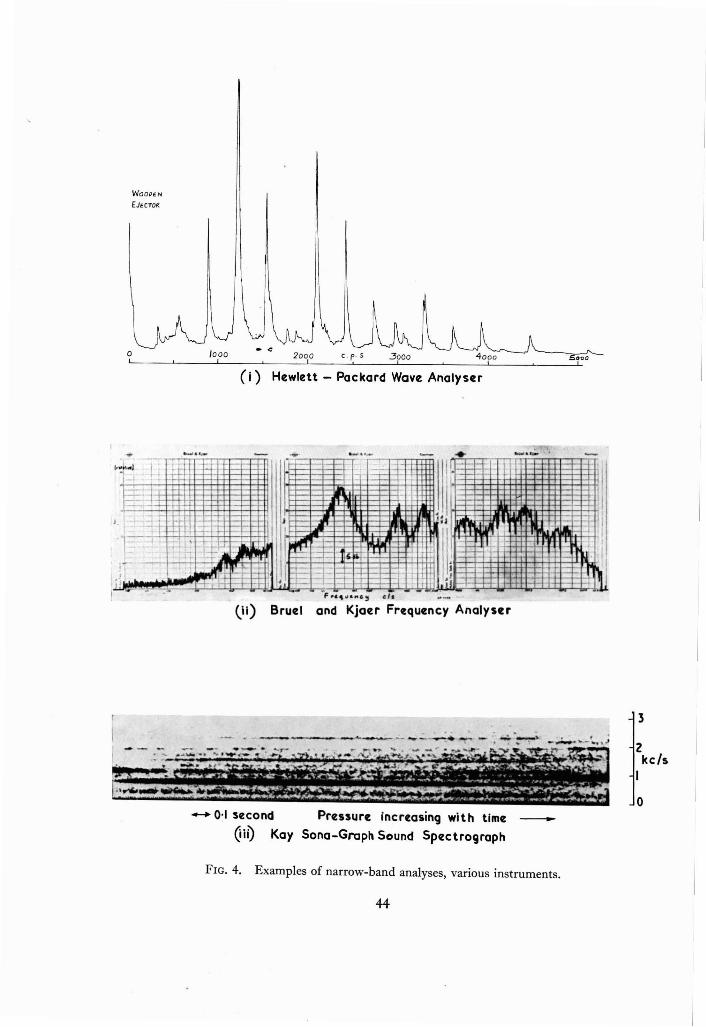
WO O()E.N
£JECTO~
oI 0 0 0
I
(i) Hewlett - Packard Wave AoalyslH
- -
F,.c, "'....c.~ ell
til) Bruel and Kjaer Frequency AnalyslEr
...... - ...... , ..- - • .- I I ·~ II' - ~.-(...~...J i' :, (! - I- -+ - .- ,-
. 11~ 1- --I .i:E . - - ~ "
I'~'J:E #ll -;1-
~- . 01
~l~ - r=
~,- ...1$ - - J:,
~~,Ij H ' , ~.
, -t II-r-r- - I rl J-r'1 -; ' r} 1±f-'~ . ' I "~ ~I
Iii.
1.1 .:j ~ 1, - 1+ I- II- ,- ,.l i l ~
; ~::-- =j -'*:t=E!= 1- -: ~ If 1- -~ -~ l]l-j . '-4 - ~: ~ j ' -I + - 1- r .ilI , ..- . .,
Plt'l .-....:...........~.
-- . - --- ..:.- .. - .. _ . _ '~. . - .
:5
2kc/s
I
o..... 0·1 second Pressure increasing with time
QiO Kay Sona-Graph Sound Spectrograph-
FIG. 4. Examples of narrow-band analyses, various instruments.
44
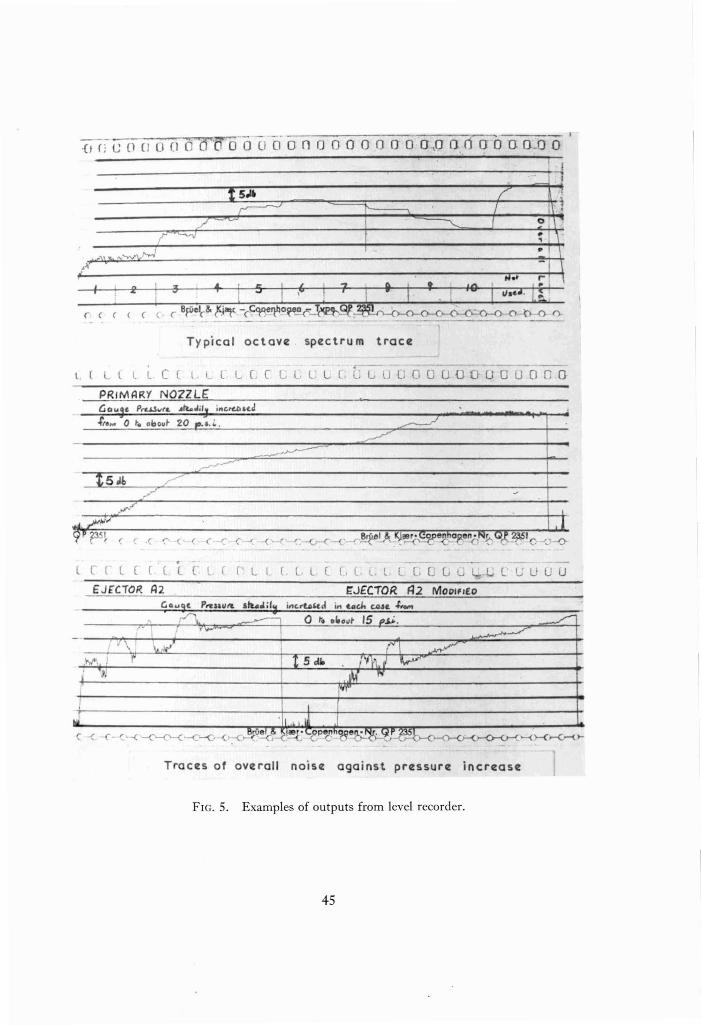
{If; c ( 1 (J (I (J (; 0" 0-0 l i ci 0 n 0 0 0 0 0 0 0 0 ,,0 OJ ) 0 0 GO-O 0, ,I: ;
....\
/. ~
I
II o \
• I \
I • .. • ,. I " " 0 _ , Hot ~ . \
I ... I \! I I I I II.·..· I :'('« «
Ty pical octav e spe ct r u m tra c e
o o u o n o- - -- -- - -l. [ L l I. L e l l r L ( r L. L L L. r. i.: L. LJ (J 0 0 U 0
PRI MARY NOZZ LE
.ft. ... 0 t• • ll ou ~ 20 •. i. .
tS "b .>
L4
9 p ps ~ t' ( .r ~ { r (' ~.. C _ f _ ( _ r . ~..
.c r t r r t t r !
EJ fCTOR A2
[ L I
I
L L ( C l l.l l. L L LLJ L.l I..J U UU
r:JECTOR ,q2 MOo'''EO.~ r '" .. ,...., ,..r-~ .............-- 0 t• • r..~t 15 Psi- . ~, .
I ' ....... I ..,r- ,I I , ~ ,... ' ( \ ..,../
'I\t' l I r 'I 5 dlo I ' 'fl.) V""i '» I .M ,.,.
I I"f! I
.J l~ Ic -c ,- - ( , -< -('-0-( --<:'- -(> (>-c_I!:u!'r~ I~ ' L.ope"h.~e~~0N~~h . --o-<.r-': -< '-<'...-e--<. c (,~~ ,-' :>--('1--(>-<
Tra c es of ove rall no ise aga inst pressure increase
FIG. 5. Examples of outputs from level recorder.
45
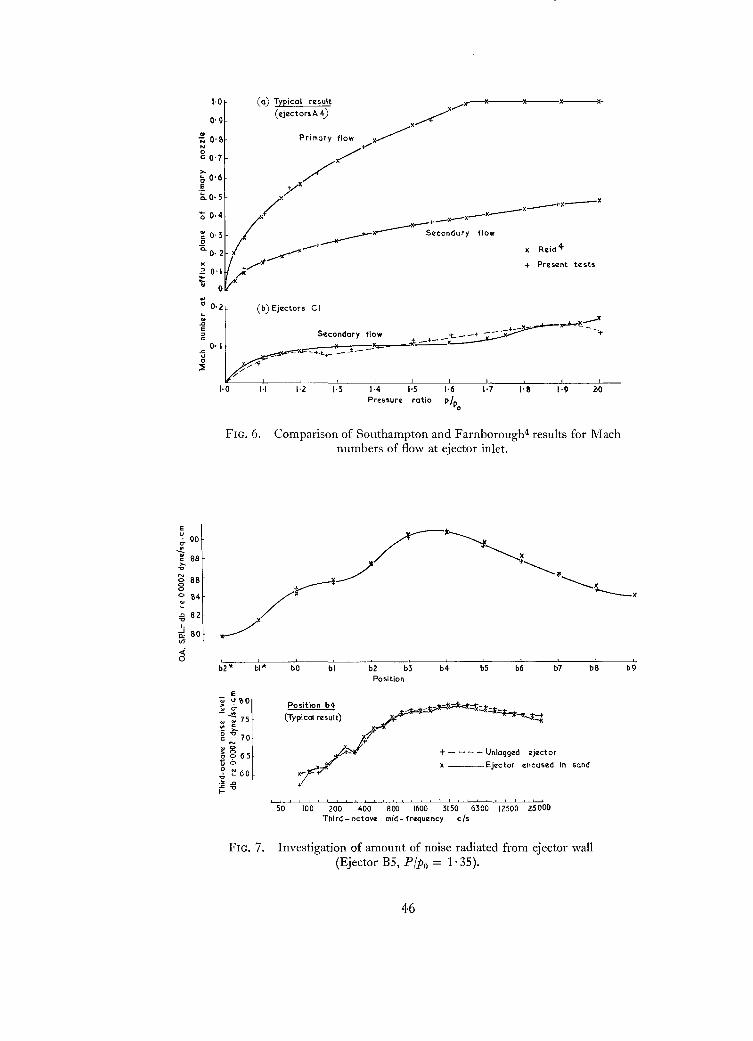
2'()1'9
+ Present tests
I·a\·71·4 I·SPressure ratio
1·2
(a) Typical result
(ejectors A4)
(b) Ejectors CI
,..----l'---x---X----1<-
~-xPrimory flow ~
/v'-:-:
/-,"x_x
,...---x
I_+_x_x-
~,...-----" Secondary flow
-+-j"~c-:
/'
~ 0·:5
"Ci. O. 2K:> 0'1
~0..
e 0'2~....,Ei'!.s:u
"::<
1·0
O· 9
>-l; 0'6E·~O· 5
..N o·aNoc 0'7
(; 0·4
FIG. 6. Comparison of Southampton and Farnboroughf results for Machnumbers of flow at ejector inlet.
Eu.;. 90~
~ 88>-o
g 88o
~ 84
:g 82
.J0: 80vt
<I.ob2" bl" bO bl b2 b3
Positionb4 b5 b6 b7 b8 b9
Position b4
(Typical result)
+ - - - - Unlagged ejector
x ---Ejector encased in sand
50 100 200 400 800 1600 3150 6300 12500 25000Third - octave mid- frequency cIs
FIG. 7. Investigation of amount of noise radiated from ejector wall(Ejector B5, P Ipo = 1· 35).
46

! I ! ! It! ! ! I I I 1 I I 1.11... L L~ L~L.L..L..L..J
SO 100 200 400 800 1600 3150 6300 12500 25000Third-octave mid- r reque ncy , cIs
1-8
Primary nozzle , microphone at pcsit loe beEjector AZJ mi crophone at position bO,prtlssurqt
Ejector Al, microphoncz at position bOt prc:zssurcrt
'!4 1.'5Pressure rctlo
!
1·3!
1·2
~
co
>-ee
~c"
T-t\I \
~ t \ +I I I x ""I {\: I
r1!r xl";:: \~ : ) \....-"'")tv~ ~ +,x' /I ~ I I II I I I / •
I:: \ L /I: I I I ,J<I 1't ~)(_)'.(
I :r ./-I x·II
i / (To 0-1 db) •
f / (To neor est Yz db) }:
.- y./ •
,,/ /C c:e.~0>
0>"_= L ...
C_!!! It:5e,0.=
'-0 JI'I
112
110
108
e 106u
i lO4
-: 102c~,oo
'"0980
0
696:::
.a 94-e
(;92
>!!. 90
.;880
c
~86
1: 640
82
80
b5b4b3b2I I
bO blPosit ion
bl*
y=="'---.----)C Without intake suppressor/~ <,--+ With intake suppr-essor /././.
/:
;// f__ ..-..c_-
/JI.---
.: ~T
-<-------+~+
'Ii--
E
~"t'";;65c
~60'" I0
-l'- ~55~" i':50 I
~J-ec0
.a 75~
t 700
~ 65s:~ 60.s~ 55~
_~ 50
~ 45
FIG. 8. Investigation of noise radiated from ejectorintake (Ejector B5, PIPa = 1· 35).
FIG. 9. Overall noise versus pressure ratio. Primary nozzle alone andwith an ejector.
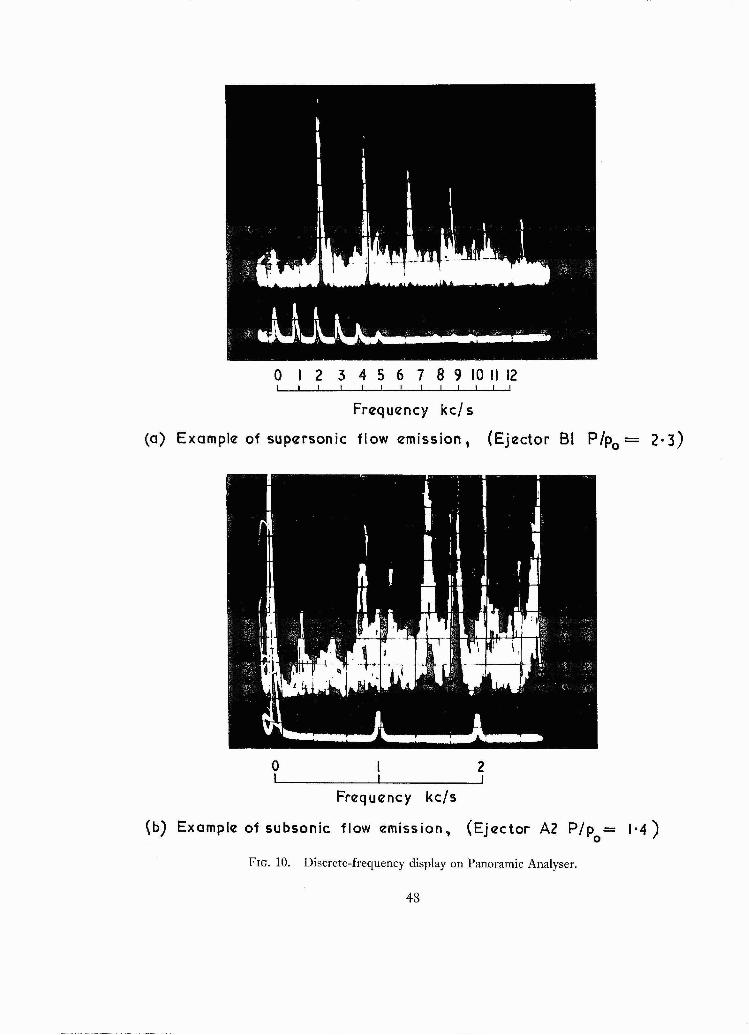
o 2 3 4 5 6 7 8 9 10 II 12! I I I I I I I
Frequency kef s
(a) Example of supersonic flow emission, (Ejector 81 P/po = 2· 3)
012I I I
Frequency kc/s
<b) Example of subsonic flow emission, (Ejector A2 Pip = 1'4)o
FIG. 10. Discrete-frequency display on Panoramic Analyser.
48

~u..0
IJl
II II II II I(a) Pipo Z'6 Unmodifi"d nczzle choked !
-(b) P/Po 2·6 Conv"rging approach sect icn rough"n"d
- (c) PlPo 1·8 Unmodifl"d nczzle b"low chokingII
V ~;--.. In
Ir ~~
rM lcrophone at bO I
!Sdb // --r---: <,
~ -/ -- ....... ....... r-.
~ r-,<,
100 1000Fr"qu"ncy > c/.
10000 20000
FIG. 11. Narrow-band analyses of primary-nozzle spectra.
10
,....,..;:; 9~co'Os.cuc
o- 7"0
~~ Kc/s
(; 6~
$oc
2c..e.g 4c~
\'. \; \.\ \\\ \
\
1,~ .
\.\ -.
\
'"'''',
Present nozz I" (1'92~ in.d ia)Day;". and Oldfi"ld25 (3.7mm)M"rlo 21 (4,6,8 mm)Powoll 22 (I inch)
-----....'0~3c1': Choking vctue
l:' ........It
1·0 2·0 3·0Pr"••ure ratio PI Po
4'0 5·0
(91137)
FIG. 12. Variation of frequency of shock noise with pressure ratioresults of various experimenters on circular nozzles.
49G

-4500
4000
3500
, \, ," ,,
-,
-- Primary nozz le clone--- Wilh ejector C5
""0c
~ 2500c:
"Eo~
.iO 2000a>vc:
""go 1500u: Choking pressure ratio
rnShrOUdQd nozz Ie
I !
..v 3000
2'0 2·5 3·0Pr essure rctlo P/po
FIG. 13. Variation of frequency of shock noise with pressureratio: primary nozzle alone and with a typical ejector.
50

e:>~
u
"e,Ul
III I I
III h I(a) Ellact of pressure ralia 1/ I
1'1 JI r-,I
Plpo 3·4 I.---'" -.1 I--~ r--1'-.. 1/ ~ I
---Plpo = 2·0 I I
)5 db i:-t-A-!.N Microphona at bO
I..-J/......~
Ejector A3PIp = 2·35
++++<++ I IIII II ,
-....~ I(b) Effactoftima Ll-~rf 1"--sl.. I
I I ---,- PIp = 1·9 ''5l..I<,. ! I1
I I I I III iI--- Saquanca: x + " 0 i
True p.R.: ~~ ~~ , ! "'-NN-
I I I I :50 100 1000
Fr equency , cIs10000 20000
.0-e
FIG. 14. Effect of pressure ratio and time on 'excess high-frequency noise'.
Usual mannar with 2 supports II III Only one support
'.1_111' I I IEjactor A2. PI p. = 1'35
'"11111 01
I II111 INoisa at bO position
n / n ~ tV nV hlU r--.. IV ru
V ~ ./ V,,--15 db n In
,f', I
, .n
~1/ U~Stroin-gauga response
IV 1\ 7in. from afflux and \I Ir1/\\
200 1000Fraquancy. cIs
10000 200 1000
Frequency • e] s
10000
(91137)
FIG. 15. Effect of mounting on the noise and vibration of an ejector.
51H
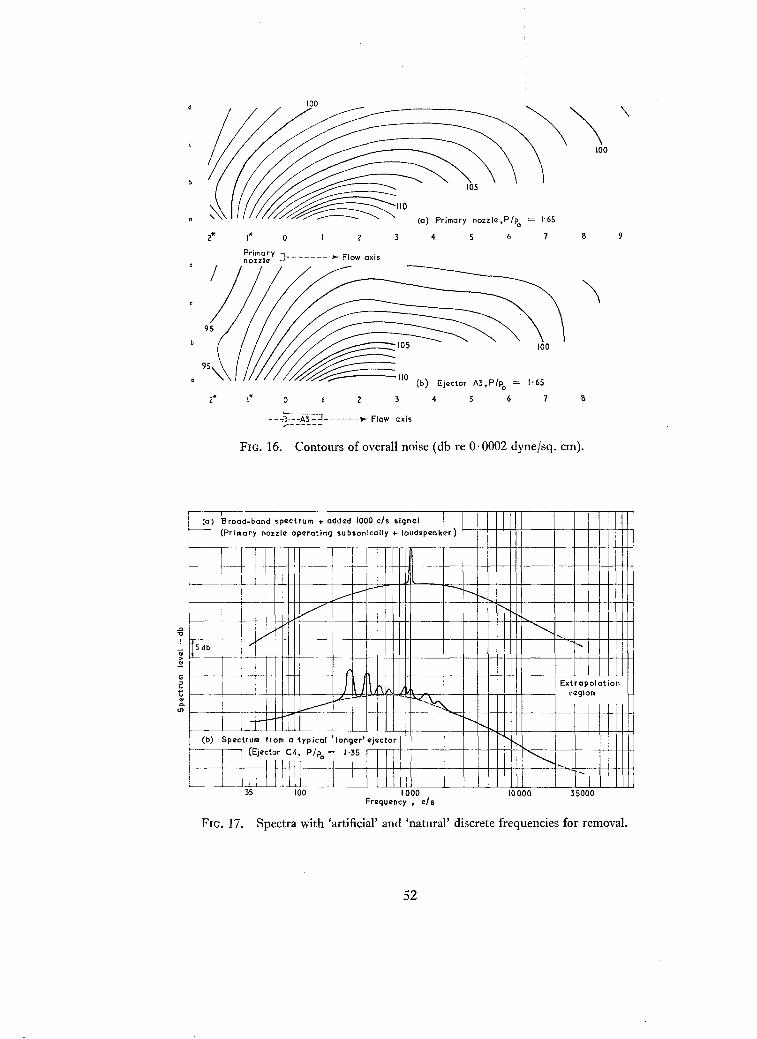
100
~~\
\
100
~IIO105
(a) Primary nozzl~.P{Po 1'65
2* 1* a 6 8
'\95
100
(b) Ejector A3, P {po = 1·65
2* 1* a 4 5 6
--~1-nA3 -=1- - __n.- Flow axis,-------'
FIG. 16. Contours of overall noise (db re 0·0002 dyne/sq. em),
i....
II "
:
L---- __L-
Vi~.--,-l.-.+1+H-F--+--+--+-:--:-+++I----I--+-+-+-++.j...H>....---I--I-1--l-1-+f..+-Ji • I . ~v
~-5db i-1-j1
A-+++-++-- --+-.-+--+- '-H+H- - ----+--If--+-H-++++-- --P--...d-+-+-++-++I
Ir
) 11\ h______ J,<!--
+-++kH=--· 1-.- I--
E U-.-t-I ++++-++----+-I-\----il\-+++I-++--+---+-++++I-++--+-.J.......L...L.LLJ...j...jeli I Extrapolationi f---;--r-':i'-i--
I, t+H----\-J~"'..f-l4.lH~~"""_+-+_+-H_fJr++-- r eqion
1-'-1J]L.t-tt-.-'-.L.I..LLL_...L.........L ....L-L.L..Lj-+-1----+--+-+--N+++-I---+-+-+-t-++-++I(b) Spectrum from a typical 'lon9~r' ejectorill (~j~~t~rl ~~'I Pip = 1·35 ~~-rl-I.J_I_--.J--+--I--+-I-l-!-+~-----"--I__-
~~ 0 I I! -_.-_L+-.----1.f--+-+-H\+++---+---+--!-+++++I-------f.':"c-.d--I-I--~
35 100 1000Frequency • cl s
10000 35000
FIG. 17. Spectra with 'artificial' and 'natural' discrete frequencies for removal.
52

106E~ 104<T..-102..cii"IOON<:>g 98
<:>~ 96
~ 94
92...J"-III 90
i3 88
Computed l~v¢1 of brood-band noise atposition b2 ln dlcct ed by .-Lx symbol
b2'" so blr !
b2 b3
Position
b4 b5 b6 b7 b8 b9
FIG. 18. Overall noise levels measured along line b, -3 length ejectors.
~ 95
~ 90
l85
1805
..j75 .;.
J70 -;c:>-
19 5 ~90 g
<:>
85 ~
80 ,g
75 I
I -g170 15
50 100! !
200 400Octave
800 1600 }150mid-frequency) cIs
! I
6300 12500 25000
FIG. 19. Spectra at peak linear noise positron, afterremoval of discrete-frequency components.
53

'§c;;.::J
~'"'"rs'" 108f-8
i><: 107en00 106Oion 105
::t:;'l 104
E 103~ ~
~ ~ 102.~-'0 ~ 101/>--e
.Q N 10000
.. 0 99'Eo
'"~ 9\\
CoO.2."
U10 I 97
4'0- -.;."> ..
96.. >-0.. E~ .. 95'g L..
'" 94=..0·-~ ".. c:
93,. ..0::>
<T~ ..,,~
92.. -c, cs91
90
! ! t !! r
265 2-70 2-75 2\\0 2-85 2-90 l-95Log
lO(peak efflux velocity at ejector exit plene, ft I s.C)
FIG. 20. Peak linear noise level (filtered) versus loglO (peakefflux velocity).
8 A." t'acC-£g6 A
i" db
=5ab
.<If.<4
.--..3.Q
" 2 Bc: a:J C
s 111.;.1N ..
g~O",..-~o ~-I
E .. 0 3 12 LId 20 32';: .2(a) Before rqmoval of disc ratq-frequC'lney componentsQ.-
"~ >~~ PIp" = 1'65 capital Iczttqrs AS cj .~ 8
P/po= 1·35 lowqr ccse It'lttqrsA
" 0Q be
by- c:
" '" 7.. "-- "g Q.6..'" "g .= 5a.~
db............. <4.
"0 A~ •g Cc
-_/:"::::'1:
0 12 LId 20 32
(b) After removal of discrete-frequency components
FIG. 21. Attenuation versus non-dimensionalised ejectorlength.
1945 Vol. I.Vol. II.Vol. III.
Vol. IV.
1946 Vol. I.Vol. II.
Vol. III.
1947 Vol. I.Vol. II.
1948 Vol. I.
Vol. II.
1949 Vol. I.Vol. II.
195° Vol. I.Vol. II.
Vol. III.
1951 Vol. I.Vol. II.
1952 Vol. I.Vol. n.
1953 Vol. I.Vol. II.
1954
Publications of the Aeronautical Research Council
ANNUAL TECHNICAL REPORTS OF THE AERONAUTICALRESEARCH COUNCIL (BOUND VOLUMES)
Aero and Hydrodynamics, Aerofoils. £6 lOS. (£6 13S. 6d.)Aircraft, Airscrews, Controls. £6 lOS. (£6 13S. 6d.)Flutter and Vibration, Instruments, Miscellaneous, Parachutes, Plates and Panels, Propulsion.
£6 lOS. (£6 13S. 6d.)Stability, Structures, Wind Tunnels, Wind Tunnel Technique. £6 lOS. (£6 13S. 3d.)
Accidents, Aerodynamics, Aerofoils and Hydrofoils. £8 8s. (£8 lIS. 9d.)Airscrews, Cabin Cooling, Chemical Hazards, Controls, Flames, Flutter, Helicopters, Instruments and
Instrumentation, Interference, Jets, Miscellaneous, Parachutes. £8 8s. (£8 I IS. 3d.)Performance, Propulsion, Seaplanes, Stability, Structures, Wind Tunnels. £8 8s. (£8 I IS. 6d.)
Aerodynamics, Aerofoils, Aircraft. £8 8s. (£8 I IS. 9d.)Airscrews and Rotors, Controls, Flutter, Materials, Miscellaneous, Parachutes, Propulsion, Seaplanes,
Stability, Structures, Take-off and Landing. £8 8s. (£8 I IS. 9d.)
Aerodynamics, Aerofoils, Aircraft, Airscrews, Controls, Flutter and Vibration, Helicopters, Instruments,Propulsion, Seaplane, Stability, Structures, Wind Tunnels. £6 lOS. (£6 I3S. 3d.)
Aerodynamics, Aerofoils, Aircraft, Airscrews, Controls, Flutter and Vibration, Helicopters, Instruments,Propulsion, Seaplane, Stability, Structures, Wind Tunnels. £5 lOS. (£5 I3S. 3d.)
Aerodynamics, Aerofoils. £5 lOS. (£5 I3s. 3d.)Aircraft, Controls, Flutter and Vibration, Helicopters, Instruments, Materials, Seaplanes, Structures,
Wind Tunnels. £5 lOS. (£5 13s.)
Aerodynamics, Aerofoils, Aircraft. £5 12S. 6d. (£5 I6s.)Apparatus, Flutter and Vibration, Meteorology, Panels, Performance, Rotorcraft, Seaplanes.
£4 (£4 3s.)Stability and Control, Structures, Thermodynamics, Visual Aids, Wind Tunnels. £4 (£4 2S. 9d.)
Aerodynamics, Aerofoils. £6 lOS. (£6 13S. 3d.)Compressors and Turbines, Flutter, Instruments, Mathematics, Ropes, Rotorcraft, Stability and
Control, Structures, Wind Tunnels. £5 lOS. (£5 13S. 3d.)
Aerodynamics, Aerofoils. £8 8s. (£8 II5. 3d.)Aircraft, Bodies, Compressors, Controls, Equipment, Flutter and Oscillation, Rotorcraft, Seaplanes,
Structures. £5 lOS. (£5 13s.)
Aerodynamics, Aerofoils and Wings, Aircraft, Compressors and Turbines, Controls. £6 (£6 3S. 3d.)Flutter and Oscillation, Gusts, Helicopters, Performance, Seaplanes, Stability, Structures, Thermo
dynamics, Turbulence. £5 55. (£5 8s. 3d.)
Aero and Hydrodynamics, Aerofoils, Arrester gear, Compressors and Turbines, Flutter, Materials,Performance, Rotorcraft, Stability and Control, Structures. £7 7s. (£7 lOS. 6d.)
Special VolumesVol. I. Aero and Hydrodynamics, Aerofoils, Controls, Flutter, Kites, Parachutes, Performance, Propulsion,
Stability. £6 6s. (£6 9S.)Vol. II. Aero and Hydrodynamics, Aerofoils, Airscrews, Controls, Flutter, Materials, Miscellaneous, Parachutes,
Propulsion, Stability, Structures. £7 7s. (£7 lOS.)Vol. III. Aero and Hydrodynamics, Aerofoils, Airscrews, Controls, Flutter, Kites, Miscellaneous, Parachutes,
Propulsion, Seaplanes, Stability, Structures, Test Equipment. £9 9s. (£9 12S. 9d.)
Reviews of the Aeronautical Research Council1949-54 5S• (5s. 5d.)
Index to all Reports and Memoranda published in the Annual Technical Reports1909-1947 R. & M. 2600 (out of print)
Indexes to the Reports and Memoranda of the Aeronautical Research CouncilBetween Nos. 2451-2549: R. & M. No. 2550 2S. 6d. (2S. 9d.); Between Nos. 2651-2749: R. & M. No. 2750 2s.6d.(2S. 9d.); Between Nos. 2751-2849: R. & M. No. 2850 2S. 6d. (2S. 9d.); Between Nos. 2851-2949: R. & M. No. 29503s. (3s. 3d.); Between Nos. 2951-3°49: R. & M. ~o. 3050 35. 6d. (35. 9d.); Between Nos. 3°51-3149: R. & M. No. 31503s. 6d. (Js. 9d.); Between Nos. 3151-3249: R. & M. No. 3250 35. 6d. (3S. 9d.); Between Nos. 3251-3349: R. & M.
No. 3350 35. 6d. (35. Iod.)
Prices in brackets include postage
Government publications can be purchased over the counter or by post from the Government Bookshopsin London, Edinburgh, Cardiff, Belfast, Manchester, Birmingham and Bristtol, or through any bookseller
© Crown copyright Ig65
Printed and published byHER MAJE STY'S STATIONERY OFFICE
To be purchased fromYork House, Kingsway, London W.C.2
423 Oxford Street, London w. I
13A Castle Street, Edinburgh 2
log St. Mary Street, Cardiff39 King Street, Manchester 2
50 Fairfax Street, Bristol I
35 Smallbrook, Ringway, Birmingham 580 Chichester Street, Belfast I
or through my bookseller
Printed in England
R. & M. No. 3389
R. & M. No. 3389