the nipas and the system of national accounts
TRANSCRIPT
December 2004 17
HE increased integration of the world’s monetary,fiscal, and trade policies has led to a growing need
for the international harmonization of economic sta-tistics. Accordingly, the System of National Accounts1993 (SNA) was developed by the international com-munity in order to facilitate international comparisonsof national economic statistics and to serve as a guidefor countries as they develop their economic account-ing systems.1 The Bureau of Economic Analysis (BEA)actively participated in preparing the 1993 revision ofthe SNA, and after the revision was approved by theUnited Nations Statistical Commission, BEA has mov-ed its accounts toward improved consistency with theSNA, which now serves as the internationally acceptedset of guidelines for the compilation of national ac-counts.2
The SNA provides a comprehensive framework forrecording all of the stocks and flows that are defined aspart of a nation’s economy. Its accounts are organizedto measure production, income, saving, investment,and financial and nonfinancial wealth; it also encom-passes input-output tables, international transactions,financial accounts, and balance sheets. The SNA isdesigned to be an integrated system; that is, the ac-counts use consistent definitions, classifications, andaccounting conventions. Furthermore, the SNA is al-most completely harmonized with other internationalguidelines, such as the International Monetary Fund’sBalance of Payments Manual (fifth edition).
Since 1993, BEA has continued to improve its na-tional income and product accounts (NIPAs) and itsother economic accounts to incorporate most of themajor SNA guidelines that affect gross domestic prod-uct (GDP), investment, and saving.
● In the 1996 comprehensive NIPA revision, chain-type indexes were adopted for measuring changes inreal GDP and prices, and government fixed invest-ment was recognized.
● In the 1999 comprehensive revision, investment insoftware was recognized, the treatment of govern-ment employee retirement plans was changed, andcertain transactions were reclassified as capitaltransfers.
1. See Commission of the European Communities, International Mone-tary Fund, Organisation for Economic Co-operation and Development,United Nations, and the World Bank, System of National Accounts 1993(Brussels/Luxembourg, New York, Paris, and Washington, DC, 1993).
2. See “New International Guidelines in Economic Accounting,” SURVEY OF
CURRENT BUSINESS 73 (February 1993): 43.
● In the 2003 comprehensive revision, the implicitservices provided by commercial banks to borrow-ers were recognized, the services produced by gen-eral government were explicitly recognized, thedefinition of national income was broadened toinclude all net income (net of consumption of fixedcapital) earned in production, and the summaryaccounts, tables, and terminology were revised tomore closely conform with the SNA.BEA supports the goal of the international harmo-
nization of its national accounts, and the NIPAs willcontinue to adopt the SNA guidelines to the extent thatis feasible. However, some differences will persist be-cause BEA has decided to retain several importantNIPA aggregates, such as personal income and corpo-rate profits, that do not appear in the SNA, and BEAmust also consider the needs of the U.S. user commu-nity. Improving the consistency of the NIPAs with theSNA remains an important element of BEA’s missionto produce accurate, relevant, and timely statistics, torespond to customers’ needs, and to meet the chal-lenges of measuring a changing economy.
BEA is also participating with other members of theinternational statistical community in the current re-view and update of the SNA that was recently autho-rized by the United Nations Statistical Commission.This review is considering revisions to the SNA thatwill address new issues that are emerging in the neweconomic environment, as well as some old issues thatare increasing in economic significance or that mayqualify for a different treatment as a result of advancesin methodological research. A few of the changes thatare being considered include treating research and de-velopment as part of fixed capital formation, recogniz-ing a net return to government fixed assets, and usingactuarial valuations to determine the liability and to al-locate the net worth of employer-provided definedbenefit plans between the employer and the employees.
For many years, BEA has prepared estimates on anSNA basis in response to a questionnaire used by theOrganisation for Economic Co-operation and Devel-opment (OECD).3 These estimates are published bythe OECD and by other international organizations.The estimates are derived from the published NIPA es-timates and are converted to the SNA basis in a series
3. For a discussion of the 1968 version of the SNA and the NIPAs, seeCarol S. Carson and Jeanette Honsa, “The United Nations System ofNational Accounts: An Introduction,” SURVEY 70 (June 1990): 20–30.
The NIPAs and the System of National AccountsBy Charles Ian Mead, Karin E. Moses, and Brent R. Moulton
T

18 The NIPAs and the System of National Accounts December 2004
1. The private enterprise account covers all private businesses, both corporate and noncorporate, and it is most closely related to the SNA’s entrepreneurial income accounts.U.S. Bureau of Economic Analysis
Chart 1. NIPA Summary Tables
Production
Government currentreceipts andexpenditures
Personal incomeand outlay
Transactions
Domestic Accounts
Private enterpriseincome1
Foreign transactionscapital account
PersonalBusiness Government
Economic Sectors
Income andoutlay
Saving andinvestment
(Account 2) (Account 4)
Domestic income and product(Account 1)
(Account 3)
Foreign transactionscurrent account
(Account 5)
(Account 7)
Rest of the World
Domestic capital account(Account 6)
of reconciling adjustments that are based on underly-ing detail and related estimates. However, the adjust-ments do not deal with all the differences between theNIPAs and the SNA; for example, information is notavailable to cover illegal production, which accordingto SNA, should be included as part of the productionmeasured by GDP.
In the first part of this article, the organization andmajor features of the SNA are compared with those ofthe NIPAs. In the second part, the set of estimates onan SNA basis that are provided to the OECD are pre-sented, and these estimates are compared with the re-lated NIPA estimates. In the third part, the currentrevision of the SNA is described.
The SNA and the NIPAsThe SNA aims to provide a comprehensive record ofthe stocks and flows that are defined as part of a na-tion’s economy. Like the NIPAs, the SNA organizes themajor economic institutions (households, businesses,governments, and nonprofit institutions) and theirtransactions so that the resulting estimates are mean-ingful for economic analysis, forecasting, and policy.
The SNA is organized as a series of accounts thatsummarize the transactions of groups of institutions(or sectors), of groups of establishments engaged inproduction (or industries), and of the total economy.It includes a sequence of accounts that flow from oneto another; for example, production generates income,which then is used to finance consumption and othercurrent spending and saving. Saving is then used forcapital formation or for acquiring financial assets andliabilities (net lending). Finally, the accumulation of
nonfinancial assets and of financial assets and liabili-ties and the revaluation of assets and liabilities explainthe differences between the opening balance sheet andthe closing balance sheet, which summarize the wealthof a nation or a sector.
The SNA encompasses accounts that are organizedas separate sets of accounts in the United States. TheNIPAs are organized as 7 summary accounts withnearly 300 underlying tables, and they cover the trans-actions that are grouped in the SNA as the productionaccount, the distribution and use of income accounts,and the capital accounts. In particular, in the NIPAs,the domestic income and product account (chart 1,summary account 1) provides estimates of GDP andcorresponds to the SNA production account for the to-tal economy. The domestic income and product ac-count also provides information about the incomefrom production that accrues to labor (compensationof employees), to capital (net operating surplus andconsumption of fixed capital), and to government(taxes on production and imports); in the SNA, theseflows are included in the generation of income ac-count. In the SNA, the remaining accounts in the dis-tribution and use of income accounts for each of thedomestic sectors roughly correspond to the NIPA per-sonal income and outlay account (account 3), to thegovernment current receipts and expenditures account(account 4), and partly to the private enterprise in-come account (account 2, which corresponds mostclosely to the SNA’s “entrepreneurial income” ac-count). The NIPA domestic capital account (account6) corresponds to the SNA capital account for the totaleconomy. Both the SNA and the NIPAs include a cur-

December 2004 SURVEY OF CURRENT BUSINESS 19
rent account and a capital account for the rest-of-the-world sector (accounts 5 and 7), which summarize thetransactions of foreign residents with U.S. residents.
Several other sets of U.S. economic accounts fallwithin the purview of the SNA. BEA’s input-output ac-counts and the GDP-by-industry accounts provide adetailed analysis of the production process and the useof goods and services by domestic industries. BEA alsoprepares estimates of the net stock of fixed assets andconsumer durable goods. The Federal Reserve Board’sflow-of-funds accounts cover financial transactionsand provide balance sheet information.4 In addition,two other sets of accounts are linked to the SNA butare not directly a part of it—the balance-of-paymentsaccounts that are prepared by BEA and the productiv-ity statistics that are prepared by the Bureau of LaborStatistics.
Differences in sectorsAccording to the SNA, the accounts of the related esti-mates for each of the domestic institutional sectors canbe added to obtain an account of the total economy.
In the SNA, a nation’s economic institutions aregrouped into five major sectors—nonfinancial corpo-rations, financial corporations, general government,nonprofit institutions serving households, and house-holds. Each institution is classified in one of these sec-tors, and all of the accounts for the institutions(production, distribution and use of income, capital,financial, and balance sheets) are included in the ac-counts for that sector. Each sector can be divided intosubsectors; for example, in the general governmentsector, accounts can be compiled for central govern-ment, state government, local government, and socialsecurity funds.
In the NIPAs, economic institutions are alsogrouped into sectors, but the sector classificationscheme is more complicated than in the SNA. Institu-tions are grouped in one way for measuring their con-tribution to production, and they are grouped inanother way for measuring income, outlays, and sav-ing. In contrast, the SNA sector definitions are thesame for all of the accounts.
For measuring the contribution, or value added, ofvarious institutions to production, GDP, the Nation’sproducers are grouped into three sectors—business,
4. A related effort is a joint research project by BEA and the FederalReserve Board to develop integrated NIPAs and flow-of-funds accounts thatare based on the SNA. See Albert M. Teplin, Rochelle Antoniewicz, SusanHume McIntosh, Michael Palumbo, Genevieve Solomon, Charles IanMead, Brent R. Moulton, and Karin Moses, “Integrated MacroeconomicAccounts for the United States: Draft SNA-USA” (paper prepared for Con-ference on Research in Income and Wealth, Washington, DC, April 16–17,2004).
households and institutions, and general government.5
The business sector includes private entities that areorganized for profit and other units (such as govern-ment enterprises) that are primarily engaged in pro-ducing goods and services for sale at a price that isintended to at least approximate the costs of produc-tion. The households and institutions sector consists ofhouseholds and nonprofit institutions serving house-holds. The sectors in the NIPAs differ from those in theSNA primarily in the treatment of noncorporate busi-ness enterprises. In the NIPAs, these businesses are inthe business sector. In the SNA, unincorporated busi-nesses that function and that keep complete accountsas if they were corporations, such as some private part-nerships and government agencies, are classified as“quasi-corporations” in the nonfinancial or the finan-cial corporations sectors, and other unincorporatedenterprises are classified in the household sector.
For measuring income, outlays, and saving in theNIPAs, the institutions are grouped into three othersectors—personal, government, and corporate. Thepersonal sector includes the income that is earned by,or transferred to, households and nonprofit institu-tions serving households and the net income of enter-prises that are owned by households (proprietors’income and rental income of persons). The govern-ment sector includes general government and govern-ment business enterprises. The corporate sectorconsists of business entities that are legally organizedas corporations and that are required to file corporatetax returns.
The NIPA personal sector is more broadly definedthan the combined SNA sectors of households and ofnonprofit institutions serving households, because thepersonal sector includes the net income of all privateunincorporated businesses. The NIPA governmentsector is more broadly defined than the SNA generalgovernment sector because it includes the surplus of allgovernment enterprises. The NIPA corporate sector ismore narrowly defined than the combined SNA sectorsof nonfinancial and financial corporations; the NIPAcorporate sector does not include quasi-corporations.
Other differences between the NIPAs and the SNAIn the NIPAs, the major aggregates, such as GDP, arenow mainly consistent with the SNA guidelines, butseveral minor differences remain. Some of these differ-
5. For more information about NIPA sectors, see “A Guide to the NIPAs,”M–20 at <www.bea.gov/bea/an/nipaguid.htm>. For changes to the sectorclassifications that occurred as part of the 2003 comprehensive NIPA revi-sion, see Brent R. Moulton and Eugene P. Seskin, “Preview of the 2003Comprehensive Revision of the National Income and Product Accounts:Changes in Definitions and Classifications,” SURVEY 83 (June 2003): 17–34.

20 The NIPAs and the System of National Accounts December 2004
ences are eliminated by the reconciling adjustmentsthat BEA uses when it prepares SNA-based estimatesfor the OECD questionnaire, but BEA lacks thesource data to produce some of the estimates thatare conceptually included in the SNA.
In the NIPAs, all plant, equipment, and softwarethat are used continuously in production for at least 1year are treated as fixed investment. However, in theSNA, investment in defense weapons systems—such asaircraft, battleships, and tanks—are treated as con-sumption expenditures even if their service lives arelonger than a year. As a result, the GDP estimates on anSNA basis are about 0.5 percent less than the NIPAestimates of GDP, because general government con-sumption expenditures include the consumption offixed capital as a partial measure of the services pro-vided by fixed assets in production. In preparing theestimates on an SNA basis, BEA removes the consump-tion of fixed capital for defense weapons systems andreclassifies the investment as consumption expendi-tures rather than as fixed investment.
Another minor difference affects the estimates of in-vestment and consumption, but not the difference be-tween GDP and SNA-based GDP. In the NIPAs, theinventory estimates cover only private inventories, be-cause the available source data on inventories held bygovernment is incomplete; consequently, the NIPAstreat government purchases of goods as consumptionregardless of whether they are immediately used or areentered into inventories. However, information isavailable for some types of government inventories(for example, agricultural goods owned by the Com-modity Credit Corporation and inventories in theStrategic Petroleum Reserve). For the SNA-based esti-mates, BEA treats the change in these inventories aspart of government investment rather than as govern-ment consumption expenditures.
The NIPAs also differ from the SNA because someactivities or assets are not covered by the NIPAs be-cause of the lack of source data; as a result, the SNA-based NIPA estimates are not adjusted.6 In the SNA, il-legal activities (such as prostitution or the cultivationor manufacture of illegal drugs) are treated the same aslegal activities; the NIPAs do not include estimates ofillegal production. In the SNA, trees and livestock,such as dairy cattle, that are used continuously in pro-duction for more than a year are treated as cultivatedfixed assets, and their production is treated as part of
6. For more information on the measurement of GDP in the United Statesand Canada and the SNA guidelines, see Kishori Lal, “Measurement of Out-put, Value Added, GDP in Canada and the United States: Similarities andDifferences” (research paper, Statistics Canada, June 2003).
investment; the NIPAs do not currently include esti-mates of investment for these types of assets. In addi-tion, in the SNA, entertainment, literary, or artisticoriginals (such as original films, sound recordings, andmanuscripts) are treated as investment, but the NIPAsdo not currently include investment in these types ofassets. BEA’s Strategic Plan calls for research to help fillsome of these gaps in the NIPAs.
In preparing the SNA-based estimates for theOECD, it is not possible to completely adjust the NIPAestimates to the SNA standards for sectors, but someadjustments are made. Where data exist to separatelyidentify all the transactions of government enterprises,these enterprises are classified to the SNA corporatesector; all Federal Government business enterprisesand all state and local government utility enterprisesexcept transit are classified to the corporate sector andstate and local government transit and other nonutilitybusiness enterprises are classified as market producersin the general government sector. In addition, privateunincorporated businesses are included in the house-holds sector. These definitions reflect the source datathat are presently available to partly implement theSNA guidelines on sectors.
Another definitional difference relates to the con-cept of disposable income in the accounts. In the SNA,disposable income is total income that is net of all cur-rent outlays except consumption expenditures. In theNIPAs, however, disposable personal income is per-sonal income that is net of only taxes and social contri-butions; personal interest payments and personalcurrent transfer payments are treated as outlays thatare paid from disposable personal income.7
Other differences between the NIPAs and the SNA-based estimates also reflect differences in presentation.In the SNA, outflows are seldom netted against in-flows; the presentational changes introduced in the2003 comprehensive NIPA revision greatly reduced theextent of netting in the NIPAs, but some differences inthe degree of netting still remain. In addition, some ag-gregates exist in one system but not in the other. Forexample, NIPA corporate profits and personal incomedo not have precise counterparts in the SNA, and theSNA concept of “mixed income”—that is, the residualbusiness income of unincorporated corporations thatis attributable to labor and to capital—has not been
7. An additional difference between the NIPAs and the SNA is the treat-ment of employee pension plans. In the NIPAs, the income and saving asso-ciated with these plans are recorded as personal income and saving from thetime employer contributes, whereas the SNA uses a system of dual record-ing; the measure of disposable income includes defined benefit plan pen-sions when they are paid as benefits, and the measure of saving treats theemployee as the owner of the plan’s assets as soon as the employer contrib-utes to the plan.

December 2004 SURVEY OF CURRENT BUSINESS 21
implemented in the NIPAs, pending a review of thesectoring of unincorporated businesses.8
BEA’s Estimates of SNA AggregatesBEA prepares several tables that present SNA-based es-timates for the OECD.9 One of these tables presentssummary estimates by sector for a generation of in-come account, a distribution of income account, a useof disposable income account, and a capital ac-count—that generally correspond to the series of ac-counts recommended by the SNA and that follow acomplete production account. For each of these ac-counts, estimates for three SNA-derived institutionalsectors are prepared—for corporations (combined fi-nancial and nonfinancial corporations), for generalgovernment, and for households and nonprofit insti-tutions serving households along with estimates forthe total economy. In addition, the major SNA ac-counts are discussed, the summary estimates are pre-sented, and the reconciling adjustments that BEAmakes in preparing the SNA-based estimates are sum-marized.
Production accountThe production account in the SNA describes the rela-tionship between gross output (which is the totalgoods and services that are produced) and value added(which is measured as the value of output less the valueof intermediate consumption). Value added is a mea-sure of the contribution to GDP by a producer, an in-dustry, or a sector. BEA prepares estimates of grossoutput and of value added by industry and for the totaleconomy in its integrated input-output accounts andGDP-by-industry accounts. BEA does not prepare esti-mates of gross output by sector, but it does prepare es-timates of value added on both a NIPA basis and anSNA basis.
Total economy. The NIPA estimate of GDP differsfrom the SNA-based estimate of GDP because of thediffering treatment of the investment in defense weap-ons systems; specifically, gross value added equals GDPless the estimate of the consumption of fixed capital as-sociated with investment in defense weapons systemsthat underlies the NIPA measure. In addition, the sumof gross value added across the sectors of the economyin the SNA-based estimates does not equal GDP, be-cause the statistical discrepancy is added to the sum ofvalue added across sectors to arrive at GDP. The NIPAs
8. In the NIPAs, residual business income is the income after paying forintermediate inputs, for compensation of employees, and for taxes on pro-duction and imports and is treated as gross operating surplus regardless ofwhether the business is a corporation or an unincorporated enterprise.
9. These estimates will soon be available on BEA’s Web site at<www.bea.gov>; under “National” and “Supplemental Estimates,” andclick on “SNA-based estimates.”
have two measures for the value of final goods and ser-vices produced in the economy—an income-side mea-sure and an expenditure-side measure—and thedifference between these two measures is reported asthe statistical discrepancy, a concept that does not arisein the SNA. Although the expenditure-side measure ofGDP is believed to be more accurate, the gross value-added estimates in the SNA account are primarily de-rived from the income-related estimates in the NIPAs.
Corporations. The NIPAs include estimates ofvalue added for the business sector and for corpora-tions. However, neither of these values match the valueadded of the corporations sector on an SNA basis. Spe-cifically, the value added of the NIPA business sectorincludes the value added of unincorporated enterprisesthat are classified in the household sector and the valueadded of state and local government enterprises (otherthan nontransit utilities) that are classified in the gen-eral government sector for the SNA-based estimates.The value added of the NIPA corporations sector doesnot include the transactions of Federal Governmententerprises and of state and local nontransit utility en-terprises.
General government. The NIPA measure of valueadded for the general government sector, like the SNAestimate, is based on the cost of producing governmentservices. However, the NIPA measure of value addedfor general government does not include state and lo-cal nontransit utility business enterprises, which areincluded in the NIPA business sector. In addition, gen-eral government value added is affected by the reclassi-fication of investment in defense weapons systems.
Households and nonprofit institutions servinghouseholds (NPISHs). The NIPA value-added esti-mates for households are based on the difference be-tween gross output (the imputed rental value) ofowner-occupied housing less intermediate consump-tion plus the compensation paid to domestic house-hold staff, and the value-added estimates for NPISHsare based on the cost of production. The NIPA esti-mates exclude the value added of unincorporated“other private businesses” that are included in thehouseholds and NPISHs sector in the SNA-based esti-mates.
Generation of income accountIn the SNA, the generation of income account is thefirst in a series of distribution and use of income ac-counts. This account presents the distribution of theincome that is earned in production (gross valueadded as derived in the production account) and thatis distributed to labor (as compensation of employees),to government (as taxes on production and importsless subsidies received), to capital (as gross operating
22 The NIPAs and the System of National Accounts December 2004
NIPA Domestic Income and ProductGross domestic product…..... 11,004.0Less: Statistical
discrepancy…………........… 25.6Equals: Gross domestic 10,978.5
income…………….....……….Compensation of employees,
paid……………………………...…. 6,294.5Taxes on production and
imports……………………....……. 798.1Less: Subsidies…………………….. 46.7Net operating surplus………......…. 2,578.7Consumption of fixed capital.....… 1,353.9
U.S. Bureau of Economic Analysis
NOTE. All estimates are derived from the 2004 annual NIPA revision. See also NIPA tables 1.1.5 and 1.10.
Chart 2. Relationship Between NIPA Domestic Income and Product and the SNA Generationof Income Account for the Total Economy, 2003
NIPA Underlying Consumption of FixedCapital Estimates
Less: Consumption of fixed capital
associated with defense
weapons systems........................... 52.8
SNA Generation of Income AccountValue added, gross………...……….… 10,951.3
Statistical discrepancy…………...…... 25.6
Compensation of employees, paid..... 6,294.5
Taxes on production and imports,
paid…………………………...……... 798.1
Other taxes on production and
imports, paid……………………... 364.8
Subsidies, received…………...……… 46.7
Operating surplus and mixed
income, gross……………....………. 3,879.9
Mixed income, gross……....………. 1,311.3
surplus) or to labor and capital combined (as grossmixed income) for unincorporated enterprises. Grossoperating surplus and mixed income are profits-likemeasures that show business income after subtractingthe costs of the compensation of employees and taxeson production and imports (less subsidies received)from gross value added, but before subtracting financ-ing costs and business transfer payments.
SNA-based estimates for the measures in the gener-ation of income accounts are prepared for the totaleconomy, corporations, general government, andhouseholds and NPISHs. The relationships of thesemeasures to the broad set of measures in the NIPAs aredescribed, and some of the differences between the twosets of accounts are also explained.
Total economy. The measures in the generation ofincome account for the total economy are similar tothe related measures in the NIPAs because the differ-ences in the economic sectors are not an issue at theaggregated level of the total economy. However, a fewof the concepts that are used for the two sets of ac-counts differ (chart 2).
The concept in the NIPAs of gross operating surplusdiffers from the concept in the SNA account. In theSNA, the operating surplus of business enterprisesowned by households is identified and labeled as grossmixed income. To derive the estimate of gross mixedincome on an SNA basis, BEA includes the NIPA oper-ating surplus of private noncorporate business exceptowner-occupied housing. Thus, “gross operating sur-plus and mixed income” in the SNA account (net oper-ating surplus and mixed income plus the consumptionof fixed capital) equals net operating surplus plus theconsumption of fixed capital in the NIPAs less the esti-mate of the consumption of fixed capital associated
with the investment in defense weapons systems thatunderlies the NIPAs (black arrows).
In addition, in the SNA, taxes associated with theownership or the use of resources in production areseparated from all the other types of taxes on produc-tion and imports. As a result, the SNA account in-cludes a separate line item for “other taxes onproduction and imports, paid,” which is the sum ofproperty taxes, motor vehicle license taxes, severancetaxes, special assessments, business licenses, documen-tary taxes, and stamp taxes paid to state and local gov-ernments. Although a measure of “other taxes onproduction” does not exist in the NIPAs, its value canbe derived from the sum of some of the more detailedNIPA measures of taxes on production and imports. Inaddition to the sum of excise taxes, sales taxes, and cus-toms duties, “other taxes on production” are includedin the broader category of taxes on production and im-ports.10
Corporations. In the NIPAs, a relatively completeset of measures are closely related to the measures forcorporations in the SNA generation of income ac-count. However, the values of the related measuresgenerally differ because of the differences in the group-ing of government enterprises in two sets of accounts.Specifically, the related NIPA measures do not includethe transactions of Federal Government enterprisesand of state and local nontransit utility enterprises.The transactions of these enterprises are included withthose of “other noncorporate businesses” in the do-mestic income and product accounts of the NIPAs.
For details about the relationship between the mea-sures in the generation of income account for corpora-
10. See NIPA table 3.5.

December 2004 SURVEY OF CURRENT BUSINESS 23
tions and the NIPA measures, see table 1. Only theestimates of taxes paid and subsidies received by cor-
porations are unaffected by the differences in the sec-tor definitions.
Table 1. SNA Generation of Income Account for Corporations Derived From the NIPAs[Billions of dollars]
SNA series 2003 NIPA series
Value added, gross............................................ 6,626.4 Gross value added of domestic corporate business (table 1.14, line 1), plus estimates of the gross value added of Federal Government enterprises and state and local government enterprises reclassified into the SNA corporate sector (sum of elements listed below for compensation of employees paid and operating surplus of Federal Government enterprises and state and local government enterprises reclassified into the SNA corporate sector).
Compensation of employees, paid.................. 4,221.4 Compensation of employees paid by domestic corporate business (table 1.14, line 4), plus compensation paid by Federal Government enterprises (table 6.2D, line 91), plus compensation paid by state and local government enterprises (table 6.2D, part of line 96) reclassified into the SNA corporate sector.
Taxes on production and imports, paid ........... 528.3 Taxes on production and imports paid by domestic corporate business (table 1.14, part of line 7).
Other taxes on production and imports, paid 125.7 Sum of state and local property taxes, motor vehicle licenses, severance taxes, special assessments, and other taxes paid by domestic corporate business (table 3.5, parts of lines 27, 28, 29, 30, and 31, respectively).
Subsidies, received ........................................... 5.1 Subsidies received by domestic corporate business (table 1.14, part of line 7).
Operating surplus, gross ................................... 1,881.8 Net operating surplus of domestic corporate business (table 1.14, line 8), plus consumption of fixed capital of domestic corporate business (table 7.5, line 4), plus current surplus of Federal Government enterprises (table 3.2, line 18), plus consumption of fixed capital by Federal Government enterprises (table 7.5, line 26), plus current surplus of state and local government enterprises (table 3.3, part of line 20) reclassified into the SNA corporate sector, plus consumption of fixed capital of state and local government enterprises (table 7.5, part of line 27) reclassified into the SNA corporate sector.
Table 2. SNA Generation of Income Account for General Government[Billions of dollars]
SNA series 2003 NIPA series
Value added, gross............................................ 1,252.7 Gross value added of government (table 3.10.5, line 3), plus gross value added of state and local government enterprises not reclassified into the SNA corporate sector (sum of elements listed below for compensation of employees paid and operating surplus of state and local government enterprises not reclassified into the SNA corporate sector), less consumption of fixed capital associated with investment in defense weapons systems (table 7.5, part of line 23) reclassified as consumption expenditures.
Compensation of employees, paid.................. 1,112.4 Compensation of employees paid by general government (table 3.10.5, line 4), plus compensation of employees by state and local government enterprises (table 6.2D, part of line 96) not reclassified into the SNA corporate sector.
Operating surplus, gross ................................... 140.3 Consumption of fixed capital for general government (table 7.5, line 21), plus current surplus of state and local government enterprises (table 3.3, part of line 20) not reclassified into the SNA corporate sector, plus consumption of fixed capital for state and local government enterprises (table 7.5, part of line 27) not reclassified into the SNA corporate sector, consumption of fixed capital associated with investment in defense weapons systems (table 7.5, part of line 23) reclassified as consumption expenditures.
24 The NIPAs and the System of National Accounts December 2004
General government. The NIPA measures for thegovernment sector that are closely related to the SNAmeasures in the generation of income account for gen-eral government differ because of differences in thesector definitions. Specifically, the related NIPA mea-sures for the government sector do not include stateand local nontransit utility business enterprises,which are included in the business sector. In theSNA account, compensation of employees paid andgross operating surplus are affected by the differentdefinition of the government sector (table 2). In addi-tion, operating surplus is affected by the reclassifica-tion of investment in defense weapons systems.
Households and NPISHs. The estimates in the gen-eration of income account for households and NPISHsare related to the NIPA estimates for the personal
sector, but the related estimates are affected by the dif-ferences in the sector definitions. Specifically, the NIPAestimates exclude many of the transactions associatedwith “other private businesses” that are included in thehouseholds and NPISHs sector in the SNA-based esti-mates (table 3). In addition, many of the estimates inthe generation of income account for households andNPISHs—such as compensation of employees, operat-ing surplus, and mixed income—can be derived froman array of estimates in the NIPAs.
Distribution and use of income accountsThe distribution and use of income accounts in thesummary table cover the transactions in the SNA dis-tribution and use of income accounts that follow thegeneration of income account. These remaining SNA
Table 3. SNA Generation of Income Account for Households and Nonprofit Institutions Serving Households Derived From the NIPAs
[Billions of dollars]
SNA series 2003 NIPA series
Value added, gross ........................................ 3,046.6 Gross domestic product of households and institutions (table 1.3.5, line 5), plus compensation of employees paid, taxes on production and imports paid, and operating surplus of noncorporate domestic business, less subsidies received of noncorporate domestic business (sum of elements listed below for compensation of employees paid, taxes on production and imports paid, and operating surplus, less subsidies paid for noncorporate domestic business).
Compensation of employees, paid............... 960.7 Sum of compensation of employees paid by sole proprietorships and partnerships, by other private business, by households, and by nonprofit institutions serving households (table 1.13, lines 20, 29, 43, and 50, respectively).
Taxes on production and imports, paid ........ 269.8 Taxes on production and imports paid by noncorporate domestic business (table 3.5, part of line 1).
Other taxes on production and imports, paid 239.1 Estimate of state and local property taxes, motor vehicle licenses, severance taxes, special assessments, and other taxes paid by noncorporate domestic business (table 3.5, parts of lines 27, 28, 29, 30, and 31, respectively).
Subsidies, received ........................................ 41.6 Estimate of subsidies received by noncorporate domestic business (table 3.13, part of line 1).
Operating surplus and mixed income, gross.. 1,857.8 Proprietors’ income with IVA and CCAdj (table 2.1, line 9), plus rental income of persons with CCAdj (table 2.1, line 12), plus net interest paid by sole proprietorships and partnerships, other private business, owner-occupied housing, and nonprofit institutions (table 7.11, lines 95, 96, 97, and 98), plus consumption of fixed capital for sole proprietorships and partnerships and other private business (table 7.5, lines 8 and 11), plus noncorporate current transfer payments (table 1.10, part of line 14).
Mixed income, gross.................................... 1,311.3 Operating surplus (as listed above), less net interest paid by owner-occupied housing and by nonprofit institutions (table 7.11, lines 97 and 98), less consumption of fixed capital for households and institutions (table 7.5, line 18).
CCAdj Capital consumption adjustmentIVA Inventory valuation adjustment

December 2004 SURVEY OF CURRENT BUSINESS 25
distribution and use of income accounts provide infor-mation on how the income that is generated in pro-duction is distributed across the sectors of the nationaleconomy. For each sector, the first few remaining ac-counts record the income that is received from produc-tion (such as employee compensation received byhouseholds) and other property, subsidies, taxes, andtransfer payments received and paid in order to derivea general measure of disposable income. The lastremaining account, the use of disposable income,shows how this disposable income is allocated be-tween final consumption and net saving for sectorsthat have final consumption.
The distribution of income account for the totaleconomy in the summary table is derived from a vari-ety of estimates in the NIPAs, and these estimates canbe viewed as the sum of the associated transactions ofthe sectors of the economy. However, the estimates forthe measures in the distribution of income accountand in the use of disposable income account for each
SNA-based sector and their relationship to measures inthe NIPAs are described.
Corporations. The differences between the esti-mates in the distribution of income account for corpo-rations and the NIPAs are mainly accounted for by thedifferences in the sector definitions of government en-terprises in the two sets of accounts, but the distribu-tion of income account also includes a few estimatesthat do not exist in the NIPAs.
The distribution of income account includes thetransactions associated with all the sources and theuses of income, not just the income that is directly re-lated to production (table 4). Specifically, the distribu-tion of income account includes the SNA measure of“property income, paid,” which is similar to the NIPAmeasure of corporate income payments on assets. Italso includes the SNA measure of “property income,received,” which is analogous to the NIPA measure ofcorporate income receipts on assets. Net disposable in-come consists of income received (operating surplus
Table 4. SNA Distribution of Income Account for Corporations Derived From the NIPAs[Billions of dollars]
SNA series 2003 NIPA series
Operating surplus, net 1................................ 1,084.3 See table 1 of this article.
Property income, paid .................................. 1,986.7 Interest paid by domestic corporations (table 7.11, sum of lines 3, 44, and 72), dividends paid by domestic corporate business (table 7.10, line 2), plus reinvested earnings on foreign direct investment in the United States by the rest of the world (table 4.1, line 24), plus interest paid by Federal Government enterprises and state and local government utility enterprises (table 7.11, sum of lines 19 and 85), plus rents and royalties paid by domestic corporations (table 3.2, line 14 and table 3.3, line 15).
Property income, received............................ 1,600.4 Interest received by domestic corporations (table 7.11, sum of lines 27, 51, and 90), plus dividends received by domestic corporate business (table 7.10, line 7), plus reinvested earnings on U.S. direct investment abroad (table 4.1, line 12), plus interest received by Federal Government enterprises and state and local government enterprises (table 7.11, sum of parts of lines 35 and 66).
Current taxes on income, wealth, etc., paid 234.9 Taxes on domestic corporate income (table 6.18D, line 1).
Other current transfers, paid ...................... 65.0 Transfer payments by domestic corporate business (table 1.14, line 10).
Net disposable income............................... 398.1 Undistributed corporate profits (table 1.16, line 24), plus current surplus of Federal Government enterprises (table 3.2, line 18), plus current surplus of state and local government utility enterprises (table 3.3, part of line 20), less interest paid by Federal Government enterprises and state and local government utility enterprises (table 7.11, sum of parts of lines 19 and 85).
1. Net operating surplus is used in the calculation of net national disposable income,but it is not included in the summary institutional sector accounts provided to the OECD.
Net operating surplus is equal to gross operating surplus from the generation of incomeaccount less the consumption of fixed capital.

26 The NIPAs and the System of National Accounts December 2004
U.S. Bureau of Economic Analysis
1. Net operating surplus is used in the calculation of net savings, but it is not included in the summary institutional sector accounts provided tothe OECD. Net operating surplus is equal to gross operating surplus from the generation of income account less the consumption of fixed capital.NOTE. All estimates are derived from the 2004 annual NIPA revision. See also NIPA table 3.1
Chart 3. Relationship Between NIPA Government Current Receipts and Expenditures and the SNADistribution and Use of Disposable Income Accounts, 2003
SNA Distribution of Income AccountOperating surplus, net 1……………… –10.1
Taxes on production and imports,
received……………………………. 798.1
Subsidies, paid………………………. 46.7
Property income, paid…………..…… 290.9
Property income, received…..……… 104.3
Current taxes on income, wealth
etc., received……………………… 1,235.7
Social contributions and social
benefits, other than social
transfers in kind, paid……….……. 1,309.3
Social contributions and social
benefits, other than social
transfers in kind, received…..……. 773.2
Other current transfers, paid……..…. 23.7
Other current transfers, received…... 111.5
Net disposable income…...............… 1,342.1
SNA Use of Disposable Income AccountFinal consumption expenditure…..… 1,712.5
Saving, net……………………………. –370.5
NIPA Government Current Receiptsand Expenditures
Current receipts…….....……… 3,032.0Current tax receipts……………...….. 2,033.8
Personal current taxes………...…. 1,001.9
Taxes on production and imports. 798.1
Taxes on corporate income…...…. 225.8
Taxes from the rest of the world.... 8.1
Contributions for government
social insurance………………...…. 773.2
Income receipts on assets………….. 104.0
Current transfer receipts………....…. 111.5
Current surplus of government
enterprises……………………...…. 9.5
Current expenditures…......…. 3,399.7
Consumption expenditures……...….. 1,717.1
Current transfer payments……....….. 1,332.9
Government social benefits…...…. 1,309.3
Other current transfer payments
to the rest of the world (net)....… 23.7
Interest payments…………………..... 303.0
Subsidies………………………….….. 46.7
Net government saving…........ –367.8
NIPA Underlying Interest EstimatesLess: Interest paid by government
enterprises reclassified ascorporations……………………...… 12.1
Less: Interest received bygovernment enterprisesreclassified as corporations…….... -0.3
NIPA Underlying Investment andInventory Estimates
Plus: Investment in defenseweapons systems reclassifiedas consumption………………….... 49.3
Less: Consumption of fixed capitalassociated with investment indefense weapons systems……..... 52.7
Less: Consumption reclassified asinventory change.……………....…. 1.1
and property income) less property income paid, “cur-rent taxes on wealth, income, etc.,” and other currenttransfers paid by corporations and by government en-terprises that are treated as corporations in the SNA.
The SNA concept of net disposable income is notused in the NIPA corporate sector accounts, but itsvalue for corporations is closely related to the NIPAmeasures of undistributed corporate profits. Becausecorporations and government enterprises do not havefinal consumption expenditures, net saving equals netdisposable income in the use of disposable income ac-count. Net disposable income and net saving measuresfor corporations in the distribution and use of dispos-able income accounts equal the measure of undistrib-uted corporate profits in NIPAs plus estimates of thecurrent surplus and net interest paid of governmententerprises that are treated as corporations in theSNA.11
General government. The relationships betweenthe measures in the distribution of income accountand the use of disposable income account and theNIPAs for government are complex, primarily due to
11. For estimates of undistributed corporate profits, see line 24 in NIPAtable 1.16.
the differences in the classification of governmentbusiness enterprises.
The grouping and the ordering of transactionsamong the three sets of measures also differs slightly(chart 3). For example, in the distribution of incomeaccount, “current taxes on income, wealth, etc., re-ceived” consists of the NIPA measures of personal cur-rent taxes, taxes on corporate income, and taxes fromthe rest of the world (black arrows).
The differences between the two sets of accountsalso reflect the differing treatment of governmentaltransactions, such as investment in defense weaponssystems and changes in the inventories of the Com-modity Credit Corporation. As a result of these differ-ences, final consumption expenditures in the use ofdisposable income account equal NIPA consumptionexpenditures, plus underlying NIPA measures of de-fense investment, less underlying NIPA measures ofthe consumption of fixed capital associated with in-vestment in defense weapons systems, less underlyingNIPA measures of the reclassified consumption associ-ated with the Commodity Credit Corporation and theStrategic Petroleum Reserve (dark blue arrows).
In addition, as a result of differences in the classifi-cation of government enterprises, in the distribution
December 2004 SURVEY OF CURRENT BUSINESS 27
Chart 4. Relationship Between NIPA Personal Income and Its Disposition and the SNA Distributionand Use of Disposable Income Accounts for Households and Nonprofit InstitutionsServing Households, 2003
NIPA Personal Income and its DispositionPersonal income……………....…… 9,161.8
Compensation ofof employees, received…..… 6,289.0
Proprietors' income with IVA 834.1and CCAdj………………..…..
Rental income with IVA and
CCAdj…………...….……..…. 153.8Personal income receipts on
assets…………...…......…….. 1,322.7Personal current transfer
receipts…………..………..…. 1,335.4Government social benefits
to persons……………...…. 1,306.4Other current transfer
receipts, from business
(net)……………………...… 28.9Less: Contributions for
government social insurance.... 773.2Less: Personal current taxes...…. 1,001.9Equals: Disposable personal
income………………………...….. 8,159.9Less: Personal outlays………....... 8,049.3
Personal consumption
expenditures………………….... 7,760.9Personal interest payments……... 185.3Personal current transfer
payments……………………..… 103.1Equals: Personal saving..……...... 110.6
SNA Distribution of Income AccountOperating surplus and mixed
income, net 1……………….………. 1,504.3Compensation of employees,
received………………………....….. 6,289.0Property income, paid…………...…… 766.1Property income, received……...…… 1,399.8Current taxes on income, wealth
etc., paid……………………...…..… 1,001.9Social contributions and social
benefits, other than socialtransfers in kind, paid…….......…… 773.2
Social contributions and socialbenefits, other than socialtransfers in kind, received…....…… 1,306.4
Other current transfers, paid……....… 115.8Other current transfers, received....… 28.9Net disposable income…................… 7,871.5
SNA Use of Disposable Income AccountFinal consumption expenditures.... 7,760.9Savings, net………………......…… 110.6
NIPA Interest EstimatesPlus: Monetary and imputed interest
paid by sole proprietorships,partnerships, other privatebusiness, and owner-occupiedhousing…………………………...…. 580.8
Plus: Monetary and imputed interestreceived by sole proprietorships,partnerships, nonprofitinstitutions, other privatebusiness, and owner-occupiedhousing…………………………....… 77.1
NIPA Underlying Business TransfersEstimates
Plus: Other current transfers paidby noncorporate business……...…. 12.7
1. Net operating surplus and mixed income is used in the calculation of net savings, but it is not included in the summary institutional sector accounts provided to the OECD.Net operating surplus and mixed income is equal to gross operating surplus and mixed income from the generation of income account less the consumption of fixed capital.NOTES. All estimates are derived from the 2004 annual NIPA revision. See also NIPA tables 2.1 and 7.11.IVA Inventory valuation adjustmentCCAdj Capital consumption adjustment
U.S. Bureau of Economic Analysis
of income account, “property income, paid” equalsNIPA interest payments less the estimate of interestpaid by reclassified government enterprises that un-derlies the NIPA measure (gray arrows). Similarly,“property income, received” equals NIPA income re-
ceipts on assets less an estimate of interest received byreclassified government enterprises that underlies theNIPA measures (light blue arrows).
These differences also result in a difference betweennet government saving in the NIPAs and in the SNA.
Table 5. Reconciliation of NIPA Net Government Saving With SNA General Government Saving[Billions of dollars]
2003
Net government saving, NIPAs ................................................................................................................................. –367.8Less: Shift of net savings of government enterprises from government to corporate sector....................................... 7.2
Current surplus.......................................................................................................................................................... 19.6Less: Net interest ...................................................................................................................................................... 12.4
Less: Shift of investment in defense weapons systems to final consumption expenditures ........................................ –3.4Gross investment ...................................................................................................................................................... 49.3Less: Consumption of fixed capital............................................................................................................................ 52.7
Plus: Shift of Commodity Credit Corporation and strategic oil reserves consumption to inventory investment........... 1.1Equals: Net general government saving, SNA........................................................................................................ –370.5

28 The NIPAs and the System of National Accounts December 2004
The total effect of these differences is not large, but netgovernment saving in the NIPAs is usually slightlysmaller than net general government saving in the useof disposable income account because of the treatmentof investment in defense weapons systems as final con-sumption (chart 3 and table 5).
Households and NPISHs. The differences betweenthe NIPA estimates for the personal sector and the esti-mates in the SNA distribution of income account andthe use of disposable income account for householdsand NPISHs are mainly due to the definitions of sec-tors and the grouping of transactions in the sets of ac-counts (chart 4).
In the NIPAs, personal current taxes are subtractedfrom personal income to obtain the NIPA measure ofdisposable personal income. The broad concept ofpersonal outlays, which consists of the sum of personalconsumption expenditures, interest payments, andcurrent transfer payments are then subtracted to ob-tain the NIPA estimate of personal saving. In thedistribution of income account, income payments (ex-cluding final consumption expenditures) and receiptsare alternatively added or subtracted from net oper-ating surplus to obtain a measure of net disposableincome.
Disposable personal income includes personal in-terest payments and personal current transfer pay-ments that are removed from net operating surplus inthe derivation of net disposable income in the distri-bution of income account.
In addition, in the NIPAs, the measures for the per-sonal sector only include the nonbusiness transactionsof households and NPISHs. The measures in the SNAdistribution of income account and the use of dispos-able income account also include the transactions ofNIPA noncorporate businesses, such as proprietor-ships and partnerships, that are classified in the NIPAsas “other private business.”
Finally, the SNA concept of net operating surplusand mixed income is broad and includes not only pro-prietors’ income and rental income, but also includesnet interest, rent and royalties, and current transferpayments. As a result, these last three types of transac-tions are also included in the measures of “property in-come, paid,” “property income, received,” and “othercurrent transfers, paid” in the distribution of incomeaccount.
The effects of these differences on the sets of ac-counts can be seen in three places (chart 4). First, inthe distribution of income account, “property income,paid” equals the personal interest payments in theNIPAs plus the monetary and imputed interest paid bysole proprietorships, partnerships, other private busi-
ness, and owner-occupied housing (black arrows). Sec-ond, “property income, received” equals personalincome receipts on assets in the NIPAs plus the mone-tary and imputed interest received (blue arrows).Third, “other current transfers, paid” equals NIPA per-sonal current transfer payments plus “other currenttransfers paid by noncorporate business” (gray ar-rows).
These differences do not result in differences be-tween the net saving measures among the sets of ac-counts, because the transactions in the SNA-basedmeasures of “property income, received,” “property in-come, paid,” and “other transfers, paid” that are notincluded in the NIPA personal sector measures areincluded in “net operating surplus and mixed in-come” and net against one another in the derivationof net saving.12
Capital accountThe capital account shows the relationship of net sav-ing in the distribution of income account for each sec-tor to the acquisition of nonfinancial assets. In thecapital account, net lending or net borrowing equalsnet saving plus capital transfers less net capital forma-tion and acquisition less disposal of nonfinancial, non-produced assets.
The relationships between the SNA capital accountand the NIPAs are generally not as strong as the rela-tionships with the other accounts, because the invest-ment section in the NIPA account is not classified bysector. However, capital account measures are esti-mated for each of the SNA sectors in order to preparethe SNA-based estimates. Thus, the relationship be-tween the SNA capital account estimates for the totaleconomy and the related NIPA estimates are discussed,and the relationship of the estimates for each sector issummarized.
Total economy. The measures in the SNA capital ac-count for the total economy are similar to the measuresin the NIPAs. However, the concepts used in the twosets of accounts differ.
Two minor differences relate to the netting of trans-actions against one another. “Capital transfers, paid”and “capital transfers, received” in the SNA accountare netted against each other in the NIPA “capital ac-count transactions (net)” (chart 5, black arrows). Inaddition, “changes in inventories” are shown in thecapital account but not in the NIPA saving and invest-
12. Exceptions occur in years when wage accruals less disbursement(WALD) are not equal to zero. In these cases, net saving in the use ofincome accounts equals personal saving plus WALD because WALD isincluded in the compensation estimates in the distribution of incomeaccount, but not in NIPA table 2.1.

December 2004 SURVEY OF CURRENT BUSINESS 29
U.S. Bureau of Economic Analysis
NOTE. All estimates are derived from the 2004 annual NIPA revision. See also NIPA table 5.1.
Chart 5. Relationship Between NIPA Savings and Investment and the SNA Capital Accountsfor the Total Economy, 2003
NIPA Saving and InvestmentGross saving…………...…..….. 1,487.7
Net saving……………………..…..…. 133.8Consumption of fixed capital.....…. 1,353.9
Gross domesticinvestment, capitalaccount transactions,and net lending, NIPAs....… 1,513.3
Gross domestic investment……….... 2,024.2
Capital account transactions (net).… 3.1
Net lending or net borrowing (–),
NIPAs……………………………..... –514.0Statistical discrepancy……..... 25.6
SNA Capital AccountSavings, net………………………… 138.3
Capital transfers, paid……………… 47.5
Capital transfers, received………… 44.4
Gross capital formation……………. 1,976.0
Gross fixed capital formation…… 1,976.2
Changes in inventories…………. –0.1
Consumption of fixed capital……… 1,301.2
Net lending/net borrowing…………. –539.7
NIPA Underlying Investment andInventory Estimates
Less: Investment in defense
weapons systems………………..... 49.3
Less: Consumption of fixed capital
associated with defense
weapons systems…………….....… 52.7
Plus: Consumption reclassified as
inventory change.……………....…. 1.1
ment account; NIPA “change in inventories” is in-cluded in gross domestic investment.
In addition, the sets of estimates differ because ofthe treatment of investment in defense weapons systemand the treatment of the changes in the inventories ofthe Commodity Credit Corporation and the StrategicPetroleum Reserve. As a result of these differences,gross capital formation in the capital account equalsgross domestic investment in the NIPAs less invest-ment in defense weapons systems plus consumptionthat is reclassified as inventory change (gray arrows).In addition, the consumption of fixed capital in thecapital account equals the consumption of fixed capitalin the NIPAs less the consumption of fixed capital as-sociated with investment in defense weapons systemthat is classified as final consumption in the SNA (darkblue arrows).
Net saving and net investment (gross capital forma-tion less the consumption of fixed capital) differ fromtheir related NIPA-based measures by the sameamount. As a result, the net lending or net borrowingmeasures only differ by the statistical discrepancy(light blue arrows).
Sectors. The measures in the capital account foreach economic sector have no corresponding measuresin the NIPAs, but BEA’s accounts for fixed assets andconsumer durable goods provide estimates of invest-ment by legal form of organization that are used as thebasis for the estimates by institutional sector. The mea-sures in the SNA-based capital account for each sectorare consistent with the definition of sectors that areused in the other SNA-based accounts (tables 6, 7, and8). In addition, the estimates for the government sec-tor are consistent with the SNA treatment of invest-ment in defense weapons systems and the SNA-baseddefinition of changes in inventories (table 7). The mea-sures of the “acquisitions less nonfinancial, nonpro-
duced assets” for corporations (table 6) and forhouseholds and NPISHs (table 8) offset these estimatesfor general government (table 7).
The Revision of the SNAIn 2002, BEA and the Australian Bureau of Statisticspresented papers at the London meeting of the Inter-national Association for Official Statistics that recom-mended a consolidated review of the SNA.13 At aboutthe same time, there was increased international inter-est in challenges in applying the SNA in a changingeconomic environment. As a result, in March 2003, theUnited Nations Statistical Commission endorsed a re-view of the SNA, which would be associated with re-views of related guidelines, such as those in the Balanceof Payments Manual from the International MonetaryFund, in order to maintain their consistency. TheCommission supported several criteria to be consid-ered in updating the SNA:
● New issues that are emerging in the new economicenvironment,
● Old issues that may need further review because ofan increase in economic significance or that mayqualify for a different treatment as a result ofadvances in methodological research,
● Changes in users’ needs, and● The feasibility of implementation.
The Inter-Secretariat Working Group on NationalAccounts is the group directly responsible for updatingand maintaining the SNA; it consists of members fromthe Statistical Office of the European Communities,the International Monetary Fund, the OECD, the
13. See Brent R. Moulton, “The System of National Accounts for the NewEconomy: What Should Change?” Review of Income and Wealth 50 (June2004): 261–278, and Rob Edwards, Peter Comisari, and Tony Johnson,“Beyond 1993: The System of National Accounts and the New Economy”(paper presented at the International Association for Official Statistics,London, August 27–29, 2002).

30 The NIPAs and the System of National Accounts December 2004
United Nations, and the World Bank. The WorkingGroup has also organized an Advisory Expert Groupthat consists of national accounting experts from 20countries. The Working Group and the Advisory Ex-pert Group are responsible for preparing the final rec-ommendations for revisions to the SNA; the targetdate for approval by the Statistical Commission andfor publication is 2008.
The work of researching and developing proposalshas been assigned to several expert groups, to elec-tronic discussion groups, and to workshops. BEA isparticipating in the three major expert groups, whichare the Canberra II Group on Non-financial Assets,
the Balance of Payments Committee, and the TaskForce on Harmonization of Public Sector Accounting.
Among the proposed changes are the following:● Investment in defense weapons systems would be
treated as investment in fixed assets if the systemsare used to provide defense services, such as protec-tion and deterrence, for more than 1 year. BEAalready treats investment in defense weapons sys-tems as investment in fixed assets.
● The measure of the output of property and casualtyinsurance would be based on normal claims ratherthan on actual claims so that the large swings inmeasured insurance output as a result of major
Table 6. SNA Capital Account for Corporations Derived From the NIPAs[Billions of dollars]
SNA series 2003 NIPA series
Savings, net ............................................ 398.1 Undistributed corporate profits (table 1.16, line 24), plus current surplus of Federal Government enterprises (table 3.2, line 18), plus current surplus of state and local government enterprises (table 3.3, part of line 20) reclassified into the SNA corporate sector, plus net interest of Federal Government enterprises and state and local government enterprises (table 7.11, part of line 100) reclassified into the SNA corporate sector.
Capital transfers, received ...................... 0.1 Investment grants to business (table 5.10, line 7).
Gross capital formation........................... 897.1 Sum of gross fixed capital formation and changes in inventories (as defined below).
Gross fixed capital formation.............. 899.0 Gross private domestic fixed investment of domestic corporate business (table 5.1, part of line 22), Federal Government enterprises (table 5.8.5B, line 58), and state and local enterprises (table 5.7.5B, part of line 61) reclassified into the SNA corporate sector.
Changes in inventories......................... –1.9 Change in inventories of domestic corporate business (table 5.2.5, part of line 22).
Consumption of fixed capital ................ 797.5 Consumption of fixed capital of domestic corporate business (table 7.5, line 4), plus consumption of fixed capital of Federal Government enterprises (table 7.5, line 26), plus consumption of fixed capital of state and local government enterprises (table 7.5, part of line 27) reclassified into the SNA corporate sector.
Acquisitions less disposals of non-financial nonproduced assets ............ –7.0 Land and spectrum rights sold to or purchased from general
government by domestic corporate business, plus outer continental shelf, land, and oil bonuses received by domestic corporate business from general government (table 3.1, part of line 37 with the sign reversed to indicate receipt rather than payment).
Net lending/net borrowing....................... 305.7 Net lending or borrowing of domestic corporate business, Federal Government enterprises, and state and local enterprises (table 5.1, part of line 25) reclassified into the SNA corporate sector.
December 2004 SURVEY OF CURRENT BUSINESS 31
disasters, such as hurricanes and earthquakes,would be eliminated. BEA has already implementedthis new measure as part of the 2003 comprehensiveNIPA revision.
● Employee stock options would be included in com-pensation, would be recorded at vesting date orspread across the period from grant date to vesting
date, and would be valued at market price or at fairvalue using a suitable pricing model. In the NIPAs,employee stock options are currently included incompensation at exercise date, reflecting the valueat exercise.
● Research and development would be capitalized andtreated as part of fixed capital formation.
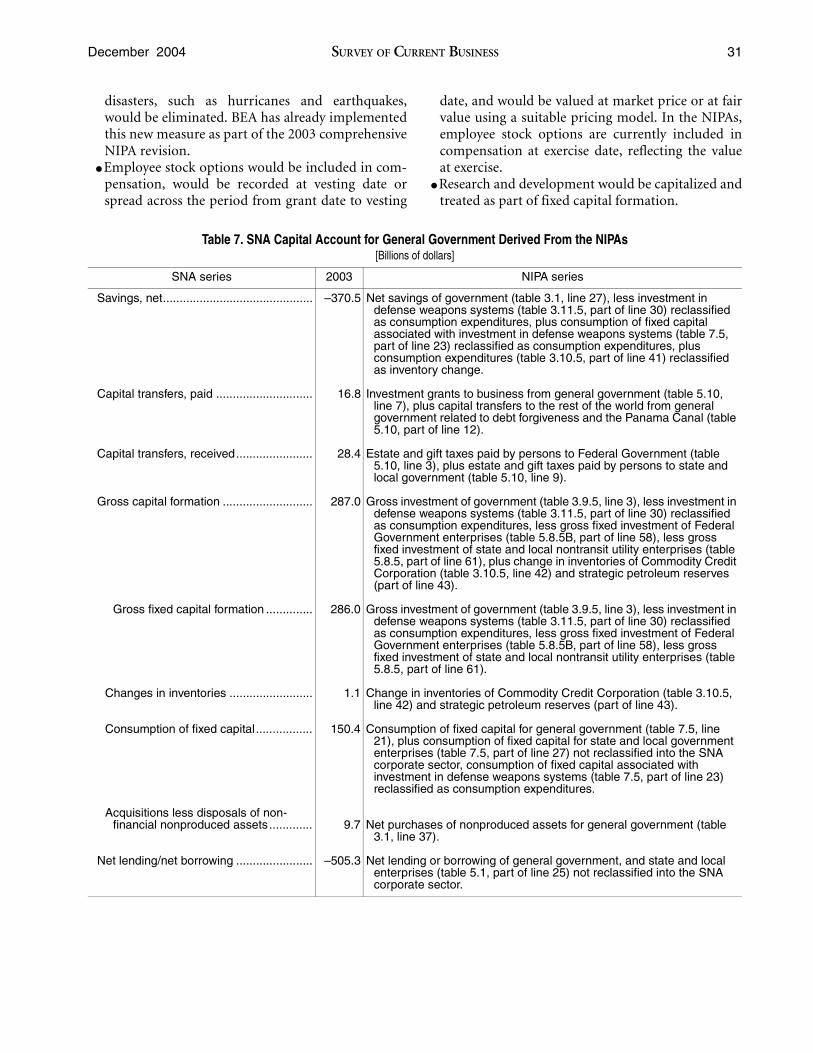
Table 7. SNA Capital Account for General Government Derived From the NIPAs[Billions of dollars]
SNA series 2003 NIPA series
Savings, net............................................. –370.5 Net savings of government (table 3.1, line 27), less investment in defense weapons systems (table 3.11.5, part of line 30) reclassified as consumption expenditures, plus consumption of fixed capital associated with investment in defense weapons systems (table 7.5, part of line 23) reclassified as consumption expenditures, plus consumption expenditures (table 3.10.5, part of line 41) reclassified as inventory change.
Capital transfers, paid ............................. 16.8 Investment grants to business from general government (table 5.10, line 7), plus capital transfers to the rest of the world from general government related to debt forgiveness and the Panama Canal (table 5.10, part of line 12).
Capital transfers, received....................... 28.4 Estate and gift taxes paid by persons to Federal Government (table 5.10, line 3), plus estate and gift taxes paid by persons to state and local government (table 5.10, line 9).
Gross capital formation ........................... 287.0 Gross investment of government (table 3.9.5, line 3), less investment in defense weapons systems (table 3.11.5, part of line 30) reclassified as consumption expenditures, less gross fixed investment of Federal Government enterprises (table 5.8.5B, part of line 58), less gross fixed investment of state and local nontransit utility enterprises (table 5.8.5, part of line 61), plus change in inventories of Commodity Credit Corporation (table 3.10.5, line 42) and strategic petroleum reserves (part of line 43).
Gross fixed capital formation .............. 286.0 Gross investment of government (table 3.9.5, line 3), less investment in defense weapons systems (table 3.11.5, part of line 30) reclassified as consumption expenditures, less gross fixed investment of Federal Government enterprises (table 5.8.5B, part of line 58), less gross fixed investment of state and local nontransit utility enterprises (table 5.8.5, part of line 61).
Changes in inventories ......................... 1.1 Change in inventories of Commodity Credit Corporation (table 3.10.5, line 42) and strategic petroleum reserves (part of line 43).
Consumption of fixed capital................. 150.4 Consumption of fixed capital for general government (table 7.5, line 21), plus consumption of fixed capital for state and local government enterprises (table 7.5, part of line 27) not reclassified into the SNA corporate sector, consumption of fixed capital associated with investment in defense weapons systems (table 7.5, part of line 23) reclassified as consumption expenditures.
Acquisitions less disposals of non-financial nonproduced assets............. 9.7 Net purchases of nonproduced assets for general government (table
3.1, line 37).
Net lending/net borrowing ....................... –505.3 Net lending or borrowing of general government, and state and local enterprises (table 5.1, part of line 25) not reclassified into the SNA corporate sector.
32 The NIPAs and the System of National Accounts December 2004
● Capital services would be included in the produc-tion account for countries that can develop a mea-sure of capital services inputs.
● A net return to government-owned fixed assetswould be recognized.
● Actuarial valuations would be used to determine theliability and to allocate the net worth of employer-provided defined benefit pension plans between theemployer and the employees.
● Recommendations are being developed regardingloan guarantees, contingent assets and liabilities,and certain intangible assets such as licenses and
leases.The various expert groups are preparing these pro-
posals, which will be reviewed and accepted or rejectedby the Advisory Expert Group.
The SNA revision process is transparent; the expertgroups welcome input and feedback from data users.Detailed information on the revision is available atthe United Nations’ Web site <unstats.un.org/unsd/nationalaccount/snarev1.htm>.
BEA also welcomes feedback from data users in theUnited States; e-mail Brent R. Moulton ([email protected]).
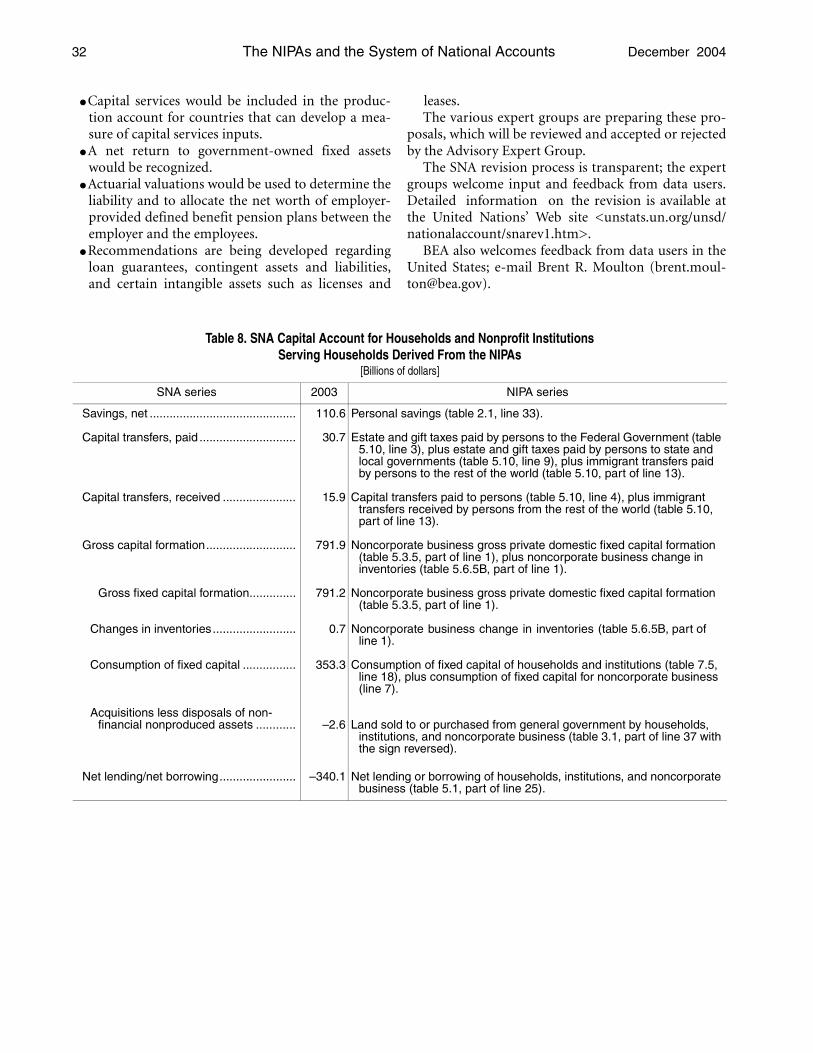
Table 8. SNA Capital Account for Households and Nonprofit Institutions Serving Households Derived From the NIPAs
[Billions of dollars]
SNA series 2003 NIPA series
Savings, net ............................................ 110.6 Personal savings (table 2.1, line 33).
Capital transfers, paid ............................. 30.7 Estate and gift taxes paid by persons to the Federal Government (table 5.10, line 3), plus estate and gift taxes paid by persons to state and local governments (table 5.10, line 9), plus immigrant transfers paid by persons to the rest of the world (table 5.10, part of line 13).
Capital transfers, received ...................... 15.9 Capital transfers paid to persons (table 5.10, line 4), plus immigrant transfers received by persons from the rest of the world (table 5.10, part of line 13).
Gross capital formation........................... 791.9 Noncorporate business gross private domestic fixed capital formation (table 5.3.5, part of line 1), plus noncorporate business change in inventories (table 5.6.5B, part of line 1).
Gross fixed capital formation.............. 791.2 Noncorporate business gross private domestic fixed capital formation (table 5.3.5, part of line 1).
Changes in inventories......................... 0.7 Noncorporate business change in inventories (table 5.6.5B, part of line 1).
Consumption of fixed capital ................ 353.3 Consumption of fixed capital of households and institutions (table 7.5, line 18), plus consumption of fixed capital for noncorporate business (line 7).
Acquisitions less disposals of non-financial nonproduced assets ............ –2.6 Land sold to or purchased from general government by households,
institutions, and noncorporate business (table 3.1, part of line 37 with the sign reversed).
Net lending/net borrowing....................... –340.1 Net lending or borrowing of households, institutions, and noncorporate business (table 5.1, part of line 25).