the nielsen total audience report - s1.q4cdn.com · the nielsen total audience report – 2 2016 1...
TRANSCRIPT
1Copyright © 2016 The Nielsen Company THE NIELSEN TOTAL AUDIENCE REPORT | Q2 2016THE NIELSEN TOTAL AUDIENCE SERIES | Q2 2016
THENIELSENTOTALAUDIENCEREPORT Q2 2016
2 Copyright © 2016 The Nielsen Company
The Nielsen Total Audience Report (and its companion report, the Nielsen Comparable Metrics Report) are designed to enable the industry to track changes in media usage. We have consistently reported that overall usage has increased– that a major effect of new devices and services is additive to consumer’s total time spent with media. We have also shown how usage of individual devices and platforms has changed over time as the media landscape continues to evolve.
Analysts of media consumption often talk about change in the ecosystem as “fragmentation” – competition for the consumer’s time and attention that has caused large portions of consumption to break into smaller ones. Typically, this topic is discussed in terms of time on one platform versus time on another.
However, in this iteration of the Nielsen Total Audience Report, we focused on the media channel choices within the many different platforms consumers have at their disposal and the amount they routinely turn to.
Nielsen’s research has consistently demonstrated that viewers watch a relatively small percent of the television networks available to them, but that over the years, both channels available and channels viewed have increased. However, we now find that channels receivable has started to decrease somewhat, as a result of lower multichannel penetration and cord-shaving. We also see that the number of different channels viewed is also lower, though by a very small amount – just one less channel over two years for the average adult TV viewer. To ensure consistency, we focused on the NPM panel for these comparisons.
In general, the more time spent watching TV, the more different channels viewed– this is a consistent finding across various race and origin groups as well as different age groups. As TV viewing levels go down, we would expect consumers to watch fewer channels, but we should be cautious in making assumptions about causes. For example, adults in homes with Subscription Video on Demand access watch fewer TV channels than the average, and while this is partly due to increased device usage in SVOD homes, we also note that those with SVOD access are generally younger and more affluent, and these both cause lower TV viewing.
It would be incorrect simply to characterize these shifts as a result of “new media” encroaching on “traditional media.” We found that for radio, the number of average stations tuned has increased slightly as listeners gain access to more choices on the AM/FM dial.
We also see shifts within digital platforms: PC users are visiting fewer sites, while smartphones are showing an increase in sites visited. In fact, these are near mirrors of one another, with the average adult going to 7.4 fewer sites on the PC and 7.5 more sites on the smartphone over the past two years.
In the standard exhibits and tables at the back of the report, you will note a substantial increase in smartphone usage – up 34 minutes per day among US adults. Part of this is due to a panel enhancement: In March 2016, a legacy crediting rule that capped usage on iOS devices at 30 minutes was removed, so that if panelists with these devices use an app or visit a website for more than 30 minutes, all that usage is now credited. However, we estimate that usage would have been up 42% even without this methodological change. Please note that a similar change in crediting went into effect for Android devices in August 2016 and this will be reflected in the next Nielsen Total Audience Report.
GLENN ENOCH
SVP AUDIENCE INSIGHTS
NIELSEN
G L E N N
3Copyright © 2016 The Nielsen Company THE NIELSEN TOTAL AUDIENCE REPORT | Q2 2016
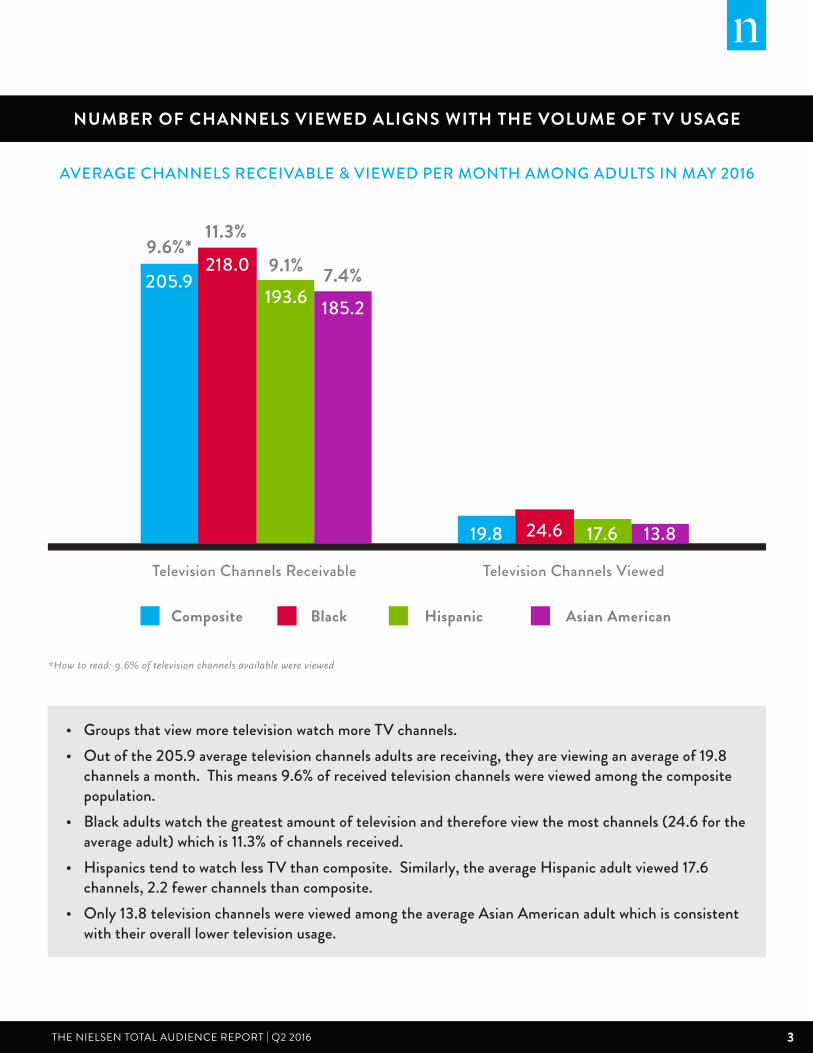
NUMBER OF CHANNELS VIEWED ALIGNS WITH THE VOLUME OF TV USAGE
• Groups that view more television watch more TV channels.• Out of the 205.9 average television channels adults are receiving, they are viewing an average of 19.8
channels a month. This means 9.6% of received television channels were viewed among the composite population.
• Black adults watch the greatest amount of television and therefore view the most channels (24.6 for the average adult) which is 11.3% of channels received.
• Hispanics tend to watch less TV than composite. Similarly, the average Hispanic adult viewed 17.6 channels, 2.2 fewer channels than composite.
• Only 13.8 television channels were viewed among the average Asian American adult which is consistent with their overall lower television usage.
AVERAGE CHANNELS RECEIVABLE & VIEWED PER MONTH AMONG ADULTS IN MAY 2016
*How to read: 9.6% of television channels available were viewed
Composite Black Hispanic Asian American
Television Channels Receivable Television Channels Viewed
205.9
9.6%*11.3%
9.1% 7.4%218.0193.6 185.2
19.8 24.6 17.6 13.8
4 Copyright © 2016 The Nielsen Company
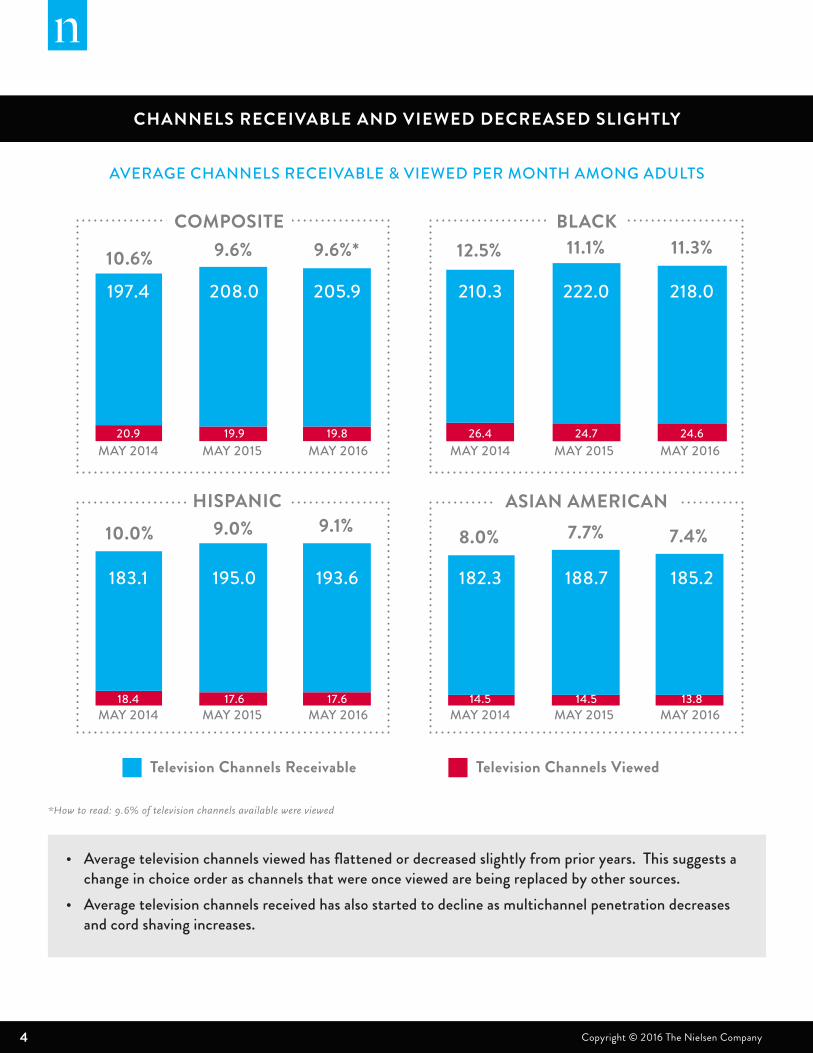
CHANNELS RECEIVABLE AND VIEWED DECREASED SLIGHTLY
• Average television channels viewed has flattened or decreased slightly from prior years. This suggests a change in choice order as channels that were once viewed are being replaced by other sources.
• Average television channels received has also started to decline as multichannel penetration decreases and cord shaving increases.
AVERAGE CHANNELS RECEIVABLE & VIEWED PER MONTH AMONG ADULTS
Television Channels Receivable Television Channels Viewed
10.0% 9.0% 9.1%
MAY 2014 MAY 2015 MAY 2016
183.1
18.4
195.0
17.6
193.6
17.6
HISPANIC
8.0% 7.7% 7.4%
MAY 2014 MAY 2015 MAY 2016
182.3
14.5
188.7
14.5
185.2
13.8
ASIAN AMERICAN
12.5% 11.1% 11.3%
MAY 2014 MAY 2015 MAY 2016
210.3
26.4
222.0
24.7
218.0
24.6
BLACK
*How to read: 9.6% of television channels available were viewed
10.6% 9.6% 9.6%*
MAY 2014 MAY 2015 MAY 2016
197.4
20.9
208.0
19.9
205.9
19.8
COMPOSITE
5Copyright © 2016 The Nielsen Company THE NIELSEN TOTAL AUDIENCE REPORT | Q2 2016
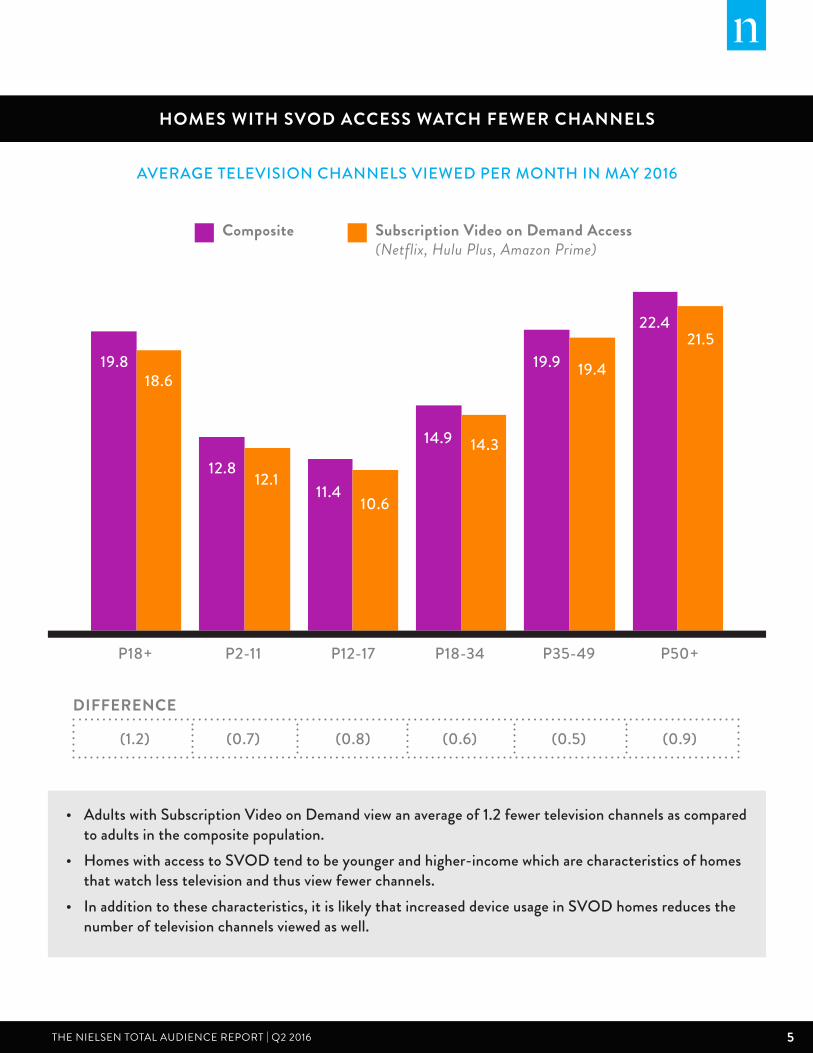
CHANNELS RECEIVABLE AND VIEWED DECREASED SLIGHTLY HOMES WITH SVOD ACCESS WATCH FEWER CHANNELS
Composite Subscription Video on Demand Access(Netflix, Hulu Plus, Amazon Prime)
• Adults with Subscription Video on Demand view an average of 1.2 fewer television channels as compared to adults in the composite population.
• Homes with access to SVOD tend to be younger and higher-income which are characteristics of homes that watch less television and thus view fewer channels.
• In addition to these characteristics, it is likely that increased device usage in SVOD homes reduces the number of television channels viewed as well.
AVERAGE TELEVISION CHANNELS VIEWED PER MONTH IN MAY 2016
19.8
12.8
18.6
12.111.4
10.6
14.9 14.3
19.9 19.4
22.421.5
P18+ P2-11 P12-17 P18-34 P35-49 P50+
(1.2) (0.7) (0.8) (0.6) (0.5) (0.9)
DIFFERENCE
6 Copyright © 2016 The Nielsen Company
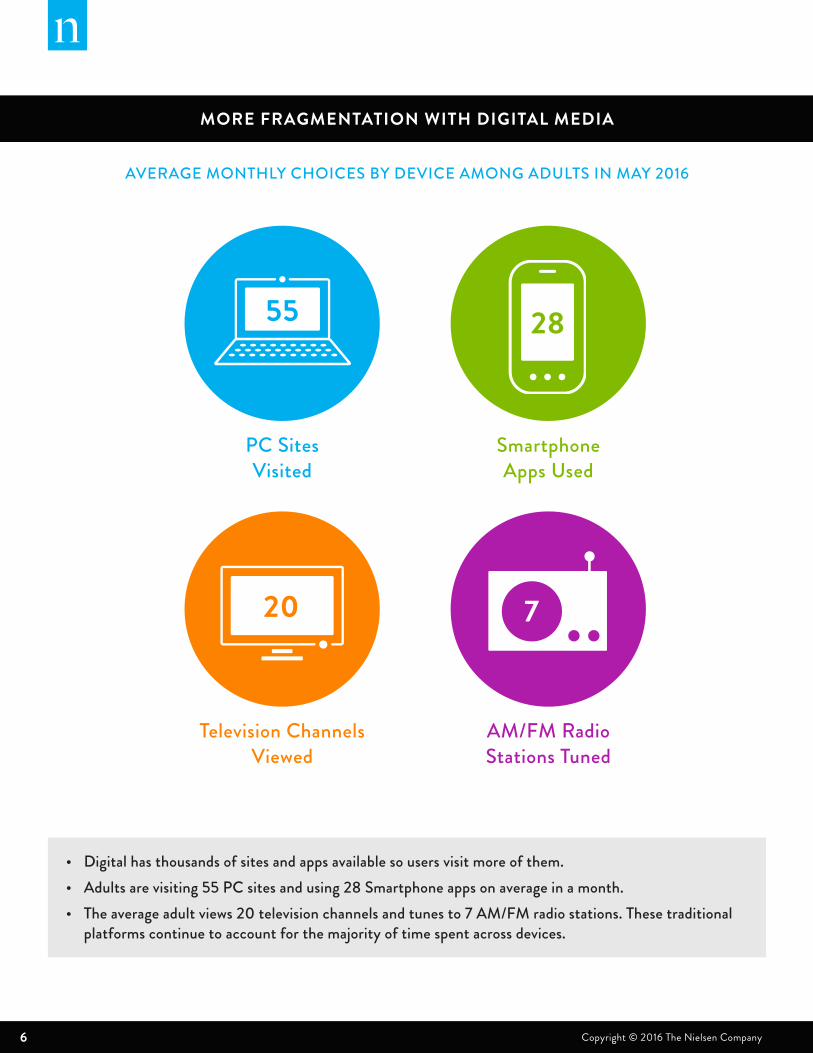
MORE FRAGMENTATION WITH DIGITAL MEDIA
PC Sites Visited
Television Channels Viewed
Smartphone Apps Used
AM/FM RadioStations Tuned
• Digital has thousands of sites and apps available so users visit more of them. • Adults are visiting 55 PC sites and using 28 Smartphone apps on average in a month. • The average adult views 20 television channels and tunes to 7 AM/FM radio stations. These traditional
platforms continue to account for the majority of time spent across devices.
AVERAGE MONTHLY CHOICES BY DEVICE AMONG ADULTS IN MAY 2016
55
720
28
7Copyright © 2016 The Nielsen Company THE NIELSEN TOTAL AUDIENCE REPORT | Q2 2016
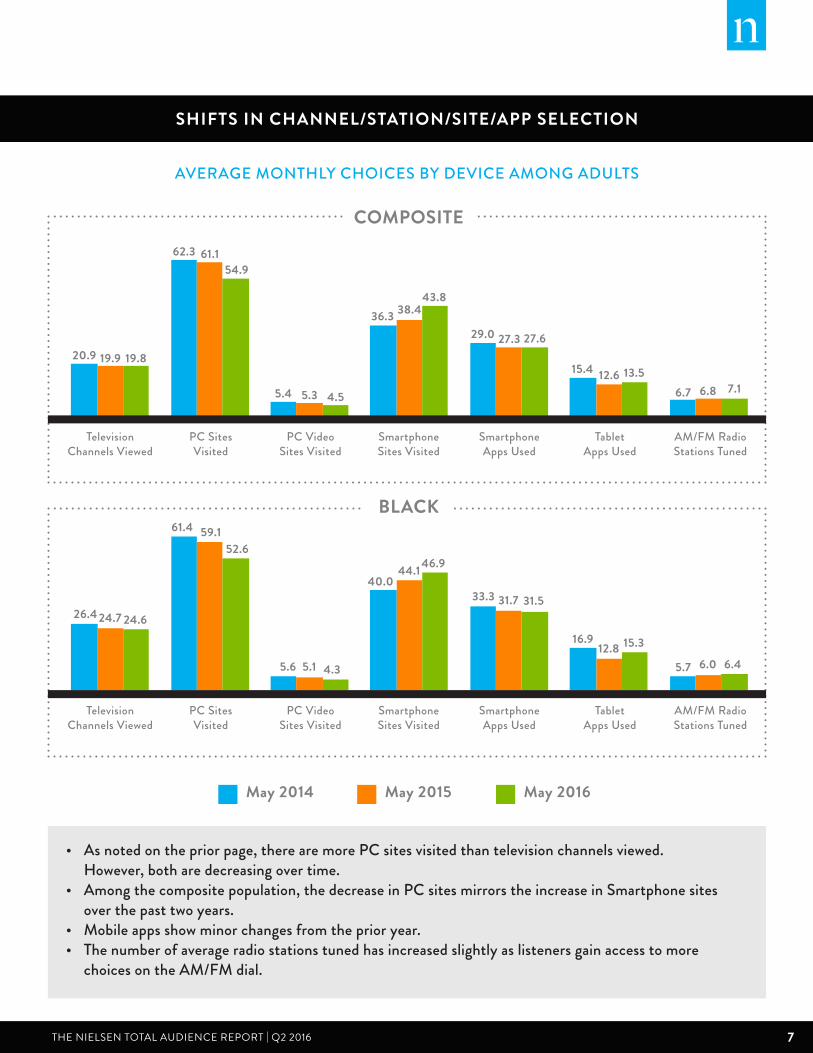
MORE FRAGMENTATION WITH DIGITAL MEDIA SHIFTS IN CHANNEL/STATION/SITE/APP SELECTION
• As noted on the prior page, there are more PC sites visited than television channels viewed. However, both are decreasing over time.
• Among the composite population, the decrease in PC sites mirrors the increase in Smartphone sites over the past two years.
• Mobile apps show minor changes from the prior year.• The number of average radio stations tuned has increased slightly as listeners gain access to more
choices on the AM/FM dial.
AVERAGE MONTHLY CHOICES BY DEVICE AMONG ADULTS
May 2014 May 2015 May 2016
TelevisionChannels Viewed
PC Video Sites Visited
Smartphone Sites Visited
Smartphone Apps Used
Tablet Apps Used
AM/FM Radio Stations Tuned
PC Sites Visited
20.9
62.3 61.154.9
5.4 5.3 4.5
36.3 38.443.8
29.0 27.3 27.6
15.4 12.6 13.56.7 6.8 7.1
19.9 19.8
COMPOSITE
BLACK
TelevisionChannels Viewed
PC Video Sites Visited
Smartphone Sites Visited
Smartphone Apps Used
Tablet Apps Used
AM/FM Radio Stations Tuned
PC Sites Visited
26.4
61.4 59.152.6
5.6 5.1 4.3
40.044.1 46.9
33.3 31.7 31.5
16.912.8 15.3
5.7 6.0 6.4
24.7 24.6
8 Copyright © 2016 The Nielsen Company
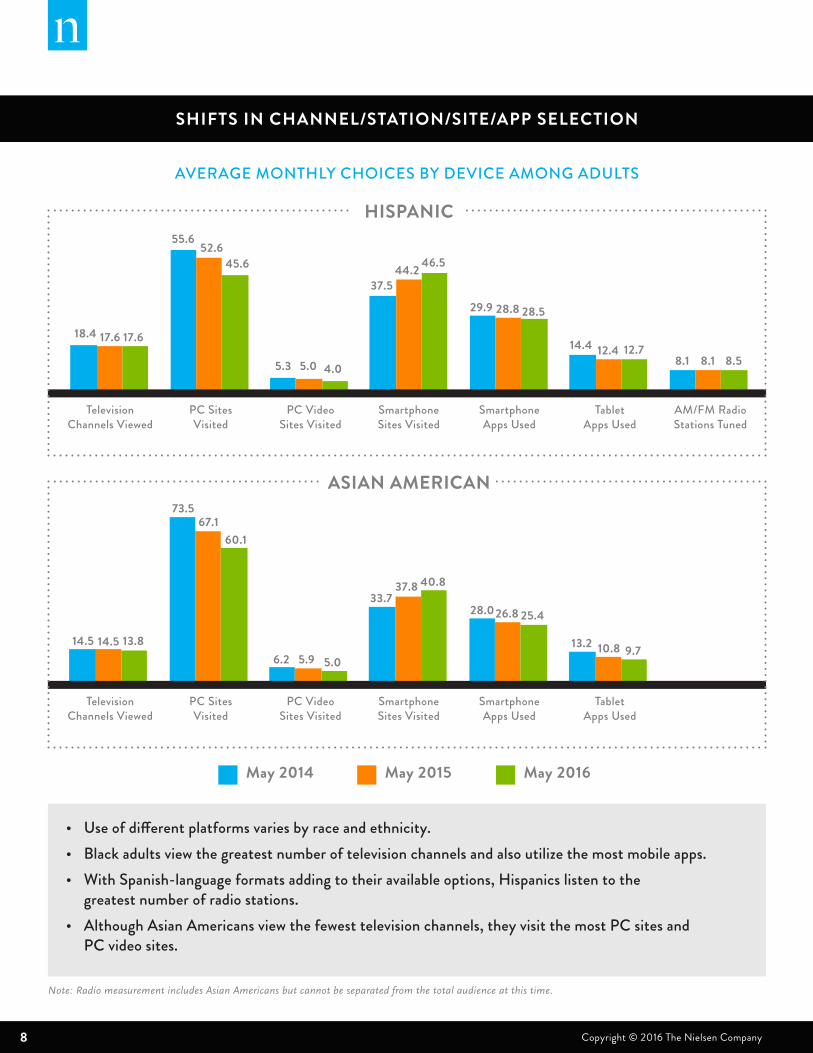
SHIFTS IN CHANNEL/STATION/SITE/APP SELECTION
• Use of different platforms varies by race and ethnicity. • Black adults view the greatest number of television channels and also utilize the most mobile apps. • With Spanish-language formats adding to their available options, Hispanics listen to the
greatest number of radio stations. • Although Asian Americans view the fewest television channels, they visit the most PC sites and
PC video sites.
AVERAGE MONTHLY CHOICES BY DEVICE AMONG ADULTS
May 2014 May 2015 May 2016
TelevisionChannels Viewed
PC Video Sites Visited
Smartphone Sites Visited
Smartphone Apps Used
Tablet Apps Used
PC Sites Visited
14.5
73.567.1
60.1
6.2 5.9 5.0
33.737.8 40.8
28.026.8 25.4
13.2 10.8 9.714.5 13.8
ASIAN AMERICAN
Note: Radio measurement includes Asian Americans but cannot be separated from the total audience at this time.
TelevisionChannels Viewed
PC Video Sites Visited
Smartphone Sites Visited
Smartphone Apps Used
Tablet Apps Used
AM/FM Radio Stations Tuned
PC Sites Visited
18.4
55.652.6
45.6
5.3 5.0 4.0
37.544.2 46.5
29.9 28.8 28.5
14.4 12.4 12.78.1 8.1 8.5
17.6 17.6
HISPANIC
9Copyright © 2016 The Nielsen Company THE NIELSEN TOTAL AUDIENCE REPORT | Q2 2016
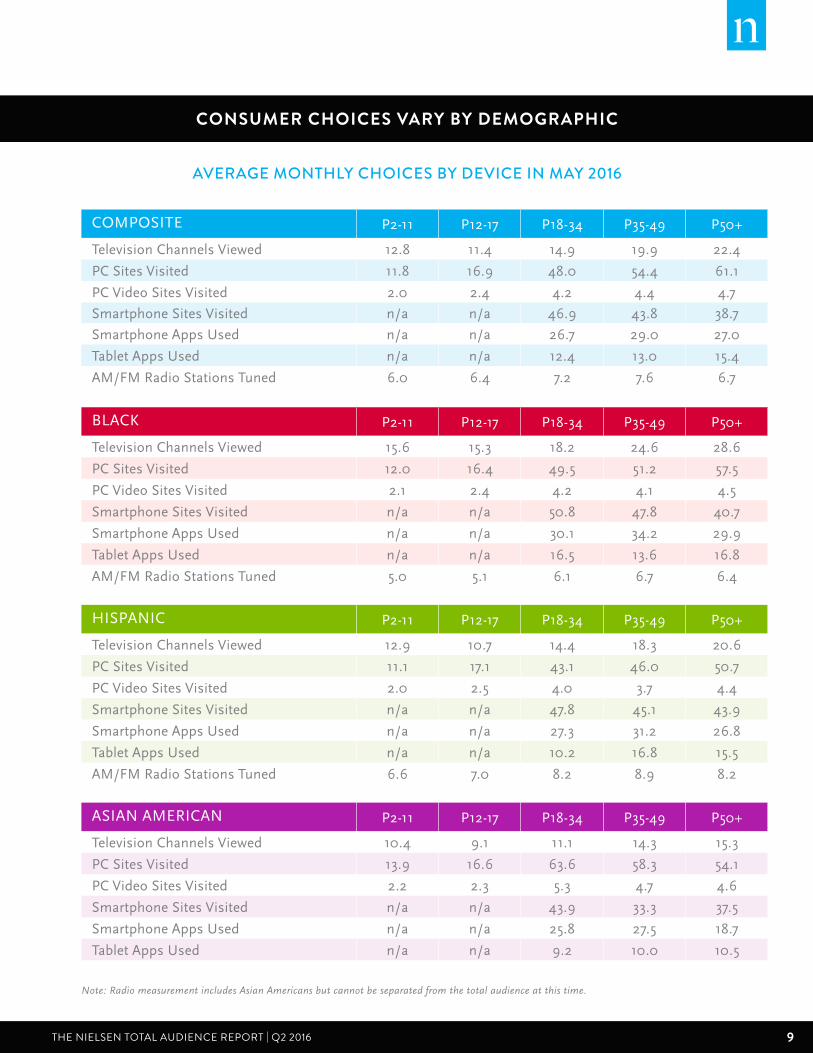
SHIFTS IN CHANNEL/STATION/SITE/APP SELECTION CONSUMER CHOICES VARY BY DEMOGRAPHIC
AVERAGE MONTHLY CHOICES BY DEVICE IN MAY 2016
COMPOSITE P2-11 P12-17 P18-34 P35-49 P50+
Television Channels Viewed 12.8 11.4 14.9 19.9 22.4
PC Sites Visited 11.8 16.9 48.0 54.4 61.1
PC Video Sites Visited 2.0 2.4 4.2 4.4 4.7
Smartphone Sites Visited n/a n/a 46.9 43.8 38.7
Smartphone Apps Used n/a n/a 26.7 29.0 27.0
Tablet Apps Used n/a n/a 12.4 13.0 15.4
AM/FM Radio Stations Tuned 6.0 6.4 7.2 7.6 6.7
BLACK P2-11 P12-17 P18-34 P35-49 P50+
Television Channels Viewed 15.6 15.3 18.2 24.6 28.6
PC Sites Visited 12.0 16.4 49.5 51.2 57.5
PC Video Sites Visited 2.1 2.4 4.2 4.1 4.5
Smartphone Sites Visited n/a n/a 50.8 47.8 40.7
Smartphone Apps Used n/a n/a 30.1 34.2 29.9
Tablet Apps Used n/a n/a 16.5 13.6 16.8
AM/FM Radio Stations Tuned 5.0 5.1 6.1 6.7 6.4
HISPANIC P2-11 P12-17 P18-34 P35-49 P50+
Television Channels Viewed 12.9 10.7 14.4 18.3 20.6
PC Sites Visited 11.1 17.1 43.1 46.0 50.7
PC Video Sites Visited 2.0 2.5 4.0 3.7 4.4
Smartphone Sites Visited n/a n/a 47.8 45.1 43.9
Smartphone Apps Used n/a n/a 27.3 31.2 26.8
Tablet Apps Used n/a n/a 10.2 16.8 15.5
AM/FM Radio Stations Tuned 6.6 7.0 8.2 8.9 8.2
ASIAN AMERICAN P2-11 P12-17 P18-34 P35-49 P50+
Television Channels Viewed 10.4 9.1 11.1 14.3 15.3
PC Sites Visited 13.9 16.6 63.6 58.3 54.1
PC Video Sites Visited 2.2 2.3 5.3 4.7 4.6
Smartphone Sites Visited n/a n/a 43.9 33.3 37.5
Smartphone Apps Used n/a n/a 25.8 27.5 18.7
Tablet Apps Used n/a n/a 9.2 10.0 10.5
Note: Radio measurement includes Asian Americans but cannot be separated from the total audience at this time.
10 Copyright © 2016 The Nielsen Company
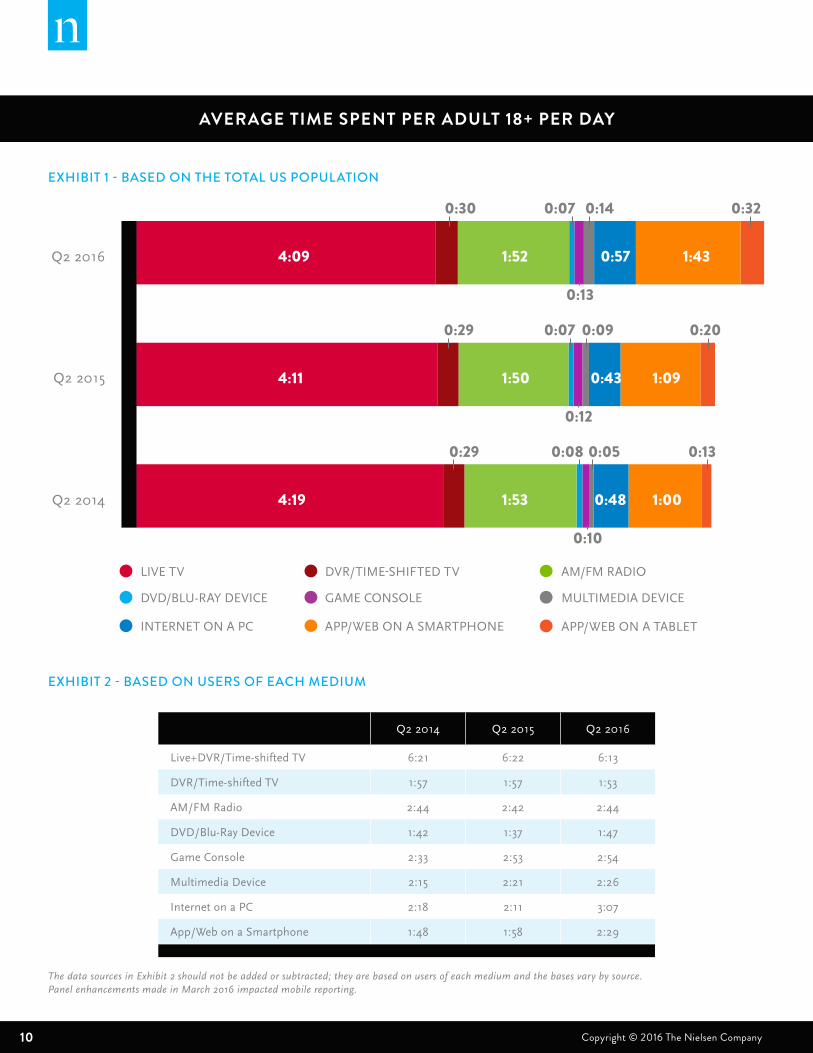
AVERAGE TIME SPENT PER ADULT 18+ PER DAY
0:140:30 0:320:07
0:13
0:57 1:431:524:09
0:090:29 0:200:07
0:12
0:43 1:091:504:11
0:050:29 0:130:08
0:10
0:48 1:001:534:19
EXHIBIT 1 - BASED ON THE TOTAL US POPULATION
EXHIBIT 2 - BASED ON USERS OF EACH MEDIUM
Q2 2014 Q2 2015 Q2 2016
Live+DVR/Time-shifted TV 6:21 6:22 6:13
DVR/Time-shifted TV 1:57 1:57 1:53
AM/FM Radio 2:44 2:42 2:44
DVD/Blu-Ray Device 1:42 1:37 1:47
Game Console 2:33 2:53 2:54
Multimedia Device 2:15 2:21 2:26
Internet on a PC 2:18 2:11 3:07
App/Web on a Smartphone 1:48 1:58 2:29
The data sources in Exhibit 2 should not be added or subtracted; they are based on users of each medium and the bases vary by source.Panel enhancements made in March 2016 impacted mobile reporting.
DVR/TIME-SHIFTED TV
DVD/BLU-RAY DEVICE GAME CONSOLE MULTIMEDIA DEVICE
APP/WEB ON A TABLETINTERNET ON A PC APP/WEB ON A SMARTPHONE
AM/FM RADIOLIVE TV
Q2 2015
Q2 2016
Q2 2014
11Copyright © 2016 The Nielsen Company THE NIELSEN TOTAL AUDIENCE REPORT | Q2 2016
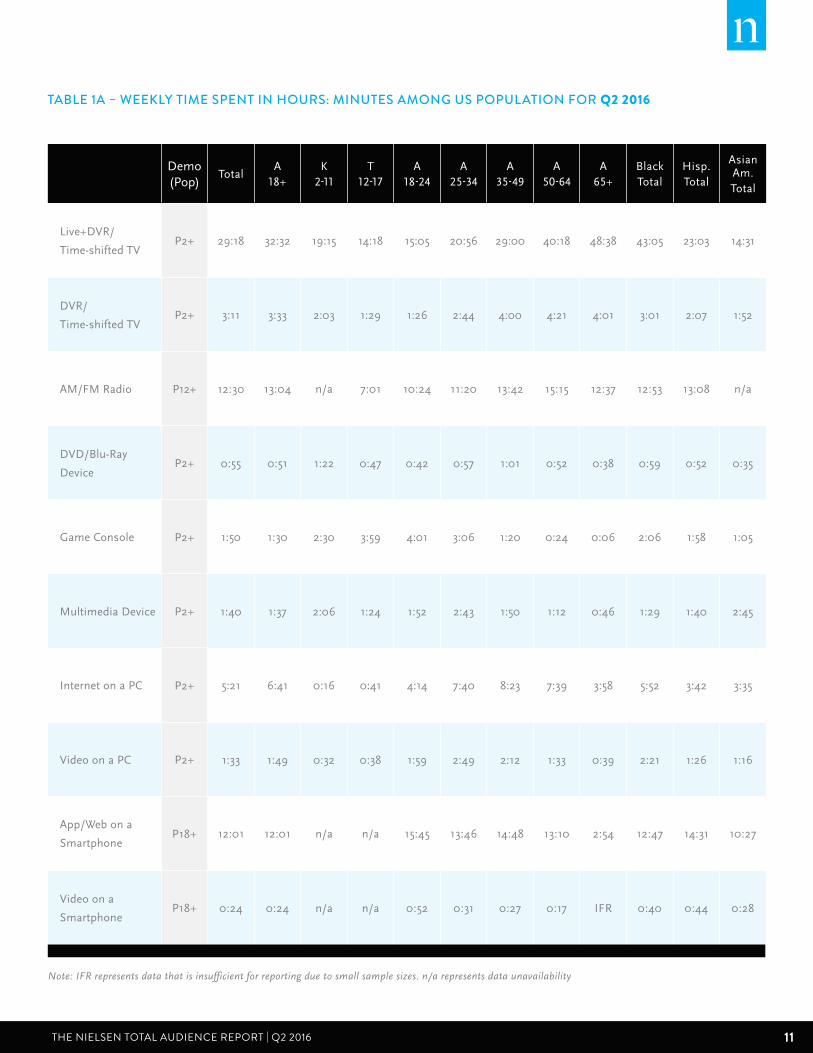
TABLE 1A – WEEKLY TIME SPENT IN HOURS: MINUTES AMONG US POPULATION FOR Q2 2016
Demo (Pop)
TotalA
18+K
2-11T
12-17A
18-24A
25-34A
35-49A
50-64A
65+Black Total
Hisp. Total
Asian Am. Total
Live+DVR/
Time-shifted TVP2+ 29:18 32:32 19:15 14:18 15:05 20:56 29:00 40:18 48:38 43:05 23:03 14:31
DVR/
Time-shifted TVP2+ 3:11 3:33 2:03 1:29 1:26 2:44 4:00 4:21 4:01 3:01 2:07 1:52
AM/FM Radio P12+ 12:30 13:04 n/a 7:01 10:24 11:20 13:42 15:15 12:37 12:53 13:08 n/a
DVD/Blu-Ray
DeviceP2+ 0:55 0:51 1:22 0:47 0:42 0:57 1:01 0:52 0:38 0:59 0:52 0:35
Game Console P2+ 1:50 1:30 2:30 3:59 4:01 3:06 1:20 0:24 0:06 2:06 1:58 1:05
Multimedia Device P2+ 1:40 1:37 2:06 1:24 1:52 2:43 1:50 1:12 0:46 1:29 1:40 2:45
Internet on a PC P2+ 5:21 6:41 0:16 0:41 4:14 7:40 8:23 7:39 3:58 5:52 3:42 3:35
Video on a PC P2+ 1:33 1:49 0:32 0:38 1:59 2:49 2:12 1:33 0:39 2:21 1:26 1:16
App/Web on a
SmartphoneP18+ 12:01 12:01 n/a n/a 15:45 13:46 14:48 13:10 2:54 12:47 14:31 10:27
Video on a
SmartphoneP18+ 0:24 0:24 n/a n/a 0:52 0:31 0:27 0:17 IFR 0:40 0:44 0:28
Note: IFR represents data that is insufficient for reporting due to small sample sizes. n/a represents data unavailability

12 Copyright © 2016 The Nielsen Company
TABLE 1B – WEEKLY TIME SPENT IN HOURS: MINUTES AMONG US POPULATION FOR Q2 2015
Demo (Pop)
TotalA
18+K
2-11T
12-17A
18-24A
25-34A
35-49A
50-64A
65+Black Total
Hisp. Total
Asian Am. Total
Live+DVR/
Time-shifted TVP2+ 29:47 32:41 20:46 16:32 16:26 22:09 29:17 39:55 48:02 43:02 24:52 16:03
DVR/
Time-shifted TVP2+ 3:07 3:26 2:12 1:35 1:31 2:58 3:53 4:07 3:40 2:46 2:09 1:57
AM/FM Radio P12+ 12:19 12:53 n/a 6:55 10:05 11:30 13:33 14:56 12:19 12:41 12:46 n/a
DVD/Blu-Ray
DeviceP2+ 0:59 0:52 1:36 0:55 0:45 0:59 0:59 0:57 0:37 1:06 0:58 0:40
Game Console P2+ 1:50 1:27 2:37 4:13 4:15 2:54 1:10 0:22 0:07 2:11 2:01 1:17
Multimedia Device P2+ 1:04 1:03 1:15 0:57 1:22 1:45 1:13 0:43 0:29 0:46 0:55 2:13
Internet on a PC P2+ 4:07 5:07 0:17 0:43 3:58 5:49 6:13 5:41 3:01 4:31 2:49 3:15
Video on a PC P2+ 1:16 1:30 0:22 0:29 1:47 2:08 1:50 1:20 0:31 1:38 1:02 1:01
App/Web on a
SmartphoneP18+ 8:07 8:07 n/a n/a 11:46 10:31 10:06 7:29 1:39 8:55 10:40 7:50
Video on a
SmartphoneP18+ 0:15 0:15 n/a n/a 0:38 0:22 0:16 0:09 IFR 0:23 0:32 0:21
13Copyright © 2016 The Nielsen Company THE NIELSEN TOTAL AUDIENCE REPORT | Q2 2016
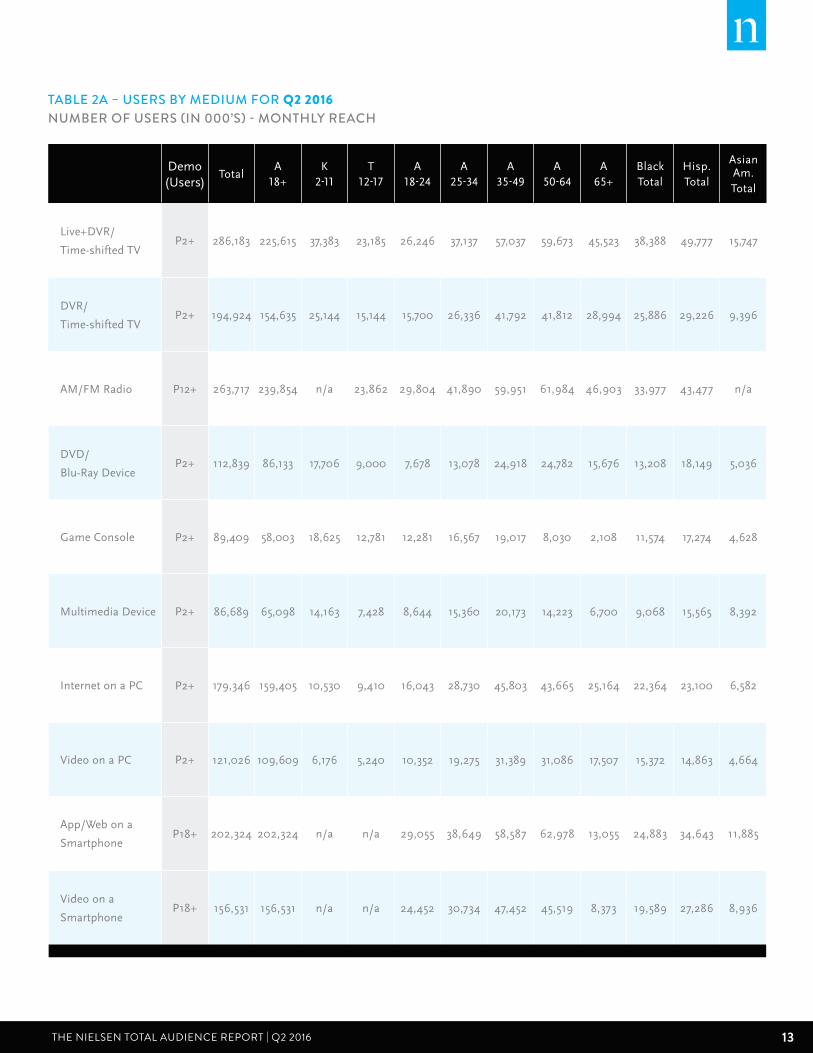
TABLE 2A – USERS BY MEDIUM FOR Q2 2016NUMBER OF USERS (IN 000’S) - MONTHLY REACH
Demo (Users)
TotalA
18+K
2-11T
12-17A
18-24A
25-34A
35-49A
50-64A
65+Black Total
Hisp. Total
Asian Am. Total
Live+DVR/
Time-shifted TVP2+ 286,183 225,615 37,383 23,185 26,246 37,137 57,037 59,673 45,523 38,388 49,777 15,747
DVR/
Time-shifted TVP2+ 194,924 154,635 25,144 15,144 15,700 26,336 41,792 41,812 28,994 25,886 29,226 9,396
AM/FM Radio P12+ 263,717 239,854 n/a 23,862 29,804 41,890 59,951 61,984 46,903 33,977 43,477 n/a
DVD/
Blu-Ray DeviceP2+ 112,839 86,133 17,706 9,000 7,678 13,078 24,918 24,782 15,676 13,208 18,149 5,036
Game Console P2+ 89,409 58,003 18,625 12,781 12,281 16,567 19,017 8,030 2,108 11,574 17,274 4,628
Multimedia Device P2+ 86,689 65,098 14,163 7,428 8,644 15,360 20,173 14,223 6,700 9,068 15,565 8,392
Internet on a PC P2+ 179,346 159,405 10,530 9,410 16,043 28,730 45,803 43,665 25,164 22,364 23,100 6,582
Video on a PC P2+ 121,026 109,609 6,176 5,240 10,352 19,275 31,389 31,086 17,507 15,372 14,863 4,664
App/Web on a
SmartphoneP18+ 202,324 202,324 n/a n/a 29,055 38,649 58,587 62,978 13,055 24,883 34,643 11,885
Video on a
SmartphoneP18+ 156,531 156,531 n/a n/a 24,452 30,734 47,452 45,519 8,373 19,589 27,286 8,936
14 Copyright © 2016 The Nielsen Company
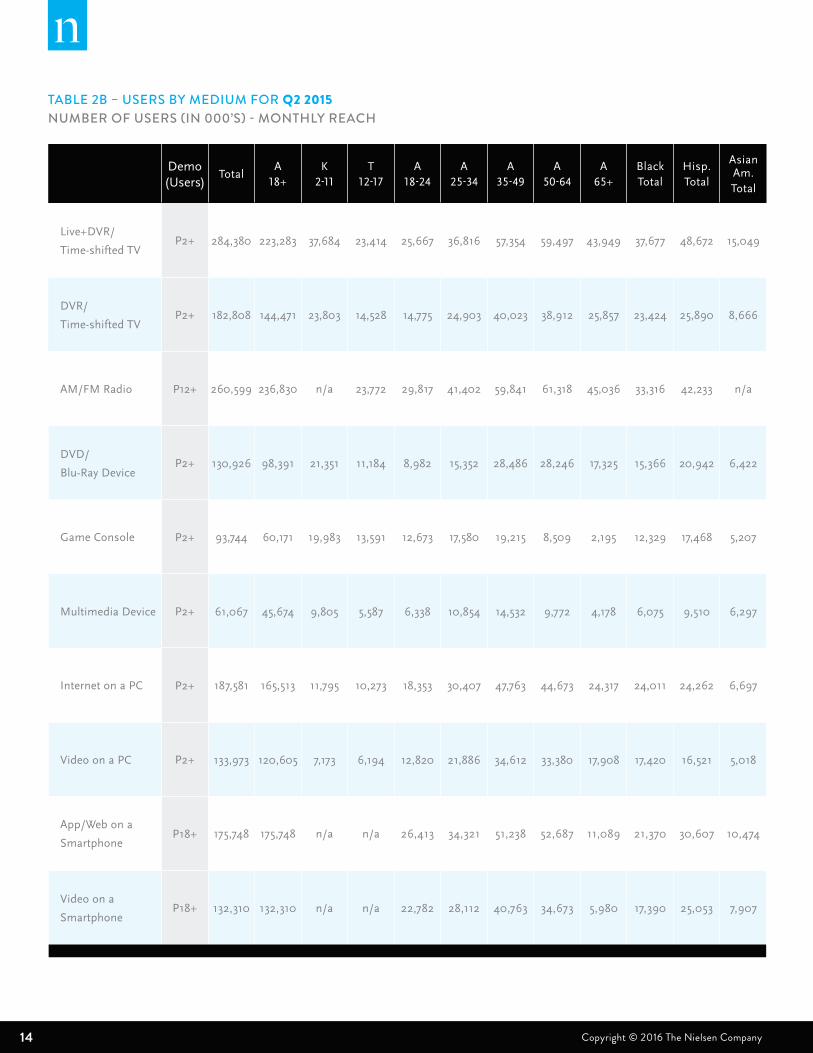
TABLE 2B – USERS BY MEDIUM FOR Q2 2015NUMBER OF USERS (IN 000’S) - MONTHLY REACH
Demo (Users)
TotalA
18+K
2-11T
12-17A
18-24A
25-34A
35-49A
50-64A
65+Black Total
Hisp. Total
Asian Am. Total
Live+DVR/
Time-shifted TVP2+ 284,380 223,283 37,684 23,414 25,667 36,816 57,354 59,497 43,949 37,677 48,672 15,049
DVR/
Time-shifted TVP2+ 182,808 144,471 23,803 14,528 14,775 24,903 40,023 38,912 25,857 23,424 25,890 8,666
AM/FM Radio P12+ 260,599 236,830 n/a 23,772 29,817 41,402 59,841 61,318 45,036 33,316 42,233 n/a
DVD/
Blu-Ray DeviceP2+ 130,926 98,391 21,351 11,184 8,982 15,352 28,486 28,246 17,325 15,366 20,942 6,422
Game Console P2+ 93,744 60,171 19,983 13,591 12,673 17,580 19,215 8,509 2,195 12,329 17,468 5,207
Multimedia Device P2+ 61,067 45,674 9,805 5,587 6,338 10,854 14,532 9,772 4,178 6,075 9,510 6,297
Internet on a PC P2+ 187,581 165,513 11,795 10,273 18,353 30,407 47,763 44,673 24,317 24,011 24,262 6,697
Video on a PC P2+ 133,973 120,605 7,173 6,194 12,820 21,886 34,612 33,380 17,908 17,420 16,521 5,018
App/Web on a
SmartphoneP18+ 175,748 175,748 n/a n/a 26,413 34,321 51,238 52,687 11,089 21,370 30,607 10,474
Video on a
SmartphoneP18+ 132,310 132,310 n/a n/a 22,782 28,112 40,763 34,673 5,980 17,390 25,053 7,907
15Copyright © 2016 The Nielsen Company THE NIELSEN TOTAL AUDIENCE REPORT | Q2 2016
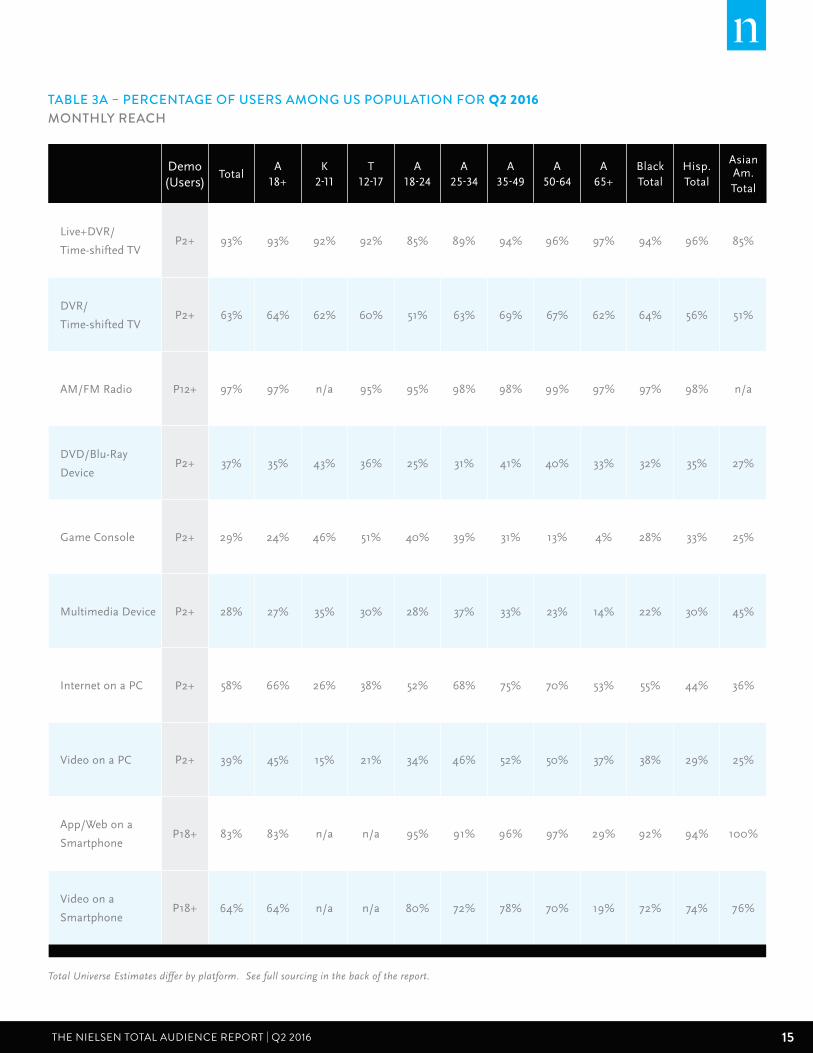
TABLE 3A – PERCENTAGE OF USERS AMONG US POPULATION FOR Q2 2016MONTHLY REACH
Demo (Users)
TotalA
18+K
2-11T
12-17A
18-24A
25-34A
35-49A
50-64A
65+Black Total
Hisp. Total
Asian Am. Total
Live+DVR/
Time-shifted TVP2+ 93% 93% 92% 92% 85% 89% 94% 96% 97% 94% 96% 85%
DVR/
Time-shifted TVP2+ 63% 64% 62% 60% 51% 63% 69% 67% 62% 64% 56% 51%
AM/FM Radio P12+ 97% 97% n/a 95% 95% 98% 98% 99% 97% 97% 98% n/a
DVD/Blu-Ray
DeviceP2+ 37% 35% 43% 36% 25% 31% 41% 40% 33% 32% 35% 27%
Game Console P2+ 29% 24% 46% 51% 40% 39% 31% 13% 4% 28% 33% 25%
Multimedia Device P2+ 28% 27% 35% 30% 28% 37% 33% 23% 14% 22% 30% 45%
Internet on a PC P2+ 58% 66% 26% 38% 52% 68% 75% 70% 53% 55% 44% 36%
Video on a PC P2+ 39% 45% 15% 21% 34% 46% 52% 50% 37% 38% 29% 25%
App/Web on a
SmartphoneP18+ 83% 83% n/a n/a 95% 91% 96% 97% 29% 92% 94% 100%
Video on a
SmartphoneP18+ 64% 64% n/a n/a 80% 72% 78% 70% 19% 72% 74% 76%
Total Universe Estimates differ by platform. See full sourcing in the back of the report.
16 Copyright © 2016 The Nielsen Company
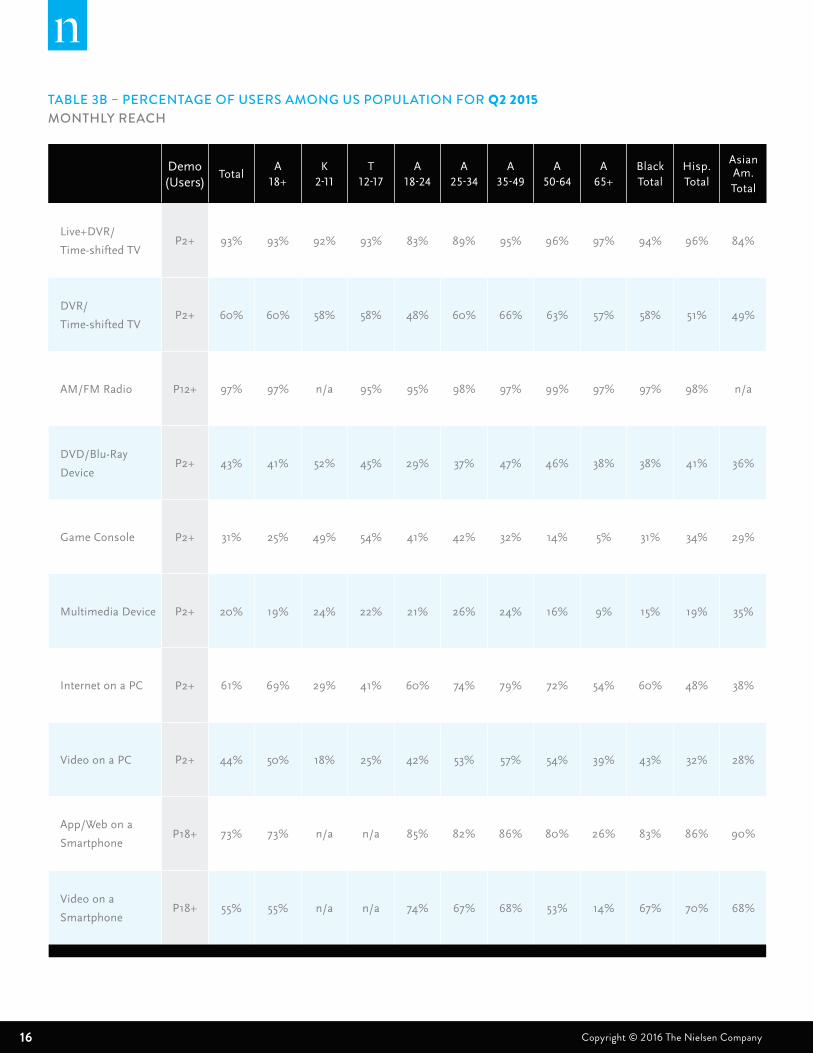
TABLE 3B – PERCENTAGE OF USERS AMONG US POPULATION FOR Q2 2015MONTHLY REACH
Demo (Users)
TotalA
18+K
2-11T
12-17A
18-24A
25-34A
35-49A
50-64A
65+Black Total
Hisp. Total
Asian Am. Total
Live+DVR/
Time-shifted TVP2+ 93% 93% 92% 93% 83% 89% 95% 96% 97% 94% 96% 84%
DVR/
Time-shifted TVP2+ 60% 60% 58% 58% 48% 60% 66% 63% 57% 58% 51% 49%
AM/FM Radio P12+ 97% 97% n/a 95% 95% 98% 97% 99% 97% 97% 98% n/a
DVD/Blu-Ray
DeviceP2+ 43% 41% 52% 45% 29% 37% 47% 46% 38% 38% 41% 36%
Game Console P2+ 31% 25% 49% 54% 41% 42% 32% 14% 5% 31% 34% 29%
Multimedia Device P2+ 20% 19% 24% 22% 21% 26% 24% 16% 9% 15% 19% 35%
Internet on a PC P2+ 61% 69% 29% 41% 60% 74% 79% 72% 54% 60% 48% 38%
Video on a PC P2+ 44% 50% 18% 25% 42% 53% 57% 54% 39% 43% 32% 28%
App/Web on a
SmartphoneP18+ 73% 73% n/a n/a 85% 82% 86% 80% 26% 83% 86% 90%
Video on a
SmartphoneP18+ 55% 55% n/a n/a 74% 67% 68% 53% 14% 67% 70% 68%
17Copyright © 2016 The Nielsen Company THE NIELSEN TOTAL AUDIENCE REPORT | Q2 2016
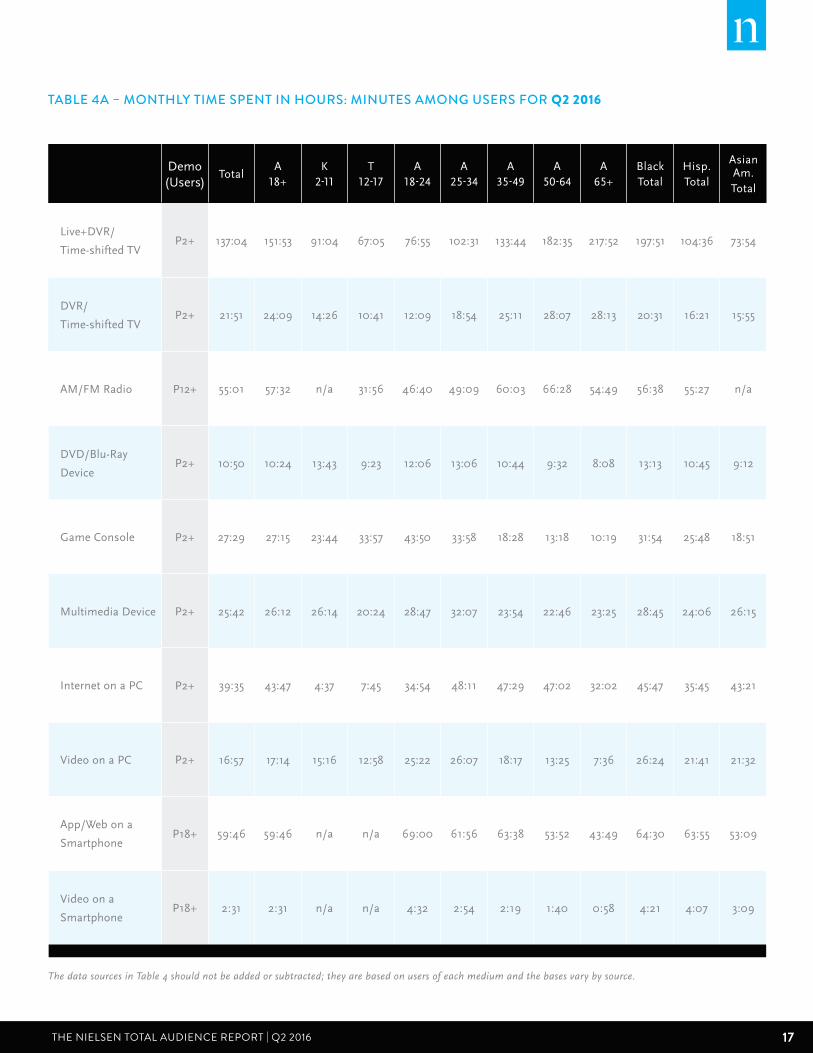
TABLE 4A – MONTHLY TIME SPENT IN HOURS: MINUTES AMONG USERS FOR Q2 2016
Demo (Users)
TotalA
18+K
2-11T
12-17A
18-24A
25-34A
35-49A
50-64A
65+Black Total
Hisp. Total
Asian Am. Total
Live+DVR/
Time-shifted TVP2+ 137:04 151:53 91:04 67:05 76:55 102:31 133:44 182:35 217:52 197:51 104:36 73:54
DVR/
Time-shifted TVP2+ 21:51 24:09 14:26 10:41 12:09 18:54 25:11 28:07 28:13 20:31 16:21 15:55
AM/FM Radio P12+ 55:01 57:32 n/a 31:56 46:40 49:09 60:03 66:28 54:49 56:38 55:27 n/a
DVD/Blu-Ray
DeviceP2+ 10:50 10:24 13:43 9:23 12:06 13:06 10:44 9:32 8:08 13:13 10:45 9:12
Game Console P2+ 27:29 27:15 23:44 33:57 43:50 33:58 18:28 13:18 10:19 31:54 25:48 18:51
Multimedia Device P2+ 25:42 26:12 26:14 20:24 28:47 32:07 23:54 22:46 23:25 28:45 24:06 26:15
Internet on a PC P2+ 39:35 43:47 4:37 7:45 34:54 48:11 47:29 47:02 32:02 45:47 35:45 43:21
Video on a PC P2+ 16:57 17:14 15:16 12:58 25:22 26:07 18:17 13:25 7:36 26:24 21:41 21:32
App/Web on a
SmartphoneP18+ 59:46 59:46 n/a n/a 69:00 61:56 63:38 53:52 43:49 64:30 63:55 53:09
Video on a
SmartphoneP18+ 2:31 2:31 n/a n/a 4:32 2:54 2:19 1:40 0:58 4:21 4:07 3:09
The data sources in Table 4 should not be added or subtracted; they are based on users of each medium and the bases vary by source.
18 Copyright © 2016 The Nielsen Company
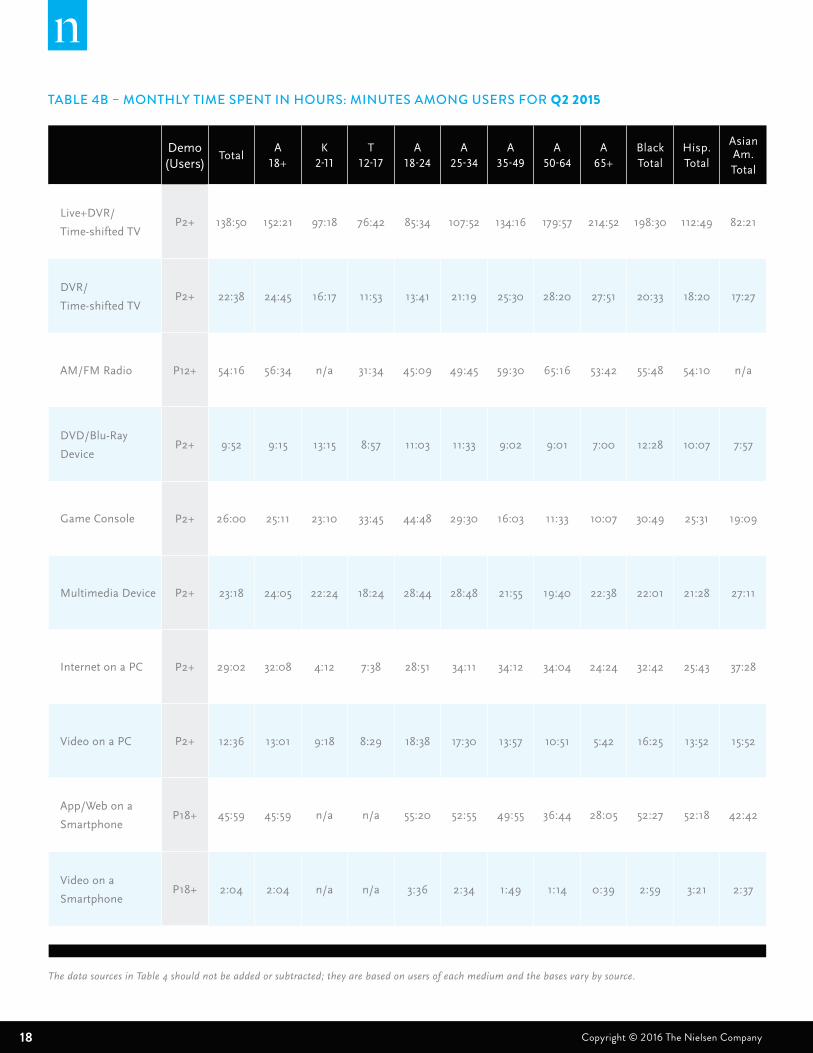
TABLE 4B – MONTHLY TIME SPENT IN HOURS: MINUTES AMONG USERS FOR Q2 2015
Demo (Users)
TotalA
18+K
2-11T
12-17A
18-24A
25-34A
35-49A
50-64A
65+Black Total
Hisp. Total
Asian Am. Total
Live+DVR/
Time-shifted TVP2+ 138:50 152:21 97:18 76:42 85:34 107:52 134:16 179:57 214:52 198:30 112:49 82:21
DVR/
Time-shifted TVP2+ 22:38 24:45 16:17 11:53 13:41 21:19 25:30 28:20 27:51 20:33 18:20 17:27
AM/FM Radio P12+ 54:16 56:34 n/a 31:34 45:09 49:45 59:30 65:16 53:42 55:48 54:10 n/a
DVD/Blu-Ray
DeviceP2+ 9:52 9:15 13:15 8:57 11:03 11:33 9:02 9:01 7:00 12:28 10:07 7:57
Game Console P2+ 26:00 25:11 23:10 33:45 44:48 29:30 16:03 11:33 10:07 30:49 25:31 19:09
Multimedia Device P2+ 23:18 24:05 22:24 18:24 28:44 28:48 21:55 19:40 22:38 22:01 21:28 27:11
Internet on a PC P2+ 29:02 32:08 4:12 7:38 28:51 34:11 34:12 34:04 24:24 32:42 25:43 37:28
Video on a PC P2+ 12:36 13:01 9:18 8:29 18:38 17:30 13:57 10:51 5:42 16:25 13:52 15:52
App/Web on a
SmartphoneP18+ 45:59 45:59 n/a n/a 55:20 52:55 49:55 36:44 28:05 52:27 52:18 42:42
Video on a
SmartphoneP18+ 2:04 2:04 n/a n/a 3:36 2:34 1:49 1:14 0:39 2:59 3:21 2:37
The data sources in Table 4 should not be added or subtracted; they are based on users of each medium and the bases vary by source.
19Copyright © 2016 The Nielsen Company THE NIELSEN TOTAL AUDIENCE REPORT | Q2 2016
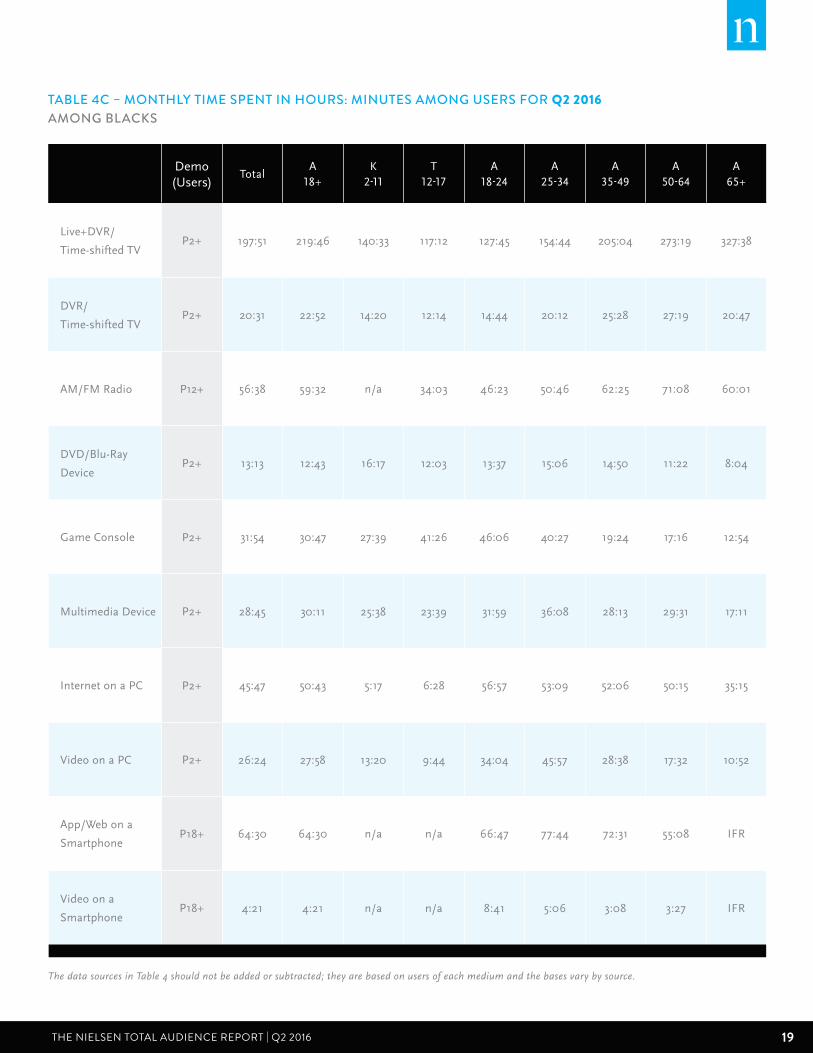
TABLE 4C – MONTHLY TIME SPENT IN HOURS: MINUTES AMONG USERS FOR Q2 2016AMONG BLACKS
Demo (Users)
TotalA
18+K
2-11T
12-17A
18-24A
25-34A
35-49A
50-64A
65+
Live+DVR/
Time-shifted TVP2+ 197:51 219:46 140:33 117:12 127:45 154:44 205:04 273:19 327:38
DVR/
Time-shifted TVP2+ 20:31 22:52 14:20 12:14 14:44 20:12 25:28 27:19 20:47
AM/FM Radio P12+ 56:38 59:32 n/a 34:03 46:23 50:46 62:25 71:08 60:01
DVD/Blu-Ray
DeviceP2+ 13:13 12:43 16:17 12:03 13:37 15:06 14:50 11:22 8:04
Game Console P2+ 31:54 30:47 27:39 41:26 46:06 40:27 19:24 17:16 12:54
Multimedia Device P2+ 28:45 30:11 25:38 23:39 31:59 36:08 28:13 29:31 17:11
Internet on a PC P2+ 45:47 50:43 5:17 6:28 56:57 53:09 52:06 50:15 35:15
Video on a PC P2+ 26:24 27:58 13:20 9:44 34:04 45:57 28:38 17:32 10:52
App/Web on a
SmartphoneP18+ 64:30 64:30 n/a n/a 66:47 77:44 72:31 55:08 IFR
Video on a
SmartphoneP18+ 4:21 4:21 n/a n/a 8:41 5:06 3:08 3:27 IFR
The data sources in Table 4 should not be added or subtracted; they are based on users of each medium and the bases vary by source.
20 Copyright © 2016 The Nielsen Company
The data sources in Table 4 should not be added or subtracted; they are based on users of each medium and the bases vary by source.
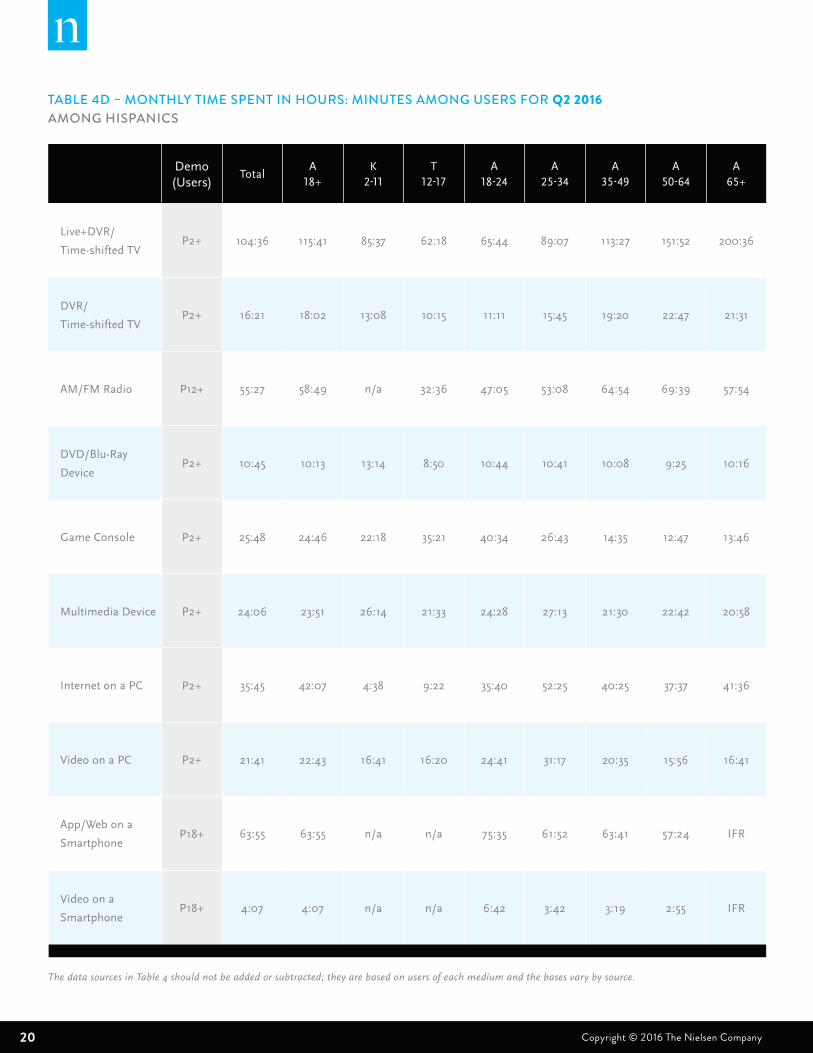
TABLE 4D – MONTHLY TIME SPENT IN HOURS: MINUTES AMONG USERS FOR Q2 2016AMONG HISPANICS
Demo (Users)
TotalA
18+K
2-11T
12-17A
18-24A
25-34A
35-49A
50-64A
65+
Live+DVR/
Time-shifted TVP2+ 104:36 115:41 85:37 62:18 65:44 89:07 113:27 151:52 200:36
DVR/
Time-shifted TVP2+ 16:21 18:02 13:08 10:15 11:11 15:45 19:20 22:47 21:31
AM/FM Radio P12+ 55:27 58:49 n/a 32:36 47:05 53:08 64:54 69:39 57:54
DVD/Blu-Ray
DeviceP2+ 10:45 10:13 13:14 8:50 10:44 10:41 10:08 9:25 10:16
Game Console P2+ 25:48 24:46 22:18 35:21 40:34 26:43 14:35 12:47 13:46
Multimedia Device P2+ 24:06 23:51 26:14 21:33 24:28 27:13 21:30 22:42 20:58
Internet on a PC P2+ 35:45 42:07 4:38 9:22 35:40 52:25 40:25 37:37 41:36
Video on a PC P2+ 21:41 22:43 16:41 16:20 24:41 31:17 20:35 15:56 16:41
App/Web on a
SmartphoneP18+ 63:55 63:55 n/a n/a 75:35 61:52 63:41 57:24 IFR
Video on a
SmartphoneP18+ 4:07 4:07 n/a n/a 6:42 3:42 3:19 2:55 IFR
21Copyright © 2016 The Nielsen Company THE NIELSEN TOTAL AUDIENCE REPORT | Q2 2016
The data sources in Table 4 should not be added or subtracted; they are based on users of each medium and the bases vary by source.
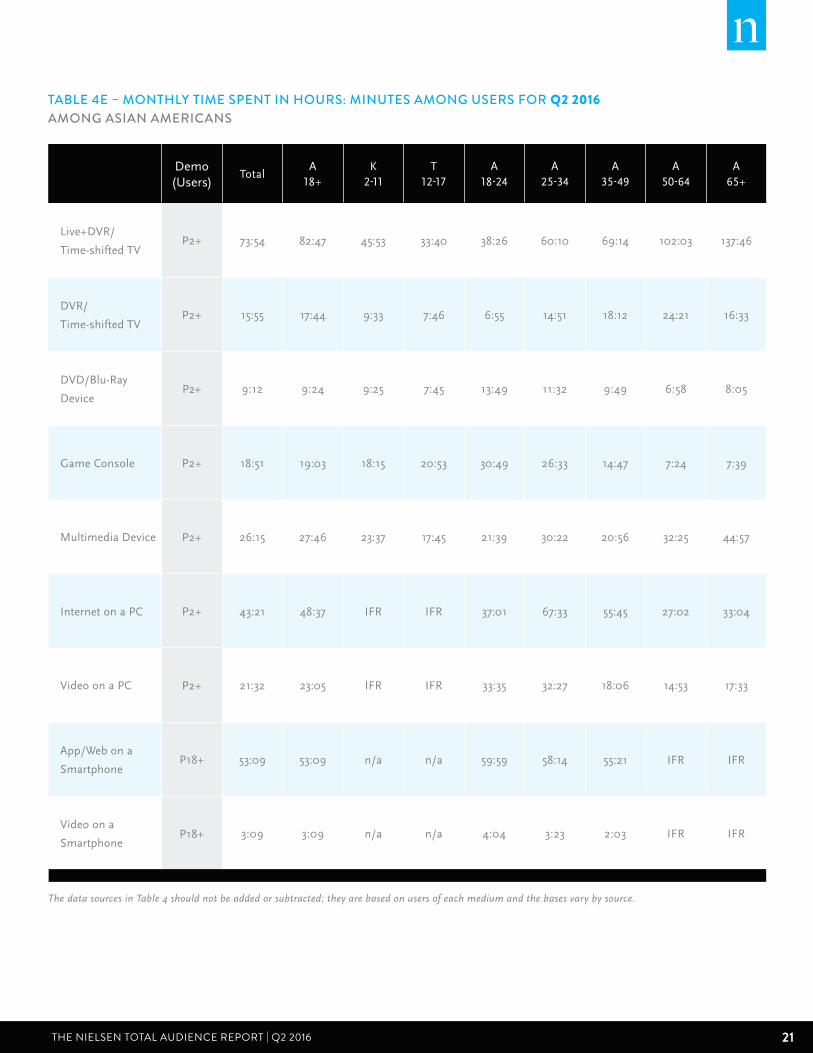
TABLE 4E – MONTHLY TIME SPENT IN HOURS: MINUTES AMONG USERS FOR Q2 2016AMONG ASIAN AMERICANS
Demo (Users)
TotalA
18+K
2-11T
12-17A
18-24A
25-34A
35-49A
50-64A
65+
Live+DVR/
Time-shifted TVP2+ 73:54 82:47 45:53 33:40 38:26 60:10 69:14 102:03 137:46
DVR/
Time-shifted TVP2+ 15:55 17:44 9:33 7:46 6:55 14:51 18:12 24:21 16:33
DVD/Blu-Ray
DeviceP2+ 9:12 9:24 9:25 7:45 13:49 11:32 9:49 6:58 8:05
Game Console P2+ 18:51 19:03 18:15 20:53 30:49 26:33 14:47 7:24 7:39
Multimedia Device P2+ 26:15 27:46 23:37 17:45 21:39 30:22 20:56 32:25 44:57
Internet on a PC P2+ 43:21 48:37 IFR IFR 37:01 67:33 55:45 27:02 33:04
Video on a PC P2+ 21:32 23:05 IFR IFR 33:35 32:27 18:06 14:53 17:33
App/Web on a
SmartphoneP18+ 53:09 53:09 n/a n/a 59:59 58:14 55:21 IFR IFR
Video on a
SmartphoneP18+ 3:09 3:09 n/a n/a 4:04 3:23 2:03 IFR IFR
22 Copyright © 2016 The Nielsen Company
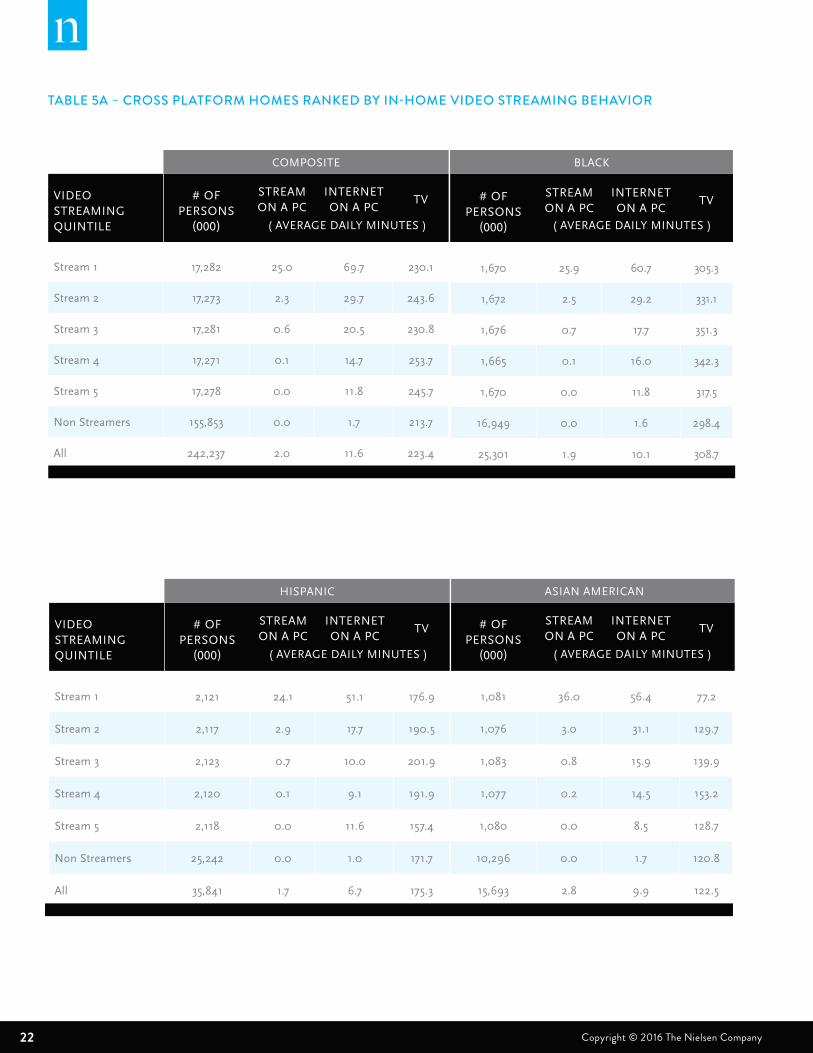
VIDEO STREAMING QUINTILE
# OF PERSONS
(000)
STREAM ON A PC
INTERNET ON A PC
TV
Stream 1 17,282 25.0 69.7 230.1
Stream 2 17,273 2.3 29.7 243.6
Stream 3 17,281 0.6 20.5 230.8
Stream 4 17,271 0.1 14.7 253.7
Stream 5 17,278 0.0 11.8 245.7
Non Streamers 155,853 0.0 1.7 213.7
All 242,237 2.0 11.6 223.4
COMPOSITE
( AVERAGE DAILY MINUTES )
# OF PERSONS
(000)
STREAM ON A PC
INTERNET ON A PC
TV
1,670 25.9 60.7 305.3
1,672 2.5 29.2 331.1
1,676 0.7 17.7 351.3
1,665 0.1 16.0 342.3
1,670 0.0 11.8 317.5
16,949 0.0 1.6 298.4
25,301 1.9 10.1 308.7
( AVERAGE DAILY MINUTES )
BLACK
( AVERAGE DAILY MINUTES ) ( AVERAGE DAILY MINUTES )
VIDEO STREAMING QUINTILE
# OF PERSONS
(000)
STREAM ON A PC
INTERNET ON A PC
TV
Stream 1 2,121 24.1 51.1 176.9
Stream 2 2,117 2.9 17.7 190.5
Stream 3 2,123 0.7 10.0 201.9
Stream 4 2,120 0.1 9.1 191.9
Stream 5 2,118 0.0 11.6 157.4
Non Streamers 25,242 0.0 1.0 171.7
All 35,841 1.7 6.7 175.3
# OF PERSONS
(000)
STREAM ON A PC
INTERNET ON A PC
TV
1,081 36.0 56.4 77.2
1,076 3.0 31.1 129.7
1,083 0.8 15.9 139.9
1,077 0.2 14.5 153.2
1,080 0.0 8.5 128.7
10,296 0.0 1.7 120.8
15,693 2.8 9.9 122.5
HISPANIC ASIAN AMERICAN
TABLE 5A – CROSS PLATFORM HOMES RANKED BY IN-HOME VIDEO STREAMING BEHAVIOR
23Copyright © 2016 The Nielsen Company THE NIELSEN TOTAL AUDIENCE REPORT | Q2 2016
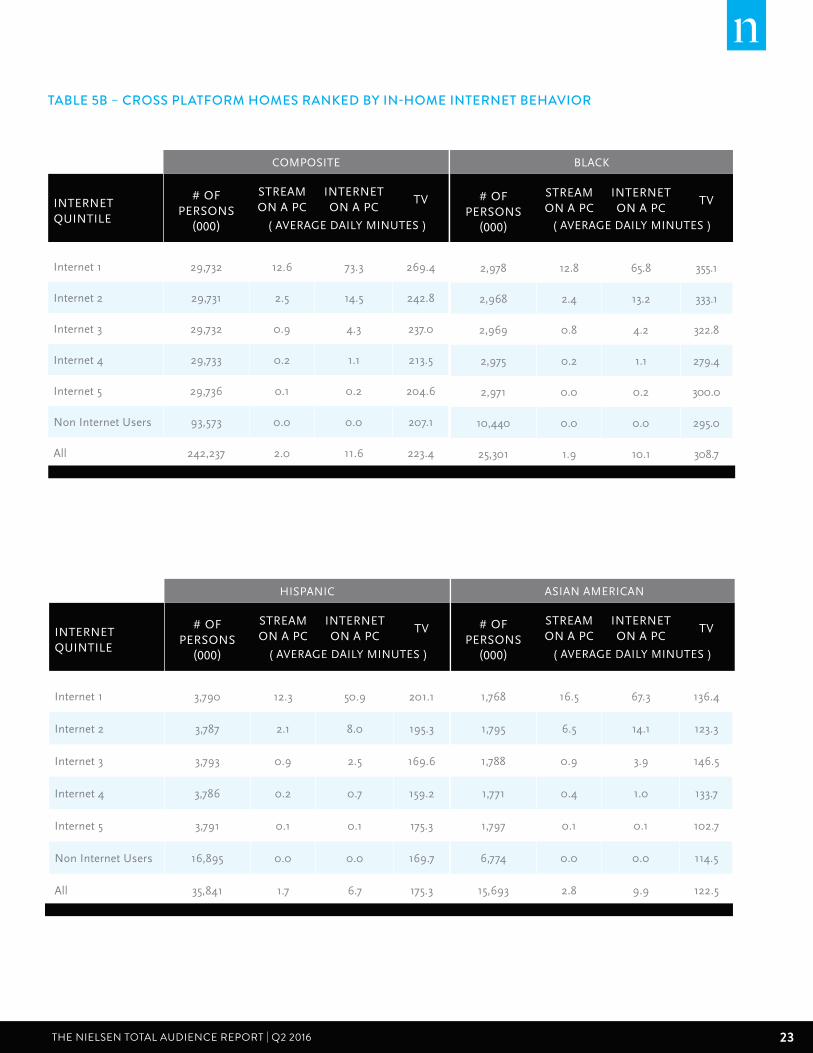
INTERNET QUINTILE
# OF PERSONS
(000)
STREAM ON A PC
INTERNET ON A PC
TV
Internet 1 29,732 12.6 73.3 269.4
Internet 2 29,731 2.5 14.5 242.8
Internet 3 29,732 0.9 4.3 237.0
Internet 4 29,733 0.2 1.1 213.5
Internet 5 29,736 0.1 0.2 204.6
Non Internet Users 93,573 0.0 0.0 207.1
All 242,237 2.0 11.6 223.4
COMPOSITE
( AVERAGE DAILY MINUTES )
# OF PERSONS
(000)
STREAM ON A PC
INTERNET ON A PC
TV
2,978 12.8 65.8 355.1
2,968 2.4 13.2 333.1
2,969 0.8 4.2 322.8
2,975 0.2 1.1 279.4
2,971 0.0 0.2 300.0
10,440 0.0 0.0 295.0
25,301 1.9 10.1 308.7
( AVERAGE DAILY MINUTES )
BLACK
( AVERAGE DAILY MINUTES ) ( AVERAGE DAILY MINUTES )
INTERNET QUINTILE
# OF PERSONS
(000)
STREAM ON A PC
INTERNET ON A PC
TV
Internet 1 3,790 12.3 50.9 201.1
Internet 2 3,787 2.1 8.0 195.3
Internet 3 3,793 0.9 2.5 169.6
Internet 4 3,786 0.2 0.7 159.2
Internet 5 3,791 0.1 0.1 175.3
Non Internet Users 16,895 0.0 0.0 169.7
All 35,841 1.7 6.7 175.3
# OF PERSONS
(000)
STREAM ON A PC
INTERNET ON A PC
TV
1,768 16.5 67.3 136.4
1,795 6.5 14.1 123.3
1,788 0.9 3.9 146.5
1,771 0.4 1.0 133.7
1,797 0.1 0.1 102.7
6,774 0.0 0.0 114.5
15,693 2.8 9.9 122.5
HISPANIC ASIAN AMERICAN
TABLE 5B – CROSS PLATFORM HOMES RANKED BY IN-HOME INTERNET BEHAVIOR
24 Copyright © 2016 The Nielsen Company
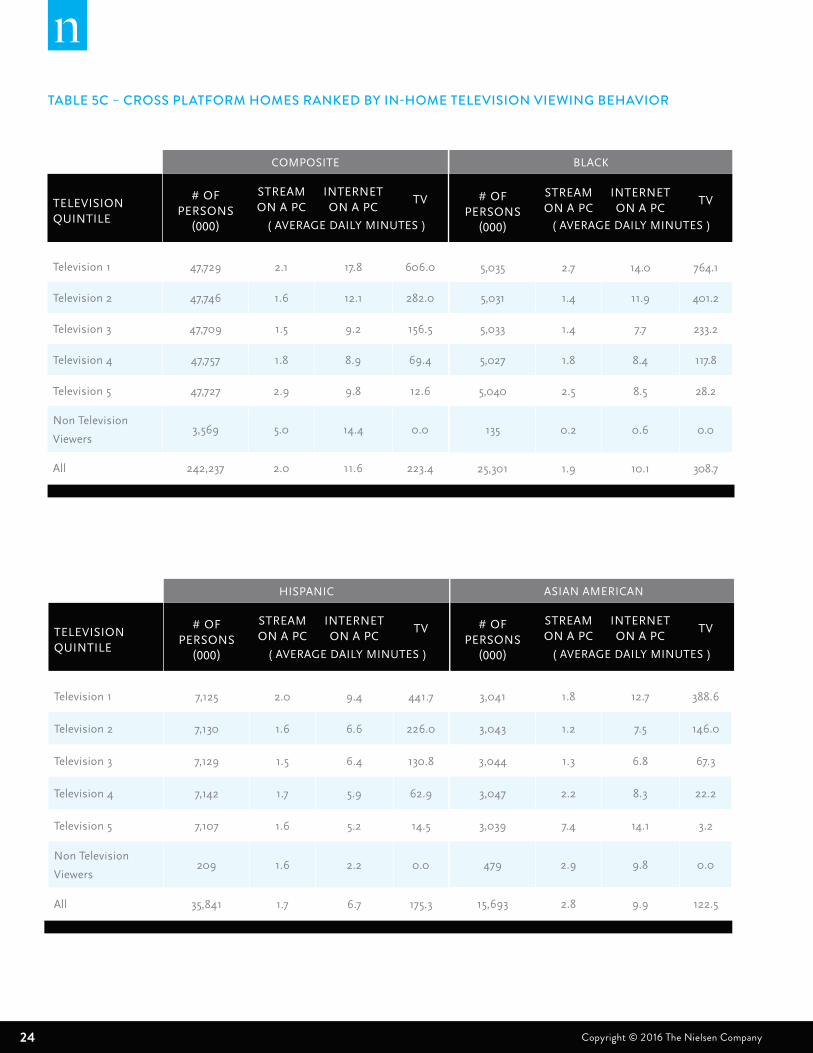
TELEVISION QUINTILE
# OF PERSONS
(000)
STREAM ON A PC
INTERNET ON A PC
TV
Television 1 47,729 2.1 17.8 606.0
Television 2 47,746 1.6 12.1 282.0
Television 3 47,709 1.5 9.2 156.5
Television 4 47,757 1.8 8.9 69.4
Television 5 47,727 2.9 9.8 12.6
Non Television
Viewers3,569 5.0 14.4 0.0
All 242,237 2.0 11.6 223.4
COMPOSITE
( AVERAGE DAILY MINUTES )
# OF PERSONS
(000)
STREAM ON A PC
INTERNET ON A PC
TV
5,035 2.7 14.0 764.1
5,031 1.4 11.9 401.2
5,033 1.4 7.7 233.2
5,027 1.8 8.4 117.8
5,040 2.5 8.5 28.2
135 0.2 0.6 0.0
25,301 1.9 10.1 308.7
( AVERAGE DAILY MINUTES )
BLACK
( AVERAGE DAILY MINUTES ) ( AVERAGE DAILY MINUTES )
TELEVISION QUINTILE
# OF PERSONS
(000)
STREAM ON A PC
INTERNET ON A PC
TV
Television 1 7,125 2.0 9.4 441.7
Television 2 7,130 1.6 6.6 226.0
Television 3 7,129 1.5 6.4 130.8
Television 4 7,142 1.7 5.9 62.9
Television 5 7,107 1.6 5.2 14.5
Non Television
Viewers209 1.6 2.2 0.0
All 35,841 1.7 6.7 175.3
# OF PERSONS
(000)
STREAM ON A PC
INTERNET ON A PC
TV
3,041 1.8 12.7 388.6
3,043 1.2 7.5 146.0
3,044 1.3 6.8 67.3
3,047 2.2 8.3 22.2
3,039 7.4 14.1 3.2
479 2.9 9.8 0.0
15,693 2.8 9.9 122.5
HISPANIC ASIAN AMERICAN
TABLE 5C – CROSS PLATFORM HOMES RANKED BY IN-HOME TELEVISION VIEWING BEHAVIOR
25Copyright © 2016 The Nielsen Company THE NIELSEN TOTAL AUDIENCE REPORT | Q2 2016
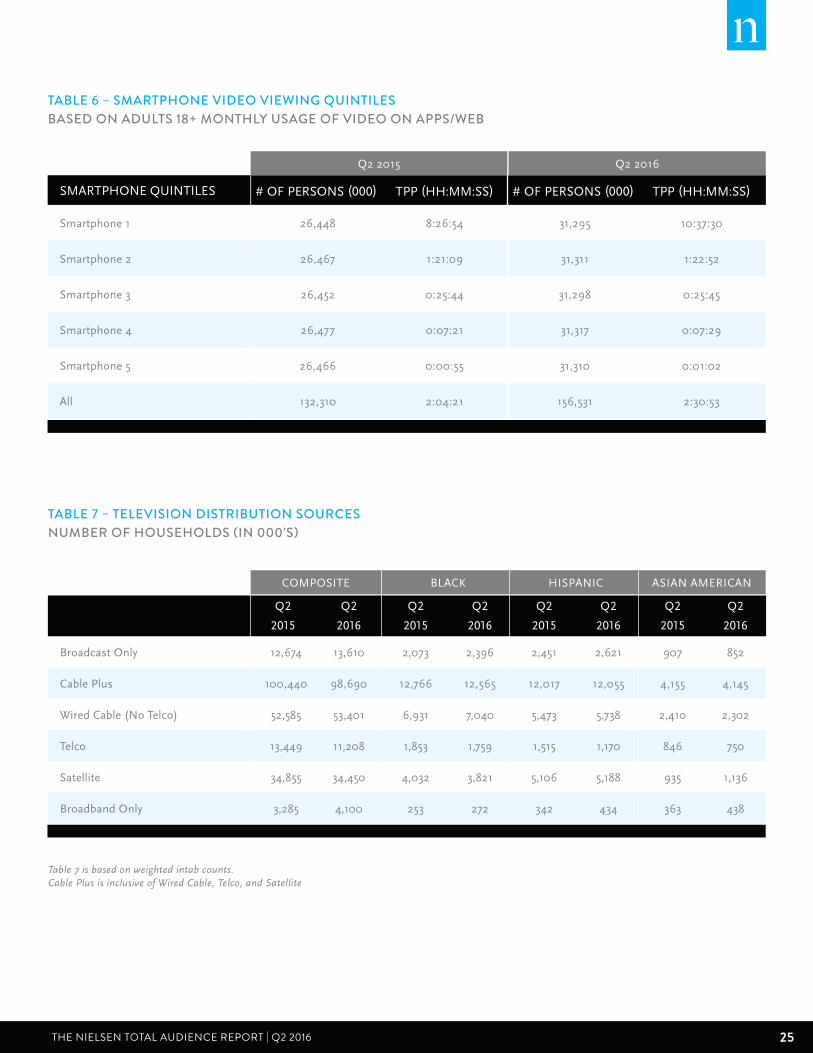
TABLE 6 – SMARTPHONE VIDEO VIEWING QUINTILESBASED ON ADULTS 18+ MONTHLY USAGE OF VIDEO ON APPS/WEB
SMARTPHONE QUINTILES # OF PERSONS (000) TPP (HH:MM:SS) # OF PERSONS (000) TPP (HH:MM:SS)
Smartphone 1 26,448 8:26:54 31,295 10:37:30
Smartphone 2 26,467 1:21:09 31,311 1:22:52
Smartphone 3 26,452 0:25:44 31,298 0:25:45
Smartphone 4 26,477 0:07:21 31,317 0:07:29
Smartphone 5 26,466 0:00:55 31,310 0:01:02
All 132,310 2:04:21 156,531 2:30:53
Q2 2015 Q2 2016
TABLE 7 – TELEVISION DISTRIBUTION SOURCESNUMBER OF HOUSEHOLDS (IN 000’S)
Q2
2015
Q2
2016
Q2
2015
Q2
2016
Q2
2015
Q2
2016
Q2
2015
Q2
2016
Broadcast Only 12,674 13,610 2,073 2,396 2,451 2,621 907 852
Cable Plus 100,440 98,690 12,766 12,565 12,017 12,055 4,155 4,145
Wired Cable (No Telco) 52,585 53,401 6,931 7,040 5,473 5,738 2,410 2,302
Telco 13,449 11,208 1,853 1,759 1,515 1,170 846 750
Satellite 34,855 34,450 4,032 3,821 5,106 5,188 935 1,136
Broadband Only 3,285 4,100 253 272 342 434 363 438
BLACK HISPANIC ASIAN AMERICANCOMPOSITE
Table 7 is based on weighted intab counts. Cable Plus is inclusive of Wired Cable, Telco, and Satellite
26 Copyright © 2016 The Nielsen Company
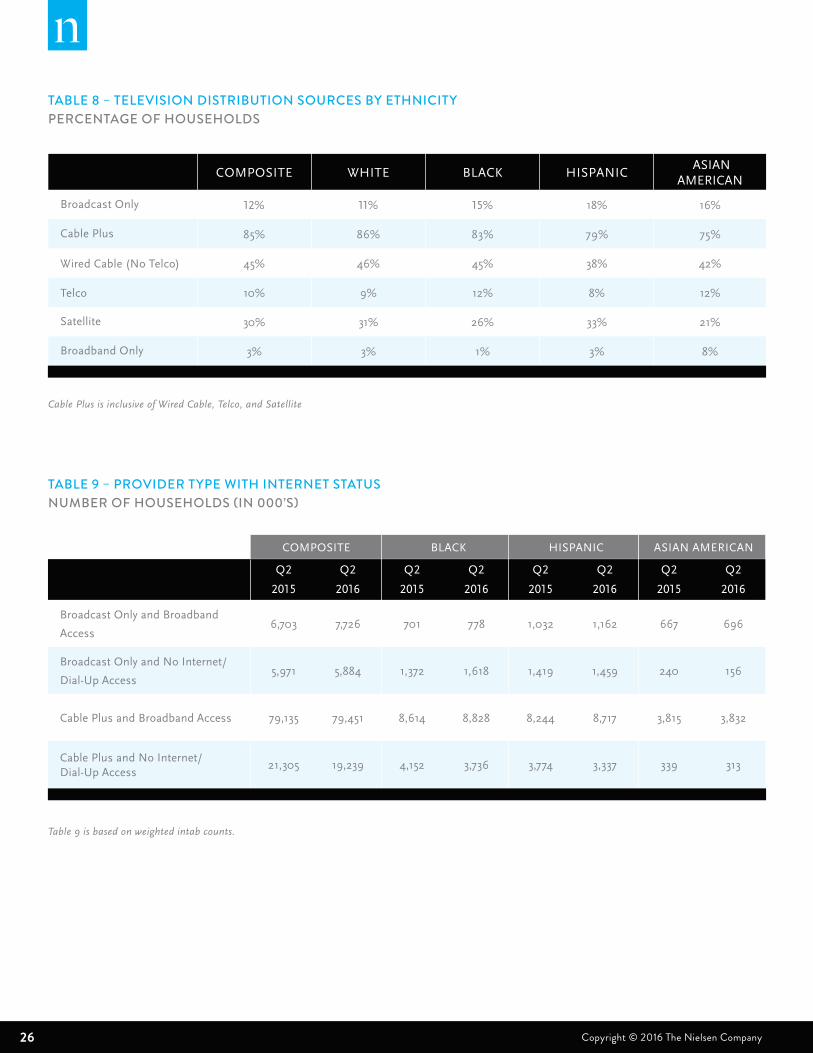
TABLE 8 – TELEVISION DISTRIBUTION SOURCES BY ETHNICITY PERCENTAGE OF HOUSEHOLDS
COMPOSITE WHITE BLACK HISPANIC ASIAN
AMERICAN
Broadcast Only 12% 11% 15% 18% 16%
Cable Plus 85% 86% 83% 79% 75%
Wired Cable (No Telco) 45% 46% 45% 38% 42%
Telco 10% 9% 12% 8% 12%
Satellite 30% 31% 26% 33% 21%
Broadband Only 3% 3% 1% 3% 8%
TABLE 9 – PROVIDER TYPE WITH INTERNET STATUSNUMBER OF HOUSEHOLDS (IN 000’S)
Q2
2015
Q2
2016
Q2
2015
Q2
2016
Q2
2015
Q2
2016
Q2
2015
Q2
2016
Broadcast Only and Broadband
Access6,703 7,726 701 778 1,032 1,162 667 696
Broadcast Only and No Internet/
Dial-Up Access5,971 5,884 1,372 1,618 1,419 1,459 240 156
Cable Plus and Broadband Access 79,135 79,451 8,614 8,828 8,244 8,717 3,815 3,832
Cable Plus and No Internet/ Dial-Up Access
21,305 19,239 4,152 3,736 3,774 3,337 339 313
BLACK HISPANIC ASIAN AMERICANCOMPOSITE
Cable Plus is inclusive of Wired Cable, Telco, and Satellite
Table 9 is based on weighted intab counts.
27Copyright © 2016 The Nielsen Company THE NIELSEN TOTAL AUDIENCE REPORT | Q2 2016
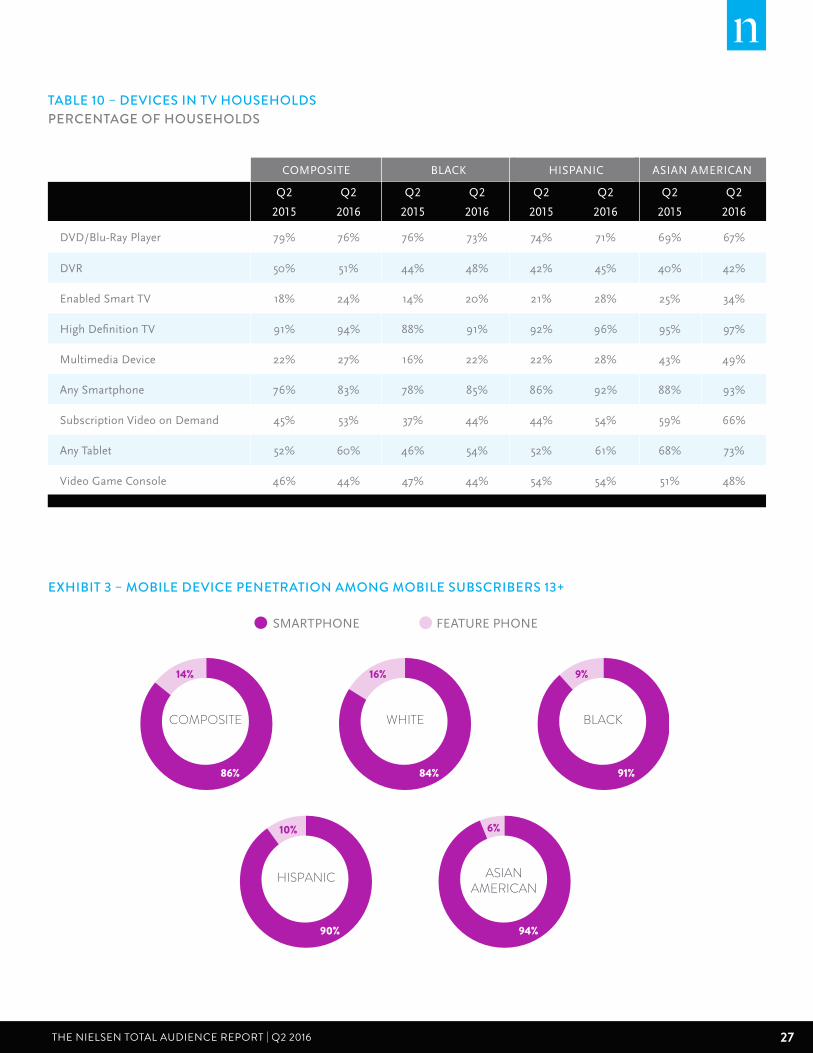
EXHIBIT 3 – MOBILE DEVICE PENETRATION AMONG MOBILE SUBSCRIBERS 13+
COMPOSITE
14%
86%
WHITE
16%
84%
BLACK
9%
91%
HISPANIC
10%
90%
ASIANAMERICAN
6%
94%
SMARTPHONE FEATURE PHONE
TABLE 10 – DEVICES IN TV HOUSEHOLDS PERCENTAGE OF HOUSEHOLDS
Q2
2015
Q2
2016
Q2
2015
Q2
2016
Q2
2015
Q2
2016
Q2
2015
Q2
2016
DVD/Blu-Ray Player 79% 76% 76% 73% 74% 71% 69% 67%
DVR 50% 51% 44% 48% 42% 45% 40% 42%
Enabled Smart TV 18% 24% 14% 20% 21% 28% 25% 34%
High Definition TV 91% 94% 88% 91% 92% 96% 95% 97%
Multimedia Device 22% 27% 16% 22% 22% 28% 43% 49%
Any Smartphone 76% 83% 78% 85% 86% 92% 88% 93%
Subscription Video on Demand 45% 53% 37% 44% 44% 54% 59% 66%
Any Tablet 52% 60% 46% 54% 52% 61% 68% 73%
Video Game Console 46% 44% 47% 44% 54% 54% 51% 48%
BLACK HISPANIC ASIAN AMERICANCOMPOSITE
28 Copyright © 2016 The Nielsen Company
SOURCING & METHODOLOGIESGLOSSARY
AM/FM RADIO: Listening to programming from AM/FM radio stations or network
programming.
BROADBAND ACCESS: Paid, high-speed Internet access delivered via DSL, Cable
Internet through cable provider, Fiber-Optic Service, U-Verse, Satellite Internet, Data Card
(aircard that connects to a cellular phone network) or PC tethered to cell phone (cellular
phone network).
BROADBAND ONLY: A household with at least one operable TV/monitor that receives
video exclusively through a broadband internet connection instead of traditional means
(over-the-air, wired cable, telco, satellite).
BROADCAST ONLY: A mode of television content delivery that does not involve satellite
transmission or cables (i.e.—a paid service). Also commonly referred to as “over-the-air.”
CABLE PLUS: Inclusive of Wired Cable, Telco, and Satellite. Broadband Only Homes
would be not included. (Also referred to as Multichannel)
DIAL-UP: A household that accesses the Internet via a telephone line.
ENABLED SMART TV: A household with at least one television set that is capable and
enabled to access the internet.
MULTIMEDIA DEVICE: Viewing on an Apple TV, Roku, Google Chromecast, Smartphone,
Computer/Laptops, etc. connected to the TV.
SATELLITE: A paid TV subscription where the signal is distributed to an orbiting
satellite. The amplified signal is then re-transmitted to the home and received via a dish.
(Sometimes also referred to as “dish.”)
SUBSCRIPTION VIDEO ON DEMAND (SVOD): A household with access to a
subscription video on demand service, such as Netflix, Amazon Prime and Hulu Plus.
TELCO: A paid TV subscription delivered fiber-optically via a traditional telephone
provider.
TV HOUSEHOLD: A home with at least one operable TV/monitor with the ability to
deliver video via traditional means of antennae, cable STB or Satellite receiver and/or with
a broadband connection.
WIRED CABLE: Traditional cable delivered through wires to your home.
29Copyright © 2016 The Nielsen Company THE NIELSEN TOTAL AUDIENCE REPORT | Q2 2016
TELEVISION METHODOLOGY
Live+DVR/Time-shifted TV includes Live usage plus any playback viewing within
the measurement period. DVR/Time-shifted TV is playback primarily on a DVR but
includes playback from video on demand, DVD recorders, server based DVR’s and
services like Start Over.
TV-connected devices (DVD, Game Console, Multimedia Device) would include
content being viewed on the TV screen through these devices. This would include
when these devices are in use for any purpose, not just for accessing media content.
For example, Game Console would also include when the game console is being used
to play video games.
Multimedia Devices is a combination of usage of the Internet Connected Devices viewing
source and Audio-Video viewing sources. It would include viewing on an Apple TV, Roku,
Google Chromecast, Smartphone, Computer/Laptop, etc. connected to the TV.
Reach for television and TV-connected devices includes those viewing at least one minute
within the measurement period.
Data used in this report is inclusive of multicultural audiences. Hispanic consumer
audiences are comprised of both English and Spanish speaking representative populations.
The last phase of a two-year sample expansion initiative (referred to as NPX) was
completed on December 28, 2015, essentially doubling the sample size of our National
Panel. The official production ratings that comprise Nielsen’s National television
measurement service will be based on the larger panel of households. As with any past
panel enhancements or methodology change, there is a trend break in the data when
looking at year-over-year comparisons.
AM/FM RADIO METHODOLOGY
Audience estimates for 48 large markets are based on a panel of people who carry a
portable device called a Personal People Meter (PPM) that passively detects exposure to
content that contains inaudible codes embedded within the program content. Audience
estimates from the balance of markets and countries in the U.S. are based on surveys of
people who record their listening in a written diary for a week.
The estimates in this report are based on RADAR and the National Regional Database.
RADAR reports national network radio ratings covering the U.S. using both PPM and Diary
measurement and it is based on a rolling one-year average of nearly 400,000 respondents
aged 12+ per year. The Q2 2016 report is based on the September RADAR studies to more
accurately align with the other included media. This adjustment is also reflected in the
included historical data.
Monthly Radio Estimates: Nielsen’s Measurement Science group used statistical modeling
techniques to estimate the total cume audience to radio in a four week period, as compared
to the total cume audience to radio in an average week. The methodology utilized PPM
panel data, and essentially measured how many people who were not exposed to radio in
a single week might typically be exposed to radio over a consecutive four week period. A
radio cume growth factor was then determined and applied to radio listening on a national
basis. In the Q2 2016 report, the model for monthly radio estimates has been refined to
more accurately align with the other included media. This adjustment is also reflected in
the included historical data.
30 Copyright © 2016 The Nielsen Company
Listening to HD radio broadcasts, Internet streams of AM/FM radio stations and
Satellite Radio is included in the Persons Using Radio estimates in this report where
the tuning meets our reporting and crediting requirements of at least 5 minutes of
usage. Reach for AM/FM Radio includes those listening for at least 5 minutes within
the measurement period.
Data used in this report is inclusive of multicultural audiences. Hispanic
consumer audiences are comprised of both English and Spanish speaking
representative populations.
ONLINE METHODOLOGY
Nielsen’s Online Panel is recruited based on an opt-in convenience panel. Online
recruitment pages are offered in both English and Spanish. Panelists then download
Nielsen’s patented desktop NetSight meter, which accurately identifies which browser,
tab, Internet application (including media players and instant messaging) or desktop
application is in focus. Nielsen’s Online Panel tracks usage across web sites and digital
applications to deliver audience and analytics through metered measurement of panels
of Internet users at both home and work.
Nielsen Netview and VideoCensus data is reflective of the hybrid methodology which
combines a census level accounting of page views and video streams where Nielsen
measurement tags have been deployed in order to project audience and behavior to
the full universe of all Internet users. For VideoCensus, the portion of the total video
streams calibrated by census data, previously allocated to Home/Work computers, are
now allocated to other devices and locations such as smartphones and viewing outside
of home and work.
Hours:minutes for Internet and video use are based on the universe of persons who
used the Internet/watched online video. All Internet figures are weekly or monthly
averages over the course of the quarter. All Internet on a PC metrics are derived from
Nielsen NetView, while all Video on a PC metrics are derived from Nielsen VideoCensus.
The audience of Video on a PC is a subset of Internet on a PC.
As of August 2015, the rules used for crediting page views and duration within Netview
have been updated with more comprehensive accounting of multi-tabbed browsing and
iFrames, as well as the implementation of a longer timeout threshold for mouse/keyboard
inactivity. These changes resulted in an increase in Internet duration on a PC.
Meter collection capability improved in February 2016, which generally resulted in
increased audience, page view, stream and duration metrics for Internet on a PC.
31Copyright © 2016 The Nielsen Company THE NIELSEN TOTAL AUDIENCE REPORT | Q2 2016
MOBILE METHODOLOGY
Nielsen’s Electronic Mobile Measurement (EMM) is an observational, user-centric
approach that uses passive metering technology on smartphones and tablets to track
device and application usage on an opt-in convenience panel, recruited online and in
English. Results are then reported out through Nielsen Mobile NetView 3.0. There are
approximately 9,000 smartphone and 1,300 tablet panelists in the U.S. across both iOS
and Android smartphone devices. This method provides a holistic view of all activity on
the device as the behavior is being tracked without interruption.
A number of steps are taken after the data collection process to ensure the reported
data is representative of the mobile population. For smartphones, weighting controls
are applied across five characteristics (gender, age, income, race, and ethnicity) while
independent enumeration studies are carried out on a continuous basis to provide the
most current estimates of the mobile population (aka Universe Estimation).
Tablet data is unweighted and projections are applied using estimates from the National
Panel that is the industry standard for TV ratings.
Figures reported in Nielsen’s Mobile NetView 3.0 include those individuals who are P18+
who have used an iOS or Android device in the U.S. In particular:
App/Web refers to consuming mobile media content through a web browser or via a
mobile app. It does not include other types of activity such as making/receiving phone
calls, sending SMS/MMS messages etc, which has been excluded for this report.
Video is a subset of App/Web and refers to those individuals who visit a website or use a
mobile app specifically designed to watch video content.
Due to the methodology change from survey based data to EMM as of the Q4 2013 Total
Audience report, data should not be trended to previous quarters’ published editions.
Weekly smartphone data is now based on weekly weights. This adjustment is also
reflected in the included historical data.
In March 2016 Nielsen implemented a crediting enhancement to improve the reporting of
mobile usage on iOS devices. A legacy crediting rule that capped usage at 30 minutes was
removed, so now if a panelist uses an app or visits a website for more than 30 minutes at
a time the entire duration is now credited towards the app or website. This crediting rule
will also be implemented on Android devices in the coming months.
32 Copyright © 2016 The Nielsen Company
As of the Q2 2015 report, TV-connected devices (DVR, DVD, Game Console, and Multimedia
Devices) among users of each medium are calculated based on users of each TV-connected device.
SOURCING
EXHIBIT 1, 2 & TABLES 1, 2, 3, 4 – AVERAGE TIME SPENT PER ADULT 18+ PER DAY, WEEKLY TIME SPENT AMONG US POPULATION, USERS BY MEDIUM, PERCENTAGE OF USERS, MONTHLY TIME SPENT AMONG USERSSource: Live+DVR/Time-shifted TV, DVR/Time-shifted TV, DVD, Game Consoles,
Multimedia Devices 03/28/2016-06/26/2016 via Nielsen NPOWER/National Panel, Radio
06/18/15-06/15/16 via RADAR 130, PC 04/01/16-06/30/16 via Nielsen Netview and Nielsen
VideoCensus, Smartphone 04/01/16-06/30/16 via Nielsen Electronic Mobile Measurement,
Tablet 04/01/16-06/30/16 via Nielsen Electronic Mobile Measurement – unweighted,
projections based on estimates from the NPOWER/National Panel.
Exhibit 1 and Table 1 are based on the total U.S. population whether or not they have the technology.
Exhibit 2 and Tables 2-4 are based on users of each medium.
As of the Q1 2016 report, the calculations within Exhibit 2 have been adjusted to reflect
actual usage of daily users.
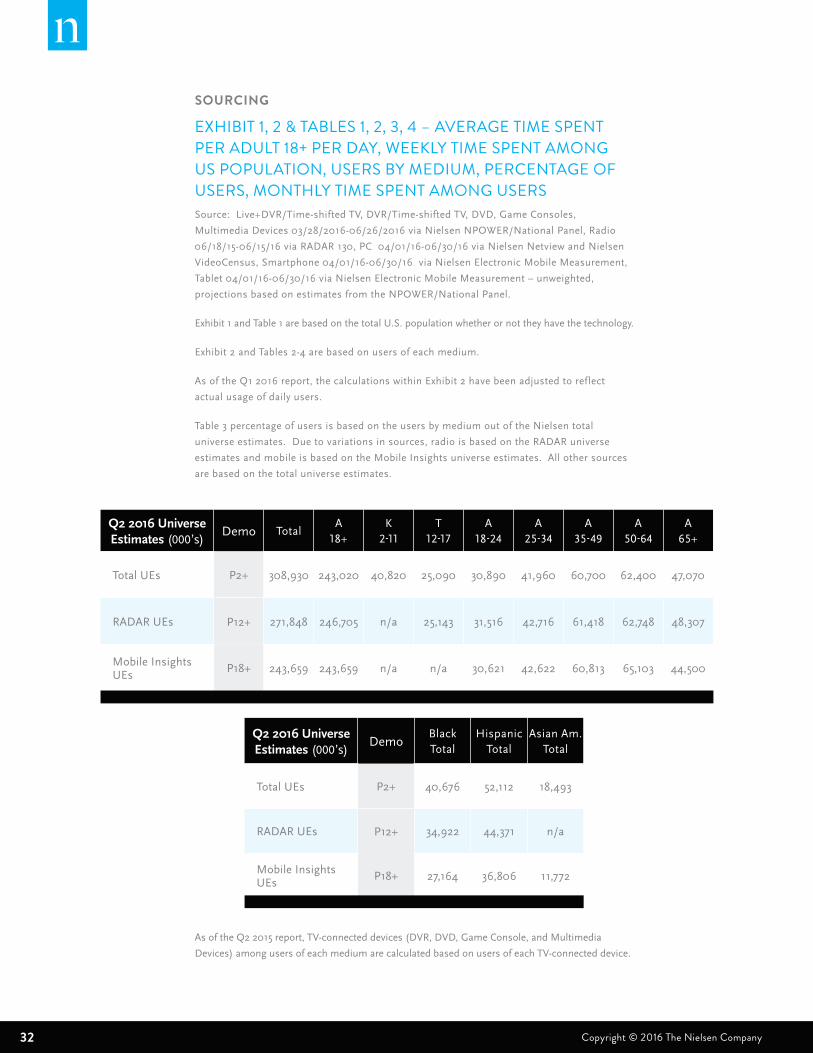
Table 3 percentage of users is based on the users by medium out of the Nielsen total
universe estimates. Due to variations in sources, radio is based on the RADAR universe
estimates and mobile is based on the Mobile Insights universe estimates. All other sources
are based on the total universe estimates.
Q2 2016 Universe Estimates (000’s)
Demo TotalA
18+K
2-11T
12-17A
18-24A
25-34A
35-49A
50-64A
65+
Total UEs P2+ 308,930 243,020 40,820 25,090 30,890 41,960 60,700 62,400 47,070
RADAR UEs P12+ 271,848 246,705 n/a 25,143 31,516 42,716 61,418 62,748 48,307
Mobile Insights UEs
P18+ 243,659 243,659 n/a n/a 30,621 42,622 60,813 65,103 44,500
Q2 2016 Universe Estimates (000’s)
DemoBlack Total
Hispanic Total
Asian Am. Total
Total UEs P2+ 40,676 52,112 18,493
RADAR UEs P12+ 34,922 44,371 n/a
Mobile Insights UEs
P18+ 27,164 36,806 11,772
33Copyright © 2016 The Nielsen Company THE NIELSEN TOTAL AUDIENCE REPORT | Q2 2016
TABLE 5 – CROSS PLATFORM HOMES RANKED BY IN-HOME BEHAVIORSource: 04/01/16-06/30/16 via Nielsen NPOWER/Cross Platform Homes Panel for P2+.
Internet and Video Streaming based on home PC only.
TABLE 6 – SMARTPHONE VIDEO VIEWING QUINTILESSource: 04/01/16-06/30/16 via Electronic Mobile Measurement for P18+.
TABLE 7 – TELEVISION DISTRIBUTION SOURCESSource: Based on the weighted intab counts for the 15th of each month within the quarter via
Nielsen NPOWER/National Panel.
Cable Plus is inclusive of Wired Cable, Telco, and Satellite. The sum of Wired Cable, Telco,
and Satellite may be greater than Cable Plus due to homes that have multiple providers.
TABLE 8 – TELEVISION DISTRIBUTION SOURES BY ETHNICITYSource: Based on the scaled installed counts for the 15th of each month within the quarter
via Nielsen NPOWER/National Panel.
Cable Plus is inclusive of Wired Cable, Telco, and Satellite. The sum of Wired Cable, Telco,
and Satellite may be greater than Cable Plus due to homes that have multiple providers.
TABLE 9 – PROVIDER TYPE WITH INTERNET STATUSSource: Based on the weighted intab counts for the 15th of each month within the quarter via
Nielsen NPOWER/National Panel. Broadband access is inclusive of Unknown status.
TABLE 10 – DEVICES IN TV HOUSEHOLDSSource: Based on the scaled installed counts for the 15th of each month within the quarter
via Nielsen NPOWER/National Panel. Enabled Smart TV and Multimedia Device are based
on June 15 2016 for Q2 2016. Multimedia Device is based on October 15 2015 for Q2 2015.
EXHIBIT 3 – MOBILE DEVICE PENETRATION AMONG MOBILE SUBSCRIBERS 13+Source: Mobile 04/01/16-06/30/16 via Nielsen Mobile Insights
Note: IFR represents data that is insufficient for reporting due to small sample sizes. n/a
represents data unavailability.
34 Copyright © 2016 The Nielsen Company
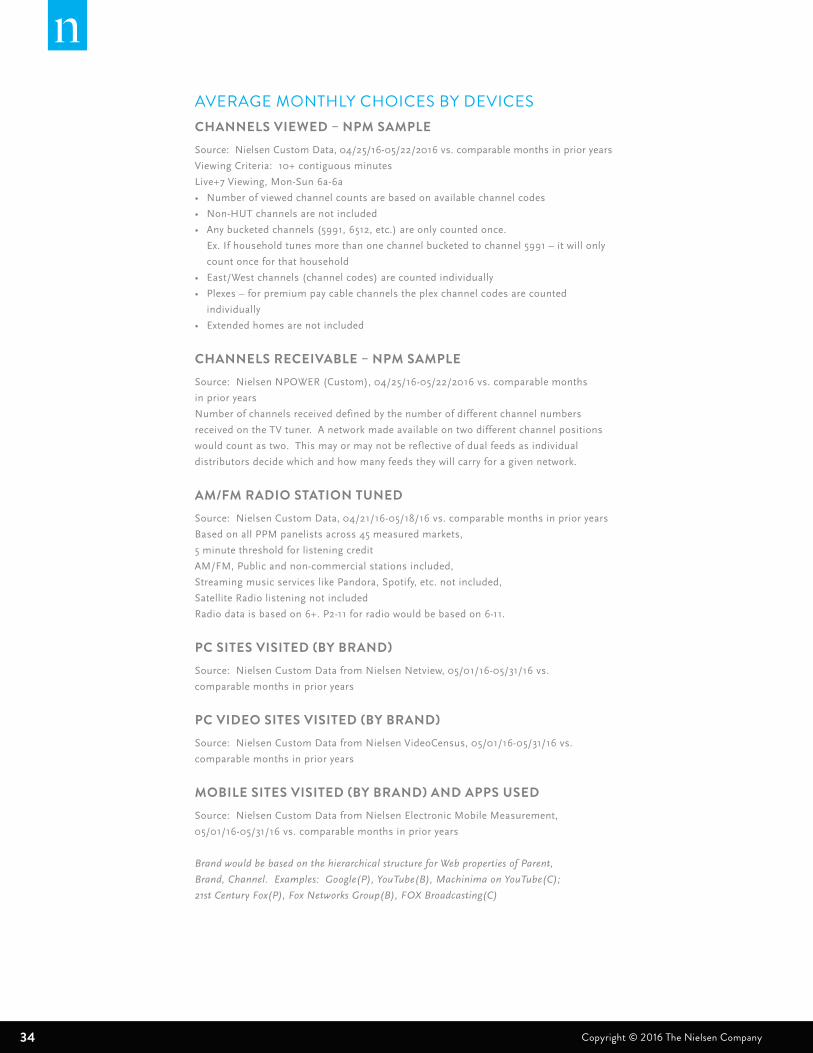
AVERAGE MONTHLY CHOICES BY DEVICESCHANNELS VIEWED – NPM SAMPLESource: Nielsen Custom Data, 04/25/16-05/22/2016 vs. comparable months in prior years
Viewing Criteria: 10+ contiguous minutes
Live+7 Viewing, Mon-Sun 6a-6a
• Number of viewed channel counts are based on available channel codes
• Non-HUT channels are not included
• Any bucketed channels (5991, 6512, etc.) are only counted once.
Ex. If household tunes more than one channel bucketed to channel 5991 – it will only
count once for that household
• East/West channels (channel codes) are counted individually
• Plexes – for premium pay cable channels the plex channel codes are counted
individually
• Extended homes are not included
CHANNELS RECEIVABLE – NPM SAMPLESource: Nielsen NPOWER (Custom), 04/25/16-05/22/2016 vs. comparable months
in prior years
Number of channels received defined by the number of different channel numbers
received on the TV tuner. A network made available on two different channel positions
would count as two. This may or may not be reflective of dual feeds as individual
distributors decide which and how many feeds they will carry for a given network.
AM/FM RADIO STATION TUNEDSource: Nielsen Custom Data, 04/21/16-05/18/16 vs. comparable months in prior years
Based on all PPM panelists across 45 measured markets,
5 minute threshold for listening credit
AM/FM, Public and non-commercial stations included,
Streaming music services like Pandora, Spotify, etc. not included,
Satellite Radio listening not included
Radio data is based on 6+. P2-11 for radio would be based on 6-11.
PC SITES VISITED (BY BRAND)Source: Nielsen Custom Data from Nielsen Netview, 05/01/16-05/31/16 vs.
comparable months in prior years
PC VIDEO SITES VISITED (BY BRAND)Source: Nielsen Custom Data from Nielsen VideoCensus, 05/01/16-05/31/16 vs.
comparable months in prior years
MOBILE SITES VISITED (BY BRAND) AND APPS USEDSource: Nielsen Custom Data from Nielsen Electronic Mobile Measurement,
05/01/16-05/31/16 vs. comparable months in prior years
Brand would be based on the hierarchical structure for Web properties of Parent,
Brand, Channel. Examples: Google(P), YouTube(B), Machinima on YouTube(C);
21st Century Fox(P), Fox Networks Group(B), FOX Broadcasting(C)
35Copyright © 2016 The Nielsen Company THE NIELSEN TOTAL AUDIENCE REPORT | Q2 2016
ABOUT NIELSEN Nielsen Holdings plc (NYSE: NLSN) is a global performance
management company that provides a comprehensive understanding
of what consumers watch and buy. Nielsen’s Watch segment provides
media and advertising clients with Total Audience measurement services
for all devices on which content — video, audio and text — is consumed.
The Buy segment offers consumer packaged goods manufacturers
and retailers the industry’s only global view of retail performance
measurement. By integrating information from its Watch and Buy
segments and other data sources, Nielsen also provides its clients with
analytics that help improve performance. Nielsen, an S&P 500 company,
has operations in over 100 countries, covering more than 90% of the
world’s population.
For more information, visit www.nielsen.com.
Copyright © 2016 The Nielsen Company. All rights reserved. Nielsen and
the Nielsen logo are trademarks or registered trademarks of CZT/ACN
Trademarks, L.L.C. Other product and service names are trademarks or
registered trademarks of their respective companies. 16/10003

36 Copyright © 2016 The Nielsen Company