the nhs and the nhs plan: is the extra money working? a review … · 2016-10-25 · is the extra...
TRANSCRIPT
© CIVITAS Institute for the Study of Civil Society 2006 Author: James Gubb, Civitas
www.civitas.org.uk/nhs/nhsMoney.php 07/2006
1
THE NHS and the NHS PLAN:
IS THE EXTRA MONEY WORKING?
A Review of the Evidence in 2006
_______________________________
James Gubb
Civitas: Institute for the Study of Civil Society July 2006
© CIVITAS Institute for the Study of Civil Society 2006 Author: James Gubb, Civitas
www.civitas.org.uk/nhs/nhsMoney.php 07/2006
2
Contents
_________________________________
Executive Summary 3
Chapter 1: Introduction 5
Chapter 2: How much more is being spent on healthcare? 8
Chapter 3: NHS performance ‘on the government’s terms’ 10
Staffing 10
Facilities 11
Waiting times 16
Cancer 20
Coronary heart disease (CHD) 22
Chapter 4: Looking into the abyss: beyond the targets 25
Gaming 25
Mental health 27
Stroke care 29
Improving patient involvement in care? 30
Chapter 5: Productivity 32
Chapter 6: The international context 37
Health system performance 38
Health outcomes 43
Chapter 7: Too early to make a judgement? 49
Chapter 8: Conclusion 52
Annex 1: The reforms 54

© CIVITAS Institute for the Study of Civil Society 2006 Author: James Gubb, Civitas
www.civitas.org.uk/nhs/nhsMoney.php 07/2006
3
Executive Summary
_________________________________
The extra funding promised for the NHS has been provided; total public spending on the NHS in
England has increased from £44.9bn in the first year of the NHS Plan (2000-01) to £76.4bn five
years later (2005-06), an increase of roughly a third in real terms. At a significant juncture half-way
through the NHS Plan (DoH, 2000) and towards the end of the most significant increases in
funding, this report seeks an answer to the pertinent question: is the extra money working?
The high-profile targets: Nearly all of the high-profile targets the report looks at – staffing,
facilities, waiting times, cancer care and coronary heart disease – nearly all have been met. As a
result the NHS has registered some significant improvements, particularly with regard to waiting
times.
However the report notes a number of caveats even to these achievements, the most significant of
which is the abysmal performance on public health. For example, obesity rates have risen by a
staggering 500% since 1980; nearly 25% of the adult population and 6% of boys and 8% of girls
(aged 2-15years) are now clinically obese.
‘Beyond’ the targets: Looking beyond these targets, the report finds NHS performance is subject
to serious shortcomings, particularly in mental health and stroke care. The general lack of
improvement is paralleled by i) damning statistics provided by the ONS on NHS productivity,
which has almost certainly fallen – possibly by as much as 0.5% per annum even when accounting
for quality – and ii) by insignificant improvement on patient involvement in care.
International comparisons: The report uses the latest OECD Health Data (2006) to compare NHS
performance to that of healthcare providers across the OECD. Crucially, it finds the NHS as a
system remains inferior to other providers and, in many cases, is falling further behind:
Even accounting for recent increases, in 2005 the UK ranked 24th
out of 27 countries in
terms of the number of practicing physicians per 1,000 of the population. Perhaps as a result
the number of surgical procedures in the UK has, incredibly, fallen since 2000 contrary to
almost every other OECD country except Germany.
On the number of age-adjusted CT scanners per million of the population, the UK actually
ranked the lowest in the OECD except Mexico.
The NHS is still a world-leader in terms of access costs, being ‘free at the point of use’, but
despite improvements in waiting times still comes last in a survey of six countries by the
Commonwealth Fund including three other countries – Australia, New Zealand and Canada
– that have traditionally struggled on waiting times.
Patient engagement is also comparatively poor; fewer NHS patients said their doctors
involved them in decisions, were given a care plan to manage their condition or received
opportunistic advice on disease prevention.
The NHS fairs equally badly on health outcomes. Looking at the most recent OECD Health Data
(2006) on mortality rates and ‘potential years of life lost that are a priori preventable’ (PYLL, u-70)
for all disease, health outcomes have improved, but are lacklustre compared to other countries:
© CIVITAS Institute for the Study of Civil Society 2006 Author: James Gubb, Civitas
www.civitas.org.uk/nhs/nhsMoney.php 07/2006
4
On PYLL for under-70s only four out of 26 countries have performed worse than the UK;
UK performance has been so bad that it has fallen two places from 17th
to 19th
on absolute
PYLL between 1999 and 2003.
The UK faired slightly better on mortality rates, but eleven countries still outperformed it
and the UK’s comparative position remains unchanged at a lowly 20th
out of 26 countries.
This poor performance has been reflected in specific diseases. The UK is the only country
of the more advanced nations in the OECD to register virtually no improvement in mortality
rates for stroke care between 1999-2003. Fatalities from strokes are near or above 100%
higher in the UK than Australia, Canada, Japan, Sweden, Switzerland and the US.
The NHS has been less successful than rival health systems in tackling cancer on PYLL for
under-70s, except Australia, the US and France.
The UK has shown the greatest decrease in PYLL for under-70s from coronary heart
disease, which is commendable, but absolute levels are still way in excess of other OECD
countries, with the exception of the US.
That productivity and international performance are so bad dispels the possibility of arguing NHS
‘successes’ outweigh any areas of care that have shown stagnant performance. In the vast majority
of areas improvements in the NHS have in no way increased in proportion to the vast sums of
money ploughed into its coffers. Is the extra money working? To a limited extent one has to say
yes, for there have been achievements; most notably the NHS’ historic inability to deal with long
waits for elective care is apparently being reversed. But is it working anything like one would
hope? Definitely not.

© CIVITAS Institute for the Study of Civil Society 2006 Author: James Gubb, Civitas
www.civitas.org.uk/nhs/nhsMoney.php 07/2006
5
Chapter 1: Introduction
_________________________________
At a significant juncture half way through the NHS Plan (DoH, 2000) and towards the end of the
most significant increases in funding, this report provides a review of NHS performance from
2000-06. It seeks an answer to the questions: is the extra money working and has NHS
performance increased in proportion to its expenditure? To do so the report explores four key
areas, all in terms of both patient experience and health outcomes: services subject to high-profile
targets, services beyond these targets, productivity and NHS performance compared with other
countries.
The NHS Plan (DoH, July 2000) signalled a ten-year period of reform for the NHS, the result of a
government decision to reverse decades of under-investment in the UK health system through
increasing funding ‘by one half in cash terms and one third in real terms over five years’.1 Over
time, the government aimed to bring spending on health up to the EU average; in 1998 total health
expenditure in the UK was just 6.8% of GDP compared with an un-weighted EU average of 7.9%
and an income-weighted EU average of 8.4%.2 Only Luxembourg among EU member states
devoted a smaller share of GDP to health. By contrast Germany spent 10.3%.3
The proposed increase in funding was historically unprecedented, but seen as necessary to
revitalise a cash-strapped and floundering NHS. The Wanless Report (2002), commissioned by
HM Treasury, supported this view and estimated a cumulative shortfall in NHS spending of
£4.4bn over the 1980s and 1990s compared with other EU countries. 4
A comparative study
published by the OECD in 2001 provides evidence of the apparent effects of this. It showed the
UK health system to be in a somewhat depressing state vis-à-vis other developed countries,
revealing substantial differences between the UK and the best performers for key measures such as
life expectancy, infant mortality, premature mortality and survival rates from cancer and heart
disease. The UK also had significantly fewer medical professionals per head of population and
utilised medical technology less. 5
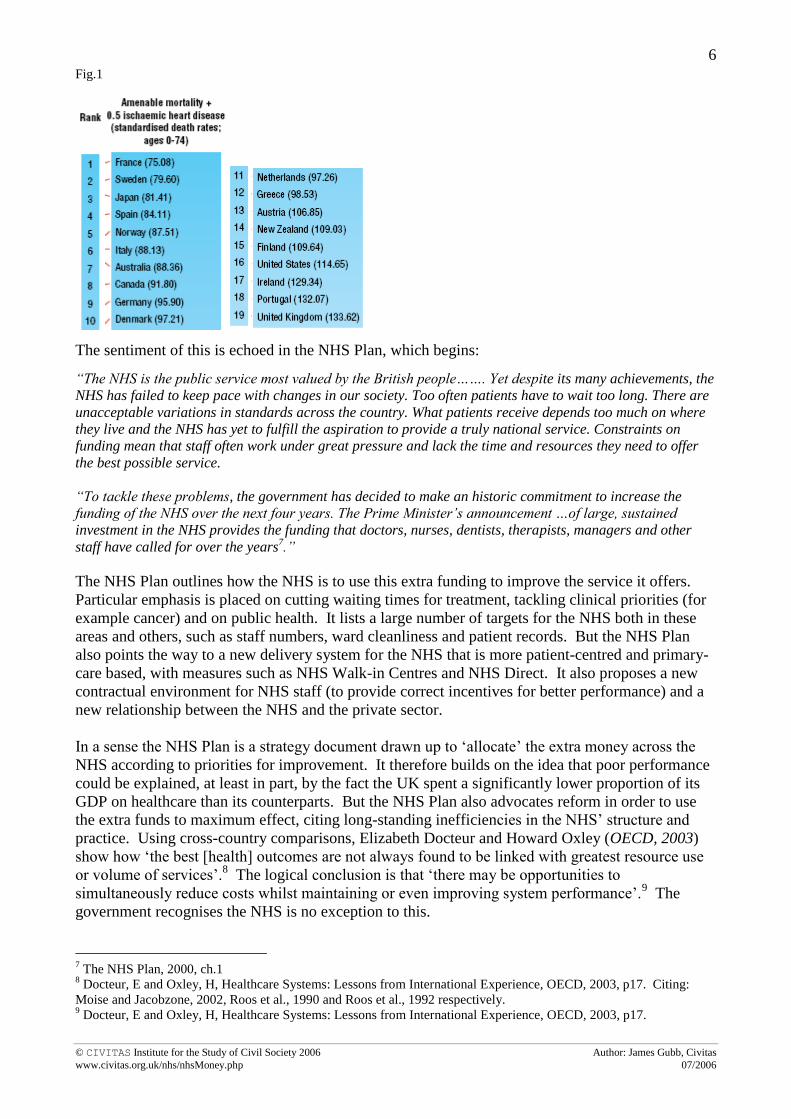
An even more alarming statistic is that calculated by Ellen
Nolte and Martin McKee: on mortality amenable to healthcare the UK was the worst performing
healthcare system surveyed, in 2000:6
1 The NHS Plan, 2000, Introduction by The Rt Hon. Alan Milburn MP, Secretary of State for Health
2 OECD Health Data, 2001 in: Wanless, D, Securing our Future Health: Taking a Long-Term View, Interim Report,
HM Treasury, 2001, ch.5 3 OECD, OECD Health Data 2005
4 Wanless, D, Securing our Future Health: Taking a Long-Term View, Final Report, HM Treasury, 2002, ch.7
5 OECD, OECD Health Data 2001: A Comparative Analysis of 30 Countries, 10th anniversary
6 Nolte, E and McKee, M, Measuring the health of nations: analysis of mortality amenable to healthcare, BMJ,
2003;327. Mortality amendable to healthcare ‘attempts to capture more precisely the actual quality of health services
by using mortality data related to specific conditions that should be preventable through appropriate medical
intervention’. See p.3 for a list of diseases included in this measure.
© CIVITAS Institute for the Study of Civil Society 2006 Author: James Gubb, Civitas
www.civitas.org.uk/nhs/nhsMoney.php 07/2006
6
Fig.1
The sentiment of this is echoed in the NHS Plan, which begins:
“The NHS is the public service most valued by the British people……. Yet despite its many achievements, the
NHS has failed to keep pace with changes in our society. Too often patients have to wait too long. There are
unacceptable variations in standards across the country. What patients receive depends too much on where
they live and the NHS has yet to fulfill the aspiration to provide a truly national service. Constraints on
funding mean that staff often work under great pressure and lack the time and resources they need to offer
the best possible service.
“To tackle these problems, the government has decided to make an historic commitment to increase the
funding of the NHS over the next four years. The Prime Minister‟s announcement …of large, sustained
investment in the NHS provides the funding that doctors, nurses, dentists, therapists, managers and other
staff have called for over the years7.”
The NHS Plan outlines how the NHS is to use this extra funding to improve the service it offers.
Particular emphasis is placed on cutting waiting times for treatment, tackling clinical priorities (for
example cancer) and on public health. It lists a large number of targets for the NHS both in these
areas and others, such as staff numbers, ward cleanliness and patient records. But the NHS Plan
also points the way to a new delivery system for the NHS that is more patient-centred and primary-
care based, with measures such as NHS Walk-in Centres and NHS Direct. It also proposes a new
contractual environment for NHS staff (to provide correct incentives for better performance) and a
new relationship between the NHS and the private sector.
In a sense the NHS Plan is a strategy document drawn up to ‘allocate’ the extra money across the
NHS according to priorities for improvement. It therefore builds on the idea that poor performance
could be explained, at least in part, by the fact the UK spent a significantly lower proportion of its
GDP on healthcare than its counterparts. But the NHS Plan also advocates reform in order to use
the extra funds to maximum effect, citing long-standing inefficiencies in the NHS’ structure and
practice. Using cross-country comparisons, Elizabeth Docteur and Howard Oxley (OECD, 2003)
show how ‘the best [health] outcomes are not always found to be linked with greatest resource use
or volume of services’.8 The logical conclusion is that ‘there may be opportunities to
simultaneously reduce costs whilst maintaining or even improving system performance’.9 The
government recognises the NHS is no exception to this.
7 The NHS Plan, 2000, ch.1
8 Docteur, E and Oxley, H, Healthcare Systems: Lessons from International Experience, OECD, 2003, p17. Citing:
Moise and Jacobzone, 2002, Roos et al., 1990 and Roos et al., 1992 respectively. 9 Docteur, E and Oxley, H, Healthcare Systems: Lessons from International Experience, OECD, 2003, p17.
© CIVITAS Institute for the Study of Civil Society 2006 Author: James Gubb, Civitas
www.civitas.org.uk/nhs/nhsMoney.php 07/2006
7
Although much of the NHS reform is still ongoing and some way from completion, the fact that the
NHS has been subject to both reform and significant increases in money means it is reasonable to
expect, at the very least, tangible improvements in the services it provides. However, it should be
pointed out at this stage that, whilst a picture of the reforms is necessary to place analysis in its
proper context, this report does not seek (at least primarily) to provide an in-depth critique of the
reforms and their effectiveness. Nor does it aim to describe why the extra money is or is not
working, although explanations will inevitably suggest themselves. This report solely seeks an
answer to the question: is the extra money working?
To do so it seeks answers to the following questions, vital to any ‘value for money’ assessment of
the NHS:
How much more is being spent on healthcare?
Have the government’s key targets for the NHS been met?
Has NHS performance improved beyond the targets, in particular:
a. Has NHS performance improved where there has not been explicit targets?
b. Has patient experience improved?
c. Has productivity improved?
Has the NHS improved vis-à-vis other countries?
Is it, after all, too early to reach a reasonable conclusion, given that reforms are ongoing?
An overview of the reforms to date is found in Annex 1. In answering these questions the
preference of this report will be to use wherever possible statistics that discount effects which are
not related to the health system in favour of those that aim to focus solely on health-related
matters. For example, measures such as mortality from disease and potential years lost to disease
will be preferred to simple life expectancy or infant mortality. This enables the effect of the NHS
on health outcomes to be isolated as much as possible from any external effects.
Promises of extra funding provided the NHS with a unique opportunity to improve its performance
across the board and become a truly world-class healthcare system. Has it grasped the
opportunity?

© CIVITAS Institute for the Study of Civil Society 2006 Author: James Gubb, Civitas
www.civitas.org.uk/nhs/nhsMoney.php 07/2006
8
Chapter 2:
How much more is being spent on healthcare? __________________________________
The answer is a lot more. The government has kept its promise of extra money for the NHS and
has, by and large, delivered the amount it set out to provide in the NHS Plan. Fig. 2 illustrates
how total public spending on the NHS in England has increased from £44.9bn in the first year of
the NHS Plan (2000-01) to £76.4bn five years later (2005-06).10
This represents an increase of
just under half in cash terms and just under a third in real terms (taken at 2004-05 price levels,
using GDP deflators) as was promised in the NHS Plan.11
Significant increases in the NHS
budget are set to continue until at least 2007-08. The five-year settlement announced in the 2002
Budget (2002/03- 2007/08) will see expenditure in the NHS rising at an average of 7.3 per cent per
annum in real terms, projected to reach £92.6 billion by 2007-08.12
Fig.213
Fig.3 shows there has been a corresponding increase in total public expenditure on health, which
has risen from £54.3bn in 2000-01 to £89.4bn in 2005/6.14
Public health expenditure now stands
at 7.3% of GDP, up from 5.6% in 2000-01.15
Fig.3
10
Department of Health: Departmental Report 2005, ch.3. 11
HM Treasury, Public Expenditure Statistical Analyses 2006, ch.1. 12
National Audit Office, Financial Management in the NHS 2004/5, London: NAO, 7 June 2006. Available at:
http://www.nao.org.uk/publications/nao_reports/05-06/05061092_I.pdf 13
Department of Health: Departmental Report 2005, ch.3 14
HM Treasury, Public Expenditure Statistical Analyses 2006, Table 3.2. Total public expenditure on health includes
that on the NHS, but also and other health expenditure, for example public health campaigns, NHS pensions, personal
social services and the Food Standards Agency. 15
HM Treasury, Public Expenditure Statistical Analyses 2006, Table 3.4.
Total Public Spending

© CIVITAS Institute for the Study of Civil Society 2006 Author: James Gubb, Civitas
www.civitas.org.uk/nhs/nhsMoney.php 07/2006
9
The OECD Health Data series shows similar trends. In 2000, health expenditure (including
private expenditure) in the UK as a percentage of GDP was 7.3 per cent; by 2005 it was 8.3%.16
Similarly, health expenditure per capita rose from below the OECD average at around $1,750 in
2000 to closely matching the OECD average at $2,54617
in 2004 (per capita, US$ purchasing
power parity).
Summary
The government has met its promise of extra funds for the NHS, providing for huge investment,
way in excess, for example, of the £4.4bn shortfall described in the Wanless Report.18
It is worth
re-emphasising: in the past five years the NHS has had an extra £31.5bn pumped into it, almost
doubling its expenditure. Has performance followed suit?
16
OECD, OECD Health Data 2006- How does the UK compare, June 2006. The public-private mix of health
expenditure remained fairly constant at around 83% to 17% respectively. 17
OECD, OECD Health Data 2006- How does the UK compare, June 2006 18
Wanless, D, Securing our Future Health: Taking a Long-Term View, Final Report, HM Treasury, 2002, ch.7

© CIVITAS Institute for the Study of Civil Society 2006 Author: James Gubb, Civitas
www.civitas.org.uk/nhs/nhsMoney.php 07/2006
10
Chapter 3:
NHS performance ‘on the government’s terms’
_________________________________
The NHS Plan (and other subsequent documents) contained a number of targets that the NHS and
its organisations were expected to meet, given the extra money at its disposal. The targets cover
all manner of things from staffing levels to long-term targets for the reduction of mortality rates
for cancer and coronary heart disease (CHD). Taken as a whole they represent the areas in which
the NHS was perceived to be failing its patients the most.
This section takes a look at how well the NHS has done in meeting certain key targets. Such an
analysis of NHS performance is ‘on the government’s terms’ because the targets, although
generally having a clincial basis, were laid down by the government as its priorities for the NHS.
In this respect they represent the bare, though significant, minimum the NHS should have
achieved.
Staffing
The NHS Plan states boldly that: ‘between now and 2004 there will be:
7,500 more consultants,
2,000 more GPs,
20,000 more nurses,
over 6,500 more therapists and other health professionals [in the NHS]’.19
Sir Ian Carruthers in the Chief Executive’s Report to the NHS (2006) states: ‘In September 2005
there were over 1.3 million people employed in the NHS, which represents an increase of over
307,000 people since 1997. Between September 1997 and September 2005, the total number of
doctors employed in the NHS increased by over 32,700 and the number of nurses by 85,300’.20
Within this period (and specific to the targets in the NHS Plan), the number of GPs and nurses
increased by 3,050 and 68,000 respectively between 1999-2004.21
The number of consultants
working in the NHS also increased by 7,330 to 30,650,22
and the number of allied health
professionals (such as physiotherapists, dieticians and radiographers) by 11,040 to 58,960.23
The
targets have been achieved.
However there are two points that should be noted. Firstly, alongside the increases in clinical
staff, the number of non-clincial staff has also increased significantly. For example, NHS
management has increased from 12,273 to 33,810 between 1997-2003; an increase of 58%.24
As a
percentage of NHS staff, this represents an increase of 3.2%. The value for money of this increase
19
The NHS Plan 2000, para.5.4 20
Sir Ian Carruthers, Chief Executive Report to the NHS, June 2006, ch.5
http://www.dh.gov.uk/PublicationsAndStatistics/Publications/PublicationsPolicyAndGuidance/PublicationsPolicyAndG
uidanceArticle/fs/en?CONTENT_ID=4135795&chk=90vhdh 21
DoH, Chief Executive Report to the NHS- Statistical Supplement, June 2006, Table 5.1 22
Healthcare Commission, The State of Healthcare 2005, ch.1. Available at:
http://www.healthcarecommission.org.uk/nationalfindings/stateofhealthcare.cfm 23
Healthcare Commission, The State of Healthcare 2005, ch.1 24
Department of Health (2003). NHS HCHS AND GP Workforce. London: Department of Health. Available at:
http://www.publications.doh.gov.uk/public/master-tables-sept-2003.xls

© CIVITAS Institute for the Study of Civil Society 2006 Author: James Gubb, Civitas
www.civitas.org.uk/nhs/nhsMoney.php 07/2006
11
is at best questionable, despite the suggestion of the King’s Fund that the NHS may well have been
‘under-managed’ previously.25
Secondly it appears the increase in the number of nurses employed by the NHS may be excessive
given recent job losses. In March and April 2006, 7,000 jobs were cut in the NHS, with the Royal
College of Nursing (RCN) predicting 13,000 more. An RCN survey conducted in April of 660
hospital-based senior nurses revealed that 45 per cent said there had been redundancies or a
reduction in nursing posts where they work.26
This is not necessarily the fault of the target,
because the increase in nurses has been far in excess of it, but something has gone wrong, most
likely in the hospital management directly responsible for budgeting and staffing levels. Despite
the increases, a Healthcare Commission patient survey in 2005 actually revealed as little as 58 per
cent of patients thought there were ‘always’ or ‘nearly always’ enough nurses on duty to care for
them in hospital, with 11% saying there were ‘rarely or never enough’.27
Facilities
The NHS Plan promised to provide:
7,000 extra NHS beds by 2004, of which 2,100 to be in general and acute wards and 5,000
in intermediate care.
50 new MRI scanners to increase procedures by 190,000
200 new CT scanners – 150 replacement plus 50 additional – to increase procedures by
240,000
over 100 new hospitals by 2010
modern IT in every hospital and GP surgery
clean wards, better food.28
Hospital beds
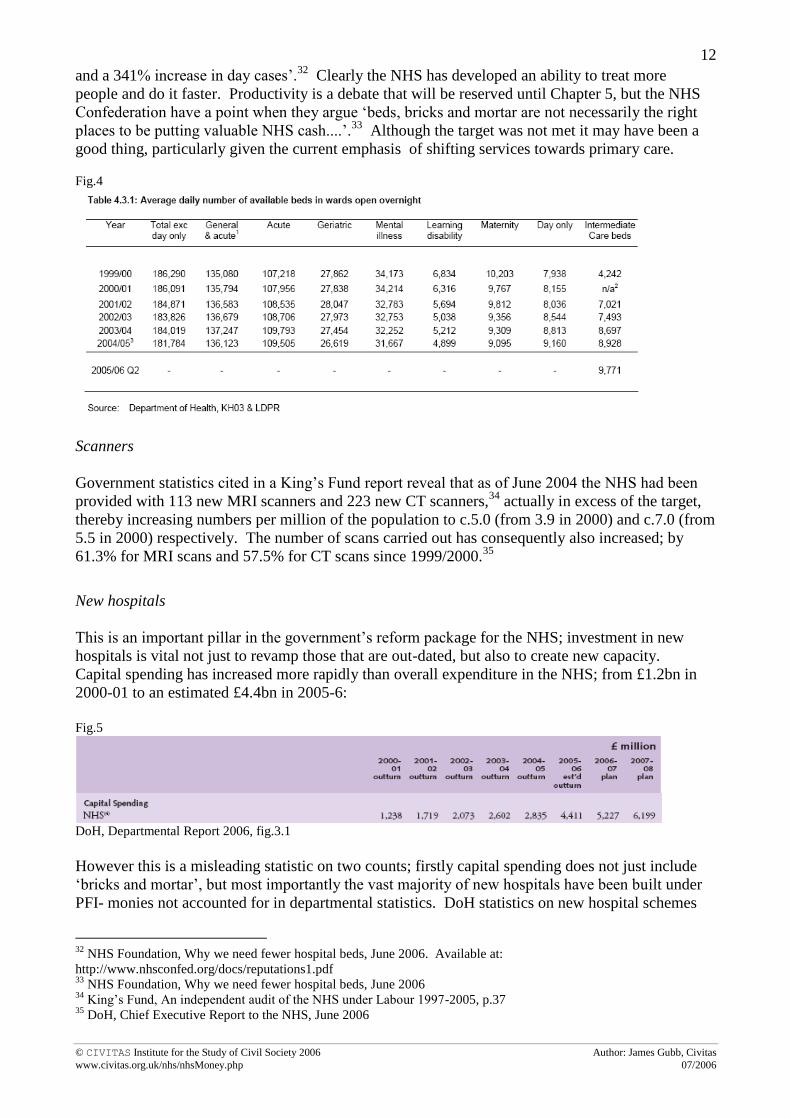
Even with the best political spin it is not possible to argue that the number of NHS beds has
increased by 7,000 since the publication of the NHS Plan in 2000; in fact the general trend of
falling beds has continued. Fig.5 shows how the total number of available beds has actually fallen
from 186,091 in 2000/01 to 181,784, a loss of 4,307 beds (fig.4).29
The target has not been met,
but this can be qualified. Firstly, there has been an increase in the number of acute beds by 1,549
and the number of intermediate care beds by 4,68630
- not too far from the targets of 2,100 and
5,000 by 2004 respectively (though still less). The number of critical care beds have also
increased from 2,343 to 3,278 as of January 2006.31
Thus nearly 7,000 extra beds have been
provided in the areas targeted; the problem for the government is that another 9,000 or so were
taken away from other sectors.
Secondly, whatever the intention of the NHS Plan, it is not clear the government was correct in
calling for an overall increase of 7,000 beds. At the same time as the number of hospital beds has
fallen over the last twenty years by 31 per cent, ‘hospitals have seen a 57% increase in inpatients
25
The King’s Fund, An Independent Audit of the NHS under Labour (1997-2005), March 2005, p.62 26
http://news.bbc.co.uk/1/hi/health/4931626.stm. See also: http://news.bbc.co.uk/1/hi/uk/4893874.stm and
http://www.guardian.co.uk/uk_news/story/0,,1809134,00.html 27
Healthcare Commission, Patient Survey: inpatients, 2005 28
The NHS Plan 2000, ch.4 29
DoH, Chief Executive Report to the NHS- Statistical Supplement, June 2006, Table 4.3.1 30
DoH, Chief Executive Report to the NHS- Statistical Supplement, June 2006, Table 4.3.1 31
Department of Health, NHS Performance Statistics, Form KH03a. Available at: http://www.performance.doh.gov.uk/hospitalactivity/data_requests/download/critical_care_beds/ccbed_ts.xls
© CIVITAS Institute for the Study of Civil Society 2006 Author: James Gubb, Civitas
www.civitas.org.uk/nhs/nhsMoney.php 07/2006
12
and a 341% increase in day cases’.32
Clearly the NHS has developed an ability to treat more
people and do it faster. Productivity is a debate that will be reserved until Chapter 5, but the NHS
Confederation have a point when they argue ‘beds, bricks and mortar are not necessarily the right
places to be putting valuable NHS cash....’.33
Although the target was not met it may have been a
good thing, particularly given the current emphasis of shifting services towards primary care.
Fig.4
Scanners
Government statistics cited in a King’s Fund report reveal that as of June 2004 the NHS had been
provided with 113 new MRI scanners and 223 new CT scanners,34
actually in excess of the target,
thereby increasing numbers per million of the population to c.5.0 (from 3.9 in 2000) and c.7.0 (from
5.5 in 2000) respectively. The number of scans carried out has consequently also increased; by
61.3% for MRI scans and 57.5% for CT scans since 1999/2000.35
New hospitals
This is an important pillar in the government’s reform package for the NHS; investment in new
hospitals is vital not just to revamp those that are out-dated, but also to create new capacity.
Capital spending has increased more rapidly than overall expenditure in the NHS; from £1.2bn in
2000-01 to an estimated £4.4bn in 2005-6:
Fig.5
DoH, Departmental Report 2006, fig.3.1
However this is a misleading statistic on two counts; firstly capital spending does not just include
‘bricks and mortar’, but most importantly the vast majority of new hospitals have been built under
PFI- monies not accounted for in departmental statistics. DoH statistics on new hospital schemes
32
NHS Foundation, Why we need fewer hospital beds, June 2006. Available at:
http://www.nhsconfed.org/docs/reputations1.pdf 33
NHS Foundation, Why we need fewer hospital beds, June 2006 34
King’s Fund, An independent audit of the NHS under Labour 1997-2005, p.37 35
DoH, Chief Executive Report to the NHS, June 2006

© CIVITAS Institute for the Study of Civil Society 2006 Author: James Gubb, Civitas
www.civitas.org.uk/nhs/nhsMoney.php 07/2006
13
(costing above £10m) reveal that some £18.5bn has been (or will imminently be) spent in this
manner, of which only £1bn has come from pure public funding. As of May 2006, fifty PFI
schemes were operational, 31 were currently carrying out building work, with an additional 49
either nearing finanicial close or in the pipeline. A further 12 public schemes were either
completed or awaiting construction.36
These statistics do, of course, refer both to new hospital
builds and the reconstruction of existing hospitals. Statistics on new hospital builds alone are
suprisingly difficult to come by; a DoH press release showed 13 had been built by 2002, but this is
far from up-to-date. There is also a fierce debate raging about the long-term implications and cost
benefits of PFI,37
but it is clear massive investment has been channelled towards new (or ‘new’)
hospitals, with over one hundred hospital (re-) building schemes either completed on in-process.
Significant investment has also reached the primary care sector, with an estimated 3,000 GP
practices either refurbished or re-built since 2000. Investment is currently focused on building
new NHS ‘health surgeries’ and refurbishing community hospitals, with just over £1bn in funding
already approved as part of the government’s initiative to shift more services into primary care.38
The private sector is again being utilised in this sector to provide extra funds, through NHS LIFT.
Information Technology (IT)
The target concerning IT is interesting because it does not feature in the current DoH Public
Service Agreement targets, nor supporting targets, despite being named as one in the NHS Plan.39
The NHS IT strategy is embodied in the National Programme for Information Technology in the
NHS (NPIT), the core of which is the NHS Care Records Service. This will enable any healthcare
professional treating a patient to access that patient’s medical record.
Whilst the realisation of benefits from NPIT is largely a matter for the future, it should be noted
that the National Audit Office (NAO) has, so far, largely commended the government’s
performance on the programme. Contracts for equipment and software were negotiated on-time,
to budget- £6.2bn- and in such a way as to transfer the main financial risks onto the (private)
suppliers. This has helped to ensure that so far the NPIT is on, or ahead, of schedule. For example
14,130 connections to the New National Network were made by March 2006, above the 12,000
target. NHSmail now has 80,000 active users and 45,000 NHS staff are accessing the NHS Care
Record Spine everyday.40
Nonetheless, official statistics can be somewhat misleading. As part of the government’s strategy to
expand patient choice (and reduce waiting times) a particular target in NPIT was to ensure, by the
end of 2005, that every hospital appointment would be booked for the convenience of the patient
(rather than being put on a waiting list for treatment). In January 2006 government statistics show
the number of day cases booked was 99.6 per cent, with the same statistic for inpatients and
36
http://www.dh.gov.uk/ProcurementAndProposals/PublicPrivatePartnership/PrivateFinanceInitiative/NewHospitalSche
mes/fs/en 37
For example, a number of NAO reports looking at individual PFI-funded hospitals seek to address this issue.
Available at: www.nao.org. The Paddington Health Campus Scheme (June 2006) and the Darent Valley Hospital (Feb
2005) reports provide interesting contrasts. See also:
http://www.bma.org.uk/ap.nsf/Content/Healthcare+funding+review+research+report+7~healthcare+funding+review+re
search+report+7+-+pfi 38
http://www.dh.gov.uk/PublicationsAndStatistics/PressReleases/PressReleasesNotices/fs/en?CONTENT_ID=4133098
&chk=6B0FNM 39
National Audit Office, National Programme for IT in the NHS, June 2006 40
Deployment statistics- NHS Connecting for Health National Programme Office

© CIVITAS Institute for the Study of Civil Society 2006 Author: James Gubb, Civitas
www.civitas.org.uk/nhs/nhsMoney.php 07/2006
14
outpatients at 99.5% and 98.8% respectively.41
Yet the proposed use of the NPIT ‘Choose and
Book’ system to achieve this has been found wanting to say the least. The ‘Choose and Book’
system allows patients to book hospital appointments online from their GP surgeries, choosing an
appointment at a place, date and time of their convenience; as of 3 April 2006, 291,983, or 12 per
cent of, appointments were booked in this way.42
However a BBC ‘File on 4’ survey in May 2006
revealed that half the 340 GPs interviewed thought the system was either ‘poor’ or ‘very poor’.43
Ninety per cent of the GPs were also of the view that they had not been properly consulted by the
government about ‘Choose and Book’.44
Dr Nigel de Kare Silver, a GP in Brent, told the
programme that he will have to scrap a computer system that is already in use in his practice and
replace it with the NPIT system that he thinks is ‘a step backwards and [potentially] dangerous for
patients’. A particularly embarrassing moment occurred when a supporter of ‘Choose and Book’,
Dr Andrew Langton a GP in Avon, was explaining the system ‘on air’ when it crashed.45
Proper consultation is a problem concerning NPIT as a whole; Sir John Bourn, the head of the
NAO has publicly criticised the DoH for ‘failure to take the NHS with the system’. Lord Warner,
the health minister, has also been quoted in the media saying that with the costs of training staff,
NPIT’s costs could run to £20bn over the next ten years.46
Whether such costs materialise or not is
yet to be seen; the NAO do calculate a more reserved estimate of £12.4bn. In terms of the targets
laid out for NPIT, the programme thus far appears to be on course and on budget, but problems are
very much brewing under the surface.
Clean wards
As part of the NHS Plan, every NHS Trust was required to prepare detailed action plans to
improve the ‘patient environment’, in particular cleanliness. It is estimated that since the NHS
Plan over £68m has been invested in this regard.47
Clean wards are vital not just for patient
satisfaction, but also for restricting the risk of hospital-acquired infection such as MRSA. The
specific target, first agreed with HM Treasury in the Comprehensive Spending Review (CSR)
1998, is simply to ‘secure year-on-year improvements in patient satisfaction and experience....
using independently audited local surveys’.48
Such surveys either ask patients to rate their
impressions of cleanliness during their stay in hospital, or are the result of inspection by auditors.
The main government inspectorate for cleanliness is PEAT (patient environment action teams),
who carry out periodic reviews of hospital cleanliness, looking at a range of twenty-four patient
environment issues relating to wards, outpatients, furnishings etc. The PEAT reviews have
reported progressive improvements in scores for cleanliness in hospitals in England over the past
few years. Between the autumn 2000 and 2003 surveys, the number of hospitals achieving ‘green’
status improved from 163 (22.3%) to 686 (78.7%). No hospital had ‘red’ status by 2003. Using a
new system to present its results for 2004 and 2005, PEAT found that between these years the
number of hospitals scoring ‘excellent’ or ‘good’ increased (those in the ‘good’ category markedly
41
DoH, Departmental Report 2006, ch.2, Table: DH (SR 2004) Standards. Available at:
http://www.dh.gov.uk/PublicationsAndStatistics/Publications/AnnualReports/DHAnnualReportsArticle/fs/en?CONTEN
T_ID=4134613&chk=KQuYrZ 42
NAO, National programme for IT in the NHS, June 2006, Executive summary 43
http://news.bbc.co.uk/1/hi/health/5028762.stm 44
http://news.bbc.co.uk/1/hi/programmes/file_on_4/3754064.stm 45
http://news.bbc.co.uk/1/hi/programmes/file_on_4/3754064.stm 46
http://www.guardian.co.uk/guardianpolitics/story/0,,1799064,00.html, 16 June 2006. 47
http://patientexperience.nhsestates.gov.uk/clean_hospitals/ch_content/home/home.asp 48
DoH, Departmental Public Service Agreement Targets (CSR 1998) in: DoH, Departmental Report 2005. Available
at:
http://www.dh.gov.uk/PublicationsAndStatistics/Publications/AnnualReports/DHAnnualReportsArticle/fs/en?CONTEN
T_ID=4113725&chk=1krOlR

© CIVITAS Institute for the Study of Civil Society 2006 Author: James Gubb, Civitas
www.civitas.org.uk/nhs/nhsMoney.php 07/2006
15
so), although the number of ‘poor’ ratings also increased as hospitals tended to diverge up-and-
down from ‘acceptable’:49
Fig.6
Other surveys have not painted such good pictures. A recent ‘visual’ inspection carried out by the
Healthcare Commission in 2005, which looked at 99 hospitals in England, found just over a third
of hospitals to be in ‘Band 1’ with ‘high standards of cleanliness across the board’. A further 43%
were placed in ‘Band 2’ ‘not considered seriously dirty, but with room for improvement’.50
However over 20% were in either ‘Band 3’ or ‘Band 4’ where either a ‘lack of cleanliness was
widespread’ or there were ‘serious problems in relation to cleanliness’.51
There is a downward
bias in the survey sample; the Healthcare Commission purposefully selected 61 NHS hospitals
with the worst scores for cleanliness in an attempt to identify trends in shortcomings, and the worst
instances of cleanliness were all in NHS mental health and community hospitals.52
However patient surveys have also shown disagreement with PEAT inspections, indicating
relatively stable perceptions of hospital cleanliness since the NHS Plan. The majority (92%) of
patients in a separate Healthcare Commission survey in 2005 felt their hospital room or ward was
either very clean or fairly clean, identical to statistics for 2002.53
The Picker Institute report
similar findings; in 2004 54% of inpatients said the ward they were in was very clean, slightly
fewer than in 2002 when 56% reported the same.54
However, a persistent minority remains
unsatisfied. The Healthcare Commission survey revealed that 8% of those surveyed in both 2002
and 2005 stated their ward was either ‘not very clean’ or ‘not clean at all’.55
A separate bedside
patient survey, in the same 99 hospitals mentioned above, showed significantly worse results of 17
per cent.56
49
http://patientexperience.nhsestates.gov.uk/clean_hospitals/ch_content/home/home.asp. Until 2003 a traffic-light
scoring system was used, but since then the range of standards has broadened to include five categories. 50
Healthcare Commission, A Snapshot of Hospital Cleanliness, 2005, p. 11. Available at:
http://www.healthcarecommission.org.uk/_db/_documents/04021935.pdf. The 99 hospitals included 37 NHS acute
hospitals, 11 independent acute hospitals, 33 NHS mental health and community hospitals and 17 independent mental
health hospitals. 51
Healthcare Commission, A Snapshot of Hospital Cleanliness, 2005, p. 12. 52
It is interesting also to note that the survey found no links between cleaning ‘systems’ (e.g. of auditing,
‘housekeeping’ roles and whether services were contracted out) and the level of cleanliness, HC (2005) p.19. 53
Healthcare Commission, Survey of Patients 2005: Services for inpatients, p.3. Available at:
http://www.healthcarecommission.org.uk/nationalfindings/surveys/patientsurveys/nhspatientsurvey2005/inpatientsurve
y2005.cfm 54
Coulter, A, Trends in patients’ experience of the NHS, Picker Institute Europe, 2005, p.7 55
Healthcare Commission, Survey of Patients 2005: Services for inpatients, p.3 56
Healthcare Commission, A Snapshot of Hospital Cleanliness, 2005, p. 15. This finding is of course subject to the
caveat that the survey purposefully included 61 of the worst performing hospitals in a sample of 99 hospitals.
Red
(poor)
Yellow
(acceptable)
Green
(good)
Autumn
2000
253
(35.5%) 297 (41.7%)
163
(22.3%)
Spring
2001 42 (6.1%) 368 (53.4%)
279
(40.5%)
Autumn
2001 0 (0%) 387 (56.3%)
300
(43.7%)
2002 0 (0%) 317 (40%) 464 (60%)
2003 0 (0%) 186 (21.3%) 686
(78.7%)
Excellent Good Acceptable Poor Unacceptable
2004 10.0% 38.5% 49.2% 2.0% 0.3%
2005 10.3% 44.8% 40.1% 4.6% 0.2%
© CIVITAS Institute for the Study of Civil Society 2006 Author: James Gubb, Civitas
www.civitas.org.uk/nhs/nhsMoney.php 07/2006
16
It is difficult to know exactly how to intepret the mismatch between the stagnant picture of
cleanliness in patient surveys and the improving performance shown in inspection evidence,
particularly that of PEAT. It is possible that patients are developing higher expectations of what is
an acceptable level of cleanliness for healthcare, particularly due to the huge publicity that the rise
in hospital-acquired infections has received. Patients are also, as a rule, in hospitals for longer
than inspectors and their perceptions are likely to be changed by isolated incidents of un-
cleanliness, that one-off inspections may miss. Either way we should conclude that evidence of
year-on-year increases in cleanliness (the government target) is mixed. Even if the PEAT results
are taken at face value, we must add the important caveat that a small, but signifcant proportion of
hospitals are not sufficiently clean.
Summary
Whilst there is a larger element of doubt than on staffing numbers, the NHS has either largely met,
or is on course to meet, its targets on facilities. The number of acute and critical care beds have
increased broadly in line with targets, more MRI and CT scanners have been acquired than
targeted, an extensive hospital build and reconstruction programme is in process and cleanliness
has apparently increased. The major concerns must be over NPIT, which shows signs of
problems, and the fact patients have not ‘seen’ increases in cleanliness, if indeed PEAT surveys
are to be believed.
Waiting times
Perhaps the overriding aim of the NHS Plan is to achieve faster patient access to NHS services,
particularly through cutting waiting times. The government set out to:
Reduce the maximum waiting time for inpatient treatment to six months by 2005 and to
three months by 2008,
Reduce the maximum waiting time for an outpatient appointment to three months by 2005,
Guarantee access to a GP within 48 hours by 2004,
Reduce the maximum wait in A&E from arrival to admission, transfer or discharge to 4
hours by the end of 2004.57
Inpatients
An OECD study into variations in waiting times for elective surgery across OECD countries found
statistically significant relationships between waiting times and health expenditure per capita,
between waiting times and the number of acute care beds and between waiting times and the
number of practising physicians.58
There are of course exceptions to each of these correlations but
it has been shown health expenditure per capita, the number of acute beds and the number of
practising physicians per capita have all increased in the NHS. It would therefore be incredible if
inpatient waiting times had not fallen.
Thankfully for the NHS they have. In 2005/06 there were 10.4 million general and acute
admissions to hospital of which 5.7 million were elective (including waiting list, booked and
planned admissions). This compares to 9.0 million and 5.0 million respectively in 2000/01.59
Despite this increase the number of patients waiting longer than six months for inpatient treatment
57
DoH, Departmental Report 2005, Departmental Public Service Agreement Targets, ch.2, pg.13-24. 58
Siciliani, L and Hurst, J, Explaining waiting times for elective surgery across OECD countries, OECD Health
Working Paper: 7, 2004 59
DoH, Chief Executive Report to the NHS- Statistical Supplement, June 2006, Table 3.5.6

© CIVITAS Institute for the Study of Civil Society 2006 Author: James Gubb, Civitas
www.civitas.org.uk/nhs/nhsMoney.php 07/2006
17
fell from over 270,000 in 2000 to just 97 in December 2005, according to official DoH statistics.60
The figure for April 2006 is 144 (fig.7). The government target has by and large been met.
Fig.761
The decrease in those waiting over six months for inpatient treatment has also been accompanied by
a decrease in the median waiting time from 12.9 weeks in March 2000 to 7.3 weeks in March
2006.62
This figure is significant as it implies the government target of a maximum wait of three
months for inpatient treatment should be obtainable.
Outpatients
Official government statistics show that the target of a maximum waiting time of three months, or
13 weeks, for an outpatient appointment has now been met. As of March 2006, only 126 people
were waiting longer than 13 weeks, of which 109 were English patients waiting for admission to
Welsh hospitals:63
Fig.8
64
The median outpatient waiting time witnessed a parallel decrease; from 7.46 weeks to 6.13 weeks.65
In fact over 83 per cent of outpatients were, as of March 2006, waiting under eight weeks for a first
60
DoH, Chief Executive Report to the NHS- Statistical Supplement, June 2006, Table 3.5.2 61
DoH, Chief Executive Report to the NHS, June 2006, ch.1 62
DoH, Chief Executive Report to the NHS- Statistical Supplement, June 2006, Table 3.5.3 63
DoH, Chief Executive Report to the NHS- Statistical Supplement, June 2006, Table 3.3.2. All statistics, unless
otherwise stated, in the statistical supplement refer to England. Welsh hospitals were not originally subject to targets as
was the case with English hospitals, although targets were later introduced in late 2001. 64
DoH, Chief Executive Report to the NHS, June 2006, Ch.1 65
DoH, Chief Executive Report to the NHS- Statistical Supplement, June 2006, Table 3.3.1

© CIVITAS Institute for the Study of Civil Society 2006 Author: James Gubb, Civitas
www.civitas.org.uk/nhs/nhsMoney.php 07/2006
18
outpatient appointment. This is despite outpatient activity, measured as the number of first
outpatient attendances, increasing by an average of 2.1 per cent per annum between 1999/01 to
2005/06 to 13.7 million.66
Data manipulation
There is one matter that detracts from the achievements on inpatient and outpatient waiting times
and deserves specific attention; data manipulation. The Audit Commission have reported that
‘errors’ in NHS Trust data are prevalent. For example, 41 per cent of doctors involved in the
validation of clinical coding agreed with the statement ‘The information on the Trust’s IT system is
often inaccurate’.67
Being cynical it is hard to imagine that too many of these errors have been to
the detriment of NHS Trusts meeting their targets on waiting times; indeed the Audit Commission
also uncovered isolated instances of outright and deliberate manipulation of data. Bolton NHS
Trust is a case in point. Auditors found that ‘waiting list breaches (patients who had waited longer
than the maximum waiting time), had been inappropriately and knowingly omitted from both
internal and external reports’.68
An investigation by the Trust’s SHA concurred with this view. But
Bolton NHS Trust does not stand alone. Earlier reports by both the Audit Commission and the
NAO reveals that nine other NHS Trusts had ‘inappropriately’ adjusted their waiting lists69
, three
others had deliberately misreported waiting list information and 19 Trusts had significant reporting
errors in at least one indicator.70
Nonetheless the Audit Commission does not suggest the majority of inaccuracies are deliberate, but
rather the result of unclear policy and procedure, a lack of staff training and/or archaic Patient
Administration Systems. It states: ‘the reality of data collection in the NHS is that it is achieved
through the work of thousands of frontline and support staff in the course of their day-to-day
work’.71
Deliberate data manipulation has only been uncovered in a minority of Trusts; a
sufficiently small minority that the Audit Commission, in the same 2004 report, is happy to
conclude the scale of reporting errors in targeted areas of care ‘has not undermined the reliability of
overall trends reported nationally’.72
This report does not disagree with the Audit Commission’s
conclusion and it should also be pointed out that the vast majority of this data manipulation was
also reported immediately after the NHS Plan’s inception and less so recently. Nonetheless it is not
disputed that some data manipulation has occurred and, combined with the fact that data is per se so
‘mistake ridden’, does at least cast shadows of doubt on the integrity of more specific data.
GP practice
PCTs report very close to 100% success (99.98) in offering patients an appointment with a GP
within 48 hours, and this has been the case since March 2004 when the figure stood at 97.32%,73
strongly implying PCTs have succeeded in meeting the government target.
66
DoH, Chief Executive Report to the NHS- Statistical Supplement, June 2006, Table 3.3.3 67
Audit Commission, Information and Data Quality in the NHS, March 2004 68
Audit Commission, Information and Data Quality in the NHS, March 2004 69
National Audit Office. Inappropriate adjustments to NHS waiting lists. London: Stationery Office, 2001. (HC 452)
www.nao.gov.uk/publications/nao_reports/01-02/0102452.pdf. Cited in: Bevan G, Hood C, Have targets improved
performance in the English NHS?, BMJ, 18 February 2006. 70
Audit Commission. Waiting list accuracy. London: Audit Commission, 2003. http://www.audit-
commission.gov.uk/reports/NATIONAL-REPORT.asp?CategoryID=english^574&ProdID=2BBB4A89-2212-401A-
B385-02CA01D10100. Cited in: Bevan G, Hood C, Have targets improved performance in the English NHS?, BMJ, 18
February 2006. 71
Audit Commission, Information and Data Quality in the NHS, March 2004 72
Audit Commission, Information and Data Quality in the NHS, March 2004 73
DoH, Chief Executive Report to the NHS- Statistical Supplement, June 2006, Table 2.3.1

© CIVITAS Institute for the Study of Civil Society 2006 Author: James Gubb, Civitas
www.civitas.org.uk/nhs/nhsMoney.php 07/2006
19
However the government itself acknowledges discrepancies with patient survey results. For
example, a patient survey conducted by the Healthcare Commission in 2005 revealed that only 74
per cent of people surveyed were seen by a GP within the government’s target of 48 hours.74
This
is perhaps an unfair portrayal because the target refers to a patient being offered an appointment
within 48 hours; it is perfectly possible the 26% who were not seen within 48 hours were offered an
appointment in this time period, but opted for a later one. However, the survey refutes such an
analysis finding ‘delayed appointments were [more] likely to be caused by fewer appointment
slots’.75
A DEFRA survey (2005) found around 17% of people in towns and 11% of people in
country areas had ‘problems’ getting an appointment with their GP.76
Access to GPs is getting faster, a good representation of which is the Picker Institute survey result
that the proportion of patients receiving a GP appointment as soon as they thought necessary rose to
76% in 2005 from 58% in early 2004.77
However access is probably slightly off the government
target of 100% ‘offered an appointment within 48 hours’ that PCTs report.
Emergency care
The NAO reports that in April-June 2004 only 5.3% of patients spent over 4 hours in A&E,
compared with 23% in 2002.78
According to official government statistics, by the end of 2004 this
figure had ben reduced to 3% despite A&E attendances increasing by half a million since 2000.79
Particularly since the target has been revised to just under 100% on recommendation of the BMA (it
is a clinical necessity to keep some patients in beyond the four hours stipulated when treating
certain conditions), the target has once again been met.
But there is variation in the extent to which individual hospitals have met this target, which is
somewhat hidden by an ‘impressive’ performance overall. A Healthcare Commission report into
A&E suggests that a significant percentage of patients who are admitted (from A&E) still spend
over four hours in the major A&E departments. In the worst performing hospitals the figure is as
high as 40%.80
The Healthcare Commission also highlight how ‘...stays of longer than four hours
for those who are admitted can be masked within the overall measure’, presumably through Trusts
manipulating data. Nonetheless the same report does conclude: ‘The perceptions of patients of
times they spend in A&E shows improvement over time. In 84% of trusts, patients surveyed in
2004 perceived shorter times compared with patients in 2003, with a median improvement of 8.5
percentage points‟. 81
Summary (waiting times)
The fairly dramatic reduction in waiting times across primary, secondary and emergency care is
possibly the most impressive achievement of the NHS since 2000, particularly given the NHS’
historic inability to provide fast access to care. Government targets on waiting times have been met
almost universally, with the caveats of ‘limited’ manipulation of data on inpatient and outpatient
74
Healthcare Commission, Patient Survey 2005: PCTs, p.4 75
Healthcare Commission, Patient Survey 2005: PCTs, p.4 76
Department for Environment FaRA (2005) DEFRA Survey of rural customers‟ satisfaction with services. Cited in:
Healthcare Commission, State of Healthcare 2005, ch.1 77
Coulter, A, Trends in patients’ experience of the NHS, Picker Institute Europe, 2005, p.3 78
Cited in: Bevan, Hood, Have targets improved performance in the English NHS?, BMJ, 18 February 2006 79
DoH, Chief Executive Report to the NHS- Statistical Supplement, June 2006, Table 3.2.2. A&E includes minor
injury units and NHS Walk-in centres. The large increase in A&E attendances is at least partly due to attendances at
NHS Walk-in centres; something of an unmet demand previously. 80
Healthcare Commission, State of Healthcare 2005, ch.1 81
Healthcare Commission, Acute hospital portfolio: A&E, 2005, p.22
© CIVITAS Institute for the Study of Civil Society 2006 Author: James Gubb, Civitas
www.civitas.org.uk/nhs/nhsMoney.php 07/2006
20
waiting times and the suggestion of the same on GP waiting times (given the mismatch of official
data with patient surveys).
Cancer
Cancer, along with coronary heart disease (CHD), is specifically targeted by the government for
major improvements in care. The NHS Cancer Plan, published alongside the NHS Plan in 2000,
was ‘a practical document for the NHS and its partners, setting out the actions and milestones that
will deliver the fastest improvement in cancer services anywhere in Europe over the next five
years’82
. Has it succeeded? A number of targets were outlined for service delivery and outcomes:
A reduction in the death rate from cancer among people aged under 75 by at least 20% by
2010 from a baseline of 141.2 deaths per 100,000 in 1995-7,
Ensure everyone urgently referred by their GP with suspected cancer sees a specialist within
2 weeks and begins treatment within two months by 2005,
Maximum one month wait from diagnosis to treatment for all cancers by 2005,
Reduce smoking in adults from 28% to 24% by 2010.83
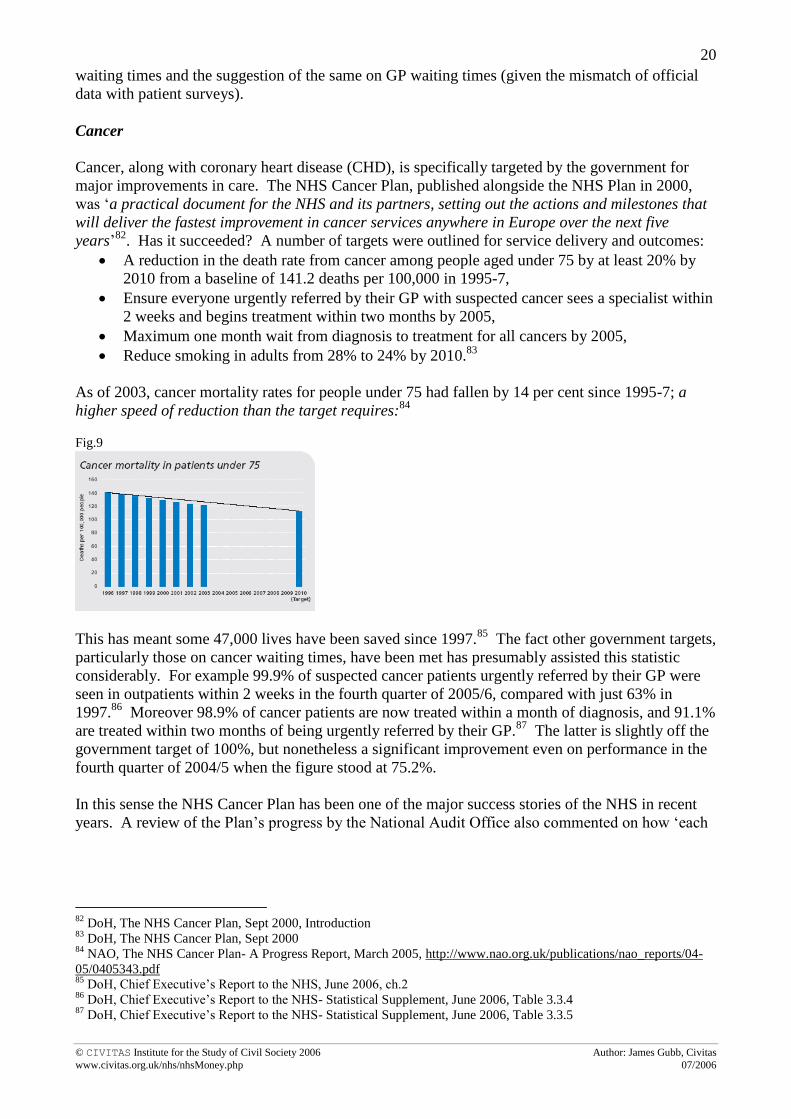
As of 2003, cancer mortality rates for people under 75 had fallen by 14 per cent since 1995-7; a
higher speed of reduction than the target requires:84
Fig.9
This has meant some 47,000 lives have been saved since 1997.85
The fact other government targets,
particularly those on cancer waiting times, have been met has presumably assisted this statistic
considerably. For example 99.9% of suspected cancer patients urgently referred by their GP were
seen in outpatients within 2 weeks in the fourth quarter of 2005/6, compared with just 63% in
1997.86
Moreover 98.9% of cancer patients are now treated within a month of diagnosis, and 91.1%
are treated within two months of being urgently referred by their GP.87
The latter is slightly off the
government target of 100%, but nonetheless a significant improvement even on performance in the
fourth quarter of 2004/5 when the figure stood at 75.2%.
In this sense the NHS Cancer Plan has been one of the major success stories of the NHS in recent
years. A review of the Plan’s progress by the National Audit Office also commented on how ‘each
82
DoH, The NHS Cancer Plan, Sept 2000, Introduction 83
DoH, The NHS Cancer Plan, Sept 2000 84
NAO, The NHS Cancer Plan- A Progress Report, March 2005, http://www.nao.org.uk/publications/nao_reports/04-
05/0405343.pdf 85
DoH, Chief Executive’s Report to the NHS, June 2006, ch.2 86
DoH, Chief Executive’s Report to the NHS- Statistical Supplement, June 2006, Table 3.3.4 87
DoH, Chief Executive’s Report to the NHS- Statistical Supplement, June 2006, Table 3.3.5

© CIVITAS Institute for the Study of Civil Society 2006 Author: James Gubb, Civitas
www.civitas.org.uk/nhs/nhsMoney.php 07/2006
21
cancer network management team, PCT and SHA we spoke to were very positive about the NHS
Cancer Plan’. It also described patient involvement in such networks as ‘good’.88
However a report co-authored by Karol Sikora, the former Chief of the WHO Cancer Programme,
is somewhat less than complimentary. Whilst conceding that patients have welcomed
improvements in coordination of care, it criticises the mulitdisciplinary teams that head the cancer
networks for becoming ‘over bureacratised....established at enormous cost in terms of medical and
nursing manpower, which could otherwise be devoted to patient care’.89
The extra money- £2.0bn-
devoted to cancer services appears to be disappearing into ‘the black hole of the NHS’. It cites how
an All-Party Parliamentary Group on Cancer found ‘PCTs may be unequal to the task of planning
how best to spend the huge amounts of money being pumped into the NHS’.90
Evidence suggests
that cancer care has also been severely hampered by staff shortages in vital areas such as radiology,
radiotherapy and histopathology. Symptomatic of this are ‘hidden waits’, frequently as much as
three months, for access to curative radiotherapy. New linear accelerators are ‘still lying in boxes in
warehouses’ because the staff is not there to operate them and despite the shortage, universities are
not greatly increasing places on radiography courses.91
A separate NAO survey into cancer care highlights a further problem. Just 58 per cent of patients
were seen by a specialist within two weeks of referral from their GP- though an improvement on the
46% in 2000. This does not contradict government statistics on the success of its target, because
this refers to patients urgently referred, but it is crucial because ‘a significant minority of patients
diagnosed with cancer are not referred urgently’.92
This is particularly the case with prostate
cancer.
Moreover even between Q4 2004/5 and Q4 2005/6, reported urgent cancer referrals increased by
20.4%93
(an OECD-wide trend). Further service expansion will be needed to meet this need,
particularly given that the government is struggling to meet some of its targets on smoking. The
overall number of people smoking is declining- and roughly in line with the government target of a
reduction to 24% by 201094
- but there some worrying trends. For example, the number of young
people and manual workers who smoke has remained approximately constant. The government has
aimed to help 800,000 smokers successfully quit at a 4-week stage between 2003/4 and 2005/6, but
there has only been 350,000 successes thus far.95
Summary (Cancer)
There have been some ‘marked improvements on the position [of cancer care] in 2000’.96
In terms
of the targets set down by the NHS Cancer Plan, the NHS has performed fairly well. However,
when closer analysis is undertaken, it is legitimate (if perhaps slighly too harsh) to conclude, as
does Sikora, that taken overall ‘the NHS Cancer Plan has delivered poor value for money’.97
88
NAO, The NHS Cancer Plan- A Progress Report, March 2005. The review also validated official government
statistics on their key targets. 89
Sikora, K, Selvin, M and Bosanquet, N, Cancer care in the NHS, Reform, February 2005, p.17. Available at:
http://www.reform.co.uk/filestore/pdf/Cancer%20care%20in%20the%20NHS.pdf 90
Sikora, K, Selvin, M and Bosanquet, N, Cancer care in the NHS, Reform, February 2005, p.7 91
Sikora, K, Selvin, M and Bosanquet, N, Cancer care in the NHS, Reform, February 2005, p.12 92
NAO, Tackling Cancer- Improving the Patient Journey, February 2005, p.2,4 93
DoH, Chief Executive’s Report to the NHS- Statistical Supplement, June 2006, Table 3.3.4 94
http://www.ash.org.uk/html/factsheets/html/fact01.html. ASH reported that 25% of adults were smokers in 2004. 95
DoH, Chief Executive’s Report to the NHS, June 2006, ch.3 96
NAO, Tackling Cancer- Improving the Patient Journey, February 2005, p.4 97
Sikora, K, Selvin, M and Bosanquet, N, Cancer care in the NHS, Reform, February 2005, p.18

© CIVITAS Institute for the Study of Civil Society 2006 Author: James Gubb, Civitas
www.civitas.org.uk/nhs/nhsMoney.php 07/2006
22
Coronary heart disease (CHD)
Government targets for CHD are outlined in the National Service Framework for CHD:
Reduce deaths from cardiovascular disease (CVD) mortality by at least 40% for people
under 75 by 2010,
75% of eligible patients should receive thrombolysis within 30 minutes of hospital arrival by
2003,
Improved the use of effective medicines after heart attack, especially the use of statins,
Ambulance response times improved so that 75% a category A calls receive a response
within 8 minutes.98
In 1995-97 the baseline figure for overall mortality due to CVD for people aged under 75 was 141.0
deaths per 100,000 people. By 2002-4 this figure had fallen to 96.7; a fall of 31.4%.99
If this trend
were to continue, the government target of a 40% reduction by 2010 will be met:
Fig.10
100
Of course, as is the case with cancer mortality rates, it is difficult to know exactly how much the
improvements can be attributed to increased performance in the NHS or, for example, any lifestyle
change. However it is clear there have been improvements in measures specific to CHD care,
especially in those targeted by the government. For example, the percentage of category A
(immediately life threatening) ambulance calls responded to within 8 minutes stood at 76.2% in
2004/5, above the government’s target.101
This can only save lives. Moreover, the number of CHD
patients receiving thrombolysis (that removes blood clots) within 30 minutes of arriving at hospital
has increased substantially from 39% in March 2000 to 82% in March 2006, although the rate has
levelled off almost completely since 2004.102
The percentage of patients receiving thrombolysis
within 60 minutes of calling for professional help has, however, shown a more sustained increase
from 24% to 59% across 2000-06.103
Similarly the number of statins dispensed across England has
rocketed from 9.4 million in 2000 to 33.8 million in 2005, suggesting an improvement- at least on
NICE guidance- in treating CHD after a heart attack.104
Representative of these improvements is
the fact the Healthcare Commission commended the NHS on its performance on the treatment of
heart attacks, faster diagnosis of angina and reduced waiting times for revascularisation.105
98
DoH, National Service Frameworks: Coronary Heart Disease, Executive Summary, March 2000 99
DoH, Departmental Report 2006, May 2006, ch.2 100
DoH, Chief Executive’s Report to the NHS, June 2006, ch.2 101
DoH, Chief Executive’s Report to the NHS, June 2006, ch.2 102
DoH, Chief Executive’s Report to the NHS- Statistical Supplement, June 2006, Table 3.2.3 103
DoH, Chief Executive’s Report to the NHS- Statistical Supplement, June 2006, Table 3.2.3 104
DoH, Chief Executive’s Report to the NHS- Statistical Supplement, June 2006, Table 2.4.3 105
Healthcare Commission, Getting to the heart of it, February 2005

© CIVITAS Institute for the Study of Civil Society 2006 Author: James Gubb, Civitas
www.civitas.org.uk/nhs/nhsMoney.php 07/2006
23
Inequalities in the incidence of CHD suffering between socio-economic groups has also improved.
Government statistics show that average rates of CHD have fallen faster for lower socio-economic
groups, from a baseline absolute difference of 36.7 deaths per 100,000 of the population in 1995-7
to 27.6 in 2002-4; a fall in the inequality gap of 24.7%. The fact national targets are being met by
the majority of NHS Trusts has surely contributed to this promising development.
However there are two areas concerning CHD care that remain less than satisfactory: i) providing
better care for the estimated 1.5 million men and 1.2 million women that are living with CHD day-
in-day-out and ii) measures relating to the prevention of CHD.106
The latter is especially crucial.
Obesity will be the health problem in the UK in years to come if current trends are not arrested, a
fact recognised by the DoH in the 2004 White Paper, Choosing Health (DoH, 2004)- which outlines
the government’s priorities for public health until 2010:107
„[Obesity] poses serious concerns [as regards] its long term impact on the health of the
population...[for example] research shows it is strongly linked to increased risks of stroke, angina,
heart attacks and type 2 diabetes‟.108
The World Health Organisation’s World Health Report, 2002, estimates that around a third of CHD
and almost 60 per cent of hypertensive disease in developed countries is due to levels of BMI (body
mass index) in excess of the theoretical minimum of 21k/m2.109
Yet obesity has continued to rise
year-on-year in the UK at a quite astonishing rate. In 2004 nearly 25 per cent of the adult
population of the UK was clinically obese (a BMI of greater than 30k/m2) according to health
surveys, an increase of close to 500% since 1980 when the figure was just over 5% (see fig.11).110
An additional 39 per cent were overweight (a BMI of between 25-30k/m2).
111 An even more
concerning trend is the prevalence of obesity in children, which doubled in boys from 3% to 6% and
increased by over half in girls from 5% to 8%, in just seven years between 1995-2002.112
Related to
this is the fact only 70% of boys and 61% of girls aged 2-15 years were ‘active’ for at least the
recommended amount of an hour a day and statistics point to a significant decrease over time. In
fact overall levels of physical activity for every age-group are low in the UK; in 2003 over one third
of adults were inactive, that is, participated in less than one occassion of 30 minutes of physical
activity a week,113
with just 8 per cent of physical activity registered in a Health Survey for England
in 2004 was to sport.114
Worringly these observations ignore the fact the UK population also has
woeful levels of alcohol consumption115
and a low average intake of fruit and vegetables.116
106
Healthcare Commission, Getting to the heart of it, February 2005 107
DoH, Choosing health: Making healthy choices easier, November 2004. Available at:
http://www.dh.gov.uk/PublicationsAndStatistics/Publications/PublicationsPolicyAndGuidance/PublicationsPolicyAndG
uidanceArticle/fs/en?CONTENT_ID=4094550&chk=aN5Cor. Other priorities for public health are: reducing health
inequalities, reducing smoking, improving sexual health, improving mental health and encouraging sensible drinking. 108
DoH, Chief Executive’s Report to the NHS, June 2006, p.11 109
WHO, World Health Report 2002 110
DoH, Chief Executive’s Report to the NHS, June 2006, p.11 111
Steven Allender, Viv Peto, Peter Scarborough, Anna Boxer and Mike Rayner (2006) Coronary heart disease
statistics. BHF: London 112
Steven Allender, Viv Peto, Peter Scarborough, Anna Boxer and Mike Rayner (2006) Coronary heart disease
statistics. BHF: London 113
Steven Allender, Viv Peto, Peter Scarborough, Anna Boxer and Mike Rayner (2006) Coronary heart disease
statistics. BHF: London 114
Steven Allender, Viv Peto, Peter Scarborough, Anna Boxer and Mike Rayner (2006) Coronary heart disease
statistics. BHF: London 115
OECD, OECD Health data 2006, June 2006 116
Steven Allender, Viv Peto, Peter Scarborough, Anna Boxer and Mike Rayner (2006) Coronary heart disease
statistics. BHF: London

© CIVITAS Institute for the Study of Civil Society 2006 Author: James Gubb, Civitas
www.civitas.org.uk/nhs/nhsMoney.php 07/2006
24
Fig.11
Summary (CHD)
Mortality from CHD in England and across the UK is falling rapidly. The fact the NHS has met a
number of targets concerning CHD means it can take at least some of the credit for this. However a
British Heart Foundation report is correct in saying that ‘whereas mortality from CHD is rapidly
falling, morbidity, particularly in older age groups, appears to be rising’.117
The simple fact of the
matter is that without concerted public health efforts, the NHS will face a backlash as the ‘obese
and unhealthy generation’ grows older. In 2003 CVD cost the NHS around £14.8bn and is
estimated to cost the UK economy £26bn, including £3.5bn and £7.9bn contributed by CHD. This
only looks set to rise.
Summary
There is little doubt the NHS has delivered significant improvements in the areas of care that have
been targeted by the government, particularly in securing faster access for its patients (including to
cancer services). On all aspects considered in this section- staffing, facilities, waiting times, cancer
and CHD- government targets have, by and large, been met. A few caveats on these targets have
been noted; such as the numbers of non-clinical staff increasing vis-a-vis staffing, variation between
patient surveys and government statistics in relation to cleanliness, manipulation of data in waiting
times for inpatient/outpatient care and poor performance on public health measures. However, the
achievements far outweight these caveats; the quality of care the NHS offers has increased in
targeted areas- the extra money appears to be working. Or is it?
117
Steven Allender, Viv Peto, Peter Scarborough, Anna Boxer and Mike Rayner (2006) Coronary heart disease
statistics. BHF: London
© CIVITAS Institute for the Study of Civil Society 2006 Author: James Gubb, Civitas
www.civitas.org.uk/nhs/nhsMoney.php 07/2006
25
Chapter 4: Looking into the abyss- ‘beyond’
the targets
__________________________________
The fact significant improvements have been witnessed in targeted areas, alone, is not sufficient
enough to conclude the extra money is working and the NHS is providing value for money. Gwyn
Bevan and Christopher Hood describe accurately the problems associated with a target-based
regime:
„Regulation by targets assumes that priorities can be targeted, the part that is measured can stand
for the whole, and what is omitted does not matter. But most indicators of healthcare performance
are “tin openers rather than dials....they do not give answers but prompt investigation and inquiry,
and by themselves provide an incomplete and inaccurate picture”.118
‟
Only paying attention to high-profile targets tends to mask what is going on elsewhere. Looking
‘beyond’ the targets NHS performance is, to say the least, not so impressive. The Healthcare
Commission, in its annual report into the state of healthcare in 2005, devotes much attention to the
worrying trend that ‘there has been much less progress [in the NHS] in areas not so thoroughly
covered by targets’.119
This chapter picks up on this theme by looking in turn at three, related,
issues: i) inappropriate ways in which targets have been met to the detriment of patient care
(commonly termed ‘gaming’); ii) under-performance in services/areas of care not subject to high-
profile targets; iii) insignificant improvement in patient involvement in care. When these areas are
assessed, it becomes harder to argue that the extra money ploughed into the NHS is ‘working’ or at
least working anywhere near what it might be realistic to expect.
Gaming
To borrow the words of Gwyn Bevan and Christopher Hood, gaming occurs where ‘reported
performance against targets seems to be fine, but in fact actions have been taken at variance with
the substantive goals behind the targets (hitting the target, but missing the point)’.120
The authors
provide one such example of this; that in some NHS Trusts, patients waited in ambulances outside
A&E until staff were confident they could be treated within the 4 hour government target.121
Other examples are not too difficult to find. The definition of a category A (‘immediately life-
threatening’) call varied fivefold across Ambulance Trusts, with ambiguity also shown in the time
when the ‘8 minute’ clock started.122
Once at hospital, whilst fewer emergency patients said they
had to wait four hours or longer before being admitted from A&E (when required), ‘fewer also
118
Bevan G, Hood C, Have targets improved performance in the English NHS?, BMJ, 18 February 2006. Also citing:
Carter N, Klein R, Day P. How organisations measure success. The use of performance
indicators in government. London: Routledge, 1995. 119
Walker, Anna, Chief Executive of the Healthcare Commission speaking in July 2005; cited in: Mayor, S, Lack of
targets leads to underperformance in the NHS, BMJ 2005;331:175 (23 July), doi:10.1136/bmj.331.7510.175 120
Bevan G, Hood C, Have targets improved performance in the English NHS?, BMJ, 18 February 2006. Gaming is
not the same as the data manipulation referred to in chapter 3; data manipulation questions whether targets on waiting
times have actually been met, whereas gaming accepts the targets have been met, but questions whether they have been
met in the ‘correct way’. 121
CHI, What CHI has found in ambulance trusts, London: Stationary Office, 2003. Cited in: Bevan G, Hood C, Have
targets improved performance in the English NHS?, BMJ, 18 February 2006. 122
Cited in: Bevan G, Hood C, Have targets improved performance in the English NHS?, BMJ, 18 February 2006.
© CIVITAS Institute for the Study of Civil Society 2006 Author: James Gubb, Civitas
www.civitas.org.uk/nhs/nhsMoney.php 07/2006
26
recalled being admitted quickly, with 32 per cent admitted in less than an hour, compared with 43%
in 2003/4’.123
A British Medical Association (BMA) survey found that 82% of A&E staff thought
there were possible threats to the safety of patients due to the adverse effects of the 4 hour target,
such as being discharged from A&E prematurely or pressures to treat patients waiting the longest
rather than those with the greatest clinical need.124
According to the Healthcare Commission, there
is little evidence this has actually happened; for example 95% of patients surveyed thought the
order in which patients were seen in A&E was fair.125
However, in a separate survey by the Picker
Institute only 66% of patients said they had sufficient time with the doctor or nurse.126
Patients have also suffered the effects of gaming in elective waiting times. In 2004, the Audit
Commission cited evidence in some Trusts of patients being removed from waiting lists once they
had been provided with a future date for an appointment, given immediate appointments that they
were not able to attend then classed as refusing treatment, or having treatment inappropriately
suspended.127
Such instances were not reported in a review of healthcare by the Healthcare
Commission in 2006, suggesting they may have been eradicated. But this publication did find some
NHS Trusts had used time taken for diagnostic tests or rehabilitation services, where waits were
until very recently not recorded, as time deducted off the official waiting times that are, in order to
meet government targets.128
A poignant example of this is the recently reported case of Oonagh
Wilson, a 39-year-old mother of two, who had tests in 2002 to establish if she had a faulty gene that
indicates a higher risk of contracting breast cancer. She is still waiting for the results and
subsequently decided to have a preventative double masectomy. She is not alone; a survey by the
charity Breakthrough Breast Cancer of 27 genetic counsellors found a fifth said they have NHS
patients who had waited two years or longer for the same results and 55 per cent had opted for
surgery rather than wait.129
Evidence of gaming is perhaps most prevalent in the primary care sector. A survey of patients by
the Healthcare Commission in 2005 found that just over 30% could not book an appointment with a
GP three days or more in advance, a phenomenon rarely heard of prior to the NHS Plan.130
A third
of general practices also said they would not book appointments more than two weeks in advance131
and many practices are now operating ‘closed lists’, which prevent patients from transferring to
their practice.132
Evidence suggests that all these instances are strategies that have been invoked in
order to achieve the government’s 48 hour waiting time target. With the government’s agenda for
choice at the forefront of reform, this is not good news for the NHS or its patients. Of only slight
consolation is that there is little evidence GPs have been rushing through their patients in order to
meet targets, although matters have not improved; a stagnant 75% of patients say they had sufficient
time with their GP according to a survey by the Picker Institute.133
But the target has contributed to
the fact that patients are now experiencing greater difficulties in contacting their general practice
than before. More than half the respondents said that they ‘sometimes’ (44%) or ‘always’ (14%)
experienced problems; up by 8% since 2003.134
123
Healthcare Commission, Patient Survey 2005- Inpatients, p.2 124
British Medical Association (2005) Survey of A&E waiting times. 125
Healthcare Commission, Patient Survey 2005- Inpatients, p.2 126
Coulter, A, Trends in patients’ experience of the NHS, Picker Institute Europe, p.3 127
Audit Commission, Data Quality in the NHS, March 2004 128
Healthcare Commission, State of Healthcare 2005, ch.1 129
http://news.independent.co.uk/uk/health_medical/article1090897.ece. Her mother, grandmother and two of her aunts
all had breast cancer; her mother and grandmother died from the disease. 130
Healthcare Commission, Patient Survey 2005- PCTs, Executive Summary 131
Healthcare Commission, State of Healthcare 2005, ch.1 132
DoH, Our Health, Our Care, Our Say, January 2006, ch.3 133
Coulter, A, Trends in patients’ experience of the NHS, Picker Institute Europe, p.3 134
Healthcare Commission, Patient Survey 2005- PCTs, Executive Summary
© CIVITAS Institute for the Study of Civil Society 2006 Author: James Gubb, Civitas
www.civitas.org.uk/nhs/nhsMoney.php 07/2006
27
There is some evidence that the government, through its inspection and auditing bodies, are getting
wise to gaming in the NHS. Particuarly in light of the government’s choice agenda and initiatives
such as payment-by-results and practice-based commissioning, there is currently a huge drive to
improve the quality of information and data collection. Auditing has increased substantially and as
a result gaming is increasingly difficult. The government has also sought to address other aspects
of gaming more specifically; statistics are now published on general practices’ advanced booking
and the issue (along with that of closed lists) received specific attention in the recent White Paper,
Our Health, Our Care, Our Say (DoH 2006).135
The government will also say that once its ideal of
a patient-led NHS is realised, incentives to game will not exist, because top-down targets will no
longer drive NHS organisations. The fact is that for the momenet they still do and one can only
conclude that the NHS has, at least in some instances, gone about meeting its targets- particularly
those on waiting times- in a way detrimental to patient care. A report published by the Healthcare
Commssion only today (24 July 2006) criticised hospital managers at Stoke Mandeville Hospital for
‘putting NHS targets above outbreak control’ measures for Clostridium difficile, leading to the
death of 33 patients.136
NHS performance in services outside high-profile targets
Of those NHS services ‘out-of-view’ behind areas subject to high-profile targets (or indeed any
targets at all) the Healthcare Commission singles out sexual health and maternity services for
particularly lacklustre performance.137
However this review chooses to focus solely on two which
are arguably the most pressing and poignant; mental health and stroke care.
Mental health services
According to the Psychiatric Morbidity Survey, one in six adults of working-age are currently
suffering from mental illness of some description, of whom up to half are seriously mentally ill.138
Mental illness causes huge suffering to patients and their families and imposes heavy costs on the
economy of an estimated £25 billion per annum (including the real cost of public services devoted
to mental health of £8 billion), which is over 2% of GDP.139
Yet despite this the Survey found that only a quarter reporting mental illness were actually having
treatment. Treatment for depression and anxiety only accounts for 2% of total NHS expenditure.140
Of those with depression, only 8 per cent were currently seeing a pyschologist and 3% a
psychiatrist.141
In fact, for 80% of people who visit their GP with mental health problems treatment
went no further than this level. As a result the vast majority of sufferers receive no treatment except
drugs (2 million people in the UK are currently on psychiatric drugs), despite the fact recent NICE
guidance suggests that psychological therapies (i.e. talking face-to-face) work best142
and that
135
DoH, Our Health, Our Care, Our Say, January 2006, ch.3 136
http://news.bbc.co.uk/1/hi/health/5209330.stm 137
Healthcare Commission, State of Healthcare 2005, July 2005, ch.1 138
Singleton et al, Psychiatric morbidity among adults living in private households- 2000, London: Stationary Office,
2001, ch.2. Available at: http://www.statistics.gov.uk/downloads/theme_health/psychmorb.pdf 139
Layard, R, Mental Health: Britain’s biggest social problem?, January 2005, presented at the No.10 Strategy Unit
Seminar on Mental Health, 20th January 2005. Available at:
http://cep.lse.ac.uk/textonly/research/mentalhealth/RL414d.pdf 140
Layard et al, The Depression Report: A New Deal for Depression and Anxiety Disorders, LSE: The Centre for
Economic Performance's Mental Health Policy group, June 2006, Introduction 141
Cited in: Layard, R, Mental Health: Britain’s biggest social problem?, January 2005 142
http://www.nice.org.uk/page.aspx?o=cg023&c=mental.

© CIVITAS Institute for the Study of Civil Society 2006 Author: James Gubb, Civitas
www.civitas.org.uk/nhs/nhsMoney.php 07/2006
28
surveys indicate GP diagnosis of mental illness is wrong about a third of the time on a patient’s first
visit.143
For those patients who do get referred by GPs for treatment, there are often also huge delays.
Angela Greatley, chief executive of the Sainsbury Centre for Mental Health, said last year : ‘We
still do not know for sure how long it takes people to get access to mental healthcare. In many
cases waiting times of over a year are reported’.144
Waiting times are not measured for mental
health services and, unlike elective care, targets for reducing them are not in place.
Of those who are lucky enough to get secondary mental health treatment, the service is not brilliant.
Despite increases of mental health staff of nearly 15,000, a Healthcare Commission survey of
patients using these services revealed that only 63% of patients said they were given enough time to
discuss their condition or treatment with a pyschiatrist. This is perhaps unsuprising given that the
vacancy rate for psychiatrists is still 11 per cent. Moreover only 41% of those given a (standard)
care plan actually received a copy of it, and only 58% reported definitely understanding it. Only
47% of respondents said they had at least one care review in the previous 12 months and just 62%
were actually told who their care coordinator was! In addition fewer than half (48%) of patients
surveyed reported access to crisis resolution services.145
The Healthcare Commission does cite signs of improvement; the vast majority of the responses
referred to are in fact advances on previous years and the level of satisfaction with individual
psychiatrists and CPNs (community psychiatric nurses) is generally high. Ninety per cent and 73%
of patients felt they could ‘definitely’ or ‘most of the time’ trust their psychiatrist or CPN
respectively. Those on enhanced care plans also reported more positively than the results displayed
above, probably reflecting the government preference towards the most difficult patients as part of
its suicide-reduction strategy. The setting up of Early Intervention, Crisis Resolution, Home
Treatment and Assertive Outreach teams have all helped in this regard.
But overall the mental health system remains poorly focused and poorly coordinated. The CEP
Mental Health group at the LSE calculated that providing psychological therapy to those with
chronic anxiety or depression at a cost of £750 per person (16 sessions with a therapist) would pay
for itself through saving NHS money and resources elsewhere (e.g. drugs), not to mention the
benefit of potentially getting that person back to work. Additional spending on mental health would
have to run to just £600 million to be adequate, on their count.146
GPs should be referring patients
to therapy or to a Community Mental Health Team depending on the seriousness of the condition,
rather than just prescribing drugs. The government strategy in Our Health, Our Care, Our Say
(DoH, 2006) of ‘Pathways-to-work’ and self-care are likely to help in the rehabilitation stage. The
problem is an extra 10,000 therapists need to be to provide psychological therapy prior to this stage;
in the meantime long waiting times are likely to persist.
Summary
An extra £1 billion has been ploughed into mental health services in the NHS. It is perhaps too
harsh to say it has been wasted (extra staff, new premises, and some restructuring was required), but
it has certainly been spent in a lop-sided way. The most difficult patients have benefited, perhaps
143
Cited in: Layard, R, Mental Health: Britain’s biggest social problem?, January 2005. Mental health issues also
occupy a third of the average GP’s time. 144
Cited in: Mayor, S, Lack of targets leads to underperformance in the NHS, BMJ 2005;331:175 (23 July) 145
Healthcare Commission, Patient Surveys 2005: Mental Health 146
The Depression Report: A New Deal for Depression and Anxiety Disorders, The Centre for Economic Performance's
Mental Health Policy group, June 2006

© CIVITAS Institute for the Study of Civil Society 2006 Author: James Gubb, Civitas
www.civitas.org.uk/nhs/nhsMoney.php 07/2006
29
rightly so, but in such a way that the majority must rely on anti-depressants (prescription rates are
up 33% in the last six years147
) and, in many cases, inadequate GP care.
Stroke care
Despite the fact stroke care is estimated to cost the NHS about £2.8 billion a year in direct costs and
the wider economy around £1.8 billion in lost productivity and disability, it was not subject to any
specific targets nor a National Service Framework.148
This is especially surprising given that stroke
care in the NHS has been the subject of heavy criticism for a number of years; most poignantly by
the OECD.149
Such criticism should have provided a shot in the arm for the NHS, yet stroke care
on the whole remains ineffective and has shown little improvement since 2000.
A number of recent studies provide evidence that suggests why this is so. The most notable of these
are the National Sentinel Audit of Stroke (2004) and the NAO’s ‘Reducing Brain Damage: Faster
Access to Better Stroke Care (2005)‟. The latter actually identified cost savings of some £20 million
and the potential to save 550 lives and over 1,700 disabilities per year.150
Sub-standard levels of
care are identified throughout the care process. The British Assocation for Stroke Physicians
recommends that a specialist-led, high quality, acute stroke service in England should employ
around 430 whole-time equivalent stroke consultants, but there are currently just 86. Moreover it is
almost universally agreed that patient care is optimised- in quality and in time- in specialist stroke
units, yet in 2004 only 47% of patients were treated in such a way (although an improvement on the
36% in 2001).151
This is a telling statistic; the NAO estimates achieving 100% admission in stroke
units would lead to a saving of 1800 beds (c.£82 million) and a 29% decrease in death or
dependence rates for patients.152
It is also recommended that a CT scan be carried out immediately after admission in order to
diagnose the type of stroke and identify the necessary course of treatment- ‘time lost is brain lost’.
However only 22% of stroke patients in the Sentinel Audit received a scan on the same day as their
admission; most waited two days or more.153
What is worse is that this is not necessarily due to a
lack of capacity. The NAO found that hospitals, on their own admission, had the capacity to
perform twice as many CT scans without unfairly compromising other patients- if this is case, why
weren’t more scans performed quicker?
Evidence also suggests care is poorly coordinated on a patient’s release from hospital, with, for
example, only 53 per cent of patients receiving a care plan. Moreover, scant resources have been
allocated to public health measures to prevent further (or indeed a first) strokes. An average of just
30% of the general public surveyed by the NAO mentioned reducing high blood pressure as a cause
of strokes, even less mentioned smoking or high cholesterol levels or obesity. Yet evidence from
the Strokesafe campaign in Australia suggests that a well-directed publicity campaign could
produce tangible results. At all stages of stroke care, the process is inadequate.
147
http://www.theyworkforyou.com/wrans/?id=2006-06-05c.69339.h&s=anti-depressants#g69339.q0 148
Stroke care is inadvertently included in the NSF for Older People, despite the fact that a quarter of strokes occur in
under-65s. 149
See, for example: Moon, L, Moise, P and Jacobzone, S, Stroke care in OECD countries: a comparison of treatment,
costs and outcomes in 17 countries, OECD: Health Working Paper 5 150
NAO, Reducing brain damage: Faster access to better stroke care, November 2005 151
NAO, Reducing brain damage: Faster access to better stroke care, November 2005 152
NAO, Reducing brain damage: Faster access to better stroke care, November 2005 153
http://www.rcplondon.ac.uk/college/ceeu/ceeu_stroke_home.htm
© CIVITAS Institute for the Study of Civil Society 2006 Author: James Gubb, Civitas
www.civitas.org.uk/nhs/nhsMoney.php 07/2006
30
Improving patient involvement in care?
A key goal of the NHS Plan was not just to improve health outcomes, but also to improve patient
experience and involvement in care as part of the government’s drive to create a truly patient-
centred NHS. This follows the thinking of the World Health Organisation that: ‘engaging patients
in their healthcare and encouraging patients to take responsibility for protecting their health is the
best way to ensure the sustainability of health systems’.154
The prime example of such an approach
in the NHS has been the government’s launch of the new patient survey programme and emphasis
on self-care, aiming to provide ‘systematic evidence to enable the health service to measure itself
against the aspirations and experience of its users’.155
Evidence points almost universally to patient experience improving, particularly in ‘areas that have
been the subject of coordinated action, e.g. hospital waiting times, cancer care and coronary heart
disease’.156
This supports evidence presented in Chapter 3, largely from official sources. For
example, patients reported much better access to NHS services; up as much as 10 percentage points
between 2003-5 for primary care, outpatients, inpatients and A&E.157
The proportion of patients
expressing complete confidence and trust in health professionals is, on the whole, high and has
remained so (at around 80%).158
Morover the NAO’s survey of the ‘patient journey’ in cancer was
positive, citing several improvements in care since 2000, including patient’s reporting quicker
processes and better communication about their condition, treatments and tests.159
This much is
impressive.
However, moving into areas ‘beyond’ the high-profile targets, patient experience is largely
stagnant. This is especially the case with regard to patient-engagement measures. The Picker
Institute found that ‘many [patients] are not involved as much as they would like to be in decisions
about their care and treatment’ with, for example, only 69% of primary care patients, 53% of
inpatients, 70% of outpatients and 64% of A&E patients saying they definitely had a say in
decisions about their treatment.160
In a separate survey by the Healthcare Commission, only 59 per
cent of primary care respondants felt they were involved in decisions about their medication.161
A
widespread failure to explain side-effects of medicines was also reported (as much as 50%).162
Patients found paternalistic attitudes remained amongst a significant proportion of doctors and
nurses; in 2004 38% of A&E patients, 32% of primary care patients and 35% of outpatients said the
results of diagnostic tests were not clearly explained to them163
and as many as 10% of children and
young people said they did not receive any emotional support or comfort from nursing staff when
being treated.164
Coordination of care and self-care remain problematic too. In particular 31% of inpatients said they
were given conflicting information by staff.165
Many patients still do not receive sufficient
information on how to look after themselves after leaving hospital or, for example, given contact
details for statutory or voluntary organisations who could provide care or financial assistance. As
154
Cited in: Coulter, A, Engaging patients in their healthcare; how is the UK doing relative to other countries, Picker
Institute, April 2006, p.6 155
Coulter, A, Trends in patients’ experience of the NHS, Picker Institute, p. 1 156
Coulter, A, Trends in patients’ experience of the NHS, Picker Institute, p. 10 157
Coulter, A, Trends in patients’ experience of the NHS, Picker Institute, p. 3 158
Coulter, A, Trends in patients’ experience of the NHS, Picker Institute, p. 3 159
NAO, Tackling cancer: improving the patient journey, London: The Stationary Office, February 2005. 160
Coulter, A, Trends in patients’ experience of the NHS, Picker Institute, p. 4 161
Healthcare Commission, Patient Survey 2005: PCTs 162
Healthcare Commission, Patient Survey 2005: PCTs 163
Coulter, A, Trends in patients’ experience of the NHS, Picker Institute, p. 5 164
Coulter, A, Trends in patients’ experience of the NHS, Picker Institute, p. 6 165
Coulter, A, Trends in patients’ experience of the NHS, Picker Institute, p. 9

© CIVITAS Institute for the Study of Civil Society 2006 Author: James Gubb, Civitas
www.civitas.org.uk/nhs/nhsMoney.php 07/2006
31
many as 40 per cent of inpatients were not told about danger signals to watch out for upon their
discharge, though the picture was better for CHD and cancer patients.166
Such findings lead the
Picker Institute to conclude ‘the quality of NHS care is improving, [but] not as quickly and as
comprehensively as many of us would like’.167
This is the crucial point; the extra money has
translated into an increase in patient experience, but not to patient engagement and- similar to the
argument that is emerging overall- not by nearly enough to say the money is ‘working’ like it
should.
Summary
‘Beyond’ the targets, the true worth of the extra money ploughed into the NHS must be questioned.
Instances of gaming show there have been detrimental effects on patient care as a result of ways in
which high-profile targets (particularly waiting times) have sometimes been met. An analysis of
mental health and stroke care indicates that NHS performance is suspect in areas not covered
significantly by targets. Matters are not getting worse, but equally improvement has proceeded at
walking pace at best. And patient survey results reveal that improvements in the much-trumped
area of patient experience have been marginal concerning involvement in care. But is it possible to
argue the more dramatic improvements in the key targeted areas outweigh the more sluggish
improvement detailed here, and we can thus conclude the money is working fine? The answer is
probably not; chapters 5 and 6 provide the reasoning.
166
Coulter, A, Trends in patients’ experience of the NHS, Picker Institute, p. 6 167
Coulter, A, Trends in patients’ experience of the NHS, Picker Institute, p. 10

© CIVITAS Institute for the Study of Civil Society 2006 Author: James Gubb, Civitas
www.civitas.org.uk/nhs/nhsMoney.php 07/2006
32
Chapter 5: Productivity
_________________________________
Productivity put simply is the relationship between inputs, activities and outcomes. In terms of the
NHS, inputs are the resources used to produce NHS activities, such as medical staff, prescription
drugs and buildings. Outcomes are the results of NHS output, for example decreased mortality
rates. Treatment activities are typically weighted by their relative costs, with inputs expressed as
‘volumes’ using a deflator in order to account for pay and price increases and changes in the rental
value of capital. NHS productivity is then obtained by dividing NHS output by NHS inputs, using
these measures.168
Of course, debate rages over, for example, exactly how to accurately measure
NHS activities, the relationship between its activity/output and outcomes (other variables enter the
equation, such as lifestyle) and the forms a cost-weight and deflator should take. However,
whatever measures are used, there is near universal agreement on three factors:
1. NHS input has grown substantially; by about 5% per annum since 1999.169
2. The quantity of NHS output has also grown; by around 3.75% per annum since
1998/9.170
3. Crude productivity in the NHS has fallen, probably by an average of between 0.5 and
1.5% per annum 1995-2004171
: Fig.12
Nonetheless this measure of productivity is almost universally agreed to be unfair, because it does
not take into account changes in quality of care provided by the NHS. A study by the University of
York and NIESR looks at improving survival rates, improving health gains (both adjusted for life
expectancy distribution) and changes in waiting times as representive of changes in quality. They
find that improvements in these areas are equivalent to increases in output growth of about 0.17%
per annum during the period 1999/2000-2003/4.172
The Department of Health wants to add to this
the effect of using statins to treat CHD, improved outcomes for primary medical care, better
168
ONS, Public Service Productivity: Health, February 2006, p. 7-8 169
ONS, Public Service Productivity: Health, February 2006, p. 16. ONS take into account the recent studies on
measuring productivity conducted by the Atkinson Review (DoH, 2005) and a joint project by the University of York
and NIESR (York 2005) in producing their findings. 170
ONS, Public Service Productivity: Health, February 2006, p. 33 171
ONS, Public Service Productivity: Health, February 2006, p. 36 172
York CHE, Developing new approaches to measuring NHS output and productivity. Available at:
http://www.york.ac.uk/inst/che/pdf/rp6.pdf
© CIVITAS Institute for the Study of Civil Society 2006 Author: James Gubb, Civitas
www.civitas.org.uk/nhs/nhsMoney.php 07/2006
33
survival rates as a result of higher quality myocardial infarction and improving (non-clinical)
patient experience. It calculates the combined effect of to be equivalent to a further 1.03% increase
in output growth per annum (the use of statins accounts for 0.81%).173
But this does seem a slightly
sketchy and random selection of treatments; for one it is wholly unclear exactly how improvements
in patient experience reported in patient surveys relate to increases in quality of outcome. And why
not include, for example, cancer care- the most targeted focus of the NHS- or areas where it is not
doing so well, such as stroke care or mental health? The fact is quality is extremely difficult to
quantify. However, even if we take the DoH and York/NIESR measures, NHS productivity probably
still remains negative. According to ONS calculations, it lies somewhere between an average
increase of 0.2% per annum or an average decrease of 0.5% between 1999-2004, although there is
some evidence of improvement in latter years.174
The ONS, taking up the recommendation of the Atkinson Review, include a further adjustment to
productivity calculations, an allowance for the ‘value of health’- in effect changes in the marginal
social value of outcomes. The case is that health is becoming increasingly valuable in a growing
and increasingly productive economy.175
This adds the equivalent of a huge 2.6% per annum to
total NHS output growth 1999-2004, perhaps unsuprisingly making NHS productivity positive.
However this seems an entirely incorrect measure to include; productivity is intended to measure
changes in the real value of inputs and outputs in the NHS, regardless of a particular external value.
Including the ‘value of health’ in productivity calculations is akin to, for example, including
lifestyle change as contributing to NHS productivity, yet this is something explicitly exluded.
The significance of the figures on productivity is this. NHS output and activity has increased; this
much is not disputed. It has been shown throughout this review that certain notable improvements
in the NHS have occurred and there are few areas in which the service has not got at least slightly
better. However, the fact that productivity is negative (and probably remains so even when adjusted
for quality on the government’s favourable terms) means that improvements and increases in output
have in no way been proportional to the additional sums of money the NHS has received. On
balance, improvements in targeted areas are outweighed by the lack of improvment elsewhere. This
fact is highly supportive of the argument advanced thus far: that whilst the extra money might be
working to an extent, it is not working anything like it could do.
Indicative of the declining productivity is a recent report by the King’s Fund which suggests that
over half the money allocated to NHS Trusts has been absorbed in cost increases- such as inflated
wages- rather than service expansion or improvement.176
It is reported that the average pay for
newly qualified consultants has risen to £70,823, an astounding 68% more than in 1997, and GPs
are now paid around £100,000, double what they got in 2000.177
The NHS is also grappling to
balance its books; in 2004-5 the NHS declared an aggregate overspend of £251.2 million. 26 per
cent of NHS Trusts and 30% of PCTs failed to break even, with a substantial increase also in the
number of them with deficits or overspend significant in size (over 0.5% of income or available
revenue resources). Auditors are also reporting concerns about the financial standing of 59% of
NHS bodies for 2005-6.178
173
ONS, Public Service Productivity: Health, February 2006, p. 22-25 174
ONS, Public Service Productivity: Health, February 2006, p. 37 175
ONS, Public Service Productivity: Health, February 2006, p. 5 176
Appleby, J and Harrison, A, Spending on Healthcare: How much is enough?, King’s Fund, p.29 177
http://www.guardian.co.uk/comment/story/0,,1760312,00.html 178
NAO, Financial management in the NHS: NHS England summarised accounts 2004-05, London: The Stationery
Office, June 2006

© CIVITAS Institute for the Study of Civil Society 2006 Author: James Gubb, Civitas
www.civitas.org.uk/nhs/nhsMoney.php 07/2006
34
But the declining productivity is best represented through inefficiencies in examples at the ‘micro’
level. The Healthcare Commission’s ‘acute hospital portfolio review’ of day surgery, ward staffing
and A&E provides some of the most significant:
A&E
The average A&E department has 44 nurses and 17 doctors (measured as whole time equivalent)
and sees 60,000 patients per year, translating to approximately 10 patients arriving per hour at peak
times betwen 9am-7pm. For comparability between departments, the Healthcare Commission
expresses staffing levels as a ratio between actual staff numbers and the numbers of annual
attendances. It finds there is no relationship between the times patients spent in A&E and staffing
levels; ‘tightly staffed departments perform as well as generously staffed departments’. Moreover
‘when comparisons are made at individual department level, there is no association between staff
and improvement in times spent in A&E‟.179
There is of course the possibility that patients
attending generously staffed departments have a better standard of care180
, but the same report
reported no correlation between three ‘tracers’ on the quality of treatment (children in pain from a
broken wrist/elbow, hip fracture and overdose on paracetamol) and the ratio of staffing. The
unavoidable conclusion is there is considerable inefficiency in the system.
Ward staffing
Similar to that concerning A&E, no links were found by the Healthcare Commission between any
particular size of workforce and the experience of the patient or health outcomes. This suggests that
more staff may not be productive. Indeed this was their finding. NHS Trusts continue to employ
more nursing staff rather than similar numbers with higher grades, despite reported evidence that
there is a statistically significant relationship between patient turnover, improved patient satisfaction
(confirmed by the incidence of pressure ulcers) and lower numbers of accidents and incidents with
higher levels of registered nurses.181
Moreover the highest rates of sickness absence are for the
lowest qualified nurses- an average of 21.4 days a year at a cost of several million pounds. Alan
Maynard and Andrew Street of the CHE, University of York, argue the government also missed the
boat on ‘making pay increases conditional on productivity gains’.182
The medical profession,
including lower-grade nurses, was able to secure large pay increases subject to limited additional
contractual conditions. Perhaps as a result damning critques of low-grade nursing such as the
provided by a junior doctor working in an inner-city NHS hospital, writing in The Independent, are
far to prevalent:
„It is an open secret that the standard of nursing in British hospitals is poor; at least in the
innner cities. Sadly, excellent [high-grade] nurses who choose to stay working on the ward are the
exception rather than the rule. In my daily working life I encounter far too many unmotivated, off-
hand people who seem to be unable to differentiate between life-threatening scenarios and simple
patient requests, who vanish whenever a patient is incontinent, who spend their days bleeping the
doctor with every little thing and writing “Dr Informed” in the notes, before going to tea....‟183
. Dr Lucy Chapman (pseudonym)
179
Healthcare Commission, Acute hospital portfolio: A&E, August 2005, p.23-4 180
No statistics could be found on the relationship between patient survey results and A&E weighted staffing levels. 181
Healthcare Commission, Acute hospital portfolio: Ward staffing, August 2005 182
Maynard, A and Street, A, Health service reform: seven years feast, seven years of famine: from boom to bust in the
NHS?, BMJ, 15 April 2006 183
The Independent, They’re no angels: the public loves them, the government wants to give them more power, if only
you knew what nurses are really like, Tuesday 20 June 2006, pg.8 (‘Extra’)
© CIVITAS Institute for the Study of Civil Society 2006 Author: James Gubb, Civitas
www.civitas.org.uk/nhs/nhsMoney.php 07/2006
35
Interestingly many of the letters published in reply seemed to be more critical of Dr Chapman’s
decision to ‘use a newspaper to vent her frustration’ than fundamentally disagreeing with her.184
There has also been criticism directed at the government’s drive to train higher-grade nurses to
become ‘consultant nurses’. Newly-trained consultant nurses have been given a wide range of
additional responsibilities, such as limited prescribing, the power to order diagnostic tests, make and
receive referrals, admit and discharge patients from hospital and run more clinics. The OECD cites
a lack of definitive international evidence on the clinical and cost-effectiveness of increasing the
skill-mix for nurses, although consultant nurses do seem to be more patient-friendly than doctors.
This issue aside, there is still a more crucial point relevant to the NHS. The OECD found the move
towards consultant nursing in the NHS was primarily driven by the government and a direct
response to skills shortages, most poignantly represented by the low physician to nursing ratio
referred to in Chapter 3 and evidence provided by the Healthcare Commission (above).185
Given
this, the OECD is entirely correct in suggesting the training of consultant nurses in the NHS is both
likely to confuse and highly likely to shift the skills shortage problem further down the line with
consultant nurses offloading tasks to ineffective low-grade staff such as those adhered to by Dr
Chapman.
This matter is only compounded by the fact NHS Trusts continue to spend nearly 10 per cent of
their total nursing expenditure on temporary nursing (9.4% in 2004-5 compared with 10% in 1999-
2000), despite evidence provided by publications such Brief Encounters (Audit Commission, 2001),
the Gershon Efficiency Review (2004) and the cited Healthcare Commission report, that replacing
temporary staff with experienced permanent staff leads to improvements in cost, efficiency and
patient care.186
It is accepted that the use of temporary nursing is necessary in some cases to
address fluctuations in activity and vacancies, sickness absence and annual leave. There is a
particularly strong relationship between vacancy levels and expenditure on temporary nursing;
London has both the highest vacancy rate for nurses at 3.1 per cent and the highest expenditure on
temporary nursing at 17% of total nursing expenditure. Thirty-seven per cent of temporary nursing
shifts booked during 2004-5 related to covering vacancies.
Nonetheless even within London there is significant variation in expenditure on temporary nursing
between NHS Trusts of between five and 27 per cent of total nursing expenditure. This obviously
suggests that there are wider efficiency issues and indeed this is so. In a recent report, the NAO
identify potential savings of between £25 million and £50 million through trusts improving their
management of demand for temporary nursing staff and of between £13 million and £38 million by
improving their procurement of temporary nursing staff. The 25% shift from the use of agency
nursing to NHS Professionals and bank nursing (2003/4- 2004/5) is a significant improvement as
regards the latter (agency nurses are as much as 50 per cent more expensive without providing
better quality), although the NAO could find little evidence of trusts actually assessing relative costs
or undertaking performance assessment of temporary nurses. But the real worry is management of
demand. The NAO is highly critical of the culture of bottom-up decision-making on temporary
nursing, determined largely by the professional judgement of nurse managers. The inability to
recruit and retain staff, poor rota management, a lack of control over sick leave and annual leave,
and ineffective use of flexible working are all endemic. An interesting case study of St Mary’s
NHS Trust reveals focus on measures such as recruitment drives, informing regular agency nurses
that they must apply for posts in the hospital to continue working in the trust, and strict rota
management guidelines all resulted in a reduction in agency nursing expenditure of around 60 per
184
http://comment.independent.co.uk/letters/article1093486.ece 185
Buchan, Calman, Skill-mix and policy change in the health workforce: Nurses in advanced roles, OECD Health
Working Paper: 17, February 2005 186
NAO, Improving the use of temporary nursing staff in NHS acute and foundation Trusts, July 2006

© CIVITAS Institute for the Study of Civil Society 2006 Author: James Gubb, Civitas
www.civitas.org.uk/nhs/nhsMoney.php 07/2006
36
cent. This is a huge efficiency gain, but unfortunately such instances are much hard to come by.
Inefficiency prevails.
Day surgery
Day surgery is an area where major productivity gains are possible; procedures can be carried out
more predictably and with shorter waiting times, bed time is saved and there is less disruption to
patient’s lives, with a reduced risk of cross-infection because patients are not mixed with the
critically ill.187
An OECD study into waiting times cements such a conclusion; it showed that
countries reporting a higher percentage of procedures carried out as day surgery are also associated
with lower waiting times. An increase of 1 % in the percentage of day surgery is associated with a
reduction in mean waiting times of 0.7 days.188
Looking specifically at the US healthcare system,
the OECD find the fact that as much as half of surgical procedures in the US are carried out as day
cases is (along with the exceptionally high expenditure on healthcare) the most significant factor in
explaining its low waiting times.
Yet (and despite being loosely targeted by the government) NHS performance in day surgery does
not make good reading. OECD data reveals how day surgery actually decreased in the UK from
73.9 cases per 1,000 in 2000 to 72.7 in 2005.189
The Healthcare Commission showed an average of
14 per cent of planned day surgery operating sessions were cancelled and that 24% of operating
time was lost to delays or excessive gaps between operations. The former figure was actually as
high as a third for one in ten units. Restricting comparison to day surgery units that remained
substantially unchanged since 2000, weighted activity per member of staff fell by 24 per cent as of
2005 (primarily due to staff increases without much corresponding increase in day surgery output).
For each of the 25 ‘Basket 2000’ procedures targeted for day surgery, the Healthcare Commission
calculated that 74,000 extra cases could have been performed as day surgery (rather than inpatient
admissions) if each NHS Trust had been operating at the level of the best Trust. Given these trends
it concludes productivity improvements could result in increases in the total number of patients
treated on a day surgery basis of between 44-49 %.190
Summary
The inflated costs and poor efficiency highlighted in A&E, ward staffing and day surgery these
examples is apparently endemic across the NHS, given the statistics showing overall productivity is
falling. The return the NHS has achieved on the extra money pumped into it is much less than
ideal, which questions the value for money of the expenditure increases and tips any answer to the
question towards the conclusion extra money is not working (well). A recent King’s Fund paper
investigating spending on healthcare suggests that the additional benefits of the extra funding
probably do not outweigh the costs if a traditional cost-benefit analysis was done.191
187
Healthcare Commission, Acute Hospital Portfolio: Day Surgery, July 2005 188
Siciliani, L and Hurst, J, Explaining waiting times variations for elective surgery across OECD countries, OECD
Health Working Paper: 7, 2004 189
OECD, OECD Health Data 2006, June 2006 190
All statistics taken from: Healthcare Commission, Acute Hospital Portfolio: Day Surgery, July 2005 191
Appleby, J and Harrison, A, Spending on healthcare: How much is enough?, King’s Fund, 2006, ch.3
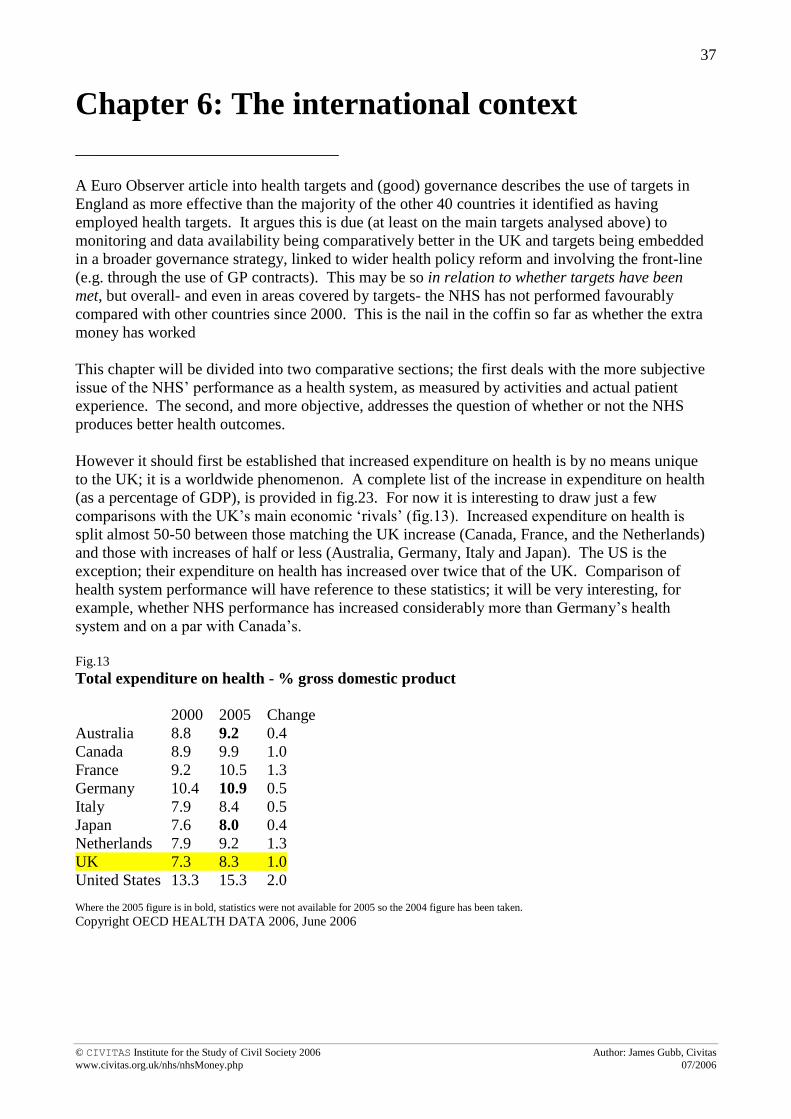
© CIVITAS Institute for the Study of Civil Society 2006 Author: James Gubb, Civitas
www.civitas.org.uk/nhs/nhsMoney.php 07/2006
37
Chapter 6: The international context
_________________________________
A Euro Observer article into health targets and (good) governance describes the use of targets in
England as more effective than the majority of the other 40 countries it identified as having
employed health targets. It argues this is due (at least on the main targets analysed above) to
monitoring and data availability being comparatively better in the UK and targets being embedded
in a broader governance strategy, linked to wider health policy reform and involving the front-line
(e.g. through the use of GP contracts). This may be so in relation to whether targets have been
met, but overall- and even in areas covered by targets- the NHS has not performed favourably
compared with other countries since 2000. This is the nail in the coffin so far as whether the extra
money has worked
This chapter will be divided into two comparative sections; the first deals with the more subjective
issue of the NHS’ performance as a health system, as measured by activities and actual patient
experience. The second, and more objective, addresses the question of whether or not the NHS
produces better health outcomes.
However it should first be established that increased expenditure on health is by no means unique
to the UK; it is a worldwide phenomenon. A complete list of the increase in expenditure on health
(as a percentage of GDP), is provided in fig.23. For now it is interesting to draw just a few
comparisons with the UK’s main economic ‘rivals’ (fig.13). Increased expenditure on health is
split almost 50-50 between those matching the UK increase (Canada, France, and the Netherlands)
and those with increases of half or less (Australia, Germany, Italy and Japan). The US is the
exception; their expenditure on health has increased over twice that of the UK. Comparison of
health system performance will have reference to these statistics; it will be very interesting, for
example, whether NHS performance has increased considerably more than Germany’s health
system and on a par with Canada’s.
Fig.13
Total expenditure on health - % gross domestic product
2000 2005 Change
Australia 8.8 9.2 0.4
Canada 8.9 9.9 1.0
France 9.2 10.5 1.3
Germany 10.4 10.9 0.5
Italy 7.9 8.4 0.5
Japan 7.6 8.0 0.4
Netherlands 7.9 9.2 1.3
UK 7.3 8.3 1.0
United States 13.3 15.3 2.0 Where the 2005 figure is in bold, statistics were not available for 2005 so the 2004 figure has been taken.
Copyright OECD HEALTH DATA 2006, June 2006

© CIVITAS Institute for the Study of Civil Society 2006 Author: James Gubb, Civitas
www.civitas.org.uk/nhs/nhsMoney.php 07/2006
38
Health system performance
Staffing
The suggestion made in Chapters 3, 4 and 5 that the NHS has got its staff mix wrong stands up to
international scrutiny. In 2000 the number of nurses to 1,000 of the population in the UK was
already above the OECD average; subsequent increases mean that in 2005 the UK had a ratio of
9.2, whereas the OECD average was just 8.3.192
This is not to say the OECD average is the
number to have; structures and specifics of healthcare systems inevitably differ. Indeed, at least
partly attributable to the ‘nursing bias’ in the UK, is the fact the UK has the highest rates of bed
occupancy (84.4% in 2005) and amongst the highest acute care turnover rates (48.7 cases per bed
per year) of all the countries in the OECD. Rates have also shown improvement between 2000-05
by 1.2 percentage points and 3.9 cases respectively.193
However, whilst the number of practicing physicians per 1,000 of the population has increased in
the UK at a faster rate than the vast majority of other OECD countries (from 1.9 in 1999 to 2.3 in
2005), it remains well below the OECD average of 3.0, ranking 24th
out of the 27 countries in the
OECD on this statistic.194
This is crucial given that OECD work suggests, with other things equal,
the number of physicians per capita is inversely associated with avoidable mortality195
and waiting
times196
across OECD countries. Moreover, due to increased female participation, an aging
physician workforce and the EU Working-Time Directorate (all associated with working fewer
hours), the overall supply of physicians in the UK has had to increase purely for the same amount
of ‘physician hours’ to be provided.197
Perhaps indicative of this is the fact the number of surgical
procedures (inpatient and day cases) per 1,000 of the UK population actually decreased between
2000-05; contrary to almost every other OECD country apart from Germany. Rates in Australia
and Italy increased by 7.8 and 3.3 cases per 1,000 despite health expenditure increasing by under
half that in the UK.198
Another worring trend is that the proportion of practising physicians in the UK who are generalists
(i.e. GPs) is comparatively low and falling (fig.14). This must be particularly concerning for the
government, given the desired shift towards a ‘primary-care led’ system, with more patient care
being carried out in GP surgeries.
192
OECD, OECD Health Data 2006, June 2006 193
OECD, OECD Health Data 2006, June 2006 194
OECD, OECD Health Data 2006, July 2006 195
Or, Z, Exploring the effects of healthcare on mortality across OECD countries, OECD, 2000 196
Simoens, Hurst, The supply of physician services in OECD countries, OECD, Health Working Paper: 21, Jan 2006.
This report also uncovered evidence of a relationship between the number of physicians and the extent to which the
state regulated medical school intake; a possible reason for under-supply in the UK. 197
Simoens, Hurst, The supply of physician services in OECD countries, OECD, Health Working Paper: 21, Jan 2006,
ch.4 198
OECD, OECD Health Data 2006, June 2006. This is not suggesting that surgery is the answer to any and every
medical problem. It is possible that the NHS is becoming more efficient by decreasing surgery, but the fact public
health if anything seems to be deteriorating means this seems unlikely.
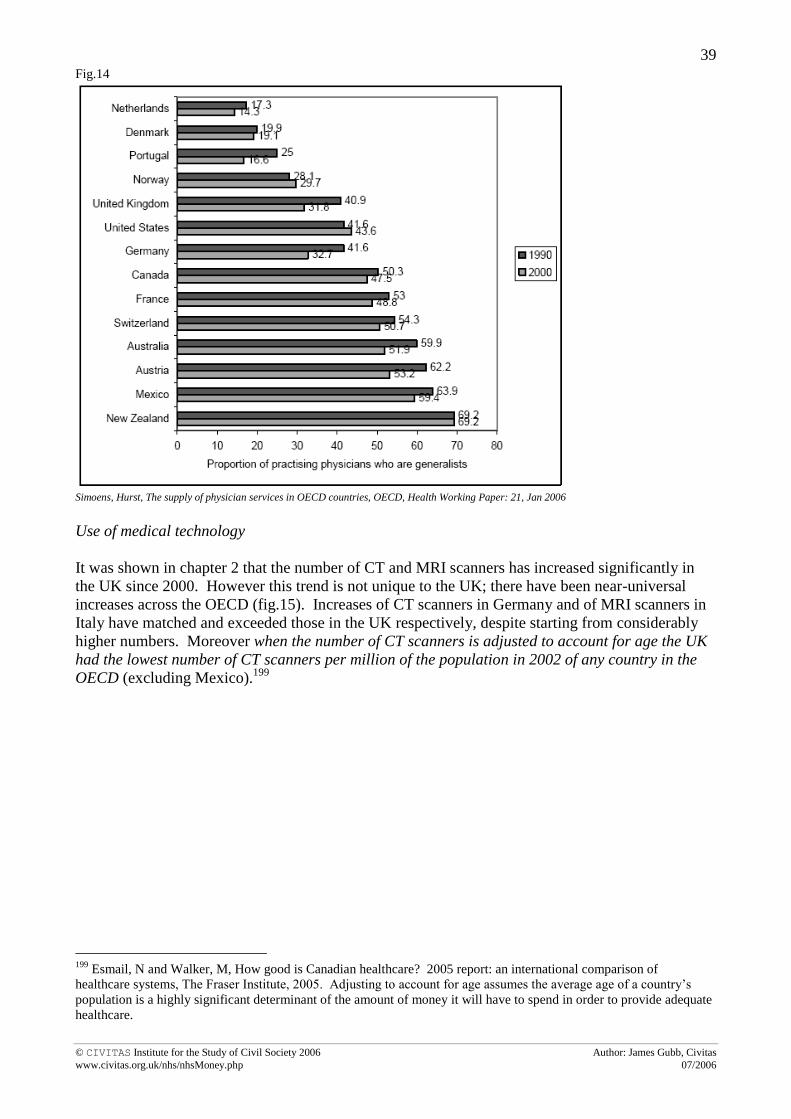
© CIVITAS Institute for the Study of Civil Society 2006 Author: James Gubb, Civitas
www.civitas.org.uk/nhs/nhsMoney.php 07/2006
39
Fig.14
Simoens, Hurst, The supply of physician services in OECD countries, OECD, Health Working Paper: 21, Jan 2006
Use of medical technology
It was shown in chapter 2 that the number of CT and MRI scanners has increased significantly in
the UK since 2000. However this trend is not unique to the UK; there have been near-universal
increases across the OECD (fig.15). Increases of CT scanners in Germany and of MRI scanners in
Italy have matched and exceeded those in the UK respectively, despite starting from considerably
higher numbers. Moreover when the number of CT scanners is adjusted to account for age the UK
had the lowest number of CT scanners per million of the population in 2002 of any country in the
OECD (excluding Mexico).199
199
Esmail, N and Walker, M, How good is Canadian healthcare? 2005 report: an international comparison of
healthcare systems, The Fraser Institute, 2005. Adjusting to account for age assumes the average age of a country’s
population is a highly significant determinant of the amount of money it will have to spend in order to provide adequate
healthcare.

© CIVITAS Institute for the Study of Civil Society 2006 Author: James Gubb, Civitas
www.civitas.org.uk/nhs/nhsMoney.php 07/2006
40
Fig.15
Access and waiting times
International data on access and waiting times is difficult to come by, and many studies cannot be
readily compared due to the variability of survey designs.200
A recent patient survey by the
Commonwealth Fund in 2005 of ‘sicker’ adults in six countries including the UK is probably the
best source of information available (fig.16).201
One of the most positive features of the NHS originates from the fact it provides universal access to
its patients ‘free at the point of use’. As a result the NHS scores exceptionally well by international
standards on patient’s reporting access problems due to cost with, for example, only 4 per cent of
patients reporting they did not visit a doctor when sick due to cost. By contrast figures were as high
as 34 per cent and 14% in in the US and Germany respectively. The NHS also scored
comparatively well in terms of the ability of patients to get an appointment to see a doctor on the
same day or the next day; worse than Australia and Germany, but considerably better than Canada
(whose health system is based on the NHS) and the US.
However, and despite the recent improvements in waiting times, NHS patients still wait
considerably longer than patients in other countries. Sixty per cent of patients in the UK reported
waiting longer than 4 weeks for a specialist appointment (in 2005), closely matched by Canada
where 57% of patients said the same, but far above the figures of 23% for the US and 22% for
Germany. Similarly 41% of patients surveyed in the UK said they waited 4 months or more for
elective surgery, compared with 33% in Canada, 20% in New Zealand, 19% in Australia and below
10% in the US and Germany. The OECD in a report in 2003 showed waiting times to be an issue in
12 OECD countries, including four (Australia, Canada, New Zealand and the UK) of the six
countries surveyed by the Commonwealth Fund. It identified a further eight countries (including
200
Esmail, N and Walker, M, How good is Canadian healthcare? 2005 Report: An international comparison of
healthcare systems, Fraser Institute, 2005, p.43 201
See: Schoen et al, Taking the pulse of healthcare systems: experiences of patients with health problems in six
countries, Commonwealth Fund, 2005, Exhibit 6

© CIVITAS Institute for the Study of Civil Society 2006 Author: James Gubb, Civitas
www.civitas.org.uk/nhs/nhsMoney.php 07/2006
41
the US and Germany) where waiting times were low enough to not be an issue.202
It is therefore
perhaps unrealistic to expect the UK, and by implication the NHS, to have reached the heights of
the US and Germany’s waiting times in just five years. But it is disappointing that it has failed to
catch up with either Canada, New Zealand or, in particular, Australia given that its increase in
expenditure on health has only been half that in the NHS. It is true the statistics relate only to the
experience of ‘sicker adults’, but these are precisely the ones that should be treated quickest.
Fig.16
202
Siciliani, L and Hurst, J, Explaining waiting times for elective surgery across OECD countries, OECD Health
Working Paper: 7, 2003

© CIVITAS Institute for the Study of Civil Society 2006 Author: James Gubb, Civitas
www.civitas.org.uk/nhs/nhsMoney.php 07/2006
42
Patient engagement and self-care
The same international survey conducted by the Commonwealth Fund of ‘sicker adults’ and an
earlier survey in 2004 of ‘adults’ shows ‘the UK results were less positive than those from other
countries [Australia, Canada, New Zealand, Germany and the US] [in terms of] patient
engagement’.203
NHS patients tended to give more positive reports of their experience in
communicating with doctors than the other countries (apart from Australia and New Zealand) and
for participation in organised preventative care programmes. NHS Direct was commended for
improving access204
and NHS patients experienced medical mistakes as much as 10 per cent less
than other countries surveyed in their treatment or care.205
However NHS patients are less likely than those in the other countries to say they received
opportunistic advice from doctors on disease prevention and lifestyle modification- for example on
weight, diet, exercise or stress prevention (fig.17).206
When receiving treatment, fewer NHS
patients said their doctors involved them in decisions. Among people with recent health problems,
those in the UK were the least likely to have received a clear explanation of treatment goals and a
self-care plan to manage their condition through good diet etc, so preventing future relapses
(fig.18).207
Similar conclusions were drawn by Schoen et al, analysing only an the international
survey for sicker adults. They found management of care, condition and medication for those with
chronic diseases to be below average in the UK when compared with the other countries. For
example only 45 per cent were given plans to manage care at home, compared with as many as 65%
in Canada.208
Fig. 17
Fig.18
Such findings should be of particular concern; the Wanless Report- taken up by the government as
its basis for future funding of the NHS- believed a dramatic change in professional and patient roles
was necessary to ensure the long-term sustainability of the NHS. Yet the Picker Institute conclude
the international surveys show ‘[this] does not seem to have begun....healthcare delivery in the NHS
203
Coulter, A, Engaging patients in their healthcare; how is the UK doing relative to other countries, Picker Institute,
April 2006, p.1 204
Coulter, A, Engaging patients in their healthcare; how is the UK doing relative to other countries, Picker Institute,
April 2006, p. 14-16 205
Schoen et al, Taking the pulse of health systems: Experience of patients with health problems in six countries,
Commonwealth Fund, November 2005, Exhibit 3. 206
Coulter, A, Engaging patients in their healthcare; how is the UK doing relative to other countries, Picker Institute,
April 2006, p. 18-19 207
Coulter, A, Engaging patients in their healthcare; how is the UK doing relative to other countries, Picker Institute,
April 2006, p. 24 208
Schoen et al, Taking the pulse of health systems: Experience of patients with health problems in six countries,
Commonwealth Fund, November 2005, Exhibits 4,5.

© CIVITAS Institute for the Study of Civil Society 2006 Author: James Gubb, Civitas
www.civitas.org.uk/nhs/nhsMoney.php 07/2006
43
is still much too paternalistic and the patient’s role in protecting and promoting their own health is
still too widely ignored’.209
On a number of fronts NHS performance, as a health system in an
international context, is found wanting.
Health outcomes
Measuring the performance of a healthcare system by health outcomes is notoriously difficult, not
least because the health of the population is a function of many inputs, only one of which is the
healthcare system. Nonetheless this section attempts such an analysis, using measures such as
mortality rates from disease and potential years of life lost (PYLL) shown to isolate health system
effects as much as is currently possible.210
It begins by looking at the international picture of
particular diseases (cancer, CHD and stroke) referred to in Chapters 3 and 4, before extrapolating
trends identified here to look at public health and ‘overall’ health outcomes.
Cancer
The fairly impressive achievements of the NHS in tackling cancer (Chapter 3) are lessened
somewhat if looked at in an international context. In terms of potential years of life lost to cancer (a
summary measure of premature mortality that is a priori preventable) the UK has been less
successful than its rivals between 2000-03, with the exception of Australia, the US and France
(fig.19). One should be careful in interpreting this data. For example, the NHS contributes
significantly more information than other countries and is therefore likely to be more representative
of the population as a whole. As a result OECD data may tend to over-estimate the comparative
gains of other countries.211
That said it could equally work in the opposite direction as data quality
improves in other countries. Moreover it is hard to believe such effects discount the overall
impression; after all improvements in Germany, Canada and Japan have been above or near double
those in the UK. This is clearly very damaging for the NHS given the government’s pledge in the
Cancer Plan to ‘deliver the fastest improvement in cancer services anywhere in Europe over the
next five years’.
Fig.19
Malignant neoplasms - <70 year, years lost/100 000 pop.
2000 2001 2002 2003 Absolute Change (2000-03)
Canada 893 869 847 847 -54
France 1088 1064 1059 1059 -29
Germany 948 915 907 892 -56
Italy 934 906 890 890 -44
Japan 799 776 744 725 -74
UK 943 923 912 912 -31
United States 924 911 895 895 -29
Australia 817 814 800 800 -17
Netherlands 998 966 961 943 -55
Copyright OECD HEALTH DATA 2006, June 2006
209
Coulter, A, Engaging patients in their healthcare; how is the UK doing relative to other countries, Picker Institute,
April 2006, p. 30, 31 210
See OECD, Health Working Papers 23-25 211
See, for example: http://info.cancerresearchuk.org/news/behindtheheadlines/europeancancersurvival/
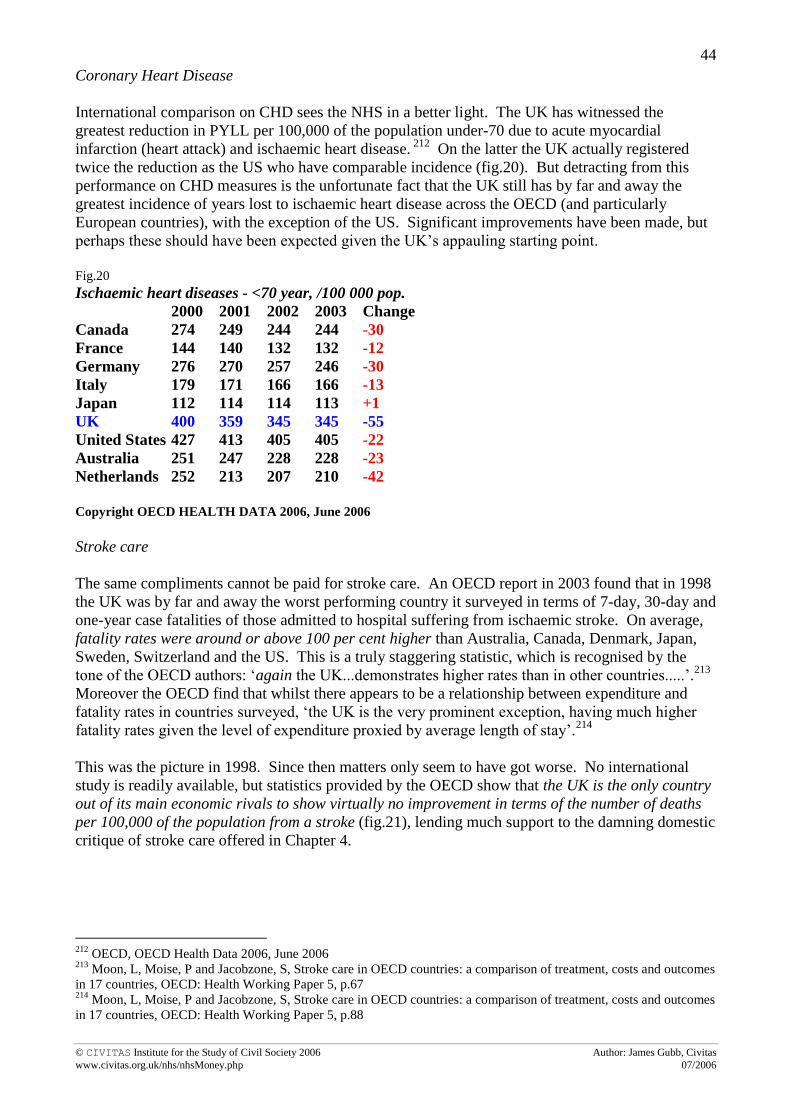
© CIVITAS Institute for the Study of Civil Society 2006 Author: James Gubb, Civitas
www.civitas.org.uk/nhs/nhsMoney.php 07/2006
44
Coronary Heart Disease
International comparison on CHD sees the NHS in a better light. The UK has witnessed the
greatest reduction in PYLL per 100,000 of the population under-70 due to acute myocardial
infarction (heart attack) and ischaemic heart disease. 212
On the latter the UK actually registered
twice the reduction as the US who have comparable incidence (fig.20). But detracting from this
performance on CHD measures is the unfortunate fact that the UK still has by far and away the
greatest incidence of years lost to ischaemic heart disease across the OECD (and particularly
European countries), with the exception of the US. Significant improvements have been made, but
perhaps these should have been expected given the UK’s appauling starting point.
Fig.20
Ischaemic heart diseases - <70 year, /100 000 pop.
2000 2001 2002 2003 Change
Canada 274 249 244 244 -30
France 144 140 132 132 -12
Germany 276 270 257 246 -30
Italy 179 171 166 166 -13
Japan 112 114 114 113 +1
UK 400 359 345 345 -55
United States 427 413 405 405 -22
Australia 251 247 228 228 -23
Netherlands 252 213 207 210 -42
Copyright OECD HEALTH DATA 2006, June 2006
Stroke care
The same compliments cannot be paid for stroke care. An OECD report in 2003 found that in 1998
the UK was by far and away the worst performing country it surveyed in terms of 7-day, 30-day and
one-year case fatalities of those admitted to hospital suffering from ischaemic stroke. On average,
fatality rates were around or above 100 per cent higher than Australia, Canada, Denmark, Japan,
Sweden, Switzerland and the US. This is a truly staggering statistic, which is recognised by the
tone of the OECD authors: ‘again the UK...demonstrates higher rates than in other countries.....’.213
Moreover the OECD find that whilst there appears to be a relationship between expenditure and
fatality rates in countries surveyed, ‘the UK is the very prominent exception, having much higher
fatality rates given the level of expenditure proxied by average length of stay’.214
This was the picture in 1998. Since then matters only seem to have got worse. No international
study is readily available, but statistics provided by the OECD show that the UK is the only country
out of its main economic rivals to show virtually no improvement in terms of the number of deaths
per 100,000 of the population from a stroke (fig.21), lending much support to the damning domestic
critique of stroke care offered in Chapter 4.
212
OECD, OECD Health Data 2006, June 2006 213
Moon, L, Moise, P and Jacobzone, S, Stroke care in OECD countries: a comparison of treatment, costs and outcomes
in 17 countries, OECD: Health Working Paper 5, p.67 214
Moon, L, Moise, P and Jacobzone, S, Stroke care in OECD countries: a comparison of treatment, costs and outcomes
in 17 countries, OECD: Health Working Paper 5, p.88

© CIVITAS Institute for the Study of Civil Society 2006 Author: James Gubb, Civitas
www.civitas.org.uk/nhs/nhsMoney.php 07/2006
45
Fig.21
Cerebrovascular diseases - Deaths /100000 pop. (sdr) 1999 2000 2001 2002 2003 2004 2005 Change
Canada 38.7 37.8 36.5 35.3 35.3 -3.4
France 39.4 37.0 35.9 34.6 34.6 -4.8
Germany 60.8 55.8 53.5 52.2 50.3 45.4 45.4 -5.4
Italy 63.9 61.3 57.1 55.4 55.4 -8.5
Japan 67.2 61.1 58.2 55.2 53.9 53.9 -13.3
UK 63.3 63.3 63.7 63.9 63.9 -0.6
United States 44.0 43.2 41.1 39.9 39.9 -4.1
Australia 49.3 47.4 44.9 43.9 43.9 -5.4
Finland 65.2 63.9 60.4 58.7 58.2 53.7 53.7 -11.5
Denmark 58.8 57.0 56.9 56.9 -1.9
Netherlands 55.7 53.8 51.5 52.1 47.9 45.2 45.2 -10.5
Switzerland 38.1 35.4 33.1 31.7 31.7 -6.4
Copyright OECD HEALTH DATA 2006, June 2006
Public health
A worrying statistic for the likelihood of future gains in CHD and stroke care is the UK’s similarly
woeful (absolute) international performance on public health measures. It is no coincidence the UK
scores poorly in comparison with other countries on the incidence of CHD, strokes and cancer on
public health measures such as alcohol consumption, smoking, levels of physical activity and
obesity. For example OECD statistics reveal that only the US and Canada suffer comparable rates
of obesity to the UK (near 25 per cent); the European average is around 10%, although Germany
and Greece are notable exceptions (see fig.22).215
Similarly overall levels of physical activity for
every age-group are comparatively low in the UK (and significantly below the EU average), the UK
has the worst levels of alcohol consumption in the OECD216
and one of the lowest intakes of fruit
and vegetables in the EU.217
Fig.22- Prevalence of obestiy in Europe, WHO, 2002
215
OECD, OECD Health data 2006, June 2006 216
OECD, OECD Health data 2006, June 2006 217
Steven Allender, Viv Peto, Peter Scarborough, Anna Boxer and Mike Rayner (2006) Coronary heart disease
statistics. BHF: London

© CIVITAS Institute for the Study of Civil Society 2006 Author: James Gubb, Civitas
www.civitas.org.uk/nhs/nhsMoney.php 07/2006
46
„All‟ diseases
The poor improvement in NHS performance compared with other countries between 2000 and
2005/6 in tackling specific diseases such as cancer and strokes, and the continuing high absolute
incidence of CHD, is mirrored by health outcomes for ‘all’ diseases. Two figures are presented in
this regard. The first (fig.23) is an international comparison of mortality rates from disease,
obtained from summing the causes of death on which data is provided by the OECD.218
The second
(fig.24) is obtained in the same fashion, but is an international comparison of PYLL that are a priori
preventable:
Fig.23 Mortality in the OECD- Deaths /100000 pop.
Mortality
Rate in 1999 1999 Rank Mortality
Rate in 2003 2003 Rank
Absolute change in Mortality
Rate 1999-03
Percentage change in
Mortality Rate 1999-03
Change in % GDP spent on
healthcare
Japan 445.0 1 394.2 1 -50.8 -11.4 0.6
Switzerland 499.4 2 455.4* 2 -44 -8.8 1.0
France 500.3 3 477.8* 3 -22.5 -4.5 1.2
Iceland 565.0 9 479.9 4 -85.1 -15.1 1.2
Australia 519.2 4 485.9* 5 -33.3 -6.4 0.8
Italy 552.0 8 501.8* 6 -50.2 -9.1 0.6
Norway 572.7 12 508.4 7 -64.3 -11.2 0.7
Canada 547.7 6 511.7* 8 -36 -6.6 0.9
Sweden 541.0 5 514.9* 9 -26.1 -4.8 0.9
Spain 566.2 10 518.2 10 -48 -8.5 0.6
Greece 577.3 13 552.4 11 -24.9 -4.3 0.9
Finland 609.5 17 554.3 12 -55.2 -9.1 0.5
Korea 551.2 7 559* 13 7.8 1.4 0.8
Austria 592.6 14 565.5 14 -27.1 -4.6 0.0
Netherlands 608.3 16 573.6 15 -34.7 -5.7 1.1
Portugal 620.0 18 577.5 16 -42.5 -6.9 1.1
Germany 606.1 15 576.8 17 -23.3 -4.8 0.4
Luxembourg 567.3 11 589.2 18 21.9 3.9 1.9
US 639.3 19 606.2* 19 -33.1 -5.2 2.1
UK 654.5 20 607.3* 20 -47.2 -7.2 0.8
Denmark 674.6 21 640.1* 21 -34.5 -5.1 0.4
Ireland 758.8 22 646.4* 22 -112.4 -14.8 1.0
Poland 789.4 23 729.4 23 -60 -7.6 0.6
Czech Rep 804.0 24 781.2 24 -22.8 -2.8 0.8
Slovak Rep 887.5 25 854.1* 25 -33.4 -3.8 0.1
Hungary 994.7 26 907 26 -87.7 -8.8 1.0 *Estimate based on figure for 2002. Data was not available for Belgium, Turkey or Mexico. Mortality is calculated from all causes not external or
poorly defined, as per the work of Esmail, N and Walker, M, (2005).
Copyright OECD HEALTH DATA 2006, June 2006, calculations by the author
218
Data on the following diseases is used: infectious/parasitic, malignant neoplasms (cancer), diseases of the blood,
endocrine/metabolic diseases, mental disorders, diseases of the nervous system, circulatory system (including stroke
and CHD), respiratory system, digestive system, skin, muscluloskeletal system, genitourinary system, perinatal
conditions, congenital anomalies and deaths in pregnancy/childbirth. See: OECD, OECD Health Data 2006.

© CIVITAS Institute for the Study of Civil Society 2006 Author: James Gubb, Civitas
www.civitas.org.uk/nhs/nhsMoney.php 07/2006
47
Fig.24.Potential years of life lost (PYLL) in the OECD <70 years /100,000 population
PYLL in
1999 1999 Rank PYLL in
2003 2003 Rank
Absolute change in
PYLL 1999-03
Percentage change in
PYLL 1999-03
Change in % GDP spent
on healthcare
Iceland 2163 2= 1635 1 -528 -24.4 1.2
Japan 2163 2= 1932 2 -231 -10.7 0.6
Sweden 2157 1 1976* 3 -181 -8.4 0.9
Norway 2495 7 2142 4 -353 -14.1 0.7
Switzerland 2293 4 2156* 5 -137 -6.0 1.0
Australia 2488 6 2250* 6 -238 -9.6 0.8
Greece 2709 13 2346 7 -363 -13.4 0.9
Finland 2658 10 2363 8 -295 -11.1 0.5
Italy 2624 9 2381 9 -243 -9.3 0.6
Canada 2520 8 2400* 10 -120 -4.8 0.9
Luxembourg 2408 5 2476 11 68 2.8 1.9
Netherlands 2716 14 2549 12 -167 -6.1 1.1
France 2682 11 2579* 13 -103 -3.8 1.2
Spain 2815 15 2580* 14 -235 -8.3 0.6
Germany 2837 16 2609 15 -228 -8.0 0.4
Austria 2692 12 2637 16 -55 -2.0 0.0
Denmark 3206 19 2911 17 -295 -9.2 0.4
Korea 3138 18 2923* 18 -215 -6.9 0.8
UK 3089 17 2949* 19 -140 -4.5 0.8
Portugal 3409 21 3093 20 -316 -9.3 1.1
Ireland 3252 20 3131* 21 -121 -3.7 1.0
Czech Rep 3589 23 3283 22 -306 -8.5 0.8
US 3585 22 3410* 23 -175 -4.9 2.1
Poland 4537 24 3892 24 -645 -14.2 0.6
Slovak Rep 4784 25 4383* 25 -401 -8.4 0.1
Hungary 6318 26 5486 26 -832 -13.2 1.0 *Estimate based on figure for 2002. Data was not available for Belgium, Turkey or Mexico. Mortality is calculated from all causes not external or
poorly defined, as per the work of Esmail, N and Walker, M, (2005).
Copyright OECD HEALTH DATA 2006, June 2006, calculations by the author
Fig.23 and fig.24 confirm overall health outcomes have improved in the UK, as was the case with
health outcomes for specific diseases, and most significantly in terms of mortality rates from
disease. 219
However, again consistent with health outcomes for specific diseases (except CHD),
improvments have been somewhat lacklustre compared with other OECD countries. This is
particularly the case concerning PYLL, which has only fallen in the UK by 140 ‘years’, or 4.5 per
cent of the 3089 figure for 1999. ‘Only’ is the operative word; only 4 countries (Ireland, Austria,
France and Luxembourg) out the 26 included have registered a worse performance in percentage
terms on PYLL than the UK. UK performance has been so bad that it has fallen two places in
rankings on absolute levels of PYLL from 17th
to 19th
. UK performance is not excused by the
219
For commentary on why mortality rates from disease and potential years lost due to (a priori preventable) disease are
the two of the best available measures of the effects of health systems on health outcomes see: Esmail, N and Walker,
M, How good is Canadian healthcare? 2005 report: An international comparison of healthcare systems, Fraser Institute,
2005

© CIVITAS Institute for the Study of Civil Society 2006 Author: James Gubb, Civitas
www.civitas.org.uk/nhs/nhsMoney.php 07/2006
48
existence of any correlation between PYLL in 1999 and the absolute or percentage decrease of
PYLL subsequently, because there is none. The two most impressive performers on both absolute
change and percentage change in PYLL were Iceland and Poland, ranked 2nd
and 24th
respectively
in 1999. Nor does there seem to be a correlation between the increase in health expenditure
between 1999-2003 and the absolute or percentage decrease in PYLL in this period. The UK
witnessed an equivalent increase in health expenditure as Australia and Canada, yet both saw a
decrease in PYLL nearly twice that of the UK. In fact Italy, Denmark and Germany also registered
similar decreases as Canada (i.e. twice that of the UK), despite health expenditure only increasing
by half the UK rate (in terms of GDP devoted to healthcare).
The case is slightly better when one looks at mortality rates from disease. The UK has registered an
absolute reduction in mortality rates of 47.2 that is above the OECD average of 41.1220
and the
reduction has been more impressive than the countries just mentioned except Italy (and significantly
more so than Germany’s figure of 23.3). However the majority of the improvement registered is the
result of falling mortalities from CHD, which, although a welcome development, remains
comparatively high in absolute terms. Moreover, even conceding the inclusion of CHD, there
remain eleven countries that outperformed the UK. This is reflected by the fact the UK‟s
comparative position remains unchanged at a lowly 20th
out of the 26 countries surveyed.
In the NHS’ defence we can say that the statistics only run to 2003 and, in fact, the 2003 figure for
the UK is only an estimate based on 2002 levels. There remains the possibility that performance
has improved substantially since then, as has been the case with the Netherlands, but given ONS
statistics on UK productivity presented in Chapter 5 we have to assume this is unlikely.
Summary
International comparison between the NHS and other countries’ healthcare systems is in many ways
the definitive argument so far as the question: ‘is the extra money working?’ is concerned. Much
the same as in the domestic domain, the international context shows there have been improvements
in NHS performance, but compared with improvements in health outcomes registered in other
countries the NHS has not provided good value for money. Across the different areas of care this
conclusion varies in its force- utterly fair concerning stroke care, but probably slightly harsh
concerning CHD- but when health outcomes are taken as a whole the statistics do not deceive.
Indicative of this is the fact the first section, which compares health system activities, revealed the
NHS still suffers from a (comparatively) low level of physicians, low endowment of medical
technology, higher waiting times and low patient engagement.
Only one get-out clause remains: is it too early to be making such judgements?
220
The average is obscured downwards by the fact Korea and Luxembourg actually registered increases of mortality
rates, but also upwards by Ireland’s impressive performance.
© CIVITAS Institute for the Study of Civil Society 2006 Author: James Gubb, Civitas
www.civitas.org.uk/nhs/nhsMoney.php 07/2006
49
Chapter 7: Too early to make a judgement?
_________________________________
It must be acknowledged that a number of key government reform initiatives for the NHS are either
in the early stages of their initiation or at a ‘teething’ stage in their development. These include
crucial measures such as payment-by-results, practice-based commissioning and the widespread
introduction of independent providers in secondary care. The whole NHS ‘ethos’ will be changed
by these measures; and they will surely have at least some significant effects on NHS activity and
health outcomes. It is therefore plausible we risk jumping to conclusions on the effectiveness of the
extra money too quickly. Certainly this is the view of former No.10 advisor Julian Le Grand. He
argues that without three key elements- patient choice (also facilitated by much improved supplies
of information), money following that choice and alternative providers- there is little embedded
incentive for improvement within the NHS.221
It must also be pointed out that it has been very
difficult for the NHS to function effectively given the constant bombardment of reform it has had to
face.
Nonetheless, if the effects of patient choice et cetera posited by Le Grand are to be realised (it is an
‘if’) did the government not have the opportunity to introduce such measures much earlier?
Although the NHS Plan called for a patient-centred NHS, in reality the government’s strategy
towards the NHS was dominated by top-down performance management at least until the
publication of the White Paper, NHS Improvement Plan (DoH 2004), which called for a much more
overt focus on choice and diverse providers. Before this the DoH predominantly ‘told the [NHS]
providers that they have to provide a good service, set targets for that service (spread ‘best
practice’) and penalise them if they fail’.222
The government presented this as a logical transition;
the NHS Improvement Plan states ‘waiting for treatment is no longer the major issue, [focus now
turns to]...flexible access around individual needs and preferences and choice’.223
But the reality is
they probably realised the top-down approach, strangely placed with ‘partnership’, was not using
the extra money effectively. Indeed Le Grand is surprised that the government’s initial strategy of
top-down targets has succeeded at all.224
Why not plan for payment-by-results and competition
between providers in the NHS Plan?
That said, it is not entirely clear that the reforms will actually make a substantial difference; a
further reason why it is not too early to make a judgement. A recent OECD report into the reform
experience of various countries showed that lines of reform have generally followed similar
patterns, seeking primarily to address inappropriate incentives through increasing accountability for
healthcare providers, increasing attention on patient experience, providing patient choice and
introducing a purchaser-provider split.225
Yet none of these reforms are shown to reliably increase
performance and productivity. Crucially, most of them have already been introduced into the NHS.
However, few countries (with the possible exceptions of Germany and Switzerland) have yet had
the political will to fully introduce competitive pressures, thereby providing strong provider
incentives and the necessity for purchasers to acquire the necessary skills and information to place
enough pressures on providers for change. If the NHS is preparing to go down this route, which the
reform programme being introduced now would logically carry it to, then the suggestion is that
221
LSE: Public Lecture by Professor Julian Le Grand at LSE on 21 Feb 2006 222
LSE: Public Lecture by Professor Julian Le Grand at LSE on 21 Feb 2006 223
DoH, The NHS Improvement Plan, 2004 224
LSE: Public Lecture by Professor Julian Le Grand at LSE on 21 Feb 2006 225
Docteur, E and Oxley, H, Healthcare systems: Lessons from the reform experience, OECD, December 2003

© CIVITAS Institute for the Study of Civil Society 2006 Author: James Gubb, Civitas
www.civitas.org.uk/nhs/nhsMoney.php 07/2006
50
tangible and significant improvements maybe possible. But will it really go that far? Here it really
is too early to say. For now, a quick glance at the three main initiatives, payment-by-results,
practice-based commissioning and independent sector providers reveals the following:
Payment-by-results
Payment-by-results has considerable potential to drive improvement in efficiency and offer greater
fairness and transparency in funding. The OECD, for example, finds that ‘activity-based funding is
likely to encourage higher productivity compared to funding based on fixed budgets’.226
It cites
studies on Norway and Denmark indicating significant growth in hospital activity upon a switch to
activity-based funding; by 1.2 per cent per annum in the growth rate of the former, and by 13% pa
in growth for the latter.
The Audit Commission found that early implementers of payment-by-results are ‘on balance,
positive about the change…both PCTs and foundation trusts report greater clarity of roles and
responsibilities, a positive change in culture and accountability and improved understanding of their
business and local health economy’.227
Nonetheless rolling out the programme across the NHS will
be challenging. It is well-documented that payment-by-results creates an unprecedented level of
financial risk for both PCTs (committed to pay for work at a nationally set price, but with limited
control over volumes) and for NHS Trusts (greater financial exposure from changes in activity
levels). Foundation trusts are those trusts that have had the better financial performance
historically, yet the implementation proved to be complex and time-consuming (costing an average
of £100,000) even for them, with some reporting less attention paid to quality of care in the
transition period. Given this, the Audit Commission concludes payment-by-results has huge
potential to destabilise those struggling to balance their books, those unprepared and those with
complex commissioning environments.228
In sum it exposes the NHS’ existing weaknesses; will
the government have the political will to drive it through? And will the costs outweigh any long-
term benefits?
Practice-based commissioning
Practice-based commissioning is only likely to add to such financial pressures through exacerbating
the costs of management and managing demand. It does provides the primary care sector with an
important opportunity to drive through significant improvements in commissioning of secondary
care services for patients and the opportunity to make better use of resources given that practices
account for 80% of the NHS budget. But as yet the Audit Commission reports that in only 20% of
PCTs have all general practices adopted PBC, whilst ‘few [PCTs] have been able to look beyond
the initial mechanics of engaging clinicians, giving practices the information they need and setting
budgets’.229
There is also confusion over the exact roles of PCTs and individual surgeries, given
that they will both have commissioning roles.
Independent sector treatment centres (ISTCs)
According to the DoH ISTC Report, published in February 2006, over 250,000 NHS patients have
now been treated by, or received a diagnostic service from, the independent sector with patient
satisfaction running at 94%.230
This is supported by a survey undertaken by RAND Europe, the
King’s Fund and City University into the London Patient Choice Project, which found that 65 per
cent of patients chose to move to an alternative provider with a shorter waiting time. Of those 65%,
226
Siciliani, L and Hurst, J, Explaining waiting times variations for elective surgery across OECD countries, OECD
Health Working Paper: 7, 2004 227
Audit Commission, Early lessons from Payment-by-Results, 2006 228
Audit Commission, Early lessons from Payment-by-Results, 2006 229
Audit Commission, Early lessons from practice-based commissioning, 2006 230
DoH, Independent sector treatment centres: A report from Ken Anderson, Commercial Director DoH, February 2006
© CIVITAS Institute for the Study of Civil Society 2006 Author: James Gubb, Civitas
www.civitas.org.uk/nhs/nhsMoney.php 07/2006
51
97% recommended the system of choice and positive experiences were reported in ISTCs.231
The
inspectorate of ISTCs, PMAS (Performance Management Analysis Service), also reported ‘early
results of quality monitoring are positive’, with only a few instances of performance outside of
expectation, predominantly in unforeseen clinical cancellations of surgery. It sees this as
particularly impressive because (at least in its view) the quality assurance system is ‘more ambitious
and demanding than that for the NHS’.
The NHS Confederation has provided evidence that the independent sector providing innovative
services that make a real difference to patient care and value for money in the NHS. For example,
the Terrence Higgins Trust has begun running community HIV and STI testing services in
community settings such as leisure centres and have tested over 2,500 patients. The Horder Centre
has developed the Joint Excellence Programme, to support patients during all stages of joint
replacement surgery from pre-admission to post-discharge; a programme the NHS is interested in
adopting.232
However there are concerns over costs. Ken Anderson, the Commercial Director of the DoH,
writes that whilst ISTCs are cheaper than spot providers, equivalent costs vary both above and
below NHS costs. The ISTC in Oxfordshire is a case in point; the BMA reports it has cost the local
health economy over £200,000 in its first six months; carrying out only 93 of the 600 procedures it
was contracted to perform, apparently because waiting times are not a problem in Oxford (the
average wait is only five weeks for ophthalmology).233
A recent report by the House of Commons
committee for health in fact concluded ISTCs ‘have not brought major benefits to the NHS’,
because they have been poorly integrated and come at the cost of cuts in hospital services.234
The
case of retired consultant Dr Andy Walker’s hernia operation at Shepton Mallet ISTC is a recent
example. Surgeons failed to remove the hernia, causing urinary retention that required treatment
using drugs not available on-site.235
However, the HoC report did concede there was in fact no
evidence to suggest standards of care were lower compared with the NHS, though criticism has
been launched at PMAS from other sources for the conclusions it reached on standards.236
On
balance the use of ISTCs appears to have had positive results; there is mileage in suggesting ISTCs-
if used in the correct framework- will provide improvements in patient care. One cynical doctor
points out that much of the criticism of ISTCs has come from consultants themselves. He is of the
opinion that ‘the problem is many doctors are opposing it partly because they have lost money
(from doing private work on top of that for the NHS)...[but] we should realise the private sector
offers us an opportunity to provide better and faster care’.237
Summary
The conclusions that have been drawn on the likely success or not of the government’s most recent
and ongoing reforms do not mean it is too early to judge whether the extra money is working. The
NHS has had five years since huge sums of money were poured into it and the recent reforms were
not a part of the NHS Plan that accompanied this move. The government had the opportunity to
outline such reforms in the NHS Plan, but did not, and the success of the extra money must be
judged accordingly.
231
RAND Europe, King’s Fund, City University, London Patient Choice Project. The London Patient Choice Project
was established to improve choices for patients who were clinically eligible for treatment and who had been waiting
beyond some waiting target. The main determinant of choice was found to be the perception of hospital quality. 232
NHS Confederation, Independent providers: Making a difference in the NHS, June 2006 233
http://www.bma.org.uk/ap.nsf/Content/hpd16novto6dec05 234
http://news.bbc.co.uk/1/hi/health/5210758.stm 235
http://news.bbc.co.uk/1/hi/health/5210128.stm 236
http://www.bma.org.uk/ap.nsf/Content/hpd16novto6dec05 237
http://news.bbc.co.uk/1/hi/health/5118736.stm
© CIVITAS Institute for the Study of Civil Society 2006 Author: James Gubb, Civitas
www.civitas.org.uk/nhs/nhsMoney.php 07/2006
52
Chapter 8: Conclusion
_________________________________
The NHS has received vast sums of extra money since the publication of the NHS Plan in 2000.
NHS expenditure is now almost double what is was in 2000 (in cash terms), standing at £76.4bn for
the financial year 2005-06.
Unfortunately the same cannot be said for NHS performance. In the sense that improvements have
been registered the extra money is working; the vast majority of the government’s key targets have
been met, on staffing, extra facilities, waiting times and cancer and CHD care. Moreover there are
no areas of care identified as being worse than in 2000 and patient experience has tended to
improve. The NHS should at least be commended on improved process and ease of access, most
poignantly on waiting times.
But this is not enough. In the targeted areas there are caveats that deserve to be mentioned.
Staffing has increased, but the NHS appears to have got the mix of staff wrong. Facilities have
improved, but there is still an unacceptable level of ‘dirtiness’ on some wards. Cancer and
particularly CHD care have improved, but in both areas improvements are dwarfed by the
achievements of other countries (cancer care in terms of the rates of decrease and CHD in terms of
the incidence). Ongoing public health problems- particularly obesity- signal an uncertain future.
Even achievements on waiting times are brought into question by instances of gaming and data
manipulation.
However the most damning indictment surfaces when one looks ‘beyond’ the targets. Weak
performance is evident in specific areas not explicitly targeted, such as stroke care and mental
health. Worrying efficiency failings are highlighted in day surgery, ward staffing and A&E.
Symptomatic of this is that fact that, even when quality is taken into account, all the evidence points
to productivity having fallen in the NHS since 2000- and quite significantly so. A King’s Fund
report concludes ‘there is little evidence that current spending increases and producing health
gains’.238
This report does not go quite so far, but certainly when looking at the international
context NHS performance is comparatively weak, both as a health system and in terms of health
outcomes. Over the past five years the NHS has performed worse (using mortality rates and PYLL)
on specific diseases such as cancer and stroke care and on ‘overall’ health outcomes than countries
that have seen only half the increase in health expenditure. Its position in the ‘league table’ on
mortality rates has remained at a lowly 20th
and has actually fallen two places to 19th
on PYLL.
Neither does the NHS ‘engage’ patients in their care as much as many other OECD countries.
That productivity and international performance are so bad dispels the possibility of arguing NHS
‘successes’ outweigh any areas of care that have shown stagnant performance. The fact is that in
the vast majority of areas improvements in the NHS have in no way increased in proportion to the
vast sums of money ploughed into its coffers. Is the extra money working? To a limited extent one
has to say yes, for there have been achievements; most notably the NHS’ historic inability to deal
with long waits for elective care is apparently being reversed. Nor has the NHS’ traditional strength
in providing high-quality and prompt emergency care for serious illness been compromised. But is
it working anything like one would hope? Definitely not. Service improvement has in too many
areas resembled a country stroll, whereas expenditure has increased at a sprint. The NHS has not
238
Appleby, J and Harrison, A, Spending on healthcare: How much is enough?, King’s Fund, 2006, p.39
© CIVITAS Institute for the Study of Civil Society 2006 Author: James Gubb, Civitas
www.civitas.org.uk/nhs/nhsMoney.php 07/2006
53
provided value for money. In fact a recent patient survey, 52% of NHS patients still thought
‘fundamental change was needed’.239
Many will no doubt think this conclusion is overly harsh, particularly given the ongoing nature of
reform. However consider this extract from the conclusion of a recent report into Canadian
healthcare:
“The comparative evidence is that the Canadian healthcare model is inferior to others in place in
the OECD. It produces inferior access to physicians and technology, produces longer waiting
times, is less successful in preventing death from preventable diseases and costs more than any of
the other systems that have comparable objectives, save Iceland and Switzerland”.240
True, the NHS spends about 1% less of GDP on healthcare than Canada, but Canada is significantly
better than the UK, on virtually any measure of healthcare or health outcomes.
What will be especially interesting is what happens when the Treasury bites, which surely will
happen after 2008. Can the most recent and most revolutionary reforms, which provide the
infrastructure for competition between providers, reverse the decline in productivity and provide for
substantial improvements in care? If not, it may well be time for a re-think.
James Gubb
Civitas, 21.07.06
239
Schoen et al, Taking the pulse of healthcare systems: experience of patients with health problems in six countries,
Commonwealth Fund, 2005. Incidentally this figure is less than corresponding figures for Germany (54%), Canada
(61%), identical to New Zealand, but greater than Australia (48%) and the US (44%). 240
Esmail, N and Walker, M, How good is Canadian healthcare? 2005 report: An international comparison of
healthcare systems, Fraser Institute, 2005, p.52
© CIVITAS Institute for the Study of Civil Society 2006 Author: James Gubb, Civitas
www.civitas.org.uk/nhs/nhsMoney.php 07/2006
54
Annex 1: The reforms ________________________________
Reform is seen by the NHS Plan (and subsequent DoH publications) as a prerequisite to using the
extra funds being injected into the NHS in the most productive way. On the other hand, extra
funding may also be necessary to meet initial costs of change:
“By delivering the largest ever sustained increase in NHS funding, the Government has moved the debate
from resources to reform. For too long lack of money became an excuse for lack of modernisation. There is
now a much wider understanding that the problems of the NHS are more than financial. And now, with the
funding issue settled for the next few years, the NHS can address the need to reform itself – from top to toe
– to meet the challenges of rising patient expectations”.241
The focus of the government has been on redesigning the NHS to make it more patient-centred,
using this as the motive to drive improvements in health, access, efficiency and patient experience.
A raft of central bodies have emerged to provide the impetus for reform and set ‘clear, national,
standards for services...on the basis of the real needs of patients’.242
The fundamental driver of
reform has been the Modernisation Agency (now NHS Institute for Innovation and Improvement).
This agency is responsible for ‘improving health outcomes and raising the quality of delivery in
the NHS by accelerating the uptake of proven innovation in healthcare delivery, medical products
and devices and healthcare leadership’.243
The body is also responsible for producing recovery
plans for failing NHS Trusts.244
The Department of Health (DoH) now sets a number of targets that NHS Trusts are required to
meet, for example on waiting lists, waiting times, increased staffing, technology uptake etc. They
also set more illness-specific targets through Performance Assessment Frameworks and National
Service Frameworks (NSFs). These ‘set long-term strategies for improving specific areas of care
and provide measurable goals within set time frames’.245
NSFs in particular have been emphasised
by the government as drivers for delivering its Modernisation Agenda.
The government also set up the National Institute for Clinical Excellence (NICE) in April 1999 as
a Special Health Authority for England and Wales. NICE is an independent organisation
responsible for providing national guidance on the promotion of public health, the use of new and
existing health technologies (medicines, treatments and procedures) and clinical practice.246
Such
guidance is intended to provide best practice information for frontline NHS staff and help to
ensure faster uptake and more equitable access to new technologies and to treatments of proven
clinical and cost effectiveness.247
Whether or not NICE has succeeded in these goals is a matter
for debate. The majority of reports conclude that the implementation of NICE guidance has been
variable, both from treatment to treatment as well as by geographical area, with the highest uptake
occurring in instances where there is strong professional support and good systems for tracking
241
The NHS Plan, 2000, Ch.1 242
A First-Class Service: Quality in the New NHS, 1998, ch.1 243
http://www.institute.nhs.uk/AboutTheInstitute/ 244
The NHS Plan, 2000, Ch.6 245
http://www.dh.gov.uk/PolicyAndGuidance/OrganisationPolicy/SocialServicesPerformanceAssessment/PerformanceE
vidence/PerformanceEvidenceArticle/fs/en?CONTENT_ID=4016156&chk=s8vnAF. There are now NSFs in place for
coronary heart disease, cancer, paediatric intensive care, mental health, older people, diabetes, long-term conditions,
renal care and children. 246
http://www.nice.org.uk/page.aspx?o=aboutnice 247
http://www.doh.gov.uk/nice/consultation2002/overviewdec02.pdf

© CIVITAS Institute for the Study of Civil Society 2006 Author: James Gubb, Civitas
www.civitas.org.uk/nhs/nhsMoney.php 07/2006
55
guidance implementation.248
For example, prescribing of some taxanes for cancer and orlistat for
obesity increased significantly in line with NICE guidance, but little change was apparent in the
use of laparoscopic hernia repair and hip prostheses.249
NICE has also been held partly
responsible for inflating NHS expenditure, as it has tended to conclude that ‘some subgroup of
patients will benefit from a treatment (such as herceptin) at a high cost per quality adjusted life
year (QALY)’.250
But in some cases it has slowed the uptake of cost-effective new treatments
through an excessively lengthy appraisal process251
. The UK has one of the biggest
pharmaceutical industries in the world, yet one of the worst rates of uptake of new medicines.
Nonetheless, whilst many see reform as a necessity, few advocate scrapping NICE and returning to
the inefficiencies of localised decision-making.
The implementation of NICE guidelines, as well as standards set by the DoH, such as the NSFs,
have been monitored by the Commission for Healthcare Improvement- CHI (now Healthcare
Commission). CHI was established by the government in April 2000 to promote improvement in
the quality of the NHS and independent healthcare. It has a statutory duty to assess the
performance of healthcare organisations and award annual performance ratings- the notorious stars
(now replaced by the aptly-named ‘annual health check’). In essence it is an inspection body for
the NHS.
Despite the creation of these central bodies the crux of the government’s approach to the NHS
reforms has been one of ‘earned autonomy from the centre’ to facilitate the creation of an NHS
that is patient-led.252
The government has now recognised that central direction and regulation can
only go so far in providing incentives for increasing performance and patient experience. Instead
the better an NHS Trust does, the more autonomy it can expect from the centre to run its own
affairs.
The government maintained the purchaser-provider split it inherited from the previous
Conservative administration, but at least initially emphasised partnership and ‘integrated care’
rather than competition.253
Primary Care Trusts (PCTs) control 75-80% of the NHS budget.254
They manage (and provide a limited number of) local primary care services (e.g. GP surgeries,
pharmacies, NHS Walk-in Centres, NHS Direct etc.) and purchase secondary care from the
appropriate provider; usually an NHS Trust (either an Acute, Mental Health or Care Trust), but
also- and increasingly- approved independent or private providers. The government is now aiming
to devolve purchasing-power even closer to the patient by introducing practice-based
commissioning (PBC). This gives GP practices the right to manage an indicative budget to
provide care for their patients.255
Patients are therefore able to exercise choice over their GP and, through their GP, the hospital
where they will receive treatment. The choice mechanism will be assisted by the government’s
payment-by-results scheme, which was rolled out across the NHS in April this year. Payment-by-
248
See, for example, Sheldon et al, What’s the evidence that NICE guidance has been implemented?, BMJ, 30 October
2004 or Jones, M and Irvine, B, NICE or Nasty: Has NICE eliminated the postcode lottery in the NHS?, Civitas Health
Unit, Sept 2003 249
Sheldon et al, What’s the evidence that NICE guidance has been implemented?, BMJ, 30 October 2004 250
Maynard, A and Street, A, Health service reform: seven years of feast, seven years of famine: from boom to bust in
the NHS?, BMJ, 15 April 2006 251
http://www.abpi.org.uk/information/industry_positions/990415.asp. 252
The NHS Plan 2000, ch.6 253
The New NHS: Modern and Dependable 1997, ch.1. As the reforms have progressed arrangements have however
become increasingly ‘competitive’. 254
There are currently 303 PCTs in the UK, but as of 16 May 2006 this number has been reduced to 152. See
http://www.dh.gov.uk/NewsHome/NewsArticle/fs/en?CONTENT_ID=4135088&chk=oJufTo 255
There is legitimate concern that practice-based commissioning and PCTs, apparently both being the primary
purchasers is somewhat contradictory; it appears they are being asked to perform the same role. See: Timmins (ed.),
Designing the New NHS, King’s Fund, 2006.

© CIVITAS Institute for the Study of Civil Society 2006 Author: James Gubb, Civitas
www.civitas.org.uk/nhs/nhsMoney.php 07/2006
56
results means that PCTs will now pay for patient treatment in NHS Trusts for the activity that they
undertake and on the basis of a standard national price tariff (adjusted for variation in regional
costs, such as wages). This is instead of the previous system of block agreements.256
Money
should therefore follow the patient.
The networks of PCTs and NHS Trusts are managed locally by Strategic Health Authorities (SHAs)
on behalf of the DoH. The SHAs are responsible for developing plans for improving health
services in their local area, maintaining high quality healthcare, increasing the capacity of local
health services and ensuring national priorities are integrated into local health plans.257
They
therefore form a link between the central direction of the DoH and the ‘devolved’ Trusts.
However some NHS Trusts have, since April 2004, become NHS Foundation Trusts (NHSFTs),
which are independent, not-for-profit public benefit corporations, with extra freedoms to borrow
capital, sell assets, retain surpluses in each year and to develop their own systems for managing and
rewarding their staff. To the government’s opponents, NHSFTs represent ‘privatisation through the
back door’, but whilst nominally independent from the direction of the DoH and SHAs, NHSFTs
must meet national targets and standards like the rest of the NHS.258
NHSFTs are overseen by a
new independent regulator called Monitor, but has also recently been ‘inspected’ by the NHS’
watchdog, the Healthcare Commission, on direction of the government. Admittedly the Healthcare
Commission was not asked to make judgements on the value of the policy of NHSFTs, but it did
cover the impact of NHSFT’s engagement of staff, relationships with local health institutions and
communities, and access to and quality of services259
. The evidence it presented suggested that
NHSFTs had, at least thus far, not offered any particular advantage to patients.
The recent government White Paper, Our Health, Our Care, Our Say (DoH, 2006),260
signalled
further reform and, crucially, another shift towards primary care. It entices GP practices to improve
access to other healthcare professionals and for larger practices to consider safe pathways for
patients to see specialists, such as for dermatology, ENT, and orthopaedics (amongst others) in-
house. GPs are also expected to take the lead in encouraging self-care through, for example, the
NHS Life-Check and expert-patient programmes as part of a wider initiative to shift the NHS
system towards preventive and community-based care.
On the staff-level the government has, since the publication of the NHS Plan, introduced
‘incentive-based’ contracts, such as the PMS (Personal Medical Services) contract between a PCT
and an individual GP practice which provides financial rewards for quality through the Quality and
Outcomes Framework.261
This is linked to the results of National Patient Surveys. There are also
incentives for medical staff to increase their expertise through Individual Learning Funds and
expanded roles for nurses as ‘consultant nurses’.262
To borrow the words of Tony Blair’s former advisor Julian Le Grand, the reforms combine ‘top-
down performance management’ with a ‘system embedding incentives for reform within it...coming
256
http://www.dh.gov.uk/PolicyAndGuidance/OrganisationPolicy/FinanceAndPlanning/NHSFinancialReforms/NHSFin
ancialReformsArticle/fs/en?CONTENT_ID=4065236&chk=/HOpHu 257
http://www.nhs.uk/England/AuthoritiesTrusts/Sha/Default.aspx 258
Lewis, R, NHS Foundation Trusts, BMJ, 2005; 331 259
Healthcare Commission, Healthcare Commission's Report on the review of NHS foundation trusts, 2005.
www.healthcarecommission.org.uk 260
Our Health, Our Care, Our Say, DoH, 2006. Available at:
http://www.dh.gov.uk/PolicyAndGuidance/OrganisationPolicy/Modernisation/OurHealthOurCareOurSay/fs/en 261
The NHS Plan 2000, ch.8 262
The NHS Plan 2000, ch.9

© CIVITAS Institute for the Study of Civil Society 2006 Author: James Gubb, Civitas
www.civitas.org.uk/nhs/nhsMoney.php 07/2006
57
from the users of [the NHS]’.263
The former has existed very much since the NHS (and before),
whereas the latter is still developing and in its infancy. It can be said there are now five key
elements to the reforms: standards (or targets), patient choice, money following that choice, new
forms of provider and self-care.
263
LSE: Public Lecture by Professor Julian Le Grand at LSE on 21 Feb 2006
http://www.lse.ac.uk/collections/LSEHealthAndSocialCare/pdf/Publiclecture/ByProfessorJulianLeGrand.pdf