the next investment opportunity · the next investment opportunity. cover story ... investors...
TRANSCRIPT
SEPTEMBER08
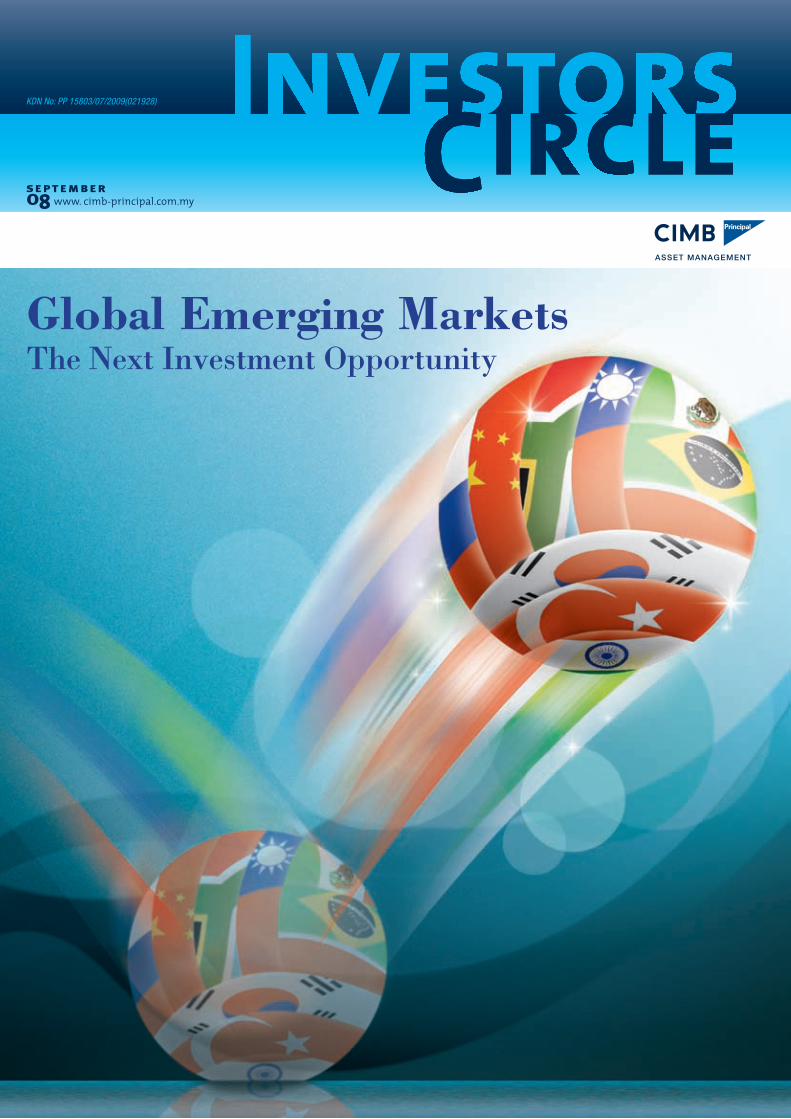
Global Emerging MarketsThe Next Investment Opportunity
KDN No: PP 15803/07/2009(021928)

Imagine this: If you had invested in the past 15 years in Developed Nations like US, Japan and
Europe, I’m sure you would have enjoyed potential returns from these countries’ growth. Unfortunately,
those days are long gone and it is impossible to rewind back into the past. What matters now is your
next investment move; gaining insight from past events to develop a view as to where to invest in this
current volatile market with impact.
We are now in the era where we cannot resist the evolution of the next century being called the
Emerging Markets Century. The rapid infrastructure investment coupled with the absence of severe
sub-prime crisis will allow the Emerging Markets to close the gap with Developed Nations and evolve
into the next big economic superstars.
In my view, the recent G8 meeting is losing relevance and influence as it excluded some of the larger
economies of today, such as China and India, from the main table. As the economic power shifts to
the East, the emerging economic giants cannot be kept at the outer edge. Their economic strength
must be recognized and their views must be included for global solutions.
Today, there are at least 25 emerging market multinationals that are already world-class. Companies
like Samsung, LG, and Hyundai started off making products efficiently and cheaply but are now
recognized and valuable brand names with world-class technology and appealing designs. Companies
like China’s Haier are already following their footsteps.
Cover Story
Datuk Noripah KamsoChief ExecutiveCIMB-Principal Asset Management Berhad
Global Emerging MarketsTHE NEXT INVESTMENT OPPORTUNITY

Cover Story
In fact, I would venture to say that these brands are now better known than GE, Sony, or Toyota by
hundred of millions of consumers in China, India and other emerging nations. Countries & regions like
Brazil, Russia, India, China, ASEAN, Latin America,
Eastern Europe and East Asia are benefiting from a
seismic role reversal, with emerging markets driving
the world’s GDP growth.
Despite the growing strains in the world economy,
Emerging Market equities have proven resilient. The
emerging countries’ GDP growth is now 4 times the
growth rate of developed countries and 2 times the
growth rate of global growth*. If current growth trends
continue unchanged, more emerging companies will
soon take over long established western companies,
including those they now supply.
As the emerging economies continue to grow at a rate twice as fast as the developed countries,
investors should not hesitate to swiftly tap into these markets. Emerging Markets represent over
86% of the world’s population and comprise over 43%^ of the global economic output**. This is
bound to increase as these markets are very upbeat.
You might have an opinion about the current volatile investment landscape and feel skeptical to
invest. But as an optimist like me, you can always look for opportunities in times like this. No doubt,
the Emerging Markets will continue to shine for years to come as it is isolated from the worsening
economic markets conditions in the US and UK.
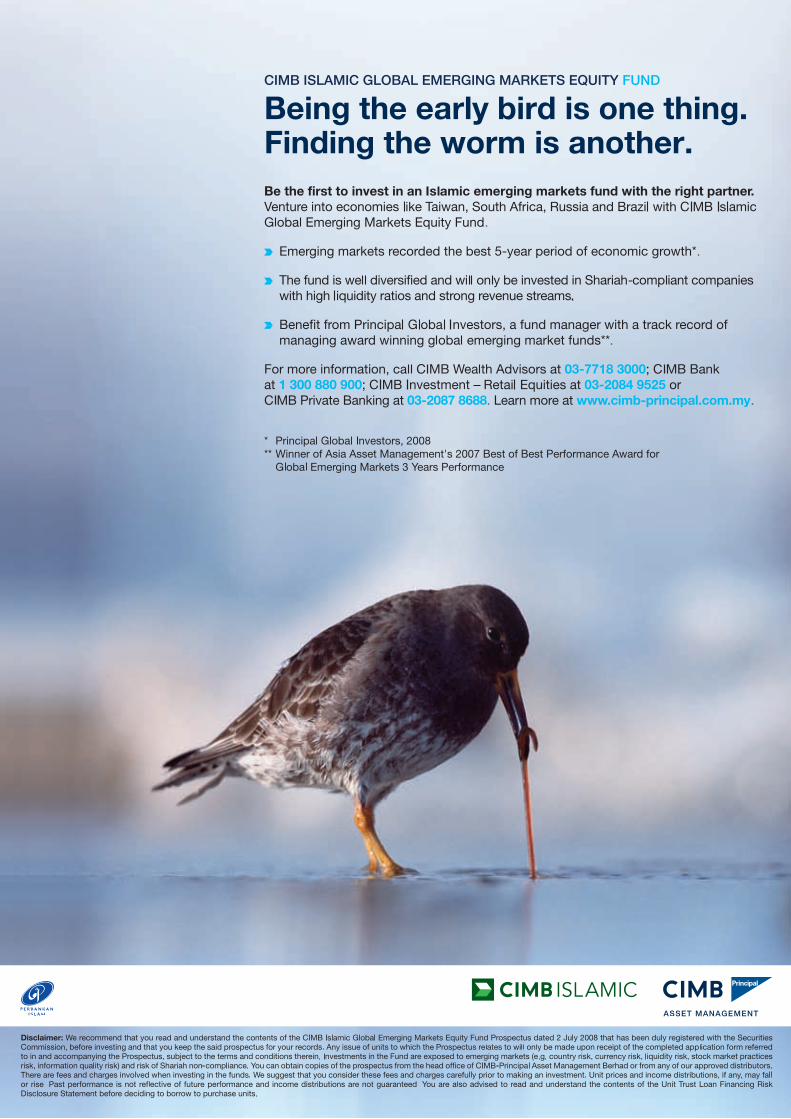
Thus, as an exemplary move, investors should further diversify and seize the chance to exploit
investment opportunities in the Emerging Markets with our newly launched fund—CIMB Islamic
Global Emerging Markets Equity Fund. This Fund offers investment exposure to Shariah-
compliant companies and it will provide investors with enhanced global diversification across multiple
Emerging Markets.
Recommended read: Agtmael, Antoine Van, The Emerging Markets Century: How A New Breed of
World - Class Companies is Overtaking the World (Simon & Schuster UK Ltd, London, 2007)
The emerging countries’ GDP growth is now 4 times the growth rate of developed countries and 2 times the growth rate of global growth*.
* Source: Citigroup Global Strategy 2Q08, 2008** (PGI, 2008)^ With adjusted purchasing power parity
Profile
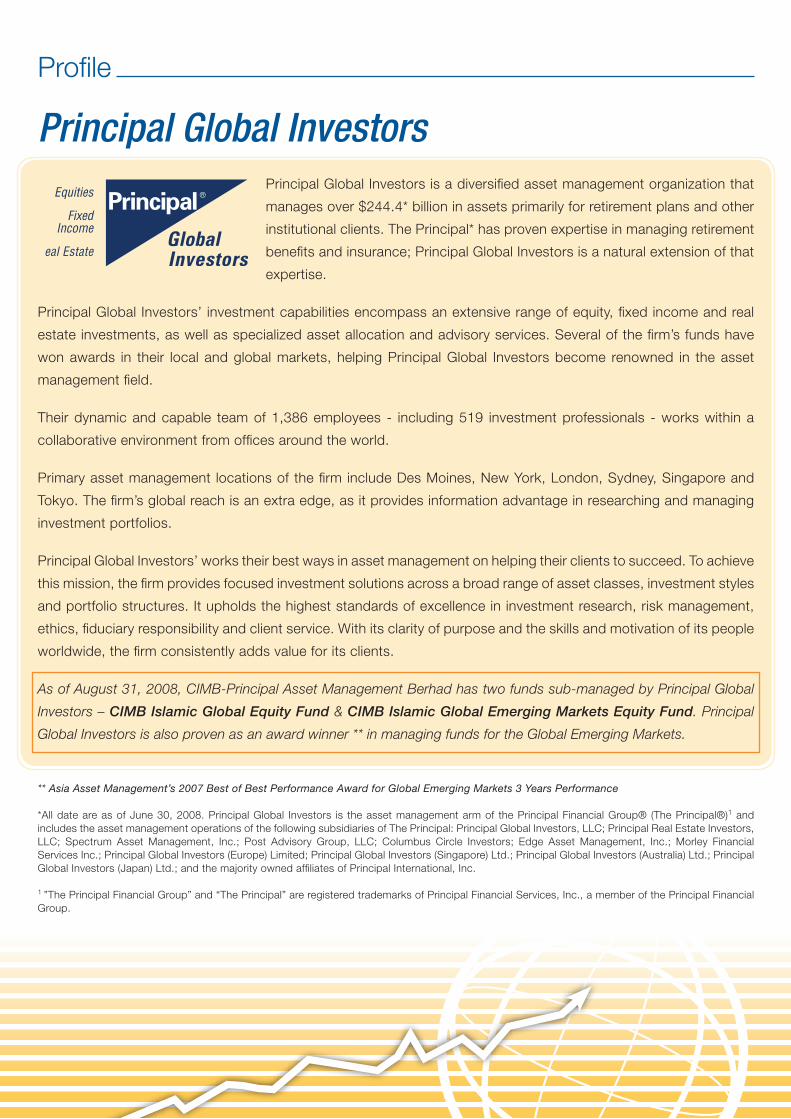
Principal Global InvestorsPrincipal Global Investors is a diversified asset management organization that
manages over $244.4* billion in assets primarily for retirement plans and other
institutional clients. The Principal* has proven expertise in managing retirement
benefits and insurance; Principal Global Investors is a natural extension of that
expertise.
Principal Global Investors’ investment capabilities encompass an extensive range of equity, fixed income and real
estate investments, as well as specialized asset allocation and advisory services. Several of the firm’s funds have
won awards in their local and global markets, helping Principal Global Investors become renowned in the asset
management field.
Their dynamic and capable team of 1,386 employees - including 519 investment professionals - works within a
collaborative environment from offices around the world.
Primary asset management locations of the firm include Des Moines, New York, London, Sydney, Singapore and
Tokyo. The firm’s global reach is an extra edge, as it provides information advantage in researching and managing
investment portfolios.
Principal Global Investors’ works their best ways in asset management on helping their clients to succeed. To achieve
this mission, the firm provides focused investment solutions across a broad range of asset classes, investment styles
and portfolio structures. It upholds the highest standards of excellence in investment research, risk management,
ethics, fiduciary responsibility and client service. With its clarity of purpose and the skills and motivation of its people
worldwide, the firm consistently adds value for its clients.
As of August 31, 2008, CIMB-Principal Asset Management Berhad has two funds sub-managed by Principal Global
Investors – CIMB Islamic Global Equity Fund & CIMB Islamic Global Emerging Markets Equity Fund. Principal
Global Investors is also proven as an award winner ** in managing funds for the Global Emerging Markets.
** Asia Asset Management’s 2007 Best of Best Performance Award for Global Emerging Markets 3 Years Performance
*All date are as of June 30, 2008. Principal Global Investors is the asset management arm of the Principal Financial Group® (The Principal®)1 and includes the asset management operations of the following subsidiaries of The Principal: Principal Global Investors, LLC; Principal Real Estate Investors, LLC; Spectrum Asset Management, Inc.; Post Advisory Group, LLC; Columbus Circle Investors; Edge Asset Management, Inc.; Morley Financial Services Inc.; Principal Global Investors (Europe) Limited; Principal Global Investors (Singapore) Ltd.; Principal Global Investors (Australia) Ltd.; Principal Global Investors (Japan) Ltd.; and the majority owned affiliates of Principal International, Inc. 1 ”The Principal Financial Group” and “The Principal” are registered trademarks of Principal Financial Services, Inc., a member of the Principal Financial Group.

Market Overview
KLCI NKY STI SPX
Share Market Price Indices Share Market Indices
Sou
rce:
Blo
ombe
rg
Jun Qtr Year to end % Jun %
Malaysia KLCI -2.6 -12.1
Singapore STI -77.8 -15.0
Indonesia JCI -90.4 9.0
Japan Nikkei 329.2 -25.3
Hong Kong Hang Seng 868.0 1.2
United States S&P 500 -6.7 -15.0
140
120
100
80
60
40
0
Jun
07
Jul 0
7
Aug
07
Sep
07
Oct
07
Nov
07
Dec
07
Jan
08
Feb
08
Mar
08
Apr
08
May
08
Jun
08
Malaysian Share Market
With the fall in the crude oil price and commodities, inflation may have peaked out. But because of the year-on-year impact, domestic inflation may remain high. But it removes the incentive for Bank Negara to raise interest rates.
The Purchasing Managers Index in China has fallen below 50 to 48.3 signaling a slowdown. As a consequence, GDP growth for China has been downgraded to 9.6% from above 10.0% previously. This may lead to another round of earnings downgrades in the region.
But with the market trading at PER of 12.1x and 10.9x for 2008 and 2009 respectively, the downside risk may be limited to another 5-10% unless earnings growth is downgraded significantly.
We continue to maintain a defensive stance with our portfolios. We have reduced weightings in Plantations and Properties. We remain overweighted in Oil & Gas. At the same time, we are also taking the opportunity to get into undervalued stocks and position our portfolios for the longer term.
Global Equity Markets
We are still not convinced that the US will slide into a recession. But this debate is perhaps a moot point as the US is slowing and the definition of a recession is only a benchmark. Certainly, according to the IMF, sub-prime losses have increased from USD400-450m to USD945m with 50% of the losses in the banking system. As provisions in the banking system have reached USD400m, the provisions and re-capitalizations have some way to go.
In Asia ex-Japan, GDP growth should remain positive although the rate of growth will slow. Still EPS growth around the region has held up in spite of the downgrades. We expect more downgrades to earnings, but valuations have now fallen below 5-year averages in most markets. It is still early to predict a recovery, but downside in the region could be limited to another 5-10%.
In spite of the downside risk, we are now taking the opportunity to get into stocks that have been sold down below their fair values. Equity allocation is being increased gradually. But we will like to emphasize that recovery could take time and as such investors should remain patient.
Fixed Income
The bond market started off in the second quarter on a cautious note following concerns over potential rise in inflation numbers as a result of rising food prices.
In the month of June, the Malaysian bond market suffered a major setback as bonds yields, including the MGS which increased sharply across the board subsequent to the government’s decision to aggressively remove the fuel subsidies by 40-60% in early June 2008 and indicated that electricity tariffs would be raised effective from 1 July.
The benchmark MGS which traded range bound initially saw yields risen between 45 to 100 bps during the quarter with the longer end of the curve suffered the largest movement resulting in a bearish steepening of the MGS yield curve. Similarly, the corporate bonds yields also steepened significantly as investors avoided the longer tenor bonds in response to the fear of rising inflation situation.
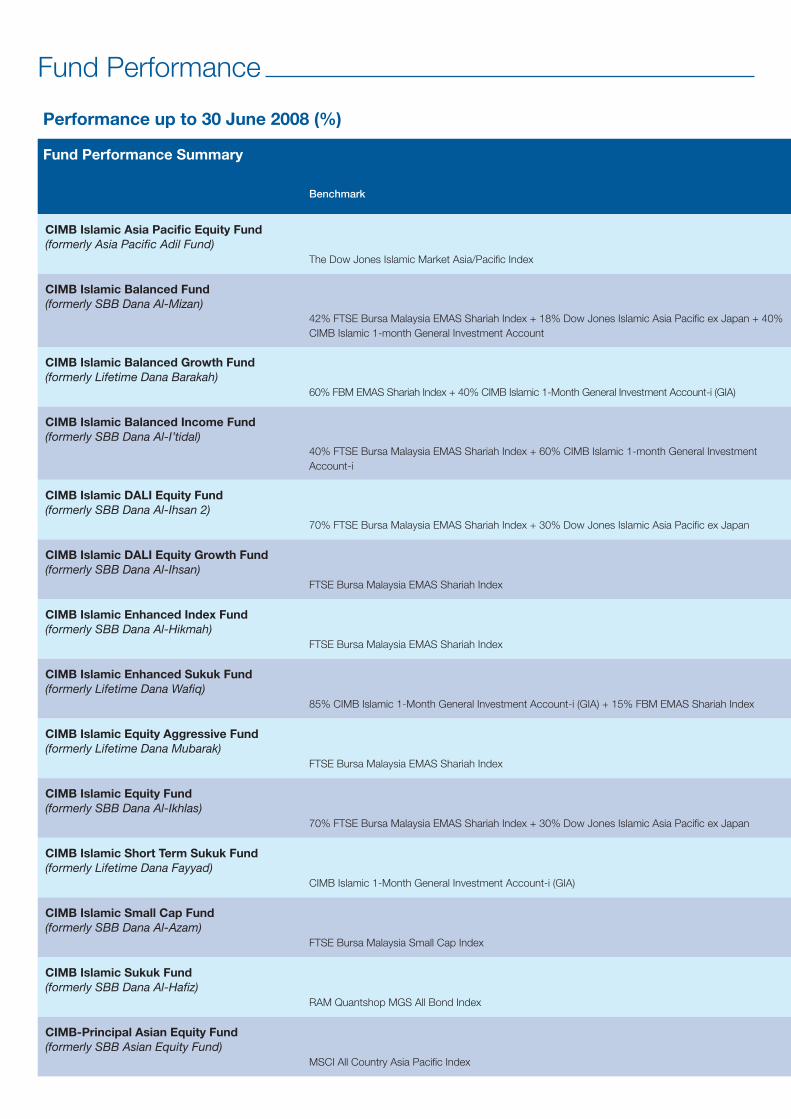
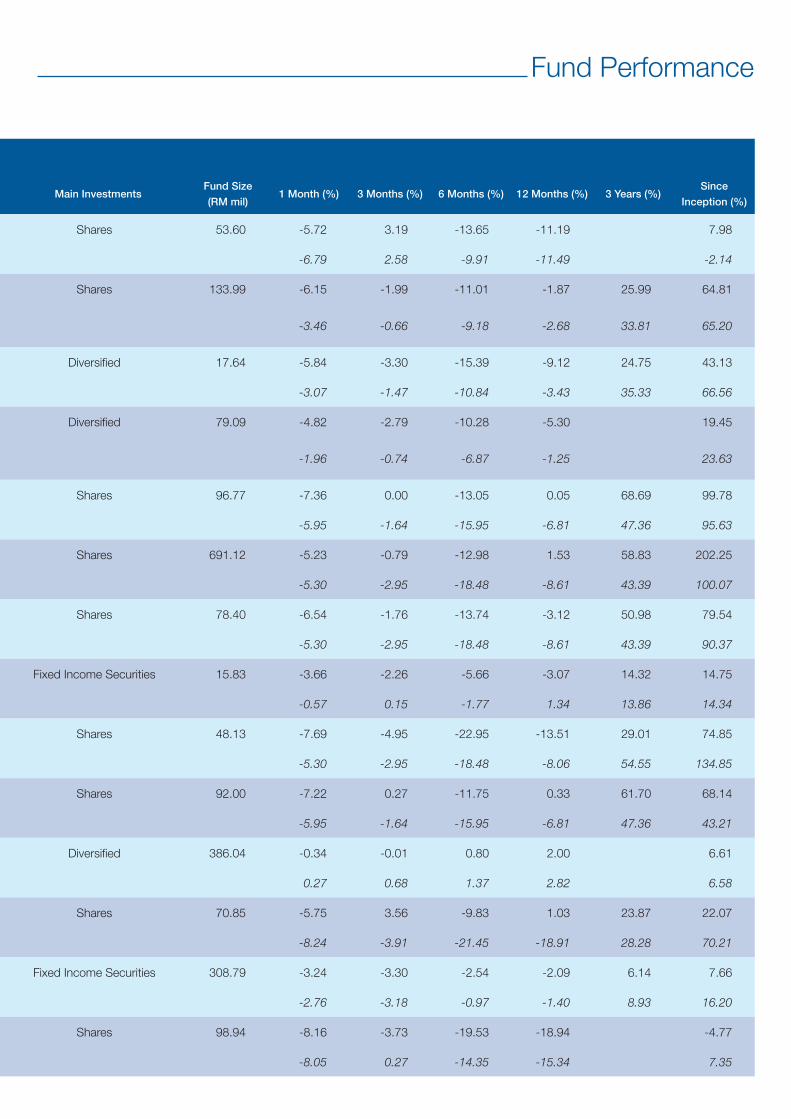
Fund Performance
Performance up to 30 June 2008 (%)
Fund Performance Summary
Benchmark Main InvestmentsFund Size
(RM mil)1 Month (%) 3 Months (%) 6 Months (%) 12 Months (%) 3 Years (%)
Since
Inception (%)
CIMB Islamic Asia Pacific Equity Fund (formerly Asia Pacific Adil Fund)
Shares 53.60 -5.72 3.19 -13.65 -11.19 7.98
The Dow Jones Islamic Market Asia/Pacific Index -6.79 2.58 -9.91 -11.49 -2.14
CIMB Islamic Balanced Fund(formerly SBB Dana Al-Mizan)
Shares 133.99 -6.15 -1.99 -11.01 -1.87 25.99 64.81
42% FTSE Bursa Malaysia EMAS Shariah Index + 18% Dow Jones Islamic Asia Pacific ex Japan + 40% CIMB Islamic 1-month General Investment Account
-3.46 -0.66 -9.18 -2.68 33.81 65.20
CIMB Islamic Balanced Growth Fund (formerly Lifetime Dana Barakah)
Diversified 17.64 -5.84 -3.30 -15.39 -9.12 24.75 43.13
60% FBM EMAS Shariah Index + 40% CIMB Islamic 1-Month General Investment Account-i (GIA) -3.07 -1.47 -10.84 -3.43 35.33 66.56
CIMB Islamic Balanced Income Fund (formerly SBB Dana Al-I’tidal)
Diversified 79.09 -4.82 -2.79 -10.28 -5.30 19.45
40% FTSE Bursa Malaysia EMAS Shariah Index + 60% CIMB Islamic 1-month General Investment Account-i
-1.96 -0.74 -6.87 -1.25 23.63
CIMB Islamic DALI Equity Fund(formerly SBB Dana Al-Ihsan 2)
Shares 96.77 -7.36 0.00 -13.05 0.05 68.69 99.78
70% FTSE Bursa Malaysia EMAS Shariah Index + 30% Dow Jones Islamic Asia Pacific ex Japan -5.95 -1.64 -15.95 -6.81 47.36 95.63
CIMB Islamic DALI Equity Growth Fund(formerly SBB Dana Al-Ihsan)
Shares 691.12 -5.23 -0.79 -12.98 1.53 58.83 202.25
FTSE Bursa Malaysia EMAS Shariah Index -5.30 -2.95 -18.48 -8.61 43.39 100.07
CIMB Islamic Enhanced Index Fund(formerly SBB Dana Al-Hikmah)
Shares 78.40 -6.54 -1.76 -13.74 -3.12 50.98 79.54
FTSE Bursa Malaysia EMAS Shariah Index -5.30 -2.95 -18.48 -8.61 43.39 90.37
CIMB Islamic Enhanced Sukuk Fund (formerly Lifetime Dana Wafiq)
Fixed Income Securities 15.83 -3.66 -2.26 -5.66 -3.07 14.32 14.75
85% CIMB Islamic 1-Month General Investment Account-i (GIA) + 15% FBM EMAS Shariah Index -0.57 0.15 -1.77 1.34 13.86 14.34
CIMB Islamic Equity Aggressive Fund(formerly Lifetime Dana Mubarak)
Shares 48.13 -7.69 -4.95 -22.95 -13.51 29.01 74.85
FTSE Bursa Malaysia EMAS Shariah Index -5.30 -2.95 -18.48 -8.06 54.55 134.85
CIMB Islamic Equity Fund(formerly SBB Dana Al-Ikhlas)
Shares 92.00 -7.22 0.27 -11.75 0.33 61.70 68.14
70% FTSE Bursa Malaysia EMAS Shariah Index + 30% Dow Jones Islamic Asia Pacific ex Japan -5.95 -1.64 -15.95 -6.81 47.36 43.21
CIMB Islamic Short Term Sukuk Fund (formerly Lifetime Dana Fayyad)
Diversified 386.04 -0.34 -0.01 0.80 2.00 6.61
CIMB Islamic 1-Month General Investment Account-i (GIA) 0.27 0.68 1.37 2.82 6.58
CIMB Islamic Small Cap Fund (formerly SBB Dana Al-Azam)
Shares 70.85 -5.75 3.56 -9.83 1.03 23.87 22.07
FTSE Bursa Malaysia Small Cap Index -8.24 -3.91 -21.45 -18.91 28.28 70.21
CIMB Islamic Sukuk Fund(formerly SBB Dana Al-Hafiz)
Fixed Income Securities 308.79 -3.24 -3.30 -2.54 -2.09 6.14 7.66
RAM Quantshop MGS All Bond Index -2.76 -3.18 -0.97 -1.40 8.93 16.20
CIMB-Principal Asian Equity Fund(formerly SBB Asian Equity Fund)
Shares 98.94 -8.16 -3.73 -19.53 -18.94 -4.77
MSCI All Country Asia Pacific Index -8.05 0.27 -14.35 -15.34 7.35
Fund Performance
Fund Performance Summary
Benchmark Main InvestmentsFund Size
(RM mil)1 Month (%) 3 Months (%) 6 Months (%) 12 Months (%) 3 Years (%)
Since
Inception (%)
CIMB Islamic Asia Pacific Equity Fund (formerly Asia Pacific Adil Fund)
Shares 53.60 -5.72 3.19 -13.65 -11.19 7.98
The Dow Jones Islamic Market Asia/Pacific Index -6.79 2.58 -9.91 -11.49 -2.14
CIMB Islamic Balanced Fund(formerly SBB Dana Al-Mizan)
Shares 133.99 -6.15 -1.99 -11.01 -1.87 25.99 64.81
42% FTSE Bursa Malaysia EMAS Shariah Index + 18% Dow Jones Islamic Asia Pacific ex Japan + 40% CIMB Islamic 1-month General Investment Account
-3.46 -0.66 -9.18 -2.68 33.81 65.20
CIMB Islamic Balanced Growth Fund (formerly Lifetime Dana Barakah)
Diversified 17.64 -5.84 -3.30 -15.39 -9.12 24.75 43.13
60% FBM EMAS Shariah Index + 40% CIMB Islamic 1-Month General Investment Account-i (GIA) -3.07 -1.47 -10.84 -3.43 35.33 66.56
CIMB Islamic Balanced Income Fund (formerly SBB Dana Al-I’tidal)
Diversified 79.09 -4.82 -2.79 -10.28 -5.30 19.45
40% FTSE Bursa Malaysia EMAS Shariah Index + 60% CIMB Islamic 1-month General Investment Account-i
-1.96 -0.74 -6.87 -1.25 23.63
CIMB Islamic DALI Equity Fund(formerly SBB Dana Al-Ihsan 2)
Shares 96.77 -7.36 0.00 -13.05 0.05 68.69 99.78
70% FTSE Bursa Malaysia EMAS Shariah Index + 30% Dow Jones Islamic Asia Pacific ex Japan -5.95 -1.64 -15.95 -6.81 47.36 95.63
CIMB Islamic DALI Equity Growth Fund(formerly SBB Dana Al-Ihsan)
Shares 691.12 -5.23 -0.79 -12.98 1.53 58.83 202.25
FTSE Bursa Malaysia EMAS Shariah Index -5.30 -2.95 -18.48 -8.61 43.39 100.07
CIMB Islamic Enhanced Index Fund(formerly SBB Dana Al-Hikmah)
Shares 78.40 -6.54 -1.76 -13.74 -3.12 50.98 79.54
FTSE Bursa Malaysia EMAS Shariah Index -5.30 -2.95 -18.48 -8.61 43.39 90.37
CIMB Islamic Enhanced Sukuk Fund (formerly Lifetime Dana Wafiq)
Fixed Income Securities 15.83 -3.66 -2.26 -5.66 -3.07 14.32 14.75
85% CIMB Islamic 1-Month General Investment Account-i (GIA) + 15% FBM EMAS Shariah Index -0.57 0.15 -1.77 1.34 13.86 14.34
CIMB Islamic Equity Aggressive Fund(formerly Lifetime Dana Mubarak)
Shares 48.13 -7.69 -4.95 -22.95 -13.51 29.01 74.85
FTSE Bursa Malaysia EMAS Shariah Index -5.30 -2.95 -18.48 -8.06 54.55 134.85
CIMB Islamic Equity Fund(formerly SBB Dana Al-Ikhlas)
Shares 92.00 -7.22 0.27 -11.75 0.33 61.70 68.14
70% FTSE Bursa Malaysia EMAS Shariah Index + 30% Dow Jones Islamic Asia Pacific ex Japan -5.95 -1.64 -15.95 -6.81 47.36 43.21
CIMB Islamic Short Term Sukuk Fund (formerly Lifetime Dana Fayyad)
Diversified 386.04 -0.34 -0.01 0.80 2.00 6.61
CIMB Islamic 1-Month General Investment Account-i (GIA) 0.27 0.68 1.37 2.82 6.58
CIMB Islamic Small Cap Fund (formerly SBB Dana Al-Azam)
Shares 70.85 -5.75 3.56 -9.83 1.03 23.87 22.07
FTSE Bursa Malaysia Small Cap Index -8.24 -3.91 -21.45 -18.91 28.28 70.21
CIMB Islamic Sukuk Fund(formerly SBB Dana Al-Hafiz)
Fixed Income Securities 308.79 -3.24 -3.30 -2.54 -2.09 6.14 7.66
RAM Quantshop MGS All Bond Index -2.76 -3.18 -0.97 -1.40 8.93 16.20
CIMB-Principal Asian Equity Fund(formerly SBB Asian Equity Fund)
Shares 98.94 -8.16 -3.73 -19.53 -18.94 -4.77
MSCI All Country Asia Pacific Index -8.05 0.27 -14.35 -15.34 7.35

Fund Performance
Performance up to 30 June 2008 (%)
Fund Performance Summary
Benchmark Main InvestmentsFund Size
(RM mil)1 Month (%) 3 Months (%) 6 Months (%) 12 Months (%) 3 Years (%)
Since
Inception (%)
CIMB-Principal Balanced Fund (formerly Balanced Return Fund)
Shares 72.64 -8.40 -5.91 -18.88 -14.58 31.35 204.66
70% KLCI + 30% CIMB Bank 1-Month Fixed Deposit Rate -4.83 -3.15 -12.32 -7.70 33.61 110.61
CIMB-Principal Balanced Growth Fund(formerly SBB Retirement Balanced Fund)
Shares 97.75 -6.87 -4.08 -13.59 -7.06 35.47 109.44
60% KLCI + 40% CIMB Bank 1-month Fixed Deposit Rate -4.10 -2.58 -10.42 -6.14 26.17 45.04
CIMB-Principal Balanced Income Fund(formerly SBB Savings Fund)
Shares 218.32 -6.34 -4.08 -13.02 -4.18 26.94 136.45
60% KLCI + 40% CIMB Bank 1-month Fixed Deposit Rate -4.10 2.58 -10.42 -6.14 26.17 67.26
CIMB-Principal Bond Fund (formerly Lifetime Bond Fund)
Fixed Income Securities 180.05 -2.52 -2.44 -1.32 -0.37 8.80 106.71
RAM Quant shop MGS Bond Index (medium sub-index) -1.61 -1.99 -0.13 0.07 8.91 75.24
CIMB-Principal Bond Fund 2(formerly SBB Bond Fund)
Fixed Income Securities 25.90 -2.64 -2.51 -1.46 12.89 -3.36 36.81
RAM Quantshop MGS Bond Index (medium sub-index) -1.61 -1.99 -0.13 0.07 10.56 62.18
CIMB-Principal Emerging Asia Fund(formerly Emerging Asia Fund)
Shares 50.58 -8.95 -4.88 -20.72 -15.59 26.00
The FTSE All-World Asia Pacific ex Japan, Australia and New Zealand -11.36 -6.31 -22.80 -11.19 42.75
CIMB-Principal Equity Aggressive Fund 1(formerly SBB Strategic Equity Fund)
Shares 123.38 -8.52 -4.56 -20.49 -7.98 60.85 67.74
KLCI -7.02 -4.89 -17.89 -12.39 33.57 46.57
CIMB-Principal Equity Aggressive Fund 3(formerly Future Goals Fund)
Shares 112.71 -10.12 -7.08 -22.13 -13.99 37.76 163.75
KLCI -7.02 -4.89 -17.89 -12.39 -44.15 122.36
CIMB-Principal Equity Fund (formerly SBB Premium Capital Fund)
Shares 194.74 -7.85 -3.56 -14.87 -1.87 67.55 109.55
KLCI -7.02 -4.89 -17.89 -12.39 33.57 12.05
CIMB-Principal Equity Fund 2(formerly SBB High Growth Fund)
Shares 194.65 -8.50 -4.44 -19.25 -9.41 37.94 108.20
KLCI -7.02 -4.89 -17.89 -12.39 33.57 19.59
CIMB-Principal Equity Fund 4(formerly SBB HGF Sequel Fund)
Shares 87.51 -8.55 -4.49 -19.39 -10.09 36.52 95.21
KLCI -7.02 -4.89 -17.89 -12.39 33.57 70.38
CIMB-Principal Equity Growth & Income Fund (formerly SBB Double Growth Fund)
Shares 131.08 -7.47 -1.56 -15.52 0.20 61.73 153.00
70% KLCI + 30% MSCI AC Asia ex Japan -8.29 -5.34 -19.23 -12.06 36.45 108.74
CIMB-Principal Equity Growth Fund(formerly SBB Crystal Equity Fund)
Shares 49.08 -7.36 -1.58 -16.57 -2.55 59.16 63.23
70% KLCI + 30% MSCI AC Asia ex Japan -8.29 -5.34 -19.23 -12.06 36.45 64.33
CIMB-Principal Equity Income Fund(formerly SBB Equity Income Fund)
Shares & Fixed Income Securities 80.00 -9.06 -3.90 -19.53 -6.49 37.17 54.87
70% KLCI + 30% MSCI AC Asia ex Japan -8.29 -5.34 -19.23 -12.06 36.45 64.33

Fund Performance
Fund Performance Summary
Benchmark Main InvestmentsFund Size
(RM mil)1 Month (%) 3 Months (%) 6 Months (%) 12 Months (%) 3 Years (%)
Since
Inception (%)
CIMB-Principal Balanced Fund (formerly Balanced Return Fund)
Shares 72.64 -8.40 -5.91 -18.88 -14.58 31.35 204.66
70% KLCI + 30% CIMB Bank 1-Month Fixed Deposit Rate -4.83 -3.15 -12.32 -7.70 33.61 110.61
CIMB-Principal Balanced Growth Fund(formerly SBB Retirement Balanced Fund)
Shares 97.75 -6.87 -4.08 -13.59 -7.06 35.47 109.44
60% KLCI + 40% CIMB Bank 1-month Fixed Deposit Rate -4.10 -2.58 -10.42 -6.14 26.17 45.04
CIMB-Principal Balanced Income Fund(formerly SBB Savings Fund)
Shares 218.32 -6.34 -4.08 -13.02 -4.18 26.94 136.45
60% KLCI + 40% CIMB Bank 1-month Fixed Deposit Rate -4.10 2.58 -10.42 -6.14 26.17 67.26
CIMB-Principal Bond Fund (formerly Lifetime Bond Fund)
Fixed Income Securities 180.05 -2.52 -2.44 -1.32 -0.37 8.80 106.71
RAM Quant shop MGS Bond Index (medium sub-index) -1.61 -1.99 -0.13 0.07 8.91 75.24
CIMB-Principal Bond Fund 2(formerly SBB Bond Fund)
Fixed Income Securities 25.90 -2.64 -2.51 -1.46 12.89 -3.36 36.81
RAM Quantshop MGS Bond Index (medium sub-index) -1.61 -1.99 -0.13 0.07 10.56 62.18
CIMB-Principal Emerging Asia Fund(formerly Emerging Asia Fund)
Shares 50.58 -8.95 -4.88 -20.72 -15.59 26.00
The FTSE All-World Asia Pacific ex Japan, Australia and New Zealand -11.36 -6.31 -22.80 -11.19 42.75
CIMB-Principal Equity Aggressive Fund 1(formerly SBB Strategic Equity Fund)
Shares 123.38 -8.52 -4.56 -20.49 -7.98 60.85 67.74
KLCI -7.02 -4.89 -17.89 -12.39 33.57 46.57
CIMB-Principal Equity Aggressive Fund 3(formerly Future Goals Fund)
Shares 112.71 -10.12 -7.08 -22.13 -13.99 37.76 163.75
KLCI -7.02 -4.89 -17.89 -12.39 -44.15 122.36
CIMB-Principal Equity Fund (formerly SBB Premium Capital Fund)
Shares 194.74 -7.85 -3.56 -14.87 -1.87 67.55 109.55
KLCI -7.02 -4.89 -17.89 -12.39 33.57 12.05
CIMB-Principal Equity Fund 2(formerly SBB High Growth Fund)
Shares 194.65 -8.50 -4.44 -19.25 -9.41 37.94 108.20
KLCI -7.02 -4.89 -17.89 -12.39 33.57 19.59
CIMB-Principal Equity Fund 4(formerly SBB HGF Sequel Fund)
Shares 87.51 -8.55 -4.49 -19.39 -10.09 36.52 95.21
KLCI -7.02 -4.89 -17.89 -12.39 33.57 70.38
CIMB-Principal Equity Growth & Income Fund (formerly SBB Double Growth Fund)
Shares 131.08 -7.47 -1.56 -15.52 0.20 61.73 153.00
70% KLCI + 30% MSCI AC Asia ex Japan -8.29 -5.34 -19.23 -12.06 36.45 108.74
CIMB-Principal Equity Growth Fund(formerly SBB Crystal Equity Fund)
Shares 49.08 -7.36 -1.58 -16.57 -2.55 59.16 63.23
70% KLCI + 30% MSCI AC Asia ex Japan -8.29 -5.34 -19.23 -12.06 36.45 64.33
CIMB-Principal Equity Income Fund(formerly SBB Equity Income Fund)
Shares & Fixed Income Securities 80.00 -9.06 -3.90 -19.53 -6.49 37.17 54.87
70% KLCI + 30% MSCI AC Asia ex Japan -8.29 -5.34 -19.23 -12.06 36.45 64.33
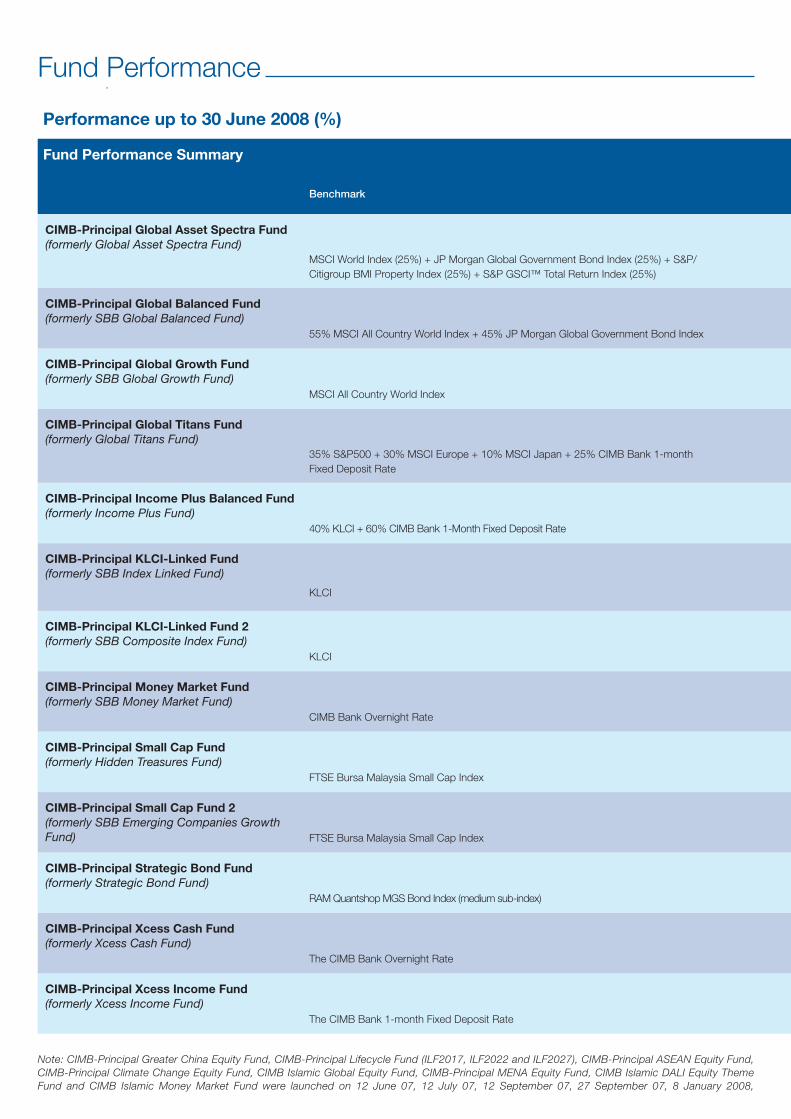
Fund Performance
Performance up to 30 June 2008 (%)
Note: CIMB-Principal Greater China Equity Fund, CIMB-Principal Lifecycle Fund (ILF2017, ILF2022 and ILF2027), CIMB-Principal ASEAN Equity Fund, CIMB-Principal Climate Change Equity Fund, CIMB Islamic Global Equity Fund, CIMB-Principal MENA Equity Fund, CIMB Islamic DALI Equity Theme Fund and CIMB Islamic Money Market Fund were launched on 12 June 07, 12 July 07, 12 September 07, 27 September 07, 8 January 2008,
19 February 2008, 28 February 08 and 17 March 2008 respectively. Please note that Clause 2.16 of the Securities Commission Guidelines on Unit Trust Advertisements and Promotional Materials prevents us from disclosing performance figures for periods of less than one year unless accompanied by the most recent figure for one year’s duration.
Fund Performance Summary
Benchmark Main InvestmentsFund Size
(RM mil)1 Month (%) 3 Months (%) 6 Months (%) 12 Months (%) 3 Years (%)
Since
Inception (%)
CIMB-Principal Global Asset Spectra Fund(formerly Global Asset Spectra Fund)
Diversified 57.47 0.33 4.52 1.22 0.67 2.43
MSCI World Index (25%) + JP Morgan Global Government Bond Index (25%) + S&P/Citigroup BMI Property Index (25%) + S&P GSCI™ Total Return Index (25%)
-1.53 5.09 2.57 1.94 2.71
CIMB-Principal Global Balanced Fund(formerly SBB Global Balanced Fund)
Shares 91.06 -4.80 -1.68 -9.62 -11.27 -1.60
55% MSCI All Country World Index + 45% JP Morgan Global Government Bond Index -3.27 -1.11 -5.54 -4.75 2.31
CIMB-Principal Global Growth Fund(formerly SBB Global Growth Fund)
Shares 124.98 -7.94 -1.26 -16.13 -19.96 -2.90
MSCI All Country World Index -7.57 -0.25 -12.92 -15.87 18.57
CIMB-Principal Global Titans Fund (formerly Global Titans Fund)
Shares 57.31 -3.65 1.46 -9.70 -12.08 6.90
35% S&P500 + 30% MSCI Europe + 10% MSCI Japan + 25% CIMB Bank 1-month Fixed Deposit Rate
-5.46 -0.06 -9.16 -12.64 4.62
CIMB-Principal Income Plus Balanced Fund(formerly Income Plus Fund)
Fixed Income Securities 92.60 -6.04 -4.30 -10.70 -6.52 16.44 122.75
40% KLCI + 60% CIMB Bank 1-Month Fixed Deposit Rate -2.65 -1.45 -6.52 -3.02 23.21 87.41
CIMB-Principal KLCI-Linked Fund(formerly SBB Index Linked Fund)
Shares 20.94 -6.92 -4.68 -17.47 -10.60 41.50 61.36
KLCI -7.02 -4.89 -17.89 -12.39 33.57 40.88
CIMB-Principal KLCI-Linked Fund 2(formerly SBB Composite Index Fund)
Shares 20.94 -6.94 -4.91 -17.97 -11.09 37.63 62.87
KLCI -7.02 -4.89 -17.89 -12.39 33.57 53.64
CIMB-Principal Money Market Fund(formerly SBB Money Market Fund)
Money Market Instrument 249.82 0.25 0.73 1.47 2.99 8.52 10.73
CIMB Bank Overnight Rate 0.21 0.63 1.26 2.53 9.32 12.57
CIMB-Principal Small Cap Fund(formerly Hidden Treasures Fund)
Shares 10.81 -6.37 6.87 -11.81 0.38 55.18 49.28
FTSE Bursa Malaysia Small Cap Index -8.24 -3.91 -21.45 -13.65 61.34 57.52
CIMB-Principal Small Cap Fund 2 (formerly SBB Emerging Companies Growth Fund)
Shares 118.68 -6.46 -0.26 -13.97 -4.11 15.72 57.74
FTSE Bursa Malaysia Small Cap Index -8.24 -3.91 -21.45 -18.91 28.28 -8.93
CIMB-Principal Strategic Bond Fund (formerly Strategic Bond Fund)
Fixed Income Securities 64.79 -3.62 -3.85 -3.49 -2.84 23.43 35.06
RAM Quantshop MGS Bond Index (medium sub-index) -1.61 -1.99 -0.13 0.07 8.91 17.76
CIMB-Principal Xcess Cash Fund (formerly Xcess Cash Fund)
Money Market Instrument 347.50 0.08 0.53 1.31 2.87 9.01 11.89
The CIMB Bank Overnight Rate 0.21 0.63 1.26 2.53 7.16 10.19
CIMB-Principal Xcess Income Fund (formerly Xcess Income Fund)
Money Market Instrument 29.02 -0.11 0.32 1.19 2.61 8.17
The CIMB Bank 1-month Fixed Deposit Rate 0.26 0.79 1.59 3.20 7.05

Note: CIMB-Principal Greater China Equity Fund, CIMB-Principal Lifecycle Fund (ILF2017, ILF2022 and ILF2027), CIMB-Principal ASEAN Equity Fund, CIMB-Principal Climate Change Equity Fund, CIMB Islamic Global Equity Fund, CIMB-Principal MENA Equity Fund, CIMB Islamic DALI Equity Theme Fund and CIMB Islamic Money Market Fund were launched on 12 June 07, 12 July 07, 12 September 07, 27 September 07, 8 January 2008,
19 February 2008, 28 February 08 and 17 March 2008 respectively. Please note that Clause 2.16 of the Securities Commission Guidelines on Unit Trust Advertisements and Promotional Materials prevents us from disclosing performance figures for periods of less than one year unless accompanied by the most recent figure for one year’s duration.
Fund Performance
Fund Performance Summary
Benchmark Main InvestmentsFund Size
(RM mil)1 Month (%) 3 Months (%) 6 Months (%) 12 Months (%) 3 Years (%)
Since
Inception (%)
CIMB-Principal Global Asset Spectra Fund(formerly Global Asset Spectra Fund)
Diversified 57.47 0.33 4.52 1.22 0.67 2.43
MSCI World Index (25%) + JP Morgan Global Government Bond Index (25%) + S&P/Citigroup BMI Property Index (25%) + S&P GSCI™ Total Return Index (25%)
-1.53 5.09 2.57 1.94 2.71
CIMB-Principal Global Balanced Fund(formerly SBB Global Balanced Fund)
Shares 91.06 -4.80 -1.68 -9.62 -11.27 -1.60
55% MSCI All Country World Index + 45% JP Morgan Global Government Bond Index -3.27 -1.11 -5.54 -4.75 2.31
CIMB-Principal Global Growth Fund(formerly SBB Global Growth Fund)
Shares 124.98 -7.94 -1.26 -16.13 -19.96 -2.90
MSCI All Country World Index -7.57 -0.25 -12.92 -15.87 18.57
CIMB-Principal Global Titans Fund (formerly Global Titans Fund)
Shares 57.31 -3.65 1.46 -9.70 -12.08 6.90
35% S&P500 + 30% MSCI Europe + 10% MSCI Japan + 25% CIMB Bank 1-month Fixed Deposit Rate
-5.46 -0.06 -9.16 -12.64 4.62
CIMB-Principal Income Plus Balanced Fund(formerly Income Plus Fund)
Fixed Income Securities 92.60 -6.04 -4.30 -10.70 -6.52 16.44 122.75
40% KLCI + 60% CIMB Bank 1-Month Fixed Deposit Rate -2.65 -1.45 -6.52 -3.02 23.21 87.41
CIMB-Principal KLCI-Linked Fund(formerly SBB Index Linked Fund)
Shares 20.94 -6.92 -4.68 -17.47 -10.60 41.50 61.36
KLCI -7.02 -4.89 -17.89 -12.39 33.57 40.88
CIMB-Principal KLCI-Linked Fund 2(formerly SBB Composite Index Fund)
Shares 20.94 -6.94 -4.91 -17.97 -11.09 37.63 62.87
KLCI -7.02 -4.89 -17.89 -12.39 33.57 53.64
CIMB-Principal Money Market Fund(formerly SBB Money Market Fund)
Money Market Instrument 249.82 0.25 0.73 1.47 2.99 8.52 10.73
CIMB Bank Overnight Rate 0.21 0.63 1.26 2.53 9.32 12.57
CIMB-Principal Small Cap Fund(formerly Hidden Treasures Fund)
Shares 10.81 -6.37 6.87 -11.81 0.38 55.18 49.28
FTSE Bursa Malaysia Small Cap Index -8.24 -3.91 -21.45 -13.65 61.34 57.52
CIMB-Principal Small Cap Fund 2 (formerly SBB Emerging Companies Growth Fund)
Shares 118.68 -6.46 -0.26 -13.97 -4.11 15.72 57.74
FTSE Bursa Malaysia Small Cap Index -8.24 -3.91 -21.45 -18.91 28.28 -8.93
CIMB-Principal Strategic Bond Fund (formerly Strategic Bond Fund)
Fixed Income Securities 64.79 -3.62 -3.85 -3.49 -2.84 23.43 35.06
RAM Quantshop MGS Bond Index (medium sub-index) -1.61 -1.99 -0.13 0.07 8.91 17.76
CIMB-Principal Xcess Cash Fund (formerly Xcess Cash Fund)
Money Market Instrument 347.50 0.08 0.53 1.31 2.87 9.01 11.89
The CIMB Bank Overnight Rate 0.21 0.63 1.26 2.53 7.16 10.19
CIMB-Principal Xcess Income Fund (formerly Xcess Income Fund)
Money Market Instrument 29.02 -0.11 0.32 1.19 2.61 8.17
The CIMB Bank 1-month Fixed Deposit Rate 0.26 0.79 1.59 3.20 7.05
Ringgit Cost Averaging Ringgit-cost averaging is good for people who get frightened when the market drops after they invested a lump-sum. These people will feel better spreading out their investment over the year because it means regularly investing a fixed sum regardless of which way the stock market is moving.
When prices are high, the money buys fewer units, and when prices are low, the money buys more units. Over time, you will probably wind up with more shares at lower prices than if you bought them all at once. It reduces your average share cost and spreads your investment risk over time. By putting money in a little at a time, you don’t have to worry about trying to figure out if the market is going up or down.
It is also simple to put into practice. Investors can do a simple standing order investing monthly from their bank accounts into our unit trust funds. They can also obtain a CIMB Bank Credit Card through CIMB Wealth Advisors and conveniently charge their monthly investment.
Value AveragingValue averaging provides a much more systematic way of reaching a specified amount than regular ringgit-cost averaging. Since you are monitoring the value of your portfolio, you know right down to the ringgit whether you are on track and, if you are not, exactly what you need to do to get back on track.
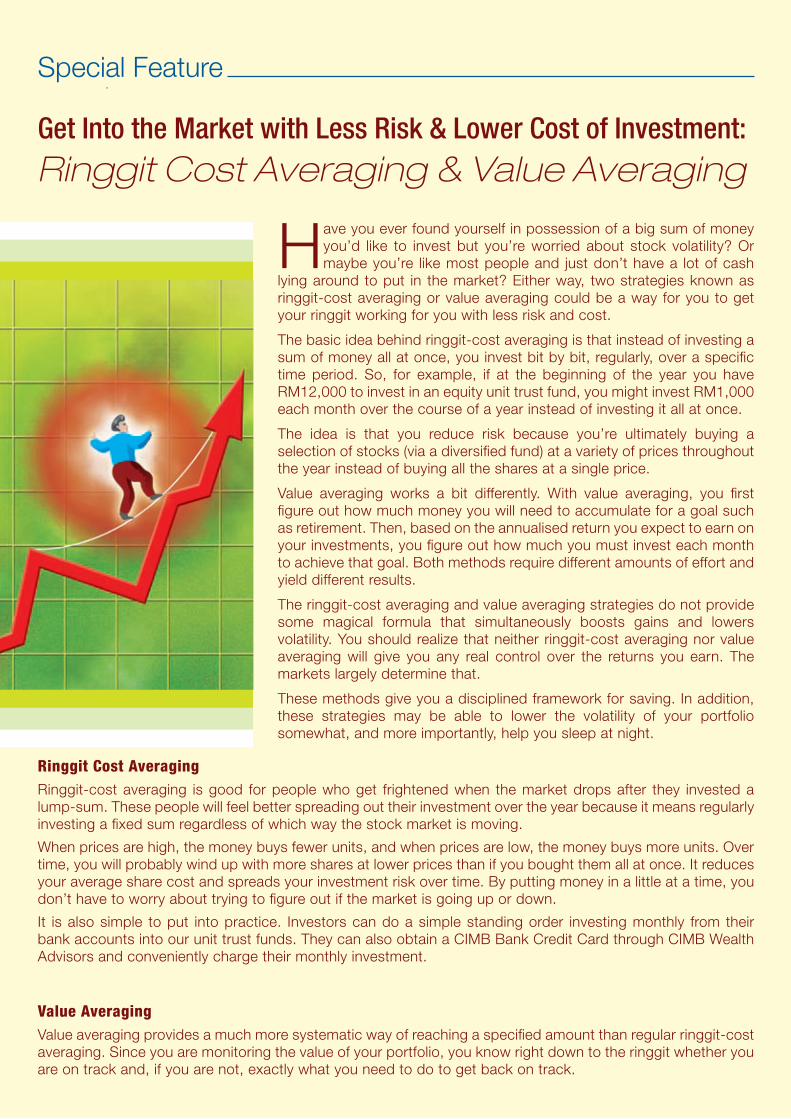
Special Feature
Get Into the Market with Less Risk & Lower Cost of Investment:
Ringgit Cost Averaging & Value Averaging
Have you ever found yourself in possession of a big sum of money you’d like to invest but you’re worried about stock volatility? Or maybe you’re like most people and just don’t have a lot of cash
lying around to put in the market? Either way, two strategies known as ringgit-cost averaging or value averaging could be a way for you to get your ringgit working for you with less risk and cost.
The basic idea behind ringgit-cost averaging is that instead of investing a sum of money all at once, you invest bit by bit, regularly, over a specific time period. So, for example, if at the beginning of the year you have RM12,000 to invest in an equity unit trust fund, you might invest RM1,000 each month over the course of a year instead of investing it all at once.
The idea is that you reduce risk because you’re ultimately buying a selection of stocks (via a diversified fund) at a variety of prices throughout the year instead of buying all the shares at a single price.
Value averaging works a bit differently. With value averaging, you first figure out how much money you will need to accumulate for a goal such as retirement. Then, based on the annualised return you expect to earn on your investments, you figure out how much you must invest each month to achieve that goal. Both methods require different amounts of effort and yield different results.
The ringgit-cost averaging and value averaging strategies do not provide some magical formula that simultaneously boosts gains and lowers volatility. You should realize that neither ringgit-cost averaging nor value averaging will give you any real control over the returns you earn. The markets largely determine that.
These methods give you a disciplined framework for saving. In addition, these strategies may be able to lower the volatility of your portfolio somewhat, and more importantly, help you sleep at night.
Special Feature
Let’s say your goal is to accumulate RM500,000 over the next 20 years. If you figure you can earn an annualized 8 percent, then you would need to put away about RM875 a month. You can then chart your progress month by month towards that goal.
Here’s where the “value” part of value averaging comes in. Let’s say that, at the end of the first year, instead of having the RM10,950 you should have to be on track toward your goal, a downturn in the markets leaves you with just RM10,000.
That would mean that the next month, instead of investing your usual RM875, you would invest an additional RM950 to bring your portfolio’s value to where it should have been in order to remain on track towards your goal. In fact, you would go through this process each month. In months where you fall behind, you would add to the amount you invest each month. In months where your returns are higher than expected and your portfolio’s value gets beyond where it needs to be, you would scale back your monthly investment, or even possibly end up selling some units.
There are various ways to carry out this strategy. Instead of adjusting your investment amount each month, you could recalculate it every three months or six months, even yearly. This is the essence of how value averaging works.
But like any system, value averaging has some drawbacks. If the market goes into a prolonged slump, or if you simply overestimate the potential return you can earn, you could end up having to make very large contributions to keep your account value on track. If you’re not able to double or even triple your contributions, you may have to abandon your plan, or create a new one.
It also requires more discipline and effort than ringgit-cost averaging. You will need to actively monitor your portfolio and re-adjust the amount you invest according to whether you are below or above your investment target to reach your goal. Unless you are highly motivated, it is likely you’ll need a financial planner or advisor to help keep you on track.
Value averaging also requires that when everyone else panics, not only must you remain calm and continue to purchase stocks, you must also invest in far larger amounts than in more normal times. This is precisely why value investing works better than ringgit-cost averaging: It forces investors to buy more unit trust funds when prices are low than when they are high, increasing overall potential returns, on average. Knowing value averaging is superior to ringgit-cost averaging is not enough.
Putting it into practice requires you not only to manage your investments, but also to manage your emotions!
Comparing the TwoRinggit Cost Averaging forces investors to spend a fixed dollar amount at regular intervals (e.g., monthly) on a particular investment or portfolio, regardless of the unit price and time horizon.
However, value averaging is more ideal for investors who want to achieve financial goals within a specific time horizon. It is a formula-based investment technique where a mathematical formula is used to guide the investment of money into a portfolio over time.
While ringgit cost averaging still works well, value averaging continues to outperform by producing generally higher potential returns. According to Michael Edleson, author of Value Averaging, “Value averaging is about as close to ‘buy low, sell high’ as you can get without a crystal ball.” I encourage you to read this book if you are interested to find out how to put value averaging into practice.
ConclusionThe main benefit of both methods is in providing a disciplined framework for saving and taking advantage of the power of compounding interest, which possibly lowers your portfolio volatility.
If anything, most people are not saving nearly enough for retirement, so the focus should be on saving more, not less. At the end of the day, the solution is to save as much as you reasonably can regardless of what the market is doing. When you’re investing for long-term goals, your ultimate aim is to reach the goal. And the more you save, the better the odds you will attain that goal.

Diversify across the Middle East and North Africa (MENA) amidstglobal uncertainty.
CIMB-PRINCIPAL MENA EQUITY FUND
The MENA region has one of the lowest correlations with the world markets, offering you a unique opportunity to diversify your portfolio in a land of abundance.
The MENA region is driven by massive oil wealth - over US$60 billion in 2006 - and unprecedented government expenditure of US$1.5 trillion for the next 5 years*
Accelerating oil demand** fuels the growth of other sectors such as banking and finance, telecommunications and real estate Low correlation between the MENA region and MSCI World, Nikkei and S&P500 enables you to truly diversify your investment portfolio
To enjoy the potential rewards that the MENA region can bring, please call our distributors below:1 300 880 900 (CIMB Bank), 03-2723 8688 (CIMB Private Banking), 03-7718 3000 (CIMB Wealth Advisors),1 300 303 300 (Citibank), 1 800 388 888 (Hong Leong), 1 300 885 000 (OCBC), 03-2715 9802 (Philip Mutual),03-2732 4332 (UOB) or visit www.cimb-principal.com.my.
* Source: HSBC Global Research, Meed, Thomson Financial Datastream
** Oil demand is estimated at 118 million barrels per day by 2030
For more information please contact your Financial Advisor or call our Client Service Representatives on 03 7718 3000. Alternatively, write to us at [email protected].
We recommend that you read and understand the contents of CIMB-Principal Asset Management Berhad’s Master Prospectus Issue No. 12 dated 30 June 2008 and its Supplemental Master Prospectus dated 15 August 2008, CIMB-Principal Islamic Asset Management Sdn Bhd’s Master Prospectus Issue No. 1 dated 30 June 2008 and its Supplemental Master Prospectus dated 15 August 2008 and CIMB-Principal KLCI-Linked Fund Prospectus dated 30 June 2008 and its Supplemental Prospectus dated 15/08/2008 which have been duly registered with the Securities Commission, before investing and that you keep the said Prospectuses for your records. Any issue of units to which the Prospectuses relate will only be made upon receipt of the completed application form referred to in and accompanying the Prospectuses, subject to the terms and conditions therein. You can obtain copies of the Prospectuses from the head office of CIMB-Principal Asset Management Berhad, CIMB-Principal Islamic Asset Management Sdn Bhd, CIMB Wealth Advisors Berhad or from any of our approved distributors. There are fees and charges involved in investing in the funds. We suggest that you consider these charges carefully prior to making an investment. Unit prices and income distributions, if any, may fall or rise. Past performance is not reflective of future performance and income distributions are not guaranteed. You are also advised to read and understand the contents of the Unit Trust Loan Financing Risk Disclosure Statement before deciding to borrow to purchase units. All performance figures have been verified by Mercer Zainal Consulting Sdn. Bhd. (35090-H).
• CIMB-Principal Equity Aggressive Fund 3 (Investments in the Fund are exposed to stock specific risk and company specific risk) • CIMB-Principal Small Cap Fund (Investments in the Fund are exposed to stock specific risk, company specific risk and liquidity risk) • CIMB-Principal Emerging Asia Fund (Investments in the Fund are exposed to stock specific risk, company specific risk, country risk, currency risk and liquidity risk) • CIMB-Principal Global Titans Fund (Investments in the Fund are exposed to country risk, currency risk, fund manager’s risk, legal and tax risk, stock specific risk and company specific risk) • CIMB-Principal Bond Fund (Investments in the Fund are exposed to credit/default risk, interest rate risk, counterparty risk and company specific risk) • CIMB-Principal Strategic Bond Fund (Investments in the Fund are exposed to credit/default risk, interest rate risk, counterparty risk, company specific risk and risks associated with investment in warrants/options) • CIMB-Principal Xcess Income Fund (Investments in the Fund are exposed to credit/default risk, interest rate risk and counterparty risk) • CIMB-Principal Xcess Cash Fund (Investments in the Fund are exposed to credit/default risk, interest rate risk and counterparty risk) • CIMB-Principal Balanced Fund (Investments in the Fund are exposed to credit/default risk, interest rate risk, counterparty risk, company specific risk and stock specific risk) • CIMB-Principal Income Plus Balanced Fund (Investments in the Fund are exposed to credit/default risk, interest rate risk, counterparty risk, company specific risk, stock specific risk, country risk and currency risk) • CIMB-Principal Global Asset Spectra Fund (Investments in the Fund are exposed to Fund manager’s risk, legal and tax risk, currency risk, country risk, risks associated with investment in global commodity-related assets, risks associated with investment in global property-related assets, credit/default risk and interest rate risk) • CIMB Islamic Equity Aggressive Fund (Investments in the Fund are exposed to stock specific risk and company specific risk) • CIMB Islamic Asia Pacific Equity Fund (Investments in the Fund are exposed to stock specific risk, company specific risk, country risk, currency risk and risks associated with investment in warrants/options) • CIMB Islamic Enhanced Sukuk Fund (Investments in the Fund are exposed to credit/default risk, interest rate risk, counterparty risk, stock specific risk, company specific risk & risks associated with investment in warrants/options) • CIMB Islamic Short Term Sukuk Fund (Investments in the Fund are exposed to credit/default risk, interest rate risk and counterparty risk) • CIMB Islamic Balanced Growth Fund (Investments in the Fund are exposed to stock specific risk, company specific risk, counterparty risk, credit/default risk and interest rate risk.) • CIMB-Principal Equity Aggressive Fund 1 (Investments in the Fund are exposed to stock specific risk, company specific risk and risk associated with investment in warrants/options) • CIMB-Principal Equity Fund (Investments in the Fund are exposed to stock specific risk and company specific risk) • CIMB-Principal Equity Fund 2 (Investments in the Fund are exposed to stock specific risk and company specific risk) • CIMB-Principal Equity Fund 4 (Investments in the Fund are exposed to stock specific risk and company specific risk) • CIMB-Principal Equity Income Fund (Investments in the Fund are exposed to stock specific risk, company specific risk, credit/default risk, interest rate risk, counterparty risk, country risk and currency risk) • CIMB-Principal KLCI-Linked Fund (Investments in the Fund are exposed to stock specific risk, company specific risk, tracking error risk, lack of discretion by Investment Manager risk and risk associated with investment in derivatives) • CIMB-Principal KLCI-Linked Fund 2 (Investments in the Fund are exposed to stock specific risk, company specific risk, tracking error risk, lack of discretion by Manager to adapt to market changes and investing in derivatives) • CIMB-Principal Small Cap Fund 2 (Investments in the Fund are exposed to stock specific risk, company specific risk and liquidity risk) • CIMB-Principal Asian Equity Fund (Investments in the Fund are exposed to stock specific risk, company specific risk, country risk, currency risk, risk of assets in emerging markets and liquidity risk) • CIMB-Principal Global Growth Fund (Investments in the Fund are exposed to stock specific risk, company specific risk, country risk and currency risk) • CIMB-Principal Equity Growth Fund (Investments in the Fund are exposed to stock specific risk, company specific risk, country risk and currency risk) • CIMB-Principal Equity Growth & Income Fund (Investments in the Fund are exposed to stock specific risk, company specific risk, credit/default risk, interest rate risk, counterparty risk, country risk and currency risk) • CIMB-Principal Bond Fund 2 (Investments in the Fund are exposed to credit/default risk, interest rate risk, counterparty risk and company specific risk) • CIMB-Principal Money Market Fund (Investments in the Fund are exposed to credit/default risk, interest rate risk and counterparty risk) • CIMB-Principal Balanced Income Fund (Investments in the Fund are exposed to credit/default risk, interest rate risk, counterparty risk, company specific risk and stock specific risk)• CIMB-Principal Global Balanced Fund (Investments in the Fund are exposed to stock specific risk, company specific risk, credit/default risk, interest rate risk, counterparty risk, country risk and currency risk) • CIMB-Principal Balanced Growth Fund (Investments in the Fund are exposed to credit/default risk, interest rate risk, counterparty risk, company specific risk and stock specific risk) • CIMB Islamic DALI Equity Growth Fund (Investments in the Fund are exposed to stock specific risk and company specific risk) • CIMB Islamic Enhanced Index Fund (Investments in the Fund are exposed to stock specific risk and company specific risk) • CIMB Islamic DALI Equity Fund (Investments in the Fund are exposed to stock specific risk, company specific risk, country risk and currency risk) • CIMB Islamic Equity Fund (Investments in the Fund are exposed to stock specific risk, company specific risk, country risk and currency risk) • CIMB Islamic Sukuk Fund (Investments in the Fund are exposed to credit/default risk, interest rate risk and counterparty risk) • CIMB Islamic Balanced Income Fund (Investments in the Fund are exposed to stock specific risk, company specific risk, counterparty risk, credit/default risk and interest rate risk) • CIMB Islamic Balanced Fund (Investments in the Fund are exposed to stock specific risk, company specific risk, counterparty risk, credit/default risk, interest rate risk, country risk and currency risk) • CIMB Islamic Small Cap Fund (Investments in the Fund are exposed to stock specific risk, company specific risk & liquidity risk)
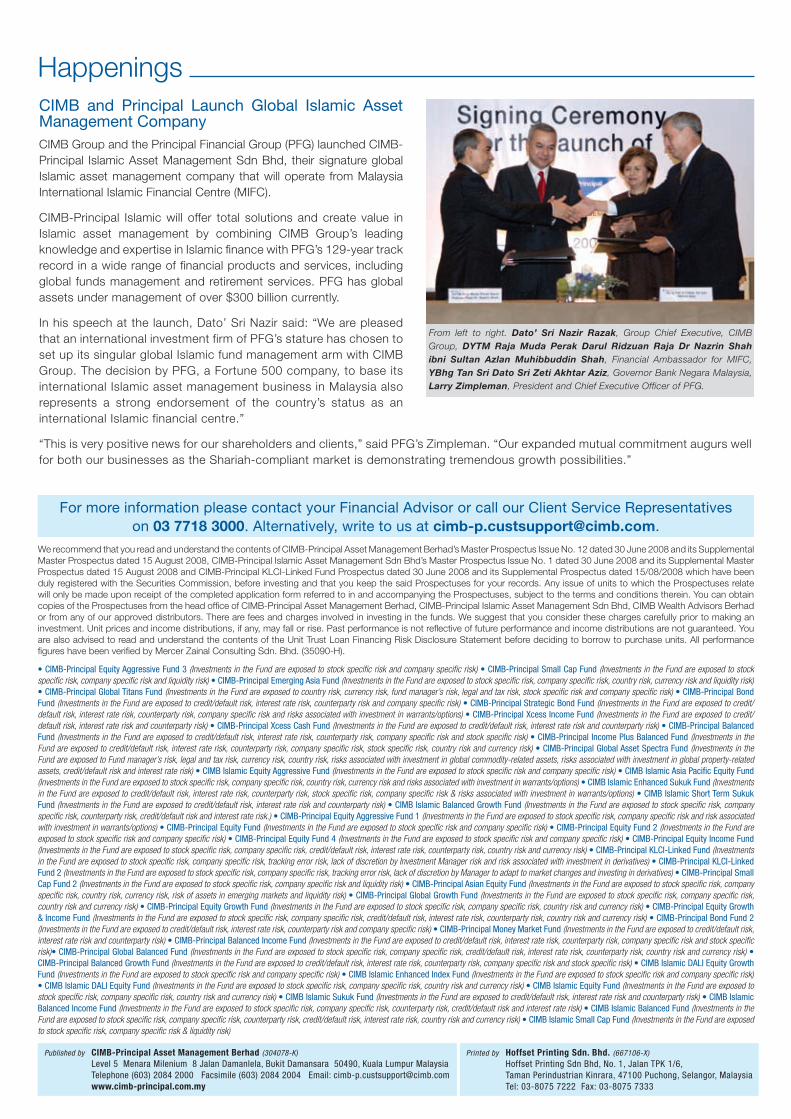
HappeningsCIMB and Principal Launch Global Islamic Asset Management CompanyCIMB Group and the Principal Financial Group (PFG) launched CIMB-Principal Islamic Asset Management Sdn Bhd, their signature global Islamic asset management company that will operate from Malaysia International Islamic Financial Centre (MIFC).
CIMB-Principal Islamic will offer total solutions and create value in Islamic asset management by combining CIMB Group’s leading knowledge and expertise in Islamic finance with PFG’s 129-year track record in a wide range of financial products and services, including global funds management and retirement services. PFG has global assets under management of over $300 billion currently.
In his speech at the launch, Dato’ Sri Nazir said: “We are pleased that an international investment firm of PFG’s stature has chosen to set up its singular global Islamic fund management arm with CIMB Group. The decision by PFG, a Fortune 500 company, to base its international Islamic asset management business in Malaysia also represents a strong endorsement of the country’s status as an international Islamic financial centre.”
“This is very positive news for our shareholders and clients,” said PFG’s Zimpleman. “Our expanded mutual commitment augurs well for both our businesses as the Shariah-compliant market is demonstrating tremendous growth possibilities.”
Published by CIMB-Principal Asset Management Berhad (304078-K) Level 5 Menara Milenium 8 Jalan Damanlela, Bukit Damansara 50490, Kuala Lumpur Malaysia Telephone (603) 2084 2000 Facsimile (603) 2084 2004 Email: [email protected] www.cimb-principal.com.my
Printed by Hoffset Printing Sdn. Bhd. (667106-X) Hoffset Printing Sdn Bhd, No. 1, Jalan TPK 1/6, Taman Perindustrian Kinrara, 47100 Puchong, Selangor, Malaysia Tel: 03-8075 7222 Fax: 03-8075 7333
From left to right. Dato’ Sri Nazir Razak, Group Chief Executive, CIMB Group, DYTM Raja Muda Perak Darul Ridzuan Raja Dr Nazrin Shah ibni Sultan Azlan Muhibbuddin Shah, Financial Ambassador for MIFC, YBhg Tan Sri Dato Sri Zeti Akhtar Aziz, Governor Bank Negara Malaysia, Larry Zimpleman, President and Chief Executive Officer of PFG.