the next american dream united statespages.stern.nyu.edu/~mpsif/docs/coursematerials/... ·...
TRANSCRIPT

See page 67 for Analyst Certification and Important Disclosures
Smith Barney is a division of Citigroup Global Markets Inc. (the "Firm"), which does and seeks to do business with companies covered in its research reports. As a result, investors should be aware that the Firm may have a conflict of interest that could affect the objectivity of this report. Investors should consider this report as only a single factor in making their investment decision.
Un
ite
d S
tate
s
Edward M. Kerschner, CFA 212-816-3532 [email protected]
Michael Geraghty 212-816-3534 [email protected]
E Q U I T Y
R E S E A R C H :
U N I T E D S T A T E S
Thematic Investing April 22, 2004
The Next American Dream Healthy, Wealthy, and Active: The Baby Boomer in 2010
➤ As they have all their lives, baby boomers — Americans born between the years 1946 and 1964 — will remain the most influential segment of the population.
➤ With the oldest boomers soon facing their 60s, their mindset and attitudes are changing and so, too, is the contour of the American Dream. The next American Dream is to be healthy, wealthy, and active. However, a gap between these aspirations and reality should be a key factor driving the behavior of baby boomers.
➤ Health conscious boomers are, by and large, obese and living unhealthy lifestyles. Wealthy boomers will enjoy good incomes largely by working after retirement. Active boomers want to work, but be able to take a day off when they want, while their leisure preference is “lazily active.”
➤ We believe the following areas are well positioned. Healthy: Managed health care, generic pharmaceuticals, and biotech companies. Wealthy: Advisory-based brokers, asset managers, selected insurance companies. Active: Homebuilders and home improvement, high-end hotels, casinos, and cruise lines.
➤ Poorly positioned industries, in our view, include some surprises such as large pharmaceutical companies, jewelry retailers, bookstores, and traditional mortality protection life insurers.

The Next American Dream – April 22, 2004
2
Investment Summary ................................................................................................................................3
The Next American Dream .......................................................................................................................6Healthy, Wealthy, and Active: The Baby Boomer in 2010.........................................................................6“The Great Moderation” ............................................................................................................................10
Stage 1: 1960–1980..................................................................................................................................11Boom-Bust Misery; Ebullient Youthfulness..............................................................................................11
Stage 2: 1980–2000..................................................................................................................................16Falling Misery; Middle-Age Responsibilities............................................................................................16
Stage 3: 2000–2020..................................................................................................................................19Stable Misery; Aging .................................................................................................................................19
The Next American Dream .....................................................................................................................23What Will Drive the Aging, Affluent Boomer?.........................................................................................23
Healthy......................................................................................................................................................27Having Your Cake (and French Fries and Chips) and Eating It, Too ........................................................27Eating Healthy ...........................................................................................................................................36
Wealthy.....................................................................................................................................................43Have Money, Need Advice........................................................................................................................43Looking for Safe Investments — A “Killer App”?....................................................................................46
Active ........................................................................................................................................................49The Active, Working Boomer....................................................................................................................49The Actively Relaxing Boomer .................................................................................................................58
Table of Figures .......................................................................................................................................64
The following analysts contributed to this report: Charles Boorady, Gregory Badishkanian,Colin Devine, Ronald Frank, George Grofik, Bonnie Herzog, Mark Kalinowski, Stephen Kim,Jill Krutick, Ruchi Madan, Wendy Nicholson, Michael Rietbrock, Bill Sims, Elise Wang, andDeborah Weinswig.
Table of Contents

The Next American Dream – April 22, 2004
3
With the oldest baby boomers soon facing their 60s, their mindset
and attitudes are changing and so, too, is the contour of the
American Dream. The next American Dream is to be healthy,
wealthy, and active. However, a gap between these aspirations
and reality should be a key factor driving the behavior of these
baby boomers.
Many boomers paradoxically find themselves living an unhealthy lifestyle and taking medications to remain active. Two in three boomers (68%) say they “care about” maintaining a healthyweight; less than half (47%) are “currently doing” things that help keep them inshape. Only one in ten boomers (12%) say they have attained their goal of“adopting a healthy lifestyle.” And more than one in four boomers aged 50–59are obese.
With health care costs rising rapidly, employers are trying to push a greatershare of expenses onto employees who, as a result, are likely to increasinglyuse generics, import medications from overseas, and possibly reduce theirconsumption of pharmaceuticals they perceive to be relatively unimportant.The establishment of Health Savings Accounts (HSAs) will likely only add tothe pressure on large pharmaceutical companies, but will likely be relativelyfavorable for selected managed health care, generic pharmaceutical, andbiotech companies.
Affluent boomers are confused about investing and need advice about their finances. Thanks to aggressive investing and a generally favorable investmentenvironment, boomers have accumulated significant wealth. The median networth of people in the 45–54 age group is almost twice that of those in the 35–44 age group, with the median net worth of those aged 55–64 even higher. Yetonly 26% of boomers “always know which types of investments are right forme.” Just 27% describe themselves as “somewhat experienced” investors.
Boomers are generally conservative investors and want financial advice.Because they will likely be working past retirement age and living longer thanever before, boomers want to know how to preserve capital in a volatilefinancial environment.
Active boomers want a balance between work and personal life; in their leisure time, boomers are lazily active. Three in five boomers (62%) consider it important to have “a successfulbalance between work and personal life.” More than half of boomers (54%)value “being able to take a day off when you want to,” yet nearly 70% ofworkers who have not yet retired plan to work into their retirement years ornever retire, but only 25% will work because they need the money.
“Actively working” boomers live in “jewel boxes” — relatively small houseswith professional-grade kitchens and luxurious bathroom designs — and drivetop-of-the-line vehicles crammed with “up-contenting” features.

The Next American Dream – April 22, 2004
4
Forty-seven percent of boomers like to walk as a leisure activity, but only 15%run when they exercise. Forty-two percent of boomers have taken a cruise inthe past five years, but only 11% swim when they exercise. Thirty-eightpercent of boomers like to go for a drive in their spare time, but only 11% gohiking. Thus, boomers are “lazily active.”
“Actively relaxing” boomers favor leisure activities that are outdoors or awayfrom home and engaging, rather than those that are indoors and passive. Theyare going away to high-end hotels to gamble and hunt for antiques, rather thanstaying home to watch a movie or play a video game.
Surprise! Four “obvious” hypotheses about consumer behavior proved to be invalid. While boomers are taking a lot of medications, this is not necessarily bullish forthe profit growth of large pharmaceutical manufacturers, which will likely bepressured on the demand side by HSAs and, on the supply side, by generics andimports from overseas.
While boomers are financially conservative, the demand for traditionalmortality protection-oriented life insurance policies is curbed by rising lifeexpectancy, as well as the fact that the older boomers’ grown kids are no longerfinancially dependent on their parents.
Despite the recent stock market experience, the “equity culture” is not dead.Seventy-three percent of investors who moved out of investments and into bankaccounts said that they planned to move the money back into their investmentaccounts once the investment outlook improves.
Boomers are not couch potatoes who want to stay home and take a nap, watch avideo, or surf online. They prefer leisure activities that are outdoors andengaging to those that are indoors and passive.
There are potential risks to our thematic outlook. A key risk to the Next American Dream is that the patterns suggested by thehistorical and/or attitudinal data do not develop as expected. Another risk isthat, even if these patterns do develop as expected, companies, industries, andsectors are unsuccessful in their efforts to take advantage of these trends. Inaddition, there are also near-term cyclical risks to the consumer sector, such assurprising price inflation or deflation, very slow economic growth, or anexogenous shock, such as a terror attack.
We further note that our analysis does not consider stock-specific metrics suchas valuation, EPS, and P/E, or balance sheets, market capitalization, liquidity,etc. Accordingly, when making investment decisions, investors should viewthematic analysis as only one input to their investment decision. Sincethematic analysis employs a longer-term methodology, its results may differfrom the conclusion of fundamental analysis. For example, in this report, wemention Avon Products and Four Seasons as being well positioned, but ourfundamental analysts currently rate both stocks Sell owing to valuation.

The Next American Dream – April 22, 2004
5
Figure 1. Industries Well Positioned and Poorly Positioned to Benefit from the Next American Dream
Theme Well Positioned Poorly Positioned Healthy Biotech companies Casual dining restaurants Bread Generic drug manufacturers Most large-cap pharmaceuticals Managed health care Personal care products Seafood restaurants Fast-food restaurants Selected wholesale clubs Vitamin & supplement retailers Tobacco Wine and spirits companies Beer; Carbonated drink makers
Wealthy Advisory-based brokers Consumer banks Selected asset managers Selected insurance companies Traditional mortality protection life
insurers
Active Auto interior suppliers Auto parts retailers Building products manufacturers Casino operators Selected theme-park owners Cruise line operators Gaming equipment manufacturers High-end hotels “Commodity” hotels Home improvement stores Jewelry retailers “Lifestyle” retailers Department stores Pet supply retailers Bookstores Selected homebuilders Source: Smith Barney

The Next American Dream – April 22, 2004
6
Healthy, Wealthy, and Active: The Baby Boomer in 2010 The key baby boom generation that has defined the consumer sector for the past fourdecades continues to age. Many boomers — the post-World War II surge ofAmericans born between the years 1946 and 1964 — are now in their 50s, with theoldest boomers set to turn 60 in 2006. Consequently, the fastest-growing age groupin the decade 2005–15 will be the 60- to 69-year-olds (see Figure 2).
Figure 2. U.S. Population Growth by Age Group over Three Ten-Year Periods, 1965–2015E
-20%
0%
20%
40%
60%
80%
< 5 5-9 10-14 15-19 20-24 25-29 30-34 35-39 40-44 45-49 50-54 55-59 60-64 65-69 70-74 75-79 80-84 85 >
Age
1965-1975
1985-19952005-2015
Stage 1 Stage 2 Stage 3
Source: U.S. Bureau of the Census International Data Base
For the foreseeable future, boomers will remain the most influential segment of thepopulation, as they have been all of their lives.
➤ In the first stage — the 1960s and 1970s — the young boomers had littlespending power (reflecting a generally weak economy, as well as the fact thatthey were far from their peak earning years), yet they had a tremendousinfluence on social issues ranging from the Civil Rights and Equal Rightsmovements to the War on Poverty. This was the “me generation,” characterizedby the burgers they ate, the sodas they drank, and the jeans they wore.
➤ In the second stage — the 1980s and 1990s — the middle-aged soccer momsand dads — then in their peak earning years — drove the consumer comebackthat energized the U.S. economy in the second half of the 1990s. They electedRonald Reagan, bought BMWs, and favored conspicuous consumption.
➤ And now, soon facing their 60s with their children largely grown up, boomersare in the third stage of their lifecycle. Consequently, their mindset and attitudesare changing and so, too, is the contour of the American Dream. As we discussin detail below, we believe the next American Dream for these boomers is to be
The Next American Dream
The fastest-growing agegroup in the decade
2005–15 will be the 60–69year olds.
Boomers will remain themost influential segment
of the population.

The Next American Dream – April 22, 2004
7
healthy, wealthy, and active. However, the effort to realize that dream involvesmany contradictions:
➤ A high number of health-conscious boomers are actually obese.
➤ Wealthy boomers will enjoy good incomes largely by working after retirement.
➤ Active boomers want to stay in the labor force but be able to take a day off whenthey want. Moreover, their leisure preference is to be lazily active.
Concomitant with the demographic evolution of the baby boom generation, theeconomic cycle has also matured and is much less volatile (see Figure 3). Inessence, like the boomers themselves, the economy is in the third stage of atransformation, following the transition from the inflationary post-World War IIboom-bust industrial economy (Stage 1) to the disinflationary service economy ofthe 1980s and 1990s (Stage 2). This latest transformation has been labeled “themuted business cycle” or, alternatively, the “great moderation.”
Figure 3. Ten-Year Rolling Standard Deviation of GDP Growth, 1957–Present
0%
2%
4%
6%
8%
1950 1955 1960 1965 1970 1975 1980 1985 1990 1995 2000 2005
Source: Bureau of Economic Analysis
Importantly, in the past, key demographic and economic trends have beenintertwined, so that one has reinforced the other (as opposed to a cause and effectrelationship). So, for example, the fact that the young and inexperienced babyboomers flooded the workforce in the early 1970s made it difficult to boostproductivity (and living standards) during a period that was prone to sharp economicdownturns. By contrast, in the strong economy of the late 1990s, with the influx ofwomen and baby boomers into the workforce largely complete, the labor supplygrew tight just as boomers were entering their peak earning years. Today it seemslikely that stable demand by older boomers will coincide with an extended period oflow economic volatility.
Concomitant with thedemographic evolution
of the baby boomgeneration, the
economic cycle has alsomatured and is much
less volatile.
Key demographic andeconomic trends have
been intertwined.

The Next American Dream – April 22, 2004
8
In this report, we examine the older boomers and how we expect 1) the normalprocess of aging, 2) the changing economic landscape, and 3) shared lifeexperiences to drive their behavior (see Figure 4). To that end, we dug into theeconomic data, enlisted the help of a leading expert on consumer behavior, andcollaborated with Smith Barney analysts:
➤ The Bureau of Labor Statistics’ (BLS) annual Consumer Expenditure Survey(CES) collects information from the nation’s households and families on theirbuying habits (expenditures), income, and characteristics (e.g., age andeducation). The 2002 CES, released in November 2003, is the most recentlyavailable.
➤ For 30 years, Yankelovich Partners have been compiling comprehensive pollsabout consumers’ preferences, habits, and lifestyles. Key results ofYankelovich’s proprietary 2003 report on consumer behavior, The YankelovichMONITOR, are discussed throughout the report.
➤ More than a dozen Smith Barney analysts covering the consumer, health care,and financial sectors provided their insights on the investment implications ofchanging boomer behavior.
Importantly, this “triple-check” helped weed out hypotheses about consumerbehavior, which seemed to make intuitive sense, but upon further investigationproved to be invalid. Consider the following:
➤ With boomers taking so many medications, this has to be bullish for the profitgrowth of large pharmaceutical manufacturers — right? Wrong! With healthcare costs rising rapidly, employers are trying to push a greater share ofexpenses onto employees who, as a result, are likely to increasingly use genericsand import medications from overseas, as well as possibly reduce theirconsumption of pharmaceuticals they perceive to be relatively unimportant.
➤ With many boomers now in their 50s, this has to be bullish for companiesselling traditional mortality protection oriented life insurance policies — right?Wrong! Life expectancy is rising, and boomers are living much longer than everbefore. Moreover, boomers’ kids are largely grown and are no longerfinancially dependent on their parents.
➤ The recent stock market experience will keep boomers away from stocks —right? Wrong! The “equity culture” is not dead. In fact, affluent investors mostfrequently blamed corporate executives and themselves for stock market losses.While 22% of affluent investors said they had reallocated funds frominvestments to their bank account, 73% said that they planned to move themoney back to their investment accounts once the investment outlook improves.
➤ In their leisure time, tired, stressed out, and hardworking boomers are couchpotatoes who want to stay home and take a nap, watch a video, or surf online —right? Wrong! These boomers are “actively relaxing,” preferring leisureactivities that are outdoors and engaging rather than those that are indoors andpassive.
Some “obvious”hypotheses about
consumer behaviorseemed to make intuitive
sense, but upon furtherinvestigation proved to
be invalid.

The Next American Dream – April 22, 2004
9
Figure 4. Behavior Is Shaped by Common Experiences
Baby Boomers (’46–’53) Baby Boomers (’54–’64) Gen X (’65–’78)
Slogans Make Love, Not War No Nukes “Whatever”
Question Where were you when JFK was shot?
Where’s the beef? Boxers or briefs?
Demonstration Chicago riots No nukes march Battle of Seattle
The 60s Participants Witnesses Oliver Stone movie
Jewelry Peace symbol necklace POW bracelet Nose ring
Journalist Hunter Thompson John F. Kennedy Jr. Matt Drudge
News Walter Cronkite CNN CNN.com
Gathering Woodstock Live Aid Lollapalooza
War Vietnam “Star Wars” Persian Gulf War
Hero JFK Jerry Brown Jesse Ventura
Magazine Ramparts George Drudge Report
Scandal Profumo affair Watergate Monicagate
Gesture Burn draft card Streaking Moshing
Hot Spots San Francisco Austin Seattle
Filmmakers Oliver Stone Spike Lee Kevin Smith
Feminist Gloria Steinem Naomi Wolf Courtney Love
Poet Bob Dylan Bruce Springsteen Kurt Cobain
Season Summer of Love Spring Fever Winter of Discontent
Anti- Anti-war Anti-nuke Anti-WTO Source: Jonathan Pontell, “Generation Jones” (Vanguard Press)
“A Generation Defined: Among Webster’s definitions of generation is thefollowing: ‘a category of people born and living contemporaneously.’ Marketershave often defined ‘generation’ as a group of people who share the same formativeexperiences. These experiences bind people that are born in continuous years into‘cohorts’ — a group of individuals that have a demographic statistic in common.”1
1“Generation Divide,” Alison Stein Wellner, American Demographics, Oct 1, 2000.
“Marketers have oftendefined ‘generation’ as a
group of people whoshare the same formative
experiences.”

The Next American Dream – April 22, 2004
10
“The Great Moderation” We began to write about a muting of the business cycle in 1996. That the economyis now more stable has lately become a topical subject in economic and academiccircles. In a recent speech entitled “The Great Moderation,”2 Federal ReserveGovernor Ben S. Bernanke observed that “one of the most striking features of theeconomic landscape over the past twenty years or so has been a substantial declinein macroeconomic volatility.” Between 1950 and 1982, there were seven recessions,or one every 4.6 years; since 1982, there have been just two recessions in 22 years(see Figure 5).
Figure 5. Annualized Quarterly Real GDP Growth, 1950–2003
Recessions shaded
-15%
-10%
-5%
0%
5%
10%
15%
20%
1950 1955 1960 1965 1970 1975 1980 1985 1990 1995 2000 2005
Source: Bureau of Economic Analysis
In his speech, Governor Bernanke referenced the work of Blanchard and Simon3,who documented that the variability of quarterly growth in real output (as measuredby its standard deviation) has declined by half since the mid-1980s (see Figure 3).Importantly, whatever the exact cause(s) of the reduced volatility (e.g., improvedinventory management thanks to better information technology, more effectivemonetary policy, etc.), Blanchard and Simon illustrated that the decline in outputvolatility is not a recent development but rather “a steady one, starting in the 1950s(or earlier), interrupted in the 1970s and early 1980s, with a return to trend in thelate 1980s and the 1990s.” In other words, a steady decline in volatility has been thenorm, not the exception (see Figure 3).
2 Remarks by Governor Ben S. Bernanke at the meetings of the Eastern Economic Association, Washington, D.C., February 20,2004.
3 The Long and Large Decline in U.S. Output Volatility, Olivier Blanchard and John Simon, March 10, 2000.
Over the past twentyyears or so,
macroeconomic volatilityhas declinedsignificantly.
A steady decline involatility has been the
norm, not the exception.

The Next American Dream – April 22, 2004
11
Boom-Bust Misery; Ebullient Youthfulness Born into the prosperity of postwar America, the young baby boomers grew up in agolden period for the U.S. economy in general and the U.S. consumer in particular.Between 1961 and 1967, productivity growth was strong, economic growth wassolid, there were no recessions, and yet inflation was remarkably restrained. Notsurprisingly, consumption grew rapidly in the first half of the 1960s (see Figure 6).
Figure 6. Real Per Capita Consumption Growth — Year-over-Year Percentage Change, 1950–2003
Recessions shaded
-6%
-4%
-2%
0%
2%
4%
6%
8%
10%
1950 1955 1960 1965 1970 1975 1980 1985 1990 1995 2000 2005
Source: Bureau of Economic Analysis
In the late 1960s, however, a combination of factors led to secular inflation. First,President Johnson attempted to fight both the war on poverty (which included a newprogram called Medicare) and the war in Vietnam without raising taxes — eventhough the unemployment rate was only 4% in 1965 (see Figure 7). With theeconomy already booming, the twin wars against poverty and the Viet Cong stokedpricing pressures. At the time, there was a dearth of foreign competition to dissuadeU.S. firms from raising prices to meet the demands of increasingly militant laborunions.
Stage 1: 1960–1980
The young babyboomers grew up in agolden period for the
U.S. economy.
In the late 1960s, avariety of factors led to
secular inflation.

The Next American Dream – April 22, 2004
12
Figure 7. Unemployment Rate, 1950–Present
Recessions shaded
-4%
0%
4%
8%
12%
16%
1950 1955 1960 1965 1970 1975 1980 1985 1990 1995 2000 2005
Source: Bureau of Labor Statistics (BLS)
Rising inflation (see Figure 8) led directly to higher interest rates and, ultimately, tocredit crunches (1966), recession (1970), and price controls (1971). Then foodprices soared during 1973 and, in the winter of 1973–74, OPEC quadrupled the priceof gasoline. Inflation rose above 10% in 1974.
Figure 8. Inflation — Year-over-Year Percentage Change in the CPI, 1950–Present
Recessions shaded
-4%
0%
4%
8%
12%
16%
1950 1955 1960 1965 1970 1975 1980 1985 1990 1995 2000 2005
Source: BLS
Rising inflation leddirectly to higher interest
rates and, ultimately, tocredit crunches,
recession, and pricecontrols.

The Next American Dream – April 22, 2004
13
In 1975, the economy fell into a severe recession after the oil shock, when inflationravaged consumer incomes and confidence as well as business confidence. But afterthe 1975 recession ended, inflation only got worse. Throughout the late 1970s, thenewspapers were full of stories about the failures of the Carter Administration’svarious schemes for containing inflation and gloomy news about their lack ofsuccess. Government regulation expanded in such areas as pollution, consumerproduct safety, and employment practices.
Amid this inflationary, recession-ridden environment, the young baby boomersentered the labor force (see Figure 9). In terms of work options, many youngboomers turned to giant bureaucracies, whether it was the corporation that offered ajob for life, the union that fought for job security and better pay, or the sprawlinggovernment sector that already accounted for 20% of GDP in 1970.
Figure 9. U.S. Labor Force Growth by Decade, 1950–1999
Compound annual growth rate
0% 1% 2% 3%
1990s
1980s
1970s
1960s
1950s
Source: BLS
Importantly, the large numbers of inexperienced workers in the workforce duringthis period of rapid labor force growth made it difficult to boost productivity (seeFigure 10). Consequently, after 1973, productivity growth declined and realincomes started to fall (see Figure 11). Not surprisingly, consumer confidence andper capita consumer spending steadily collapsed while the “misery index” — thesum of the inflation and unemployment rates — doubled, eventually reaching a peakof 22% in 1980 (see Figure 12).
Amid this inflationary,recession-ridden
environment, the youngbaby boomers entered
the labor force.
The large numbers ofinexperienced workers in
the workforce made itdifficult to boost
productivity.

The Next American Dream – April 22, 2004
14
Figure 10. U.S. Nonfarm Productivity — Year-over-Year Quarterly Percentage Change, 1950–2003
-4%
-2%
0%
2%
4%
6%
8%
1950 1955 1960 1965 1970 1975 1980 1985 1990 1995 2000 2005
Source: BLS
Figure 11. Real Disposable Income — Year-over-Year Percentage Change, 1950–2003
-4%
0%
4%
8%
12%
1950 1955 1960 1965 1970 1975 1980 1985 1990 1995 2000 2005
Source: BLS
Figure 12. Misery Index — Sum of Inflation and Unemployment Rates, 1950–Present
0%
5%
10%
15%
20%
25%
1 950 1955 1 960 1965 1 970 1975 1 980 1985 1 990 1995 2000 2 005
Source: BLS

The Next American Dream – April 22, 2004
15
As noted, in this period of boom-bust misery, recessions were a regular occurrence.Indeed, between 1950 and 1982, there were seven recessions, or one every 4.6 years.The frequent downturns were primarily caused by inventory corrections (see Figure13), exacerbated by the prolonged tightening of an inflation-fighting Fed.
Figure 13. Nonfarm Inventories to Final Sales Ratio, 1950–Present
Recessions shaded
1.5
2.0
2.5
3.0
3.5
1950 1955 1960 1965 1970 1975 1980 1985 1990 1995 2000 2005
Source: Bureau of Economic Analysis
The fact that inventories remained at relatively high levels during the 1970s largelyreflected a very industrialized economy (in which high capacity utilization wasassociated with high profit margins given heavy fixed costs) as well as poorinformation management. These high inventory levels made the economyparticularly vulnerable to slumps in demand caused by Fed tightening. So it is notsurprising that the really bad recessions occurred when inflation was high and theFed was tightening aggressively, as was the case in 1975 and in 1981–82.
In summary, while the young baby boomers were numerous and ebullient during thisfirst stage, they were not in a position to have much of an impact on the economy.First, they were still far from their peak earning years and as such had relativelylittle spending power. Second, whatever spending power they did have was sharplycurtailed by rampant inflation and high interest rates.
While the young babyboomers were numerousand ebullient during the
1960s and 1970s, theywere not in a position tohave much of an impact
on the economy.

The Next American Dream – April 22, 2004
16
Falling Misery; Middle-Age Responsibilities By the winter of 1979, the Consumer Price Index (CPI) was advancing at a 13%annual rate. Curbing that rampant inflation became a mandate for two newcomers toWashington D.C.: Paul Volcker (appointed Federal Reserve chairman in the autumnof 1979) and Ronald Reagan (elected president a year later).
Mr. Volcker’s tight monetary policy caused a sharp but short recession in 1980.When that failed to curb inflation, Mr. Volcker tightened once again, leading to amuch longer downturn that began in July 1981 and did not end until November1982. As for President Reagan, the central tenets of Reaganism were reducingregulation, cutting taxes (federal income taxes were cut in 1983), trimminggovernment spending (except defense), and taking an optimistic view of the future incontrast to the gloom of the Carter era.
The favorable combination of falling inflation, lower taxes, fairly stable incomes(better than the sharp declines of the mid-1970s), falling unemployment, a strongdollar and surging stock prices reenergized the consumer sector. The misery indexplunged (see Figure 12), and real per capita consumer spending rose as fast in themid-1980s as it had in the early 1960s (see Figure 6).
While Reaganomics helped most consumers, it put severe pressure on manycorporations that had grown accustomed to raising prices at will. Adding todisinflation were the high real interest rates of the mid-1980s, the strong dollar of1983–85, and intense competition from industrializing countries in Asia. CorporateAmerica moved to adjust to this harsh competitive climate by slashing headcount,spinning off less profitable businesses, and using new technology to reengineeroperations. These initiatives produced a rebound in profit margins (see Figure 14),but consumers were hurt in the late 1980s by stagnating incomes, slow employmentgrowth, and a loss of employment security. Consumption growth slowed sharply.
Figure 14. After-Tax Profits as a Percentage of Gross Domestic Income, 1950–2003
2%
4%
6%
8%
1950 1955 1960 1 965 1 970 1 975 1980 1985 1990 1 995 2 000 2 005
Source: Bureau of Economic Analysis
Stage 2: 1980–2000
Falling inflation, lowertaxes, fairly stable
incomes, fallingunemployment, a strong
dollar, and surging stockprices reenergized the
consumer sector.

The Next American Dream – April 22, 2004
17
Consequently, in the late 1980s, the misery index rose again, driven by (as it turnedout) a temporary increase in unemployment, as well as rising inflation spurred by ashift from very low oil prices in the mid-1980s to an energy price spike in 1991(associated with the first Gulf War). But that period was only a pause in a two-decade long decline in the misery index. As it turned out, what was good forAmerican corporations — rising productivity, low inflation, and a lengthy economicexpansion — would prove to be good for U.S. workers as well. Corporatedownsizing (as distinct from productivity improvement) could not go on forever. By1995, continued economic expansion forced firms to raise wages in order to hire theworkers they needed. Thanks to strong productivity and profit growth, corporationscould well afford to raise wages.
Indeed, it was the drop in the misery index from 12% in the early 1990s to 6% in thelate 1990s that drove a consumer comeback. With the influx of women and babyboomers into the workforce largely complete, the labor supply grew more slowly inthe late 1990s. Consequently, as the economic expansion continued, companieswere obliged to raise wages as the unemployment rate declined. Importantly, notonly did nominal incomes increase, so did real incomes, thanks to a continueddecline in the inflation rate. Moreover, it was in the 1990s that the 40-year-oldboomers were in their peak earning years (see Figure 15).
Figure 15. Household Income Level by Age of Reference Person in 2002
$0
$10,000
$20,000
$30,000
$40,000
$50,000
$60,000
$70,000
under 25 25-34 35-44 45-54 55-64 65-74 75+
Source: Consumer Expenditure Survey (CES)
The consumer comeback of the late 1990s eventually evolved into an American ageof affluence as the so-called peace dividend that followed the Cold War helped fuela budget surplus and a period of unprecedented prosperity. The income of boomers— who, as we previously noted, were already in their peak earning years — wasfurther boosted by the roaring stock market of the late 1990s, which generatedplenty of capital gains.
The drop in the miseryindex from 12% in the
early 1990s to 6% in thelate 1990s drove a
consumer comeback.

The Next American Dream – April 22, 2004
18
While the recession of 2001 brought an end to the American age of affluence, it isimportant to bear in mind just how strong the consumer sector remained during thedownturn. Consider that real consumption growth was never much below 2% in therecent recession, compared to actual declines in previous recessions (see Figure 6).This was likely due, in large part, to the fact that the peak jobless rate (6.3% in June2003) was well below the peaks reached in previous recessions (see Figure 7).
A key reason the consumer sector has remained relatively strong has likely been themuting of the business cycle. As noted previously, between 1950 and 1982, therewere seven recessions, or one every 4.6 years. By contrast, since 1982, there havebeen just two recessions in 22 years. Three factors behind the “muted businesscycle” have been:
1 Low Inflation/Benign Deflation. Declining technology costs have drivenproductivity gains, which help keep inflation low (see Figure 8) and therebyeliminate the need for extended periods of Fed tightening.
2 A Service-Oriented Economy. The structural shift away from manufacturingtoward a service economy (see Figure 16) makes inventory accumulationdifficult.
Figure 16. Employment by Service Industries as a Percentage of Total Nonagricultural Employment
50%
60%
70%
80%
90%
100 %
1950 1955 1 960 1965 197 0 197 5 19 80 1 985 19 90 1 995 2000 2005
Source: BLS
3 Low Inventory Levels. Networked computers have made lower inventory levelspossible (see Figure 13). The power of information technology has enabledcorporations to use information about stocks (and supply and demand) to keepinventories closely in line with sales, and thereby promote more steady growth byavoiding an inventory accumulation/decumulation cycle.
Despite the prosperity of the U.S. in the late 1990s, baby boomers probably becamethe most stressed generation in history. Boomers faced stress from the normalresponsibilities of middle age (e.g., career, finances, and caring for children andelderly parents), with additional pressures coming from a sense of no job securityand the urgent need to save for retirement. Then in the 21st century came the fear ofterrorism.
Real consumptiongrowth was never much
below 2% in the recentrecession, compared to
actual declines inprevious recessions.
In the 1990s, babyboomers probably
became the moststressed generation in
history.

The Next American Dream – April 22, 2004
19
Stable Misery; Aging To summarize, Stage 1 of the baby boomer lifecycle was characterized by 1) aboom-bust economy, 2) a high misery index, and 3) little real spending power. Thekey characteristics of Stage 2 were 1) a muted business cycle, 2) a falling miseryindex, and 3) peak earning years. As we argue below, Stage 3 is likely to becharacterized by 1) low volatility of GDP, and, by definition, the components ofGDP (including consumption and investment); 2) a stable misery index; and 3) anaging population that still has considerable spending power.
Low Volatility; A Stable Misery Index As we discussed above, the substantial decline in macroeconomic volatility has nowbecome widely acknowledged in economic and academic circles. Whethermacroeconomic volatility will continue to decline remains to be seen, and we areunwilling to prognosticate on that subject. However, barring some unforeseenexogenous shock, it seems unlikely that volatility will increase.
It seems likely that the misery index will remain stable, too. While inflation is likelyto continue rising from the cyclical trough of 1.1% (on a year-over-year basis)reached in June 2002, it is hard to make a case for the kind of secular inflation thatemerged in the late 1960s.
As for unemployment, the combination of an aging labor force (albeit one in whichparticipation rates continue to rise, as discussed below), slowing population growth,and stricter immigration policies suggest that a labor shortage is more of a risk incoming years than a glut of workers.
An Aging, but Still Affluent, Population As noted above, boomers are moving out of what, historically, have been their peakearning years. As Figure 15 illustrates, consumers aged 45–54 have, historically,been the top earnings group (earning 145% of the average), while the income of the55–64 group has, historically, been just 120% of the average. But there is goodreason to believe these historical relationships may not hold true in the future.Specifically, as we outline below, it is not implausible to argue that, in comingyears, consumers aged 55–64 will earn as much as, if not more than, those aged 45–54.
Unlike their parents who grew up amid the hardships of the Depression and WorldWar II, baby boomers today do not view a leisurely retirement as their reward foryears of hard work and sacrifice. Boomers have always been work centered and willlikely remain so. Moreover, given that the typical American is living longer thanever before, many people are likely to choose the intellectual stimulation of workover the monotony of doing nothing.
Stage 3: 2000–2020
A labor shortage is moreof a risk in coming years
than a glut of workers.
In coming years,consumers aged 55–64will likely earn as much
as, if not more than,those aged 45–54.

The Next American Dream – April 22, 2004
20
A recent American Association of Retired Persons (AARP) study4 revealed thatnearly 70% of workers who have not yet retired say that they plan to work into theirretirement years or never retire (see Figure 17).
Figure 17. Plans for Retirement Among Workers Who Are Still Employed
Not work for pay at all 29%
Work part-time, doing the same type of work you do now 24%
Work part-time, doing something different 22%
Start your own business/work for yourself, doing the same type of
work you do now 5%
Start your own business/work for yourself, doing something different
5%
Work full-time, doing the same type of work you do now 5%
Work full-time, doing something different 2%
Never expect to retire 5%
Don’t know 3%
Source: American Association of Retired Persons (AARP)
Almost half indicated that they envision working into their 70s or beyond. (Thosewho may not want to work later in life could well be obliged to do so if reform ofthe Social Security system pushes back the retirement age.) Importantly, the AARPstudy found that the top motivations for working in retirement included not only theneed for extra money, but also a general desire to work for enjoyment, to havesomething interesting to do, and to stay physically active (see Figure 18).
Figure 18. Why Keep Working? Major Factors in the Decision to Work in Retirement
Be around people 4% Be productive or useful 14%
Do something fun 5%
Don’t know/Refused 3%
Help other people 6%
Learn new things 3%
Need health benefits 14%Need money 25%
Pursue a dream 4%
Stay mentally active 14%
Stay physically active 9%
Source: AARP
4 Staying Ahead of the Curve 2003: The AARP Working In Retirement Study.
Nearly 70% of workerswho have not yet retired
say they plan to workinto their retirement
years or never retire.
The top motivations forworking in retirement
included more than theneed for extra money.

The Next American Dream – April 22, 2004
21
This increasing desire to work is corroborated by rising participation rates for menaged 55–64 (see Figure 19). The labor force participation rate of men aged 65 andover has also started to climb (see Figure 20).
Figure 19. Quarterly Labor Force Participation Rate of Men Aged 55–64, 1950–Present
60%
70%
80%
90%
100%
1950 1955 1960 1965 1970 1975 1980 1985 1990 1995 2000 2005
Source: BLS
Figure 20. Quarterly Labor Force Participation Rate of Men Aged 65 and Over, 1950–Present
10%
20%
30%
40%
50%
1950 1955 1960 1965 1970 1975 1980 1985 1990 1995 2000 2005
Source: BLS
According to the BLS, 17% of the nation’s workforce will consist of adults aged 55and older by the year 2010, up from 13% in the year 2000. By 2050, older adults areprojected to account for 19% of the workforce. During this period, younger workersbetween the ages of 25 and 54 are expected to decline as a percentage of theworkforce to 67% in 2010 and 65% in 2050 from 71% in 2000.
The increasing desire towork is corroborated by
rising participation ratesfor men aged 55-64...
...and 65 and higher.
Of the nation’sworkforce, 17% will be
adults aged 55 and olderby the year 2010, up from
13% in 2000.

The Next American Dream – April 22, 2004
22
Because older workers have more experience than their younger counterparts, theyare likely more productive and, therefore, more deserving of higher pay. Moreover,the real disposable incomes of all workers should be boosted by strong productivitygrowth driven by continued technological advances.
Even if the annual flow of income to the older boomers does not match those of theiryounger counterparts, their total stock of wealth will likely be greater. Thanks toaggressive investing and a generally favorable investment environment, boomershave accumulated significant wealth. Figure 21 shows that, in 2001, the median networth of people in the 45–54 age group was almost twice that of those in the 35–44age group, with the median net worth of those aged 55–64 even higher. Moreover,inheritances will continue to be an important source of wealth as boomers inheritestates from their parents who prospered in the decades after World War II.
Figure 21. Median Net Worth by Age of Head of Family
Thousands of 2001 dollars
$0
$50
$100
$150
$200
<35 35-44 45-54 55-64 65-74 75+
Source: Federal Reserve
The median net worth ofthe 45–54 age group is
almost twice that of the35-44 age group.

The Next American Dream – April 22, 2004
23
What Will Drive the Aging, Affluent Boomer? A potent motivator for baby boomers has always been the desire for experiences, notjust things. Today, with most of their material needs satisfied, boomers place morevalue on experiences than on tangibles. We highlight the following data points fromthe Yankelovich MONITOR:
➤ Sixty-five percent of boomers say they need to satisfy their “hunger for newexperiences.”
➤ When boomers were asked what they viewed as signs of success andaccomplishment, the three bottom-ranked categories were an “extremelyattractive spouse,” “designer clothes,” and “expensive jewelry” (Figure 22).Note that the amount of money spent on jewelry declines with age (Figure 23).
Figure 22. Signs of Success and Accomplishment as Perceived by Boomers
0%
20%
40%
60%
80%
G ood M arriage Physica lly Fit P leasureTrave l
Not Look ing AtPrices
Expensive Car Large H om e Expens iveJew elry
Des ignerC lothes
AttractiveSpouse
Source: Yankelovich Partners, Inc.
Figure 23. Spending on Jewelry and Watches as a Percentage of Total Expenditures by Age
0 .0 %
0 .2 %
0 .4 %
0 .6 %
A ge 4 0 Ag e 5 0 A g e 6 0
T oda y 's 6 0 y r o lds
B oo m ers
Source: CES
The Next American Dream
Boomers place morevalue on experiences
than on tangibles.

The Next American Dream – April 22, 2004
24
➤ Although boomers feel a strong need for financial advice, as we discuss below,they are much less focused on money per se. The percentage of people aged45–54 who agreed that money is “the only meaningful measure of success”dropped to only 16% in 2003 from 23% in 1994.
According to the Yankelovich MONITOR and the AARP, boomers are focused on:
➤ Health — 62% are concerned about trying to stay in shape.
➤ Wealth — 63% of boomers want to be able to afford the things that areimportant to them.
➤ Activity — Nearly 70% of workers who have not yet retired plan to work intotheir retirement years or never retire.
At the same time, however:
➤ Two in three boomers (65%) “feel guilty about not exercising more often.”
➤ Almost half (47%) say that “lately, I’ve become confused about the best way toinvest my money.”
➤ More than half (54%) of boomers value “being able to take a day off when youwant to.”
We believe this gap between aspirations and reality is a key factor driving thebehavior of baby boomers. As we discuss in detail below, the fact that boomerswant to be fit yet are living unhealthy lifestyles has important implications forhealthcare companies. The fact that cash- and asset-rich boomers want to plan theirfinancial futures but are confused about how to invest their money is positive forselected financial services firms. And the fact that boomers value their free time butplan on working after retirement has implications for a variety of industriesassociated with leisure and entertainment.
Figure 24 is based on data from the CES and shows spending on major categories asa percentage of total expenditures by boomers aged 45–54 today and the cohortahead of them (aged 55–64). In other words, the survey shows what the older cohortspent when they were in their 50s and what it is spending today now that they are intheir 60s, versus what the 45–54 age group is spending now. So, for example,31.7% of boomers’ spending today is on housing, which is already 2.3 percentagepoints higher than the 29.5% level of the older cohort when they were in their 50s.Spending by the older cohort on housing increased further as they moved from their50s (29.5%) to their 60s (31.2%). Note that we discuss additional key data pointsfrom the CES in detail in subsequent sections.
We believe the gapbetween aspirations and
reality is a key factordriving the behavior of
baby boomers.

The Next American Dream – April 22, 2004
25
Figure 24. Spending by Boomers and Older Cohort on Major Categories, 1992 and 2002
Boomers Older Cohort 2002 2012 1992 2002 Boomers vs. 45-54 55-64 45-54 55-64 Older Cohort
A B C D A-C
Housing 31.7% ? 29.5% 31.2% 2.3% Transportation 18.8% ? 18.0% 19.1% 0.8% Food 12.8% ? 14.0% 12.5% -1.2% Insurance and pensions 10.9% ? 11.4% 10.9% -0.5% Entertainment 5.3% ? 5.1% 5.2% 0.2% Health care 5.2% ? 4.4% 6.8% 0.8% Apparel 4.2% ? 6.0% 4.0% -1.8% Alimony, child support 3.2% ? 3.2% 3.4% 0.0% Education 2.5% ? 2.2% 1.3% 0.3% Personal care 1.2% ? 1.3% 1.3% -0.1% Alcoholic beverages 1.0% ? 0.8% 0.9% 0.2% Tobacco products 0.9% ? 1.0% 0.8% -0.2% Reading 0.3% ? 0.5% 0.4% -0.2% Source: CES
Of course, we are ultimately trying to predict the likely contents of column B — thatis, what the breakdown of spending by today’s 45- to 54-year-old boomers will be asthey age over the next decade. To that end, we have carefully scrutinized the CESdata, consulted with Yankelovich Partners, and interviewed key Smith Barneyindustry analysts. Our conclusions are discussed in subsequent sections.
Importantly, as we outlined above, it seems likely that stable demand by olderboomers will coincide with an extended period of low economic volatility (a.k.a.“The Great Moderation”). The challenge, then, for investors will be to identify thestocks and sectors that should benefit from strong demand by aging boomers andalso enjoy resilient pricing thanks to a favorable supply environment. Figure 1summarizes how various industries are positioned to benefit from these supply anddemand variables. Figure 25 lists companies that seem particularly well positioned.
It seems likely that stabledemand by older
boomers will coincidewith an extended period
of low economicvolatility.

The Next American Dream – April 22, 2004
26
Figure 25. Companies That Appear Well Positioned to Benefit from the Next American Dream
Healthy Allergan Pharmaceuticals (AGN) Estee Lauder (EL) Amgen (AMGN) Genentech (DNA) Anthem (ATH) NBTY (NTY) Applebee’s International (APPB) Procter & Gamble (PG) Avon Products (AVP) Robert Mondavi (MOND) BJ’s Wholesale Club (BJ) Ruby Tuesday (RI) Brown-Forman (BFA) UnitedHealth Group (UNH) Constellation Brands (STZ) Weight Watchers (WTW) Darden Restaurants (DRI) WellPoint Health Networks (WLP) Endo Pharmaceuticals (ENDP)
Wealthy Charles Schwab (SCH) Merrill Lynch (MER) Hartford Financial (HIG) Prudential Financial (PRU) Lincoln National (LNC) T. Rowe Price (TROW)
Active Carnival Corp (CCL) Mandalay Resort Group (MBG) Coach (COH) Masco Corporation (MAS) Fairmont Hotels (FHR) Neiman Marcus (NMGA) Four Seasons Hotels (FS) PETCO Animal Supplies (PETC) GTECH Holdings (GTK) Petsmart (PETM) Harman International (HAR) Pulte Corp (PHM) Home Depot (HD) Royal Caribbean Cruises (RCL) International Game Technology (IGT) Starwood Hotels (HOT) Lowe’s (LOW) Toll Brothers (TOL) Magna International (MGA) Williams-Sonoma (WSM) Source: Smith Barney

The Next American Dream – April 22, 2004
27
Having Your Cake (and French Fries and Chips) and Eating It, Too Boomers may be living (see Figure 26) and working longer, but they are not stayinghealthier. Most notably, during the past 20 years, there has been a dramatic increasein obesity in the United States. (Obesity is defined as having a very high amount ofbody fat in relation to lean body mass.)
Figure 26. American Life Expectancy in Years, 1900–2005E
35
45
55
65
75
85
1900 1915 1930 1945 1960 1975 1990 2005E
Source: Statistical Abstract
In 2002, 18 states had obesity prevalence rates of 15%–19%; 28 states had ratesgreater than or equal to 20%; and three states — Alabama, Mississippi, and WestVirginia — reported a rate over 25% (see Figure 27). The most obese segment ofthe population in 2001 was people aged 50–59, with more than one in four boomersin this category being overweight (see Figure 28). (Note also that the averagewoman wore a size 8 in 1990 and wears a size 14 today, which is equivalent to size18 in 1990 terms.)
Healthy
During the past 20 years,there has been a
dramatic increase inobesity in the United
States.
More than one in fourboomers aged 50–59 are
overweight.

The Next American Dream – April 22, 2004
28
Figure 27. Obesity* Trends Among U.S. Adults in 2002
* About 30 lbs overweight for a 5’ 4” person.
Source: Centers for Disease Control
Figure 28. Obesity by Age Group in 2001
0%
5%
10%
15%
20%
25%
30%
18–29 30–39 40–49 50–59 60–69 >70
Source: Centers for Disease Control
Although Americans have always been interested in health issues, boomers todayare much more concerned about their health than the cohort ahead of them was backin 1994 when they were in their 50s:
➤ The percentage of people aged 45–54 who were “concerned about trying to stayin shape” was 37% in 1994 but 60% in 2003.
➤ The percentage of people aged 45–54 who were “concerned about trying to takecare of myself” was 40% in 1994 but 57% in 2003.
Boomers today are muchmore concerned about
their health than thecohort ahead of them
was in 1994 when theywere in their 50s.

The Next American Dream – April 22, 2004
29
However, at the same time, boomers effectively admit that they are living anunhealthy lifestyle:
➤ While a large percentage of boomers say that they “care about” various health-related activities, in each case, a much smaller percentage say that they are“currently doing” something about those activities (see Figure 29).
Figure 29. Health-Related Activities That Boomers “Care About” vs. “Currently Doing”
6 8 %
5 2 %
4 5 % 4 4 %3 9 %
4 7 %
3 7 %3 2 % 3 3 % 3 2 %
0 %
2 0 %
4 0 %
6 0 %
8 0 %
1 0 0 %
H e a l t h y w e ig h t E x e r c is i n g R e d u c in g f a t i n d ie t W a t c h in gc h o le s t e r o l
A lc o h o l m o d e r a t i o n
C a r e A b o u t
C u r r e n t ly d o in g
Source: Yankelovich Partners, Inc.
➤ Boomers do not overwhelmingly blame the obesity epidemic on the food andbeverage industry. When asked whether “the food and beverage industry shouldtake more responsibility for the obesity problems in America,” 46% of boomersagreed, while 53% disagreed. It seems that boomers realize that they have onlythemselves to blame for their own obesity — seven in ten (71%) agree that“food is an important sense of pleasure in my life.”
➤ Only two in five boomers (39%) say they “avoid buying foods that are notnutritious or good for me even if I like them.”
➤ Only one in ten boomers (12%) say they have attained their goal of “adopting ahealthy lifestyle.”
So many boomers find themselves in the paradoxical situation of living an unhealthylifestyle and taking a handful of drugs to remain active (see Figure 30).
Figure 30. Spending on Drugs as a Percentage of Total Expenditures by Age
0 %
1 %
2 %
A g e 4 0 A g e 5 0 A g e 6 0
T o d a y 's 6 0 y r o ld sB o o m e rs
Source: CES
Boomers say that they“care about” various
health-related activities,but a smaller percentage
say that they are“currently doing”
something.
Boomers do notoverwhelmingly blame
the obesity epidemic onthe food and beverage
industry.

The Next American Dream – April 22, 2004
30
Drug consumption has also been spurred by the fact that drugs are:
➤ Cheap. Many employers offer health care programs with prescription drugplans, under which participants pay a low ($15–$20) co-payment for a 30-daysupply of pills. Indeed, 94% of boomers who have health insurance participatein a plan that includes prescription drug coverage.
➤ Convenient. Many doctors in managed care systems are under pressure to see asmany patients as possible, and prescribing a drug is often the quickest way totreat a patient. Forty percent of boomers say that “my doctor or health careprovider does not spend enough time with me.”
➤ Cost effective. With heavy emphasis today on managing health care costs, inmany instances drugs are the most cost-effective treatment for patients. Forexample, taking a painkiller is much less expensive than back surgery.
However, the growth in consumption of drugs (as well as other medical productsand services) may be about to slow sharply, in large part as employers seek tofurther push rising health care costs onto employees. With health care accountingfor just 5% of boomers’ expenditures (see Figure 24), many employers believe thereis still plenty of room for households to pay more for medical coverage.
Figure 31. Employer and Employee Contribution to Monthly Health Insurance Premium*, 1983–2003
1 0 %
1 6 % 1 7 %1 9 %
9 0 %
8 4 % 8 3 %8 1 %
0 %
2 0 %
4 0 %
6 0 %
8 0 %
1 0 0 %
1 9 8 3 1 9 9 7 2 0 0 2 2 0 0 3
E m p lo y e e C o n t r ib u t io n
E m p lo y e r C o n t r ib u t io n
* Based on single coverage.
Source: BLS, Hewitt Associates, Towers Perrin, and Smith Barney
The catalyst for employees paying more could well be the “Medicare PrescriptionDrug, Improvement, and Modernization Act” of 2003, which goes beyond assistingseniors with prescription drugs, and contains many other provisions that have wide-ranging implications for the entire health care industry. Note that implementation ofmost of the law does not happen until 2006 or later, and many of the requisite detailsare not yet final because rules will not be written for another year or two. One keyprovision of the Act, the establishment of Health Savings Accounts (HSAs), hasnothing to do with Medicare, and will likely have profound implications for healthcare consumption.
With health careaccounting for just 5% of
boomers’ expenditures,many employers believe
households are able topay more for medical
coverage.
HSAs will likely haveprofound implications on
health careconsumption.

The Next American Dream – April 22, 2004
31
In effect, an HSA is to health care what a 401(k) is to retirement savings:
➤ An HSA is a tax-efficient way for individuals to save money for health care-related expenses.
➤ It would be packaged with high deductible/catastrophic health insurancecoverage.
➤ It would be a much less expensive option than buying a typical health insurancepolicy today. For example, instead of paying $5,000 per year for healthinsurance, an employee might pay $2,000 per year for catastrophic coverage, put$2,250 tax-free in an HSA, and pocket the $750 difference.
While the introduction of HSAs will likely be negative for the health insuranceindustry’s profitability, in the long run (given that it is a low-revenue product), itshould be very profitable to the first movers that have both the scale and thetechnology to grab share in a rapidly expanding market. Likely beneficiaries wouldinclude Anthem, UnitedHealth Group, and WellPoint Health Networks.
For employees, however, HSAs raise a number of key issues:
➤ In an environment of rapidly rising health care costs, HSAs give employers adoor to discontinue health care as an employee benefit. In other words, manyemployees could be “forced” into HSAs.
➤ Based on employee behavior with respect to 401(k) contributions andwithdrawals during the recent economic downturn, there are grounds forconcern that employees would not put nearly as much money into their ownhealth insurance as employers put in for them.
➤ Spending on prescription drugs and other non-urgent care would likely dropsignificantly under HSAs because patients would see the money coming directlyout of their own pockets (see Figure 32).
Figure 32. Health Expenditures by Public, Private, and Out-of-Pocket Payors, 1965–2008E
Selected years
0%
20%
40%
60%
80%
100%
1965 1975 1988 1995 2001 2002 2004E 2006E 2008E
Private O ut-of-Pocket P rivate Insurance Private O ther Public Tota l
Source: Centers for Medicare and Medicaid Services, Office of the Actuary, National Health Statistics Group, and Smith Barney
HSAs should be veryprofitable to first moversthat have both the scale
and the technology tograb share in a rapidly
expanding market.

The Next American Dream – April 22, 2004
32
It seems likely that participation rates for health coverage could decline in anyswitch to a defined contribution from a defined benefit plan. Defined benefit plans,by definition, have nearly 100% participation rates since there is no cost to theemployee. Data from the Federal Reserve’s 2001 Survey of Consumer Finances(SCF) showed that about 26% of workers eligible to participate in a 401(k) planchose not to do so.5
Partly because of these factors, drug-spending growth is forecast to slow in 2004–10(see Figure 33).
Figure 33. Pharmacy Spending and Year-Over-Year Percentage Increases, 1988–2010E
$0
$50
$100
$150
$200
$250
88 89 90 91 92 93 94 95 96 97 98 99 00E 01E 02E 03E 04E 05E 06E 07E 08E 09E 10E
0%
5%
10%
15%
20%
25%
Year-over-year increase
$ Expenditures
Source: Centers for Medicare and Medicaid Services, Milliman USA, American Association of Health Plans, KPMG, and Smith Barney
A key issue, of course, is what consumers consider to be “non-urgent” health care.It is likely that consumers will be willing to pay for drugs that have an immediatelyperceptible effect (e.g., for sexual dysfunction), but not for drugs whose results arenot that apparent (e.g., for cholesterol). Other “lifestyle drugs” that employeeswould likely be willing to pay for include Botox, the wrinkle remover manufacturedby Allergan Pharmaceuticals (Not Rated).
Note that as Figure 34 illustrates, Botox injections were by far the most popularcosmetic procedure in 2003. Moreover, as Figure 35 illustrates, boomers in the 35–50 age group accounted for more than half (55%) of those injections, withAmericans aged 51–64 accounting for another 26%.
5 Suspending the Employer 401(k) Match, Alicia H. Munnell and Annika Sunden, Center for Retirement Research at Boston College.
Drug spending growth isforecast to slow in
2004–10.
It is likely thatconsumers are willing to
pay for drugs that havean immediately
perceptible effect.

The Next American Dream – April 22, 2004
33
Figure 34. National Totals for Cosmetic Procedures
In millions
0
1
2
3
Liposuction Eyelid Surgey Breast Augment Botox Injection Chemical Peel CollagenInjection
1997
20022003
Source: American Society for Aesthetic Plastic Surgery
Figure 35. Botox Injections by Age Group in 2003
0%14%
55%
26%
5%
<18 19-34 35-50 51-64 65+
Source: American Society for Aesthetic Plastic Surgery
Botox helps people look (and, hopefully, feel) younger. Of course, many personalcare products are marketed with the same promise. For example, Procter &Gamble’s Olay Regenerist skin care products claim to address the “seven stages ofaging” through a patented amino-peptide complex that helps to hydrate andcondition skin. Thanks to products such as Regenerist, beauty care is one of Procter& Gamble’s fastest-growing businesses on a global basis.
Other personal care companies are also focused on addressing the skin care needs ofbaby boomers. For example, Avon Products’ Anew skin care line boasts anassortment of products for anti-aging needs, including the newest Anew Clinicalproduct, which is specifically designed to fight aging lines and wrinkles. Inaddition, at the super-premium end, Estée Lauder offers its Perfectionist and Idealistproducts to help refine aging skin.
Beyond personal care, while Procter & Gamble’s pharmaceuticals business is stillrelatively small (representing less than 4% of company sales), it is also growingrapidly, thanks in large part to products that target middle-aged women, e.g.,Actonel for bone-density loss and Intrinsa, which is in Phase III testing to helpimprove postmenopausal libido.
Of course, alleviating pain is most patients’ top priority, and pain is being treatedmuch more aggressively than in the past, which is positive for EndoPharmaceuticals (Not Rated), a leader in pain management medications. Notsurprisingly, managing arthritis pain becomes more important with age (see Figure36).
Beauty care is one ofP&G’s fastest-growing
businesses on a globalbasis.
Alleviating pain is mostpatients’ top priority.

The Next American Dream – April 22, 2004
34
Figure 36. Health-Related Activities Americans Care About: Managing Arthritis Pain
Percentage agreeing by age group
0%
10%
20%
30%
40%
16-24 25-38 39-57 58+
Source: Yankelovich Partners, Inc.
In general, big pharmaceutical companies seem likely to be squeezed from bothsides — a weakening in demand and an increased supply of products. First, in termsof supply, re-imported drugs from overseas (mainly Canada and Mexico) will likelycontinue to seep into the U.S. market. In 2003, 5% of boomers said that they hadpurchased prescription medication outside the U.S. in order to save money. Second,competition from generic manufacturers is likely to become even more intense. Notonly are the generic manufacturers challenging a growing number of patents in courtbut, thanks in large part to technological advances overseas, their manufacturingprocesses are becoming increasingly sophisticated, which facilitates the replicationof complex medications.
While the large pharmaceutical companies seem threatened by a host of issues,selected generic manufacturers seem well positioned for the following reasons:
➤ Generic drugs, by definition, are relatively inexpensive, which appeals to cash-strapped consumers and budget-conscious corporations.
➤ Given the low prices of generics, re-importation is not an issue.
➤ In contrast to many seniors, a large number of whom remain suspicious ofgenerics in the wake of scandals during the 1990s, today’s boomers arecomfortable taking the generic version of a medication. Sixty-three percent ofboomers prefer generic prescription medication to brand-name prescriptionmedication, versus 58% of people in the “mature” 58-plus age group.
Generic drug manufacturers with large portfolios seem well positioned to benefitfrom these trends. Procter & Gamble also seems well positioned given itsexperience in managing the transition as drugs move from prescription to over thecounter (OTC). For example, in September 2003, the company introduced PrilosecOTC and is on target to generate roughly $400 million in retail sales in year one.
In general, bigpharmaceutical
companies seem likely tobe squeezed by a
weakening in demandand an increased supply
of products.
Given the low prices ofgenerics, re-importation
is not an issue.
Sixty-three percent ofboomers prefer genericprescription medication
to brand-nameprescription medication.

The Next American Dream – April 22, 2004
35
Selected biotech companies also seem well positioned to benefit from health carereform for three reasons. First, biotech companies are currently less susceptible tothe threat of generic competition. Although discussions are under way regarding thepotential for a streamlined regulatory process for biogenerics in the U.S. and Europe,it is likely that the complexities of manufacturing biologics will make it difficult toestablish bioequivalency guidelines that ensure the safety and efficacy ofbiogenerics compared to the branded biologics.
Second, recall that HSAs would be packaged with high deductible/catastrophichealth insurance coverage. The typical indications targeted by biotech companiesinvolve severe or advanced diseases that are more likely to be covered bycatastrophic health insurance coverage. Moreover, although biotech products aretypically very expensive, the fact that they are prescribed to a relatively smallnumber of patients who may also have a limited life span makes it less of an issuefor insurance companies to cover the cost.
Third, as part of the drug benefit in the Medicare Reform Bill, seniors will pay:
➤ A $35 premium per month;
➤ A $250 annual deductible;
➤ 25% of the costs between $250 and $2,250;
➤ 100% of the costs between $2,250 and $5,100; and
➤ 5% of all costs above $5,100.
In other words, the government will be covering 95% of the price of drugs that costmore than $5,100, which can easily be the annual cost of a single biotech drug.
Diseases that many boomers are susceptible to include:
➤ Cancer. Biotech company Genentech is at the forefront of a new generation ofcancer treatments involving targeted therapeutics and monoclonal antibodies.This approach allows for a more precise treatment that may result in improvedefficacy and safety compared to existing therapies, such as traditionalchemotherapies. The company recently launched a novel therapy called Avastinfor the treatment of colorectal cancer. Genentech has demonstrated the ability toprovide a significant survival benefit in patients receiving Avastin incombination with certain chemotherapy regimens as a first-line treatment formetastatic colorectal cancer.
➤ Arthritis. As we have noted, arthritis is an issue for aging boomers. Amgen’sEnbrel is used in the treatment of rheumatoid arthritis and psoriatic arthritis. Inthe opinion of Smith Barney biotech analyst Elise Wang, Enbrel has the mostcompelling efficacy, safety, and ease-of-use profile among the biologics forthese diseases, and offers a potentially safer and more efficacious treatment thancurrent therapies such as methotrexate and cyclosporine.
➤ Osteoporosis. Amgen currently has a drug called AMG 162 in Phase II trials forthe treatment of osteoporosis. In comparison to Merck’s Fosamax, this drugappears to have the potential to be more effective, with a highly convenient
Biotech companies areless susceptible to the
threat of genericcompetition.
The government willcover 95% of the price of
drugs that cost morethan $5,100.

The Next American Dream – April 22, 2004
36
dosing regimen consisting of an injection every six months compared to aweekly oral dose of Fosamax. Fosamax also has potential gastrointestinal sideeffects and restrictive dosing requirements.
Finally, note that, in addition to taking drugs, boomers are also taking vitamins; thepropensity to take vitamins increases with age (see Figure 37). In the U.S., NBTYsells roughly 1,000 vitamin, mineral, and supplement (VMS) products throughVitamin World, a retailer, and Nature’s Bounty, its VMS wholesale segment.
Figure 37. Health-Related Activities Americans Care About: Taking Vitamins
0%
20%
40%
60%
16-24 25-38 39-5 7 58+
Source: Yankelovich Partners, Inc
Eating Healthy The recent popularity of the Atkins diet shows that many Americans, includingboomers, are trying to “eat healthy.” Whether or not the Atkins fad continues (mostfads do not), eating patterns typically change as people age. For example, as Figure38 illustrates, the consumption of fish and seafood increases as people age (withtoday’s boomers spending more on fish than 50-year-olds did ten years ago). If thetrend toward higher seafood consumption were to continue, one beneficiary could beDarden Restaurants, the owner of the Red Lobster chain.
Figure 38. Spending on Fish and Seafood as a Percentage of Total Expenditures by Age
0.0%
0.1%
0.2%
0.3%
0.4%
Age 40 Age 50 Age 60
Today's 60 yr olds
Boom ers
Source: CES
The propensity to takevitamins increases with
age.
The consumption of fishand seafood increases
as people age.

The Next American Dream – April 22, 2004
37
Another key trend with regard to eating habits is that total spending on “food awayfrom home” by today’s boomers has been increasing in contrast to the pattern of thegeneration ahead of them, which steadily cut back spending on eating out (seeFigure 39). Given that “food away from home” includes fast-food restaurants,which older people are less likely to frequent (see Figure 40), and upscalerestaurants, which, in the past, many older people have been unable to afford, it isnot surprising that spending on eating out has typically trended down as people age.But with boomers today staying in the labor force longer, it is likely they can affordto eat out in casual and upscale restaurants, and also want to eat out to save time andadd some variety to their lives.
Low-Carb Trend: Bearish for Bread Spending on bread, which typically declines as people age, is relatively low today(see Figure 41), which again could suggest the influence of a high protein diet onboomers’ consumption. Should interest in the Atkins diet continue, the downwardtrend for bread would likely be further reinforced. (Note that, following a salesdecline, Interstate Bakeries Corp. [Not Rated] recently suspended its dividend,perhaps yet more evidence that diets such as Atkins and South Beach have led tolower consumption of foods high in carbohydrates, including bread, in the UnitedStates.)
Spending on “food awayfrom home” by today’s
boomers has beenincreasing.

The Next American Dream – April 22, 2004
38
Figure 39. Spending on Food Away from Home as a Percentage of Total Expenditures by Age
Source: CES
Figure 40. “I Eat Fast Food a Few Times a Week” (Percentage Agreeing by Age Group)
Source: Yankelovich Partners, Inc
Figure 41. Spending on Bread as a Percentage of Total Expenditures by Age
0 .0 %
0 .1 %
0 .2 %
0 .3 %
A g e 4 0 A g e 5 0 A g e 6 0
T o d a y 's 6 0 y r o ld s
B o o m e rs
Source: CES
0%
10%
20%
30%
40%
16-24 25-38 39-57 58+
0.0%
2.0%
4.0%
6.0%
8.0%
Age 40 Age 50 Age 60
Today's 60 yr oldsBoom ers

The Next American Dream – April 22, 2004
39
Even if boomers do not actually eat healthily, companies that pay special attention tocalories and cholesterol appear well positioned. Applebees (Not Rated) has begun tolist Weight Watchers’ “points” on its menus, and Ruby Tuesday (Not Rated) lists thecalorie content of servings on its menus.
In terms of where boomers buy their food and household products, BJ’s WholesaleClub uses its database of customers’ shopping habits to send customized direct mailto target groups, including boomers. For example, recognizing that many boomersare empty nesters, BJ’s may emphasize in a mailing the value proposition of itsproducts. More specifically, BJ’s “Life Size” packaging is more moderately sizedrelative to that of other warehouse clubs, but offers a better value than is found insupermarkets.
As for what they drink, as people age, they consume fewer soft drinks (see Figure42) and more alcoholic beverages (see Figure 43). Here, too, it is the case that thechange in consumption patterns of boomers is much more dramatic than that of thecohort ahead of them — boomers are drinking much less soda and much morealcohol. One possible reason for this is heightened stress levels — the propensity toconsume alcohol as a way to relieve stress increases with age (see Figure 44).
Restaurants that payspecial attention to
calories and cholesterolappear well positioned.
As people age, theyconsume fewer soft
drinks and morealcoholic beverages.

The Next American Dream – April 22, 2004
40
Figure 42. Spending on Nonalcoholic Beverages as a Percentage of Total Expenditures by Age
0.0%
0.5%
1.0%
1.5%
A ge 4 0 A ge 5 0 A ge 60
Today's 60 yr o lds
Boom ers
Source: CES
Figure 43. Spending on Alcoholic Beverages as a Percentage of Total Expenditures by Age
0.0%
0.5%
1.0%
1.5%
Age 40 Age 50 Age 60
Today's 60 yr olds
Boom ers
Source: CES
Figure 44. Having a Drink as a Way of Relieving Stress (Percentage Agreeing by Age Group)
0%
20%
40%
16-24 25-38 39-57 58+
Source: Yankelovich Partners, Inc.

The Next American Dream – April 22, 2004
41
In terms of alcohol consumption, as one might expect, boomers are drinking morewine and liquor (see Figure 45) than beer (see Figure 46). Likely beneficiaries ofthis trend include spirits manufacturer Brown-Forman (Not Rated), wine and spiritsmanufacturer Constellation Brands, and wine producer Robert Mondavi (NotRated).
Of course, it is widely known that smoking is unhealthy. As Figure 47 illustrates,like the cohort ahead of them, boomers in their 50s are spending just about as muchon tobacco products as they did in their 40s. This spending typically declines aspeople enter their 60s.
Boomers are drinkingwine and liquor rather
than beer.
The typical pattern is forspending on tobacco todecline as people enter
their 60s.

The Next American Dream – April 22, 2004
42
Figure 45. Spending on Wine and Liquor as a Percentage of Total Expenditures by Age
0 .0 %
0 .1 %
0 .2 %
0 .3 %
0 .4 %
0 .5 %
0 .6 %
0 .7 %
A g e 4 0 A g e 5 0 A g e 6 0
T od a y 's 6 0 y r o ld s
B oo m ers
Source: CES
Figure 46. Spending on Beer as a Percentage of Total Expenditures by Age
0 .0%
0.1%
0.2%
0.3%
0.4%
0.5%
0.6%
0.7%
Age 40 Age 50 Age 60
Today's 60 yr olds
Boom ers
Source: CES
Figure 47. Spending on Tobacco as a Percentage of Total Expenditures by Age
0.0%
0.2%
0.4%
0.6%
0.8%
1.0%
1.2%
Age 40 Age 50 Age 60
Today's 60 yr olds
B oom ers
Source: CES

The Next American Dream – April 22, 2004
43
Have Money, Need Advice Because the Consumer Expenditure Survey (CES) collects data on income as well asexpenditures, we can compute a savings rate for all consumers and specific agegroups if we define the savings rate as:
Income after taxes less Average annual expendituresIncome after taxes
While the CES states that it has confidence in the consumption data, itacknowledges a problem with “the underreporting of income by respondents, aproblem common to most household surveys.” According to the CES, this problemapplies primarily to lower income groups. But the usefulness of the CES data is thatit allows us to compute a savings rate for specific age groups.
As Figure 48 illustrates, in 2002, the baby boomers (i.e., with a median age of 50)saved 20% of their after-tax income. This was double the savings rate of today’s 60-year-olds when they were in their 50s (i.e., ten years ago). Moreover, as this figureillustrates, savings rates tend to increase with age.
Figure 48. Savings Rate by Age Group
0%
5%
10%
15%
20%
25%
Age 40 Age 50 Age 60
Today's 60 yr oldsBoomers
NMF
Source: CES
Yankelovich data confirm this strong inclination to save. In 2003, 20% of boomerssaid that they were putting more money into their savings accounts than they were in1999, while 40% said they were saving the same amount. Only 17% felt that “I amsaving enough money to cover all of my future needs.”
Even if boomers do not continue to save one-fifth of their after-tax income, theirsavings rate is still likely to be relatively high, given continued growth in realincomes driven by a rising participation rate and strong productivity gains. Sowhere will that money go?
Wealthy
Baby boomers saveddouble the savings rateof today’s 60-year-oldswhen they were in their
50s.

The Next American Dream – April 22, 2004
44
Lately, banks have been the recipients of huge amounts of cash. In the 1990s, bankdeposits grew at a 6% annual rate, but since the equity market downturn began in2000, bank deposits have grown at a 10% rate. A key reason for this has been thenarrowing of the spread between money market yields and the interest rate paid onbank deposits. As this spread narrowed, many investors — also jolted by volatilityin the equity markets — moved some of their financial assets to the relative stabilityof an FDIC-insured bank account.
Reflecting the improved performance of equity markets of late, that flow has likelybegun to reverse (see Figure 49). Indeed, Smith Barney banks and brokers & assetmanagers analyst Ruchi Madan’s September 2003 Affluent Investor Survey (orderno. US08L100) revealed that, while 24% of affluent investors said they hadreallocated funds from investments to their bank accounts, two-thirds (66%) saidthat they planned to move the money back to their investment accounts once theinvestment outlook improves. The 2004 survey (which will be available in May)indicates that percentage has risen to 73%. These results strongly suggest that the“equity culture” that developed among U.S. investors in the 1990s was noteradicated by the market downturn of 2000–02.
Figure 49. Net New Cash Flow into Stock Mutual Funds, 2000–Present
$ billions
-$ 6 0
-$ 4 0
-$ 2 0
$ 0
$ 2 0
$ 4 0
$ 6 0
2 0 0 0 2 0 0 1 2 0 0 2 2 0 0 3 2 0 0 4
Source: StockVal
The Federal Reserve’s Survey of Consumer Finances quantifies the prevalence ofthis “equity culture,” particularly among baby boomers. Specifically, the percentageof all families that own equities, directly or indirectly, climbed to 21% in 2001 from17% in 1992. Moreover, in 2001, 22% of families in the 45–54 age cohort ownedequities. By comparison, in 1992 — when the boomers were about ten yearsyounger — 19% of families in the 35–44 bracket owned equities.
The resilience of the equity culture, as well as the anticipated flow back from bankdeposits to investment accounts, is clearly bullish for selected U.S. brokers.Importantly, despite the recent scandals on Wall Street and the resulting reforms, itseems likely that the traditional full-service brokerage model will survive for theforeseeable future. For a start, the aforementioned survey of affluent investorsrevealed that investors most frequently blamed corporate executives and themselvesfor stock market losses. Indeed, fully 87% of investors rated the strength of a
Seventy-three percentplan to move the moneyback to their investment
accounts once theinvestment outlook
improves.
Investors mostfrequently blamed
corporate executives andthemselves for stock
market losses.

The Next American Dream – April 22, 2004
45
research department as very or somewhat important when selecting a brokeragefirm. Cost is apparently not a factor either, with affluent investors actually payingtheir brokerage firms three to five times more than they realize and 77% of clientssaying that they would accept up to 5% higher fees from their brokerage firm. The2004 survey suggests that percentage has risen to 84%.
Not only does it seem likely that the traditional full-service brokerage model willsurvive, but there also appears to significant organic growth potential, particularly inthe advice marketplace. More than half of the high-net-worth investors surveyed in2003 did not have a professional financial adviser — even though 75% had abrokerage account — suggesting that many investors who have full-servicerelationships do not perceive their financial adviser as a provider of advice. Theimplication is that the brokerage industry may need to transform itself to more of anadvisory-based model.
Survey data confirm this desire by investors for more advice on financial planning.Sixty-seven percent of boomers say that “I like to plan my finances at least five toten years ahead,” but only 26% “always know which types of investments are rightfor me.” Indeed, just 27% of boomers describe themselves as “somewhatexperienced” investors.
Brokerage firms that seem well positioned include Merrill Lynch, whose financialadvisors are among the most productive (in terms of annual revenues), and CharlesSchwab (Not Rated), which routinely brings in more assets than any of its peers.
Merrill Lynch has been sharpening its focus in order to build a franchise in the high-net-worth segment — already more than 65% of its customer assets are frommillionaire households. In fact, Merrill’s retail business has the deepest penetrationin the high-net-worth investor segment, with a larger market share of high-net-worthassets (defined as $1 million or more investable assets) than any other full-servicebrokerage firm.
In order to provide more products, services, and advice to its more sophisticatedclient base, Merrill is pursuing the following initiatives with its financial advisers:
➤ Incentives. Advisers are driven by a compensation plan that rewards servicinghigh-net-worth clients and penalizes behavior that does not maximizeprofitability.
➤ Deepening Relationships. Merrill is pursuing a cross-sell strategy by offeringmany new products and services, such as deposits, insurance, trust services,credit cards, and mortgages.
➤ Training/Certifications. Merrill is requiring every new trainee to graduate fromits training program by earning the Certified Financial Planner (CFP)designation. Furthermore, Merrill is also aggressively hiring newly mintedMBAs, which is uncharacteristic for the retail brokerage industry butcommonplace for wealth management firms.
The brokerage industrymay need to transform
itself to more of anadvisory-based model.
Already more than 65%of Merrill’s customer
assets are frommillionaire households.

The Next American Dream – April 22, 2004
46
Another firm that appears well positioned is Charles Schwab, which has beensuccessfully targeting the “younger affluent,” including the youngest boomerscurrently in their 40s. Historically, Schwab derived much of its growth from themore self-directed customers of the large full-service brokerage firms who wanted totrade with “play money” at lower commission rates. However, as the company haspushed to compete for higher-net-worth customers, it has been expanding into amore full-service offering.
As a result, Schwab today has four main sources of earnings:
1 Retail brokerage, which generates about 55%–60% of earnings.
2 Support services to independent investment advisors, which account for 30%–35% of profits.
3 U.S. Trust (serving ultra high net worth clients), which generates about 10%–15% of earnings.
4 OTC market-making, which accounts for less than 5% of profits.
Schwab’s strategy appears to be working, with the firm routinely bringing in moreassets than any of its peers. And while Schwab’s account growth has been negativerecently, this reflects the fact that the company has been purging unprofitablecustomers — 80% of accounts that were closed in 2003 had less than $50,000 inassets.
Among asset managers, T. Rowe Price (Not Rated) seems relatively well positioned.The firm is perceived as an advocate of the individual investor with its no-load, low-cost approach and solid investment performance. Survey data reveal that boomersare conservative investors, with 71% saying that “when I invest my money, I alwayslook for safe investments, even if it means getting a lower return on my money.”
Looking for Safe Investments — A “Killer App”? As we noted previously, boomers are conservative investors, with seven in tensaying that they “always look for safe investments.” A key factor likely driving thisconservatism is uncertainty about the future, as manifested by:
➤ Yankelovich MONITOR data reveal that 70% of boomers say that, during theirretirement years, they “expect to have to be more careful about how to save andspend money.”
➤ For a married couple aged 55, there is a 45% probability of at least one of thetwo living to age 95, and a 24% probability that at least one of the two will liveto age 100. So, with the longevity rate rising steadily, boomers face the risingrisk of “living too long” rather than “dying too soon.”
➤ There has been significant volatility in financial markets in recent years, withthe Nasdaq in 2000 being as volatile as the Dow Jones Industrial Average(DJIA) in 1929 (see Figure 50).
Seventy-one percent say“when I invest my
money, I always look forsafe investments, even ifit means getting a lower
return on my money.”

The Next American Dream – April 22, 2004
47
Figure 50. Market Daily Price Volatility, 1925–Present
Absolute value; 200-day moving average
0.0
0.5
1.0
1.5
2.0
2.5
3.0
1925 1930 1935 1940 1945 1950 1955 1960 1965 1970 1975 1980 1985 1990 1995 2000 2005
SP 500NASDAQDJIA
Percent
Source: Reuters
In such an environment, investors are very concerned about safety of capital. Theproblem is that, given the current very low interest rate environment, a traditionalannuity product generates paltry returns. For example, the purchase of a $500,000annuity today would produce just $30,000 in annual income.
Fortuitously, Hartford Financial may have stumbled upon a “killer app” for thefinancial needs of today’s boomers: a Guaranteed Minimum Withdrawal Benefit(GMWB). At a cost of 50 basis points, this product offers the opportunity to investin a range of financial assets including equities, and guarantees the return of the fullamount of principal, provided that the initial principal amount is not withdrawn at arate faster than 7% per year, which means that all the invested funds can be retrievedafter 14 years of withdrawals.
GMWBs offer the following advantages:
➤ All the upside of equities;
➤ Safety of principal; and
➤ Full liquidity (that is, an investor can withdraw the net amount of funds at anytime he or she chooses to withdraw).
Not surprisingly, demand for GMWBs has been explosive; Hartford’s variableannuity sales rose to $15 billion in 2003 from $10 billion in 2002. In addition toHartford, only a handful of firms have both the capital and the ratings to be able tooffer such a product. We believe the key issue in this regard is how the insurancecompany hedges the potential risks involved. And for the purchaser of a GMWB, itis not truly riskless, in that it is dependent upon the ongoing financial strength of theissuer.
In a stress-testing scenario, Hartford Financial estimated that a $10 billion block ofnew business with GMWB benefits issued back in first quarter 1995, if unhedged,would have caused its GAAP earnings to swing to a loss of almost $300 million
Hartford Financial mayhave stumbled upon a
“killer app” for thefinancial needs of
today’s boomers: aGMWB.

The Next American Dream – April 22, 2004
48
from a profit of almost $300 million just in the space of 12 months. Hedging is alsocritical because, given the nature of the product, the more the equity markets godown, the greater the propensity to utilize the guarantee provided by the GMWB(and vice versa) is.
While demand for GMWBs has been strong, it is likely to get even stronger oncethis product is introduced into the 401(k) market. Bear in mind that the value of theaverage variable annuity purchase is $50,000, while Smith Barney life insuranceanalyst Colin Devine estimates that the value of the average 401(k) rollover is atleast ten times that amount.
Along with Hartford, other beneficiaries of the surge in demand for GMWBs includeLincoln National (which, after launching its GMWB at the end of second quarter2003 experienced a large jump in sales) and Prudential Financial.
Finally, note that while boomers’ demand for products such as GMWBs is rising, thedemand for traditional mortality protection life insurance products has beenrelatively stable. This reflects the fact that, as noted above, boomers are livinglonger, as well as the fact that their kids are largely grown up and are no longerfinancially dependent on their parents. (The one exception to this is the continueduse of life insurance by affluent boomers for estate-planning purposes.)
The demand fortraditional mortality
protection life insuranceproducts is not growing.

The Next American Dream – April 22, 2004
49
We noted previously that boomers are staying in the labor force longer and workingpast retirement age. However, three in five boomers (62%) consider it important tohave “a successful balance between work and personal life.” So, on the one hand,boomers have always been work centered and should remain so. But on the otherhand, it is not just about work. In fact, more than half of boomers (54%) value“being able to take a day off when you want to.”
The active lifestyle of boomers creates a range of opportunities for companies in avariety of industries. Working boomers want to live within a reasonable commutingdistance to their place of employment. This is contributing to heavy spending byboomers on housing (including home improvement) and vehicles (particularly top-of-the-range models). And when they relax, time-starved boomers want to stay atupscale hotels that offer adult-oriented attractions, e.g., gambling.
The Active, Working Boomer As Figure 24 illustrates, the two categories that boomers spend the most on today arehousing and transportation. Not only are boomers spending more on thesecategories than people in the cohort ahead did when they were in their 50s but, basedon the historical pattern, the amount of spending devoted to housing andtransportation should increase as boomers move from their 50s into their 60s (seeFigure 51 and Figure 52).
Figure 51. Spending on Housing
As a percentage of total expenditures
15%
19%
23%
27%
31%
35%
Age 40 Age 50 Age 60
Today's 60 yr olds
Boomers
Source: CES
Figure 52. Spending on Transportation
As a percentage of total expenditures
15%
19%
23%
27%
31%
35%
Age 40 Age 50 Age 60
Today's 60 yr oldsBoomers
Source: CES
Active
Boomers have alwaysbeen work centered and
should remain so.
Spending devoted tohousing and
transportation shouldincrease as boomers
move from their 50s intotheir 60s.

The Next American Dream – April 22, 2004
50
Housing As we discuss below, many sectors of the housing market are enjoying robustdemand driven, in large part, by heavy spending by boomers. Importantly, thesupply outlook is also very positive, thanks to two key factors:
1 Restricted Access to Capital. Beginning in the mid-1990s, tighter lendingstandards began to limit access to capital for small builders, the 93% of builderswho construct fewer than 25 homes per year. The reason for this was that, in1995, concerns the housing sector had reached a cyclical peak becamewidespread. The “proof” of this was 1) no upcycle had ever lasted longer thanfour years, and 1995 would represent an unprecedented fifth year of expansion;2) interest rates rose dramatically; and 3) levels of speculative inventory weregrowing. As a result, credit to finance small builders’ speculative buildingtightened sharply.
2 Land Constraints. While the credit situation has eased somewhat since 1995,land constraints have only intensified, and now represent a far more seriousimpediment to builders. Anti-sprawl sentiment has gained significant momentumin recent years and, concomitantly, the land approval process has lengthenedconsiderably. The result has been a scarcity of buildable lots for sale.
These factors work in favor of big builders, who:
➤ Are financed by the capital markets.
➤ Develop much of their own land.
➤ Have a track record of navigating the onerous and complex land developmentprocess.
➤ By virtue of their strong balance sheets and superior portfolio of successfulcommunities, receive “first looks” at lots that are made available by third partydevelopers.
➤ Currently control a roughly four-year land supply.
On the demand side, affluent boomers have plenty of money to spend on homes.Increasingly, those boomers are attracted to what Toll Brothers’ CEO, Robert Toll,has labeled “jewel boxes” — homes that, while modest in square footage, offer animpressive array of upscale amenities, including professional-grade kitchens,luxurious bathroom designs, as well as top-of-the line flooring and other furnishings.
In addition to buying “jewel boxes,” boomers are also attracted to housingcommunities oriented toward active adults. In that regard, following its 2001purchase of Dell Webb, Pulte Corp. is a developer of small gated communities closeto major metropolitan areas (see Figure 53). Building homes close to metro areas isa key strategy given that 1) active boomers plan on working well into theirretirement years, and 2) studies have shown that 90% of retirees do not move oncethey do retire.
Boomers are attracted to“jewel boxes.”
Building homes close tometro areas is a key
strategy.

The Next American Dream – April 22, 2004
51
Figure 53. Geographic Location of Pulte’s Communities in the U.S. and Puerto Rico
Source: Pulte Corp.
Many boomers will, however, choose to stay in their current houses and spend onhome improvement. Sixty-nine percent of boomers say that “I’m almost alwaysdoing little things to change or improve the look of my home.” Moreover, the meanamount that baby boomers planned to spend on home improvement in 2003 was$3,663, significantly more than any other age group (see Figure 54).
Figure 54. Mean Amount of Planned Spending on Home Improvement by Age Group in 2003
$0
$1,000
$2,000
$3,000
$4,000
16-24 25-38 39-57 58+
Source: Yankelovich Partners, Inc.
Boomers spendsignificantly more on
home improvement thanany other age group.

The Next American Dream – April 22, 2004
52
The relatively large sums that boomers are spending on home improvement likelyreflects three factors:
1 Refinancing. Very low interest rates have enabled owners to extract equity fromtheir homes, and then reinvest it back into the property in the form of repairs andupgrades.
2 Limited Supply. As discussed previously, the supply of land is constrained,which limits the property choices that are available.
3 High Prices. Reflecting the combination of limited supply and very low interestrates, home prices are high, which is restricting the ability of many boomers totrade up from their current residence.
Heavy spending on home improvement looks bullish for Masco Corporation, whichoffers an array of home furnishing brands, including Delta, HansGrohe Kraftmaid,Ginger, Behr paint, and Milgard windows. Each of these brands has a strongpresence in the home improvement market.
Heavy spending on home improvement is also bullish for Lowe’s and Home Depot.For example, through its “Up the Continuum” strategy, Lowe’s has beensuccessfully inducing upscale consumers to spend more on higher quality, higherprice point goods. The result has been a steady improvement in Lowe’s averageticket size (see Figure 55).
Figure 55. Average Ticket Size at Lowe’s, 2000–04E
$52
$54
$56
$58
$60
$62
2000 2001 2002 2003 2004E
Source: Lowe’s Companies
Similarly, through its EXPO concept store, Home Depot is targeting the upscalepopulation with income levels above $100,000 and net worth above $335,000through a higher-end, higher price point product offering.
Finally, an area that has great potential, if it can ever be organized effectively, is do-it-for-me (DIFM). DIFM (or in-home service business) is a $200 billion industry inwhich Lowe’s and Home Depot combined have less than a 5% market share. Theopportunity seems large based on survey results:
An area that has greatpotential is DIFM.
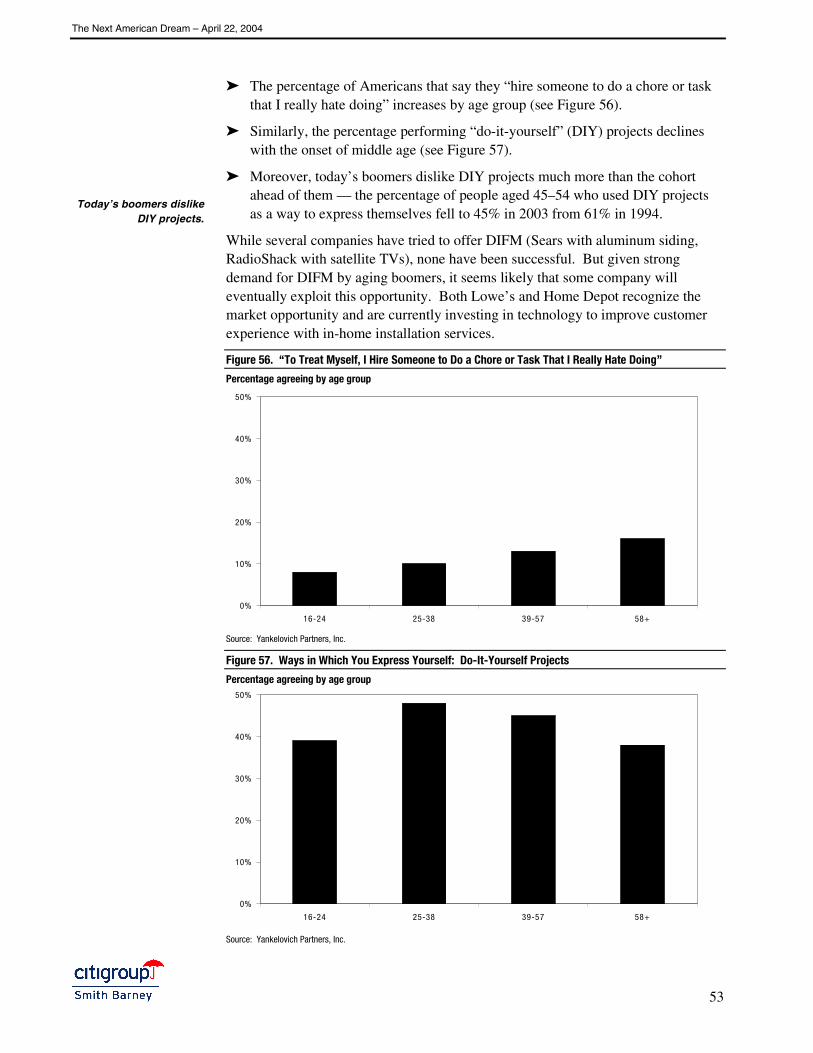
The Next American Dream – April 22, 2004
53
➤ The percentage of Americans that say they “hire someone to do a chore or taskthat I really hate doing” increases by age group (see Figure 56).
➤ Similarly, the percentage performing “do-it-yourself” (DIY) projects declineswith the onset of middle age (see Figure 57).
➤ Moreover, today’s boomers dislike DIY projects much more than the cohortahead of them — the percentage of people aged 45–54 who used DIY projectsas a way to express themselves fell to 45% in 2003 from 61% in 1994.
While several companies have tried to offer DIFM (Sears with aluminum siding,RadioShack with satellite TVs), none have been successful. But given strongdemand for DIFM by aging boomers, it seems likely that some company willeventually exploit this opportunity. Both Lowe’s and Home Depot recognize themarket opportunity and are currently investing in technology to improve customerexperience with in-home installation services.
Figure 56. “To Treat Myself, I Hire Someone to Do a Chore or Task That I Really Hate Doing”
Percentage agreeing by age group
0%
10%
20%
30%
40%
50%
16-24 25-38 39-57 58+
Source: Yankelovich Partners, Inc.
Figure 57. Ways in Which You Express Yourself: Do-It-Yourself Projects
Percentage agreeing by age group
0%
10%
20%
30%
40%
50%
16-24 25-38 39-57 58+
Source: Yankelovich Partners, Inc.
Today’s boomers dislikeDIY projects.

The Next American Dream – April 22, 2004
54
Autos Within the transportation category, spending on vehicle purchases is, notsurprisingly, the largest category. In that regard, boomers are spending more onautomobiles than people in the cohort ahead did when they were in their 50s, withthat spending likely to increase further as boomers move from their 50s into their60s (see Figure 58).
Figure 58. Spending on Vehicle Purchases as a Percentage of Total Expenditures by Age
0%
2%
4%
6%
8%
10%
Age 40 Age 50 Age 60
Today's 60 yr olds
B oom ers
Source: CES
Heavy spending by boomers on vehicle purchases is particularly bullish forcompanies that supply the auto interior market because boomers have the disposableincome to splurge on top-of-the-line vehicles crammed with “up-contenting”features such as heated and air-conditioned seats, as well as navigation systems andDVD players. Boomers turn over their cars relatively quickly, buying more newcars after the age 50 than before (see Figure 59), likely reflecting the fact that manyboomers seem to want to drive a vehicle with the latest safety and entertainmentfeatures.
Figure 59. Number of New Cars Purchased by Average American Household, Before and After Age 50
5
6
7
8
Before Age 50 After Age 50
Source: CNW Marketing Research Inc.
Boomers are spendingmore on automobiles.
Boomers turn over theircars relatively quickly.

The Next American Dream – April 22, 2004
55
Auto supply companies that seem well positioned to benefit from these trendsinclude Johnson Controls, Lear, and Magna International (all Not Rated). Thesesuppliers design, manufacture, and assemble integrated vehicle interior solutionsfocused on seating systems, cockpits, doors, overhead systems, and flooring. Eachenjoys a roughly 30% share of the U.S. automobile interior market. Interiorsuppliers are experiencing particularly rapid growth as automakers quicken the paceof outsourcing interior design and assembly to Tier I suppliers.
While the aforementioned suppliers typically assemble and integrate the latest “bellsand whistles” into the interior systems, the up-contenting features are typicallydesigned and manufactured by other suppliers. Long known for its high-endconsumer audio products sold through the retail channel, Harman International (NotRated) is now the technology leader in vehicle “infotainment” systems. Thecompany’s integrated infotainment systems bring together audio, video, climatecontrol, telematics, and other multimedia functions into one system with onedisplay, thus eliminating various redundant components such as controls, wiringharnesses, boxes, displays, circuits, and power supplies.
Finally, note that heavy spending by boomers on vehicle purchases does not seem tobe a positive for auto supply retailers. The key demographic for auto parts suppliersis low- to middle-income Americans who cannot afford to take their car to amechanic, and who try to repair it themselves. With boomers in their peak earningyears, it is not surprising that the percentage of people who list “working on the car”as a leisure activity falls with age (see Figure 60).
Figure 60. Activities Most Likely to Do for Fun and Enjoyment: Work on the Car
Percentage agreeing by age group
0%
4%
8%
12%
16%
16-24 25-38 39-57 58+
Source: Yankelovich Partners, Inc.
The percentage ofpeople who list “working
on the car” as a leisureactivity falls with age.

The Next American Dream – April 22, 2004
56
Retailing In contrast to housing and autos, the outlook for apparel is not very favorable. Notonly does spending on apparel typically decline as people age, but the amount thatboomers are spending on apparel today is much less than what the cohort ahead ofthem spent when they were in their 50s (see Figure 61).
Figure 61. Spending on Apparel as a Percentage of Total Expenditures
0 %
2 %
4 %
6 %
8 %
A g e 4 0 A g e 5 0 A g e 6 0
T o d a y 's 6 0 y r o ld sB o o m e rs
Source: CES
In addition, survey data reveal that:
➤ “Treating” oneself to new clothing declines steadily with age (see Figure 62).
Figure 62. Ways to Treat Yourself: Buy Yourself Some New Clothing (Percentage Agreeing by Age)
0%
10%
20%
30%
40%
50%
60%
16-24 25-38 39-57 58+
Source: Yankelovich Partners, Inc.
The outlook for apparelis not very favorable.

The Next American Dream – April 22, 2004
57
➤ Using clothes to express personal style also declines with age (Figure 63).
Figure 63. Ways in Which You Express Yourself: Wearing Clothes That Express Your Personal Style
Percentage agreeing by age
0%
10%
20%
30%
40%
50%
60%
16-24 25-38 39-57 58+
Source: Yankelovich Partners, Inc.
➤ Going shopping/going to a mall as a leisure activity declines steadily with age,but then picks up slightly as Americans move from boomers to the next cohort,“matures” (see Figure 64).
Figure 64. Leisure Activity Likely to Do for Fun: Go Shopping/Go to a Mall
Percentage agreeing by age group
0%
10%
20%
30%
40%
50%
60%
16-24 25-38 39-57 58+
Source: Yankelovich Partners, Inc.
A key reason why boomers today are spending less on apparel is that, with most oftheir material needs satisfied, boomers today place more value on experiences thanon tangibles. As Figure 22 illustrates, when boomers were asked what they viewedas signs of success and accomplishment, “designer clothes” and “expensive jewelry”were among the three bottom-ranked categories.

The Next American Dream – April 22, 2004
58
In this environment, retailers who cater to the desire for a “lifestyle experience”seem well positioned. Neiman Marcus offers its loyal and affluent customers adifferentiated offering of premier luxury brands in a “one-stop shop,” as well as anunparalleled level of customer service. Coach (Not Rated) and Williams-Sonoma(Not Rated) are other upscale retailers whose strong brand franchises have a lifestyleconnotation. By contrast, a company such as May Department Stores seems poorlypositioned given its “barbell” focus on the younger (i.e., young women and teens)and older customer segments (in its Lord & Taylor chain).
The Actively Relaxing Boomer While it may be oxymoronic, boomers are actively relaxing, preferring leisureactivities that are outdoors and engaging rather than indoors and passive. But, as wediscuss below, boomers are lazily active, and not exerting themselves too much:
➤ They are taking a walk, rather than watching a movie (see Figure 65).
Figure 65. Leisure Activity Likely to Do for Fun: “Take a Walk” vs. “Go to the Movies”
Source: Yankelovich Partners, Inc.
➤ They are working in the yard, rather than renting a video (Figure 66).
Figure 66. Leisure Activity Likely to Do for Fun: “Work in the Yard” vs.“Rent a Video”
Source: Yankelovich Partners, Inc.
In this environment,retailers who cater to the
desire for a “lifestyleexperience” seem well
positioned.
0%
20%
40%
60%
16-24 25-38 39-57 58+
W alkM ovies
0%
20%
40%
60%
16-24 25-38 39-57 58+
YardVideo

The Next American Dream – April 22, 2004
59
➤ They are going antiquing, rather than playing video/computer games (see Figure67).
Figure 67. Leisure Activity Likely to Do for Fun: “Go Antiquing” vs. “Play Video Games”
Percentage agreeing by age group
Source: Yankelovich Partners, Inc.
So “actively relaxing” boomers are, in fact, lazily active. They enjoy walking as aleisure activity, but not running — only 15% like to run when they exercise. Theyenjoy cruising (42% of boomers have taken a cruise in the past five years), but notswimming — only 11% like to swim when they exercise. And they like driving(38% of boomers like to go for a drive in their spare time), but not hiking — only11% go hiking.
Finally, note that, spending on reading material declines with age, with boomersspending much less reading than the cohort ahead of them (see Figure 68).
Figure 68. Spending on Reading as a Percentage of Total Expenditures by Age
Source: CES
Boomers are lazilyactive.
0.0%
0.2%
0.4%
0.6%
0.8%
Age 40 Age 50 Age 60
Today's 60 yr oldsBoom ers
0%
20%
40%
60%
16-24 25-38 39-57 58+
AntiquingVideo Gam es

The Next American Dream – April 22, 2004
60
Leisure and Travel Vacations are important to baby boomers. According to Yankelovich, boomersvalue “traveling for pleasure frequently” quite highly (see Figure 22). Notsurprisingly, the CES data show a strong upward trend in spending on vacation-related activities, including lodging on out-of-town trips, auto rental, and air fare(see Figure 69).
Figure 69. Spending on Leisure as a Percentage of Total Expenditures by Age
0 %
1 %
2 %
3 %
A g e 4 0 A g e 5 0 A g e 6 0
T o d a y 's 6 0 y r o ld s
B o o m e rs
Source: CES
Demand for high-end leisure and travel products has been surprisingly strong inrecent years, likely reflecting, in part, the large amounts of disposable income thatboomers have. In the hotel sector, the beneficiaries of this trend have been, and willlikely continue to be, non-commodity hotels offering a “lifestyle” experience. Inthis regard, hotels such as Fairmont (in Canada), Four Seasons, and Starwood (withits W and Westin chains) appear well positioned to offer time-starved boomers ahigh-quality, differentiated leisure experience. By contrast, Marriott and Hiltoncontinue to primarily offer more traditional commodity-like products orientedtoward business travelers.
Starwood is also trying to increase its exposure to the attractive Las Vegas market.In recent years, Las Vegas has gone from being a family destination back to beingan adult-oriented “city of sin,” which likely appeals to many child-free boomers. Itis also likely that, at the same time that boomers are frequenting an adult-oriented“city of sin” such as Las Vegas, they are spending less time in ride-oriented themeparks, such as those operated by Six Flags. Seventy-four percent of boomers totallydisagree with the statement “I like to engage in activities that most people think aredangerous,” compared to total agreement with this statement by 46% of those aged16–24.
Boomers value“traveling for pleasure
frequently.”
Demand for high-endleisure and travel
products has beensurprisingly strong in
recent years.
Las Vegas has, in recentyears, gone back to
being an adult-oriented“city of sin.”

The Next American Dream – April 22, 2004
61
Of course, a key attraction in Las Vegas is gambling. Spending on gambling hasincreased sharply in recent years, reflecting
➤ Increased ease of access,
➤ Technological advancements, and
➤ The implicit approval of state governments (which are desperate for revenues inthe face of exploding budget deficits).
Indeed, this increase is something of a self-perpetuating cycle for casino operatorsand gaming equipment manufacturers. Studies have shown that, once a person getsinvolved with the most simple form of gambling (e.g., a slot machine), he or sherapidly progresses to more sophisticated — and profitable — games (e.g., cardtables). One could argue that gambling is fast becoming the “new lipstick,” i.e., acheap way of treating oneself and escaping the lingering anxiety that weighs on theminds of today’s older baby boomers.
In addition to casino operators such as Mandalay Resort Group, gaming equipmentmanufacturers, including International Game Technology and GTECH Holdings,appear well positioned to benefit from continued growth in gambling. Theproliferation of places where gambling is permitted is increasing demand formachines, while technological advances (such as the “reverse engineering” of abingo game into a slot machine) are facilitating continuous product innovation.These factors, as well as ongoing state budget deficits, should fuel growth for yearsto come.
Cruising for Activity As is the case with high-end hotels, demand for cruise ship vacations has also beensurprisingly resilient. Carnival Corp. and Royal Caribbean Cruises are keybeneficiaries of this trend, as the two companies are effectively a duopoly in thecruising industry, controlling 85% of market share. Importantly, cruising satisfiesthe key desire of boomers for an experience that is stimulating and adventurous (yetsafe), with plenty of choices to personalize the experience. Royal Caribbean’s “getout there” advertising campaign emphasizes active (although not necessarilyathletic) options on its cruises e.g., Alaskan treks and ice skating. Thanks to this andother campaigns, the industry has shattered the image that cruise ships are just forthe “newly wed, nearly dead, and overfed,” and cater instead to the core activeboomer market.
Playful Pets and Antique Prints In terms of leisure activities done at home, active boomers are interested in pets andantiques, but not in playing video games, going online, or buying books.
While the typical customers of pet retailers have, historically, been families withchildren aged 8–14, “empty nester” baby boomers have lately been important driversof growth in this category (see Figure 70). In fact, more than one in four boomers(28%) say they receive “a great deal” of satisfaction from their pets. And reflectingtheir high levels of disposable income, these boomers have been spending heavily onhigh-end pet food and supplies, as well as on grooming services. Both PETCOAnimal Supplies and Petsmart (Not Rated) are beneficiaries of this trend.
Gambling is fastbecoming the “new
lipstick,” i.e., a cheapway of escaping anxiety.
Demand for cruise shipvacations has also been
surprisingly resilient.
Cruising satisfies the keydesire of boomers for an
experience that isstimulating and
adventurous — yet safe.
Boomers say theyreceive “a great deal” of
satisfaction from theirpets.

The Next American Dream – April 22, 2004
62
Figure 70. Spending on Pets as a Percentage of Total Expenditures by Age
0 .0 %
0 .2 %
0 .4 %
0 .6 %
0 .8 %
A g e 4 0 A g e 5 0 A g e 6 0
T o d a y 's 6 0 y r o ld sB o o m e rs
Source: CES
As we saw, boomers are also interested in antiquing (see Figure 67), but only as longas it satisfies their desire for a unique experience. As the May 1, 2003 issue ofAmerican Demographics points out, “while the World War II generationtransformed their frugal roots into a fondness for collectibles — plates, PreciousMoments dolls, Hummel figurines — boomers have shown little interest in suchdecorative items.”
In terms of the type of antiques that appeal do boomers, American Demographicshas observed that “the antiques (or clever reproductions thereof) business, firms thatmake customized cars or anything with a ‘one-of-a-kind’ appearance…should haveno trouble finding work. Makers of generic or low-quality, mass-produced goodsmay be in for a tough decade.” And while there are no companies currentlytargeting this market for “antiques (or clever reproductions thereof),” it seems that,like DIFM, this is an opportunity that will eventually be exploited.
Targeting the market forantiques (or clever
reproductions thereof) isan opportunity that will
eventually be exploited.

The Next American Dream – April 22, 2004
63
Companies mentioned in this report: Amgen Inc. (AMGN-$60.43; 1M), Anthem,Inc. (ATH-$88.39; 1M), Avon Products (AVP-$79.05; 3M), BJ's Wholesale Club(BJ-$25.20; 1H), Carnival Corp. (CCL-$44.57; 1M), Constellation Brands (STZ-$32.75; 1H), Darden Restaurants (DRI-$23.79; 2M), Estee Lauder Companies Inc.(EL-$44.00; 2M), Fairmont Hotels & Resorts (FHR-$26.20; 1M), Four SeasonsHotels Inc. (FS-$53.23; 3H), GTECH Holdings Corp. (GTK-$63.25; 1M),Genentech, Inc. (DNA-$112.00; 1H), Hartford Financial Services Group, Inc. (HIG-$64.52; 2H), Home Depot, Inc. (HD-$36.00; 1L), International Game Technology(IGT-$46.15; 1H), Lincoln National Corp. (LNC-$46.80; 1M), Lowe's Companies,Inc. (LOW-$52.86; 1M), Mandalay Resort Group (MBG-$61.20; 2H), Masco Corp.(MAS-$28.86; 2H), Merrill Lynch & Co. (MER-$58.25; 1M), NBTY (NTY-$34.78;2H), PETCO Animal Supplies, Inc. (PETC-$27.80; 1H), Procter & Gamble (PG-$106.02; 1L), Prudential Financial, Inc. (PRU-$44.04; 1M), Pulte Corp. (PHM-$47.95; 1H), Royal Caribbean Cruises, Ltd. (RCL-$45.29; 1H), Starwood Hotelsand Resorts (HOT-$41.32; 1M), The Neiman Marcus Group, Inc. (NMGA-$51.18;1H), Toll Brothers Inc. (TOL-$40.72; 1H), UnitedHealth Group (UNH-$65.06; 1M),Weight Watchers (WTW-$41.83; 2H), WellPoint Health Networks (WLP-$112.00;1M).

The Next American Dream – April 22, 2004
64
Figure 1. Industries Well Positioned and Poorly Positioned to Benefit from the Next American Dream.....5
Figure 2. U.S. Population Growth by Age Group over Three Ten-Year Periods, 1965–2015E ..................6
Figure 3. Ten-Year Rolling Standard Deviation of GDP Growth, 1957–Present........................................7
Figure 4. Behavior Is Shaped by Common Experiences...........................................................................9
Figure 5. Annualized Quarterly Real GDP Growth, 1950–2003 ..............................................................10
Figure 6. Real Per Capita Consumption Growth — Year-over-Year Percentage Change, 1950–2003....11
Figure 7. Unemployment Rate, 1950–Present........................................................................................12
Figure 8. Inflation — Year-over-Year Percentage Change in the CPI, 1950–Present .............................12
Figure 9. U.S. Labor Force Growth by Decade, 1950–1999 ...................................................................13
Figure 10. U.S. Nonfarm Productivity — Year-over-Year Quarterly Percentage Change, 1950–2003.....14
Figure 11. Real Disposable Income — Year-over-Year Percentage Change, 1950–2003 ......................14
Figure 12. Misery Index — Sum of Inflation and Unemployment Rates, 1950–Present...........................14
Figure 13. Nonfarm Inventories to Final Sales Ratio, 1950–Present.......................................................15
Figure 14. After-Tax Profits as a Percentage of Gross Domestic Income, 1950–2003............................16
Figure 15. Household Income Level by Age of Reference Person in 2002 .............................................17
Figure 16. Employment by Service Industries as a Percentage of Total Nonagricultural Employment ....18
Figure 17. Plans for Retirement Among Workers Who Are Still Employed..............................................20
Figure 18. Why Keep Working? Major Factors in the Decision to Work in Retirement ...........................20
Figure 19. Quarterly Labor Force Participation Rate of Men Aged 55–64, 1950–Present .......................21
Figure 20. Quarterly Labor Force Participation Rate of Men Aged 65 and Over, 1950–Present..............21
Figure 21. Median Net Worth by Age of Head of Family .........................................................................22
Figure 22. Signs of Success and Accomplishment as Perceived by Boomers ........................................23
Figure 23. Spending on Jewelry and Watches as a Percentage of Total Expenditures by Age ...............23
Figure 24. Spending by Boomers and Older Cohort on Major Categories, 1992 and 2002 .....................25
Figure 25. Companies That Appear Well Positioned to Benefit from the Next American Dream .............26
Figure 26. American Life Expectancy in Years, 1900–2005E .................................................................27
Figure 27. Obesity* Trends Among U.S. Adults in 2002 .........................................................................28
Figure 28. Obesity by Age Group in 2001...............................................................................................28
Figure 29. Health-Related Activities That Boomers “Care About” vs. “Currently Doing” ..........................29
Figure 30. Spending on Drugs as a Percentage of Total Expenditures by Age.......................................29
Figure 31. Employer and Employee Contribution to Monthly Health Insurance Premium*, 1983–2003...30
Figure 32. Health Expenditures by Public, Private, and Out-of-Pocket Payors, 1965–2008E..................31
Figure 33. Pharmacy Spending and Year-Over-Year Percentage Increases, 1988–2010E ....................32
Figure 34. National Totals for Cosmetic Procedures...............................................................................33
Figure 35. Botox Injections by Age Group in 2003..................................................................................33
Figure 36. Health-Related Activities Americans Care About: Managing Arthritis Pain............................34
Figure 37. Health-Related Activities Americans Care About: Taking Vitamins .......................................36
Figure 38. Spending on Fish and Seafood as a Percentage of Total Expenditures by Age.....................36
Figure 39. Spending on Food Away from Home as a Percentage of Total Expenditures by Age.............38
Figure 40. “I Eat Fast Food a Few Times a Week” (Percentage Agreeing by Age Group) ......................38
Figure 41. Spending on Bread as a Percentage of Total Expenditures by Age.......................................38
Figure 42. Spending on Nonalcoholic Beverages as a Percentage of Total Expenditures by Age ..........40
Figure 43. Spending on Alcoholic Beverages as a Percentage of Total Expenditures by Age.................40
Figure 44. Having a Drink as a Way of Relieving Stress (Percentage Agreeing by Age Group)..............40
Figure 45. Spending on Wine and Liquor as a Percentage of Total Expenditures by Age.......................42
Figure 46. Spending on Beer as a Percentage of Total Expenditures by Age.........................................42
Figure 47. Spending on Tobacco as a Percentage of Total Expenditures by Age...................................42
Figure 48. Savings Rate by Age Group ..................................................................................................43
Figure 49. Net New Cash Flow into Stock Mutual Funds, 2000–Present ................................................44
Figure 50. Market Daily Price Volatility, 1925–Present ...........................................................................47
Figure 51. Spending on Housing ............................................................................................................49
Figure 52. Spending on Transportation ..................................................................................................49
Table of Figures

The Next American Dream – April 22, 2004
65
Figure 53. Geographic Location of Pulte’s Communities in the U.S. and Puerto Rico.............................51
Figure 54. Mean Amount of Planned Spending on Home Improvement by Age Group in 2003 ..............51
Figure 55. Average Ticket Size at Lowe’s, 2000–04E.............................................................................52
Figure 56. “To Treat Myself, I Hire Someone to Do a Chore or Task That I Really Hate Doing” ..............53
Figure 57. Ways in Which You Express Yourself: Do-It-Yourself Projects .............................................53
Figure 58. Spending on Vehicle Purchases as a Percentage of Total Expenditures by Age ...................54
Figure 59. Number of New Cars Purchased by Average American Household, Before and After Age 5054
Figure 60. Activities Most Likely to Do for Fun and Enjoyment: Work on the Car...................................55
Figure 61. Spending on Apparel as a Percentage of Total Expenditures ................................................56
Figure 62. Ways to Treat Yourself: Buy Yourself Some New Clothing (Percentage Agreeing by Age) ...56
Figure 63. Ways in Which You Express Yourself: Wearing Clothes That Express Your Personal Style .57
Figure 64. Leisure Activity Likely to Do for Fun: Go Shopping/Go to a Mall ...........................................57
Figure 65. Leisure Activity Likely to Do for Fun: “Take a Walk” vs. “Go to the Movies”...........................58
Figure 66. Leisure Activity Likely to Do for Fun: “Work in the Yard” vs.“Rent a Video” ...........................58
Figure 67. Leisure Activity Likely to Do for Fun: “Go Antiquing” vs. “Play Video Games” .......................59
Figure 68. Spending on Reading as a Percentage of Total Expenditures by Age ...................................59
Figure 69. Spending on Leisure as a Percentage of Total Expenditures by Age.....................................60
Figure 70. Spending on Pets as a Percentage of Total Expenditures by Age .........................................62

The Next American Dream – April 22, 2004
66
Notes

The Next American Dream – April 22, 2004
67
ANALYST CERTIFICATION Appendix A-1Edward Kerschner and Michael Geraghty hereby certify that all of the views expressed in this research report accurately reflect ourpersonal views about any and all of the subject issuer(s) or securities. We also certify that no part of our compensation was, is, or will bedirectly or indirectly related to the specific recommendation(s) or view(s) in this report.
IMPORTANT DISCLOSURESAnalysts' compensation is determined based upon activities and services intended to benefit the investor clients of Citigroup GlobalMarkets Inc. and its affiliates ("the Firm"). Like all Firm employees, analysts receive compensation that is impacted by overall firmprofitability, which includes revenues from, among other business units, the Private Client Division, Institutional Equities, and InvestmentBanking.
Smith Barney Equity Research Ratings DistributionData current as of 31 March 2004 Buy Hold SellSmith Barney Global Equity Research Coverage (2326) 36% 45% 19%
% of companies in each rating category that are investment banking clients 48% 44% 34%Guide To Investment Ratings:Smith Barney's stock recommendations include a risk rating and an investment rating.Risk ratings, which take into account both price volatility and fundamental criteria, are: Low [L], Medium [M], High [H], and Speculative[S].Investment ratings are a function of Smith Barney's expectation of total return (forecast price appreciation and dividend yield within thenext 12 months) and risk rating.For securities in developed markets (US, UK, Europe, Japan, and Australia/New Zealand), investment ratings are: Buy [1] (expectedtotal return of 10% or more for Low-Risk stocks, 15% or more for Medium-Risk stocks, 20% or more for High-Risk stocks, and 35% ormore for Speculative stocks); Hold [2] (0%-10% for Low-Risk stocks, 0%-15% for Medium-Risk stocks, 0%-20% for High-Risk stocks,and 0%-35% for Speculative stocks); and Sell [3] (negative total return).For securities in emerging markets (Asia Pacific, Emerging Europe/Middle East/Africa, and Latin America), investment ratings are: Buy[1] (expected total return of 15% or more for Low-Risk stocks, 20% or more for Medium-Risk stocks, 30% or more for High-Risk stocks,and 40% or more for Speculative stocks); Hold [2] (5%-15% for Low-Risk stocks, 10%-20% for Medium-Risk stocks, 15%-30% forHigh-Risk stocks, and 20%-40% for Speculative stocks); and Sell [3] (5% or less for Low-Risk stocks, 10% or less for Medium-Riskstocks, 15% or less for High-Risk stocks, and 20% or less for Speculative stocks).Investment ratings are determined by the ranges described above at the time of initiation of coverage, a change in risk rating, or achange in target price. At other times, the expected total returns may fall outside of these ranges because of price movement and/orvolatility. Such interim deviations from specified ranges will be permitted but will become subject to review by Research Management.Your decision to buy or sell a security should be based upon your personal investment objectives and should be made only afterevaluating the stock's expected performance and risk.
Between September 9, 2002, and September 12, 2003, Smith Barney's stock ratings were based upon expected performance over thefollowing 12 to 18 months relative to the analyst's industry coverage universe at such time. An Outperform (1) rating indicated that weexpected the stock to outperform the analyst's industry coverage universe over the coming 12-18 months. An In-line (2) rating indicatedthat we expected the stock to perform approximately in line with the analyst's coverage universe. An Underperform (3) rating indicatedthat we expected the stock to underperform the analyst's coverage universe. In emerging markets, the same ratings classifications wereused, but the stocks were rated based upon expected performance relative to the primary market index in the region or country. Ourcomplementary Risk rating system -- Low (L), Medium (M), High (H), and Speculative (S) -- took into account predictability of financialresults and stock price volatility. Risk ratings for Asia Pacific were determined by a quantitative screen which classified stocks into thesame four risk categories. In the major markets, our Industry rating system -- Overweight, Marketweight, and Underweight -- took intoaccount each analyst's evaluation of their industry coverage as compared to the primary market index in their region over the following12 to 18 months.
Prior to September 9, 2002, the Firm's stock rating system was based upon the expected total return over the next 12 to 18 months. Thetotal return required for a given rating depended on the degree of risk in a stock (the higher the risk, the higher the required return). ABuy (1) rating indicated an expected total return ranging from +15% or greater for a Low-Risk stock to +30% or greater for a Speculativestock. An Outperform (2) rating indicated an expected total return ranging from +5% to +15% (Low-Risk) to +10% to +30% (Speculative).A Neutral (3) rating indicated an expected total return ranging from -5% to +5% (Low-Risk) to -10% to +10% (Speculative). AnUnderperform (4) rating indicated an expected total return ranging from -5% to -15% (Low-Risk) to -10% to -20% (Speculative). A Sell (5)rating indicated an expected total return ranging from -15% or worse (Low-Risk) to -20% or worse (Speculative). The Risk ratings werethe same as in the current system.
OTHER DISCLOSURESFor securities recommended in this report in which the Firm is not a market maker, the Firm usually provides bids and offers and may actas principal in connection with such transactions. The Firm is a regular issuer of traded financial instruments linked to securities that mayhave been recommended in this report. The Firm may, at any time, hold a trading position (long or short) in the shares of the subjectcompany(ies) discussed in this report. The Firm may engage in securities transactions in a manner inconsistent with this research reportand, with respect to securities covered by this report, will buy or sell from customers on a principal basis.
Securities recommended, offered, or sold by the Firm: (i) are not insured by the Federal Deposit Insurance Corporation; (ii) are notdeposits or other obligations of any insured depository institution (including Citibank); and (iii) are subject to investment risks, includingthe possible loss of the principal amount invested. Although information has been obtained from and is based upon sources SmithBarney believes to be reliable, we do not guarantee its accuracy and it may be incomplete or condensed. All opinions, projections andestimates constitute the judgment of the author as of the date of the report and are subject to change without notice. Prices andavailability of financial instruments also are subject to change without notice. If this is a fundamental research report, it is the intention of

The Next American Dream – April 22, 2004
68
Smith Barney to provide research coverage of this/these issuer(s), including in response to news affecting this issuer, subject toapplicable quiet periods and capacity constraints. This report is for informational purposes only and is not intended as an offer orsolicitation for the purchase or sale of a security. Any decision to purchase securities mentioned in this research must take into accountexisting public information on such security or any registered prospectus.
Investing in non-U.S. securities, including ADRs, may entail certain risks. The securities of non-U.S. issuers may not be registered with,nor be subject to the reporting requirements of the U.S. Securities and Exchange Commission. There may be limited informationavailable on foreign securities. Foreign companies are generally not subject to uniform audit and reporting standards, practices andrequirements comparable to those in the U.S. Securities of some foreign companies may be less liquid and their prices more volatilethan securities of comparable U.S. companies. In addition, exchange rate movements may have an adverse effect on the value of aninvestment in a foreign stock and its corresponding dividend payment for U.S. investors. Net dividends to ADR investors are estimated,using withholding tax rates conventions, deemed accurate, but investors are urged to consult their tax advisor for exact dividendcomputations. Investors who have received this report from the Firm may be prohibited in certain states or other jurisdictions frompurchasing securities mentioned in this report from the Firm. Please ask your Financial Consultant for additional details.
This report may have been distributed simultaneously, in multiple formats, to the Firm's worldwide institutional and retail customers. Ifthis report is being made available via the Smith Barney Private Client Group in the United Kingdom and Amsterdam, please note thatthis report is distributed in the UK by Citigroup Global Markets Ltd., a firm regulated by the Financial Services Authority (FSA) for theconduct of Investment Business in the UK. This document is not to be construed as providing investment services in any jurisdictionwhere the provision of such services would be illegal. Subject to the nature and contents of this document, the investments describedherein are subject to fluctuations in price and/or value and investors may get back less than originally invested. Certain high-volatilityinvestments can be subject to sudden and large falls in value that could equal or exceed the amount invested. Certain investmentscontained herein may have tax implications for private customers in the UK whereby levels and basis of taxation may be subject tochange. If in doubt, investors should seek advice from a tax adviser. This material may relate to investments or services of a personoutside of the UK or to other matters which are not regulated by the Financial Services Authority and further details as to where this maybe the case are available upon request in respect of this material. This report may not be distributed to private clients in Germany. If thispublication is being made available in certain provinces of Canada by Citigroup Global Markets (Canada) Inc. ("CGM Canada"), CGMCanada has approved this publication. If this report was prepared by Smith Barney and distributed in Japan by Nikko Citigroup Ltd., it isbeing so distributed under license. This report is made available in Australia to wholesale clients through Citigroup Global MarketsAustralia Pty Ltd. (ABN 64 003 114 832 and AFSL No. 240992) and to retail clients through Smith Barney Citigroup Australia Pty Ltd.(ABN 19 009 145 555 and AFSL No. 240813), Participants of the ASX Group. In New Zealand it is made available through CitigroupGlobal Markets New Zealand Ltd., a member firm of the New Zealand Stock Exchange. This report does not take into account theinvestment objectives, financial situation or particular needs of any particular person. Investors should obtain advice based on their ownindividual circumstances before making an investment decision. Citigroup Global Markets (Pty) Ltd. is incorporated in the Republic ofSouth Africa (company registration number 2000/025866/07) and its registered office is at Citibank Plaza, 145 West Street, Sandown,Sandton, Johannesburg 2196. The investments and services contained herein are not available to private customers in South Africa. Ifthis report is made available in Hong Kong by, or on behalf of, Citigroup Global Markets Asia Ltd., it is attributable to Citigroup GlobalMarkets Asia Ltd., Three Exchange Square, Hong Kong. If this report is made available in Hong Kong by The Citigroup Private Bank toits clients, it is attributable to Citibank N.A., Citibank Tower, Citibank Plaza, 3 Garden Road, Hong Kong. This publication is madeavailable in Singapore through Citigroup Global Markets Singapore Pte. Ltd., a Capital Markets Services Licence holder.
© 2004 Citigroup Global Markets Inc. Member SIPC. Smith Barney is a division and service mark of Citigroup Global Markets Inc. and itsaffiliates and is used and registered throughout the world. Citigroup and the Umbrella Device are trademarks and service marks ofCiticorp or its affiliates and are used and registered throughout the world. Nikko is a service mark of Nikko Cordial Corporation. All rightsreserved. Any unauthorized use, duplication, redistribution or disclosure is prohibited by law and will result in prosecution. The Firmaccepts no liability whatsoever for the actions of third parties. The Firm makes no representations or warranties whatsoever as to thedata and information provided in any third party referenced website and shall have no liability or responsibility arising out of, or inconnection with, any such referenced website.
ADDITIONAL INFORMATION IS AVAILABLE UPON REQUEST US04M025