the new york state · the new york state district report card is an important part of ... from the...
TRANSCRIPT
March 10, 2009 Page 1
District
This District’s Report Card
The New York State District Report Card is an important part of
the Board of Regents effort to raise learning standards for all students.
It provides information to the public on the district’s status and
the status of schools within the district under the State and federal
accountability systems, on student performance, and on other
measures of school and district performance. Knowledge gained
from the report card on a school district’s strengths and weaknesses
can be used to improve instruction and services to students.
State assessments are designed to help ensure that all
students reach high learning standards. They show whether
students are getting the knowledge and skills they need
to succeed at the elementary, middle, and commencement
levels and beyond. The State requires that students who are not
making appropriate progress toward the standards receive
academic intervention services.
Use this report to: 1 Get District
Profile information. This section shows comprehensive
data relevant to this district’s learning environment.
2 Review District Accountability Status.
This section indicates whether a district made adequate yearly progress (AYP) and identifies districts in need of improvement and subject to interventions under the federal No Child Left Behind Act as well as districts requiring academic progress and subject to interventions under Commissioner’s Regulations.
3 View School Accountability Status.
This section lists all schools in your district by 2008–09 accountability status.
4 Review an Overview of District Performance.
This section has information about the district’s performance on state assessments in English, mathematics, and science, and on high school graduation rate.
For more information:Office of Information and Reporting Services New York State Education Department Room 863 EBA Albany, NY 12234 Email: [email protected]
The New York State District Report CardAccountability and Overview Report 2007 – 08
BEDFORD CENTRAL SCHOOLDISTRICT
District ID 66-01-02-06-0000Superintendent JERE HOCHMANTelephone (914) 241-6010Grades PK-12, UE, US
March 10, 2009 Page 2
District Profile1
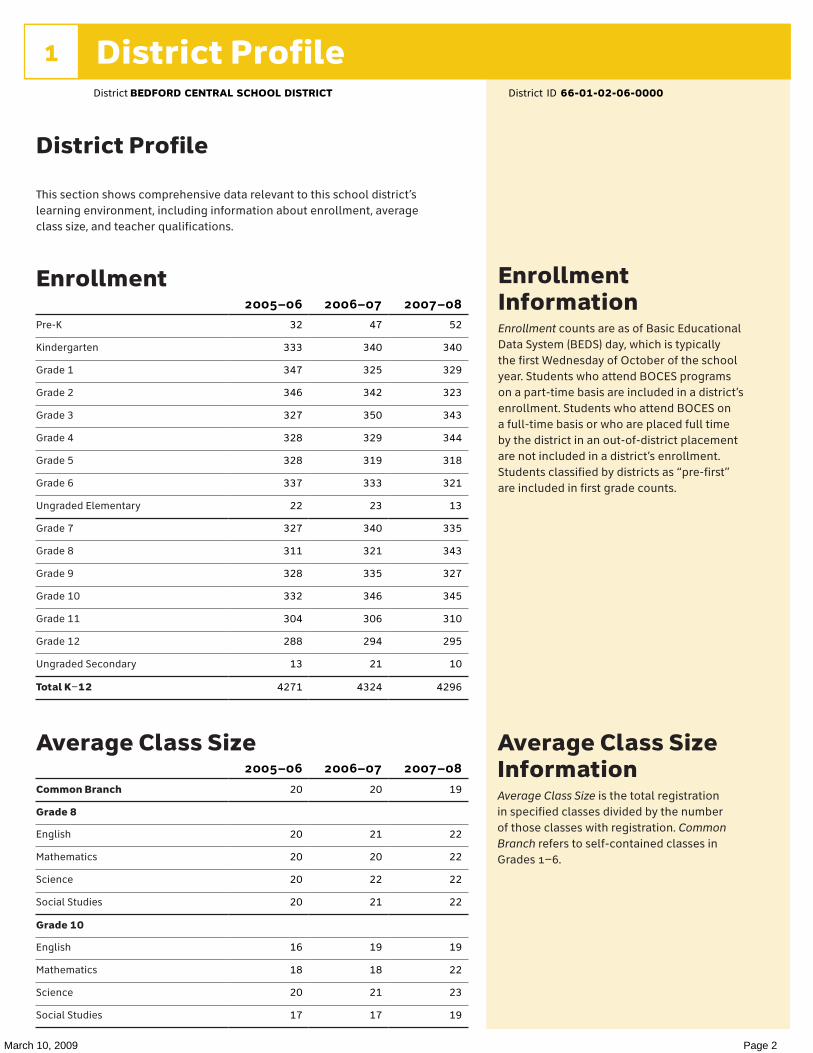
Average Class Size InformationAverage Class Size is the total registration in specified classes divided by the number of those classes with registration. Common Branch refers to self-contained classes in Grades 1–6.
Enrollment InformationEnrollment counts are as of Basic Educational Data System (BEDS) day, which is typically the first Wednesday of October of the school year. Students who attend BOCES programs on a part-time basis are included in a district’s enrollment. Students who attend BOCES on a full-time basis or who are placed full time by the district in an out-of-district placement are not included in a district’s enrollment. Students classified by districts as “pre-first” are included in first grade counts.
District Profile
This section shows comprehensive data relevant to this school district’s learning environment, including information about enrollment, average class size, and teacher qualifications.
Enrollment
Pre-K
Kindergarten
Grade 1
Grade 2
Grade 3
Grade 4
Grade 5
Grade 6
Ungraded Elementary
Grade 7
Grade 8
Grade 9
Grade 10
Grade 11
Grade 12
Ungraded Secondary
Total K–12
Average Class Size
Common Branch
Grade 8
English
Mathematics
Science
Social Studies
Grade 10
English
Mathematics
Science
Social Studies
District BEDFORD CENTRAL SCHOOL DISTRICT District ID 66-01-02-06-0000
2005–06 2006–07 2007–08
32
333
347
346
327
328
328
337
22
327
311
328
332
304
288
13
4271
47
340
325
342
350
329
319
333
23
340
321
335
346
306
294
21
4324
52
340
329
323
343
344
318
321
13
335
343
327
345
310
295
10
4296
2005–06 2006–07 2007–08
20
20
20
20
20
16
18
20
17
20
21
20
22
21
19
18
21
17
19
22
22
22
22
19
22
23
19
March 10, 2009 Page 3
District Profile1
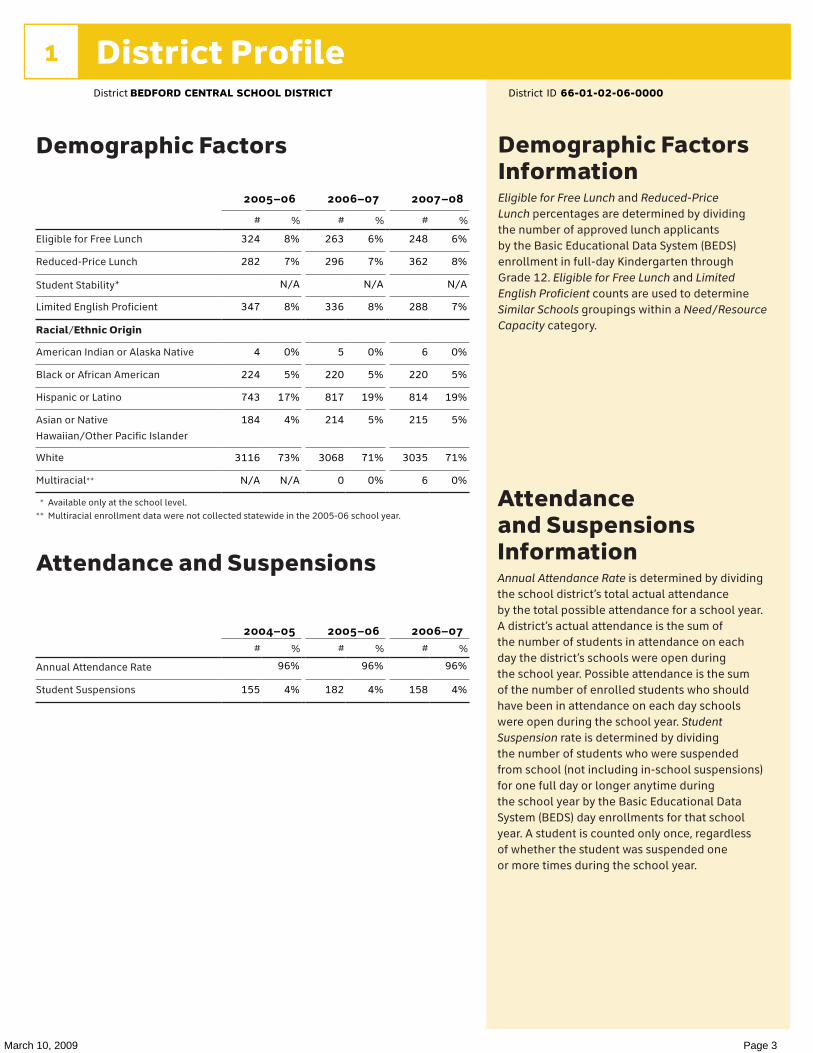
Attendance and Suspensions InformationAnnual Attendance Rate is determined by dividing the school district’s total actual attendance by the total possible attendance for a school year. A district’s actual attendance is the sum of the number of students in attendance on each day the district’s schools were open during the school year. Possible attendance is the sum of the number of enrolled students who should have been in attendance on each day schools were open during the school year. Student Suspension rate is determined by dividing the number of students who were suspended from school (not including in-school suspensions) for one full day or longer anytime during the school year by the Basic Educational Data System (BEDS) day enrollments for that school year. A student is counted only once, regardless of whether the student was suspended one or more times during the school year.
Demographic Factors InformationEligible for Free Lunch and Reduced-Price Lunch percentages are determined by dividing the number of approved lunch applicants by the Basic Educational Data System (BEDS) enrollment in full-day Kindergarten through Grade 12. Eligible for Free Lunch and Limited English Proficient counts are used to determine Similar Schools groupings within a Need/Resource Capacity category.
Demographic Factors
# % # % # %
Eligible for Free Lunch
Reduced-Price Lunch
Student Stability*
Limited English Proficient
Racial/Ethnic Origin
American Indian or Alaska Native
Black or African American
Hispanic or Latino
Asian or Native
Hawaiian/Other Pacific Islander
White
Multiracial**
* Available only at the school level.** Multiracial enrollment data were not collected statewide in the 2005-06 school year.
Attendance and Suspensions
# % # % # %
Annual Attendance Rate
Student Suspensions
District BEDFORD CENTRAL SCHOOL DISTRICT District ID 66-01-02-06-0000
2005–06 2006–07 2007–08
324
282
347
4
224
743
184
3116
N/A
8%
7%
N/A
8%
0%
5%
17%
4%
73%
N/A
263
296
336
5
220
817
214
3068
0
6%
7%
N/A
8%
0%
5%
19%
5%
71%
0%
248
362
288
6
220
814
215
3035
6
6%
8%
N/A
7%
0%
5%
19%
5%
71%
0%
2004–05 2005–06 2006–07
155
96%
4% 182
96%
4% 158
96%
4%
March 10, 2009 Page 4
Teacher Qualifications
Total Number of Teachers
Percent with No Valid Teaching Certificate
Percent Teaching Out of Certification
Percent with Fewer Than Three Years of Experience
Percentage with Master’s Degree Plus 30 Hours or Doctorate
Total Number of Core Classes
Percent Not Taught by Highly Qualified Teachers
Total Number of Classes
Percent Taught by Teachers Without Appropriate Certification
Teacher Turnover Rate
Turnover Rate of Teachers with Fewer than Five Years of Experience
Turnover Rate of All Teachers
Staff Counts
Total Other Professional Staff
Total Paraprofessionals*
Assistant Principals
Principals
* Not available at the school level.
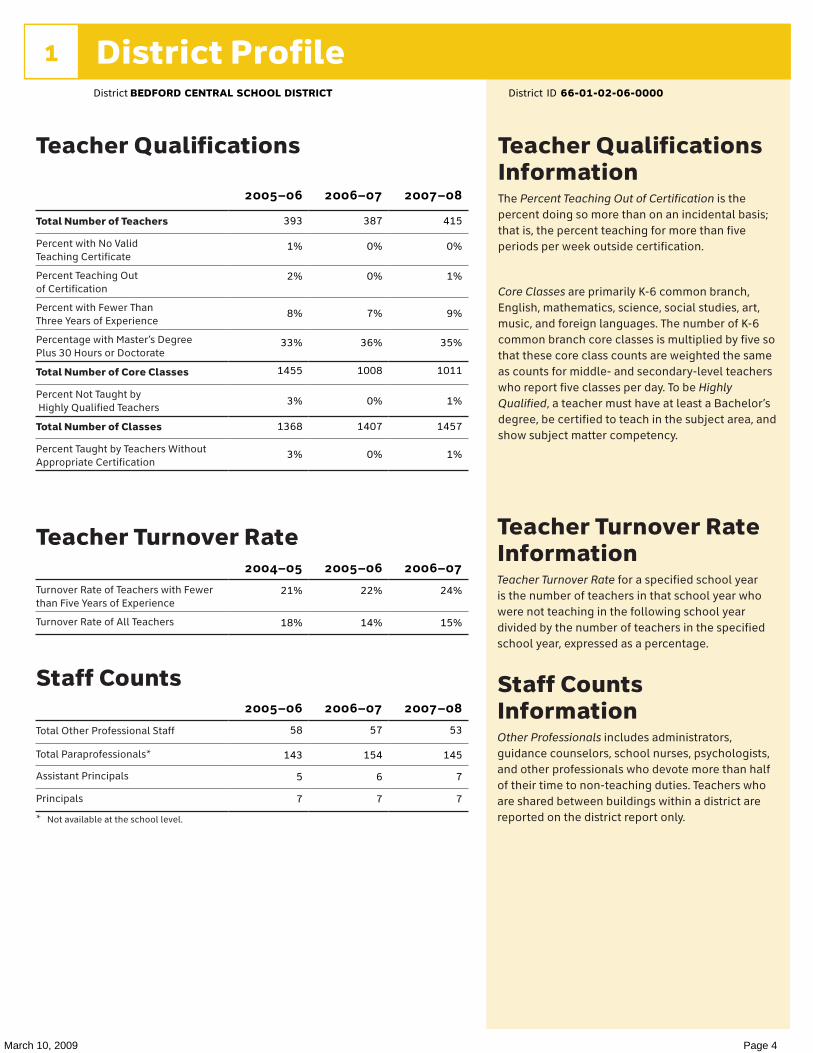
Staff Counts InformationOther Professionals includes administrators, guidance counselors, school nurses, psychologists, and other professionals who devote more than half of their time to non-teaching duties. Teachers who are shared between buildings within a district are reported on the district report only.
Teacher Qualifications InformationThe Percent Teaching Out of Certification is the percent doing so more than on an incidental basis; that is, the percent teaching for more than five periods per week outside certification.
Core Classes are primarily K-6 common branch, English, mathematics, science, social studies, art, music, and foreign languages. The number of K-6 common branch core classes is multiplied by five so that these core class counts are weighted the same as counts for middle- and secondary-level teachers who report five classes per day. To be Highly Qualified, a teacher must have at least a Bachelor’s degree, be certified to teach in the subject area, and show subject matter competency.
Teacher Turnover Rate InformationTeacher Turnover Rate for a specified school year is the number of teachers in that school year who were not teaching in the following school year divided by the number of teachers in the specified school year, expressed as a percentage.
District Profile1District BEDFORD CENTRAL SCHOOL DISTRICT District ID 66-01-02-06-0000
2005–06 2006–07 2007–08
393
1%
2%
8%
33%
1455
3%
1368
3%
387
0%
0%
7%
36%
1008
0%
1407
0%
415
0%
1%
9%
35%
1011
1%
1457
1%
2004–05 2005–06 2006–07
21%
18%
22%
14%
24%
15%
2005–06 2006–07 2007–08
58
143
5
7
57
154
6
7
53
145
7
7
March 10, 2009 Page 5
District Accountability2
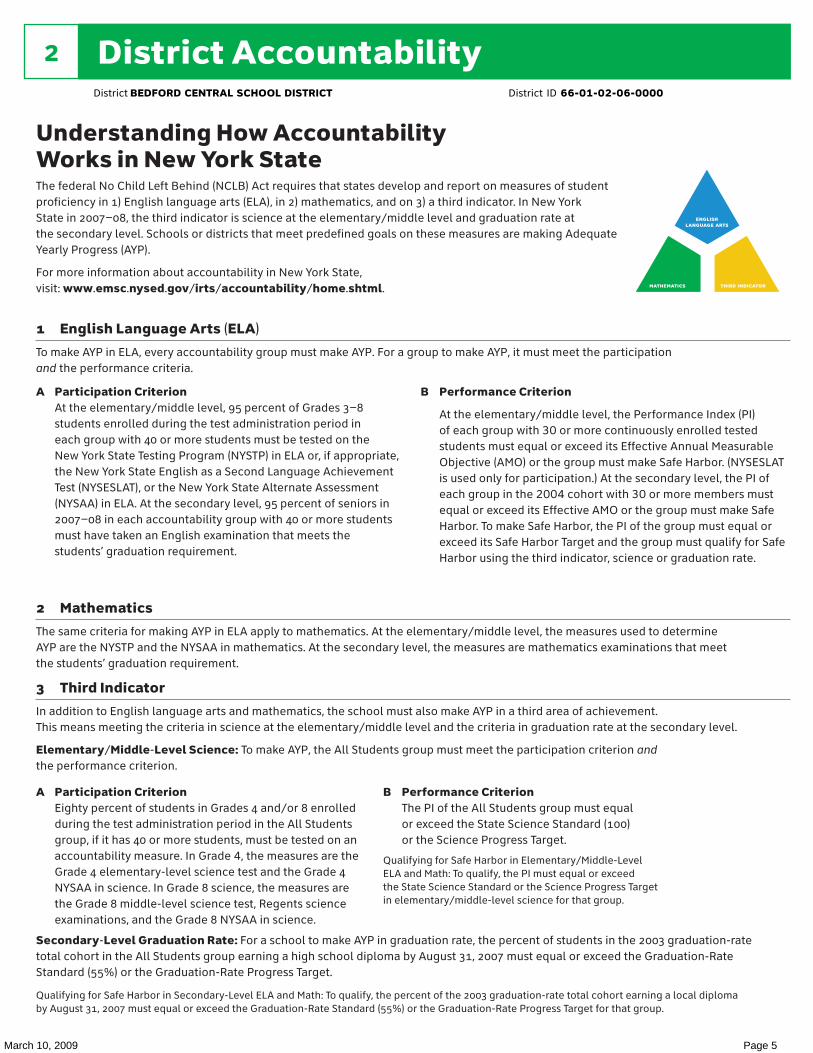
Understanding How Accountability Works in New York StateThe federal No Child Left Behind (NCLB) Act requires that states develop and report on measures of student proficiency in 1) English language arts (ELA), in 2) mathematics, and on 3) a third indicator. In New York State in 2007–08, the third indicator is science at the elementary/middle level and graduation rate at the secondary level. Schools or districts that meet predefined goals on these measures are making Adequate Yearly Progress (AYP).
For more information about accountability in New York State, visit: www.emsc.nysed.gov/irts/accountability/home.shtml.
1 English Language Arts (ELA)
To make AYP in ELA, every accountability group must make AYP. For a group to make AYP, it must meet the participation and the performance criteria.
englishlanguage arts
mathematics third indicator
Secondary-Level Graduation Rate: For a school to make AYP in graduation rate, the percent of students in the 2003 graduation-rate total cohort in the All Students group earning a high school diploma by August 31, 2007 must equal or exceed the Graduation-Rate Standard (55%) or the Graduation-Rate Progress Target.
Qualifying for Safe Harbor in Secondary-Level ELA and Math: To qualify, the percent of the 2003 graduation-rate total cohort earning a local diploma by August 31, 2007 must equal or exceed the Graduation-Rate Standard (55%) or the Graduation-Rate Progress Target for that group.
A Participation Criterion At the elementary/middle level, 95 percent of Grades 3–8 students enrolled during the test administration period in each group with 40 or more students must be tested on the New York State Testing Program (NYSTP) in ELA or, if appropriate, the New York State English as a Second Language Achievement Test (NYSESLAT), or the New York State Alternate Assessment (NYSAA) in ELA. At the secondary level, 95 percent of seniors in 2007–08 in each accountability group with 40 or more students must have taken an English examination that meets the students’ graduation requirement.
B Performance Criterion
At the elementary/middle level, the Performance Index (PI) of each group with 30 or more continuously enrolled tested students must equal or exceed its Effective Annual Measurable Objective (AMO) or the group must make Safe Harbor. (NYSESLAT is used only for participation.) At the secondary level, the PI of each group in the 2004 cohort with 30 or more members must equal or exceed its Effective AMO or the group must make Safe Harbor. To make Safe Harbor, the PI of the group must equal or exceed its Safe Harbor Target and the group must qualify for Safe Harbor using the third indicator, science or graduation rate.
2 Mathematics
The same criteria for making AYP in ELA apply to mathematics. At the elementary/middle level, the measures used to determine AYP are the NYSTP and the NYSAA in mathematics. At the secondary level, the measures are mathematics examinations that meet the students’ graduation requirement.
3 Third Indicator
In addition to English language arts and mathematics, the school must also make AYP in a third area of achievement. This means meeting the criteria in science at the elementary/middle level and the criteria in graduation rate at the secondary level.
Elementary/Middle-Level Science: To make AYP, the All Students group must meet the participation criterion and the performance criterion.
A Participation Criterion Eighty percent of students in Grades 4 and/or 8 enrolled during the test administration period in the All Students group, if it has 40 or more students, must be tested on an accountability measure. In Grade 4, the measures are the Grade 4 elementary-level science test and the Grade 4 NYSAA in science. In Grade 8 science, the measures are the Grade 8 middle-level science test, Regents science examinations, and the Grade 8 NYSAA in science.
B Performance Criterion The PI of the All Students group must equal or exceed the State Science Standard (100) or the Science Progress Target.
Qualifying for Safe Harbor in Elementary/Middle-Level ELA and Math: To qualify, the PI must equal or exceed the State Science Standard or the Science Progress Target in elementary/middle-level science for that group.
District BEDFORD CENTRAL SCHOOL DISTRICT District ID 66-01-02-06-0000
March 10, 2009 Page 6
District Accountability2
Useful Terms for Understanding AccountabilityAccountability Cohort for English and Mathematics The 2004 school accountability cohort consists of all students who first entered Grade 9 anywhere in the 2004–05 school year, and all ungraded students with disabilities who reached their seventeenth birthday in the 2004–05 school year, who were enrolled on October 3, 2007 and did not transfer to a diploma granting program. Students who earned a high school equivalency diploma or were enrolled in an approved high school equivalency preparation program on June 30, 2008, are not included in the 2004 school accountability cohort. The 2004 district accountability cohort consists of all students in each school accountability cohort plus students who transferred within the district after BEDS day plus students who were placed outside the district by the Committee on Special Education or district administrators and who met the other requirements for cohort membership. Cohort is defined in Section 100.2 (p) (16) of the Commissioner’s Regulations.
Adequate Yearly Progress (AYP) Adequate Yearly Progress (AYP) indicates satisfactory progress by a district or a school toward the goal of proficiency for all students.
Annual Measurable Objective (AMO) The Annual Measurable Objective (AMO) is the Performance Index (PI) value that signifies that an accountability group is making satisfactory progress toward the goal that 100 percent of students will be proficient in the State’s learning standards for English language arts and mathematics by 2013–14. The AMO’s for each grade level will be increased as specified in CR100.2(p)(14) and will reach 200 in 2013–14. (See Effective AMO for further information.)
Continuously Enrolled Students At the elementary/middle level, continuously enrolled students are those enrolled in the school or district on BEDS day (usually the first Wednesday in October) of the school year until the test administration period. At the secondary level, all students who meet the criteria for inclusion in the accountability cohort are considered to be continuously enrolled.
Effective Annual Measurable Objective (Effective AMO) The Effective Annual Measurable Objective (Effective AMO) is the Performance Index (PI) value that each accountability group within a school or district is expected to achieve to make Adequate Yearly Progress (AYP). The Effective AMO is the lowest PI that an accountability group of a given size can achieve in a subject for the group’s PI not to be considered significantly different from the AMO for that subject. If an accountability group’s PI equals or exceeds the Effective AMO, it is considered to have made AYP. A more complete definition of Effective AMO and a table showing the PI values that each group size must equal or exceed to make AYP are available at www.emsc.nysed.gov/irts.
Graduation-Rate Total Cohort This term is defined on the graduation-rate accountability page.
Performance Index (PI) Performance Index is a value from 0 to 200 that is assigned to an accountability group, indicating how that group performed on a required State test (or approved alternative) in English language arts, mathematics, or science. Student scores on the tests are converted to four performance levels, from Level 1 to Level 4. (See performance level definitions on the Overview Summary page.) At the elementary/middle level, the PI is calculated using the following equation: 100 × [(Count of Continuously Enrolled Tested Students Performing at Levels 2, 3, and 4 + the Count at Levels 3 and 4) ÷ Count of All Continuously Enrolled Tested Students]
At the secondary level, the PI is calculated using the following equation: 100 × [(Count of Cohort Members Performing at Levels 2, 3, and 4 + the Count at Levels 3 and 4) ÷ Count of All Cohort Members]
A list of tests used to measure student performance for accountability is available at www.emsc.nysed.gov/irts.
Progress Target For accountability groups below the State Standard in science or graduation rate, the Progress Target is an alternate method for making Adequate Yearly Progress (AYP) or qualifying for Safe Harbor in English language arts and mathematics based on improvement over the previous year’s performance.
Safe Harbor Safe Harbor provides an alternate means to demonstrate Adequate Yearly Progress (AYP) for accountability groups that do not achieve their Effective Annual Measurable Objectives (AMOs) in English or mathematics.
Safe Harbor Targets The 2007–08 safe harbor targets were calculated using the following equation: 2006–07 PI + (200 – the 2006–07 PI) × 0.10
Science Progress Target The elementary/middle-level 2007–08 Science Progress Target is calculated by adding one point to the 2006–07 PI. The 2008–09 Science Progress Target is calculated by adding one point to the 2007–08 PI. The 2007–08 target is provided for groups whose PI was below the State Science Standard in 2007–08.
Science Standard The criterion value that represents a minimally satisfactory performance in science. In 2007–08, the State Science Standard at the elementary/middle level is a Performance Index (PI) of 100. The Commissioner may raise the State Science Standard at his discretion in future years.
District BEDFORD CENTRAL SCHOOL DISTRICT District ID 66-01-02-06-0000
March 10, 2009 Page 7
District Accountability2
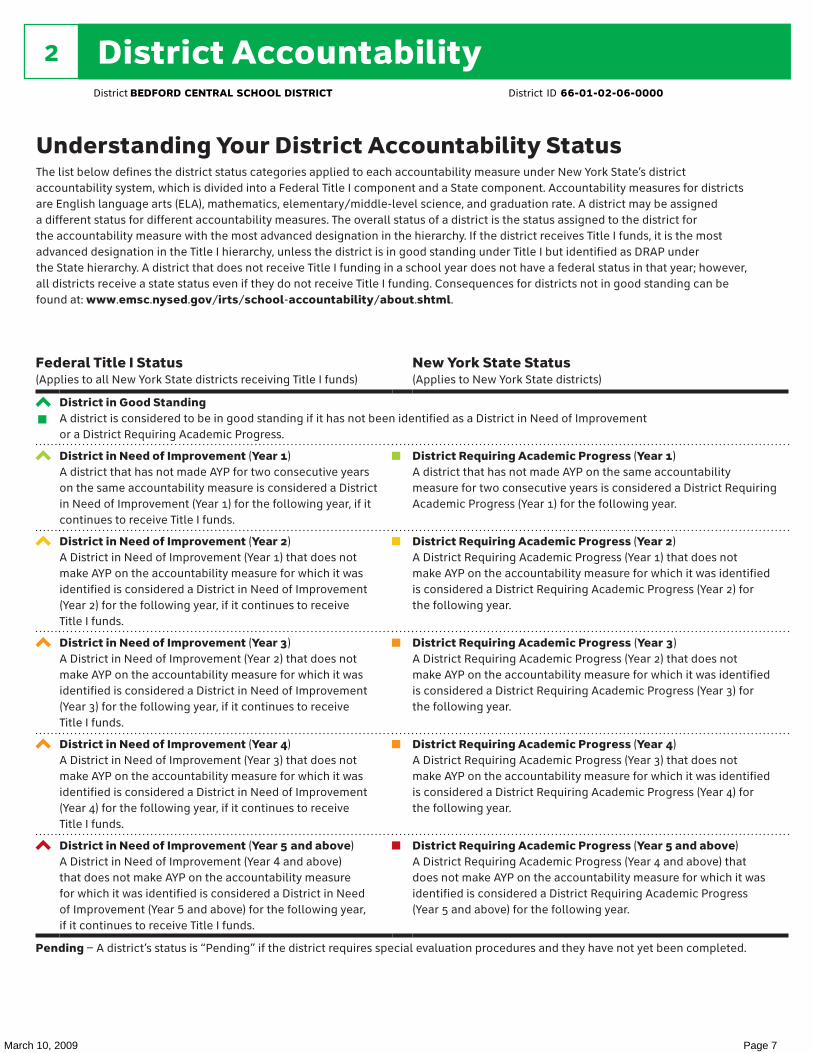
Understanding Your District Accountability StatusThe list below defines the district status categories applied to each accountability measure under New York State’s district accountability system, which is divided into a Federal Title I component and a State component. Accountability measures for districts are English language arts (ELA), mathematics, elementary/middle-level science, and graduation rate. A district may be assigned a different status for different accountability measures. The overall status of a district is the status assigned to the district for the accountability measure with the most advanced designation in the hierarchy. If the district receives Title I funds, it is the most advanced designation in the Title I hierarchy, unless the district is in good standing under Title I but identified as DRAP under the State hierarchy. A district that does not receive Title I funding in a school year does not have a federal status in that year; however, all districts receive a state status even if they do not receive Title I funding. Consequences for districts not in good standing can be found at: www.emsc.nysed.gov/irts/school-accountability/about.shtml.
Federal Title I Status (Applies to all New York State districts receiving Title I funds)
New York State Status (Applies to New York State districts)
District in Good Standing A district is considered to be in good standing if it has not been identified as a District in Need of Improvement or a District Requiring Academic Progress.
District in Need of Improvement (Year 1) A district that has not made AYP for two consecutive years on the same accountability measure is considered a District in Need of Improvement (Year 1) for the following year, if it continues to receive Title I funds.
District Requiring Academic Progress (Year 1) A district that has not made AYP on the same accountability measure for two consecutive years is considered a District Requiring Academic Progress (Year 1) for the following year.
District in Need of Improvement (Year 2) A District in Need of Improvement (Year 1) that does not make AYP on the accountability measure for which it was identified is considered a District in Need of Improvement (Year 2) for the following year, if it continues to receive Title I funds.
District Requiring Academic Progress (Year 2) A District Requiring Academic Progress (Year 1) that does not make AYP on the accountability measure for which it was identified is considered a District Requiring Academic Progress (Year 2) for the following year.
District in Need of Improvement (Year 3) A District in Need of Improvement (Year 2) that does not make AYP on the accountability measure for which it was identified is considered a District in Need of Improvement (Year 3) for the following year, if it continues to receive Title I funds.
District Requiring Academic Progress (Year 3) A District Requiring Academic Progress (Year 2) that does not make AYP on the accountability measure for which it was identified is considered a District Requiring Academic Progress (Year 3) for the following year.
District in Need of Improvement (Year 4) A District in Need of Improvement (Year 3) that does not make AYP on the accountability measure for which it was identified is considered a District in Need of Improvement (Year 4) for the following year, if it continues to receive Title I funds.
District Requiring Academic Progress (Year 4) A District Requiring Academic Progress (Year 3) that does not make AYP on the accountability measure for which it was identified is considered a District Requiring Academic Progress (Year 4) for the following year.
District in Need of Improvement (Year 5 and above) A District in Need of Improvement (Year 4 and above) that does not make AYP on the accountability measure for which it was identified is considered a District in Need of Improvement (Year 5 and above) for the following year, if it continues to receive Title I funds.
District Requiring Academic Progress (Year 5 and above) A District Requiring Academic Progress (Year 4 and above) that does not make AYP on the accountability measure for which it was identified is considered a District Requiring Academic Progress (Year 5 and above) for the following year.
Pending – A district’s status is “Pending” if the district requires special evaluation procedures and they have not yet been completed.
District BEDFORD CENTRAL SCHOOL DISTRICT District ID 66-01-02-06-0000
March 10, 2009 Page 8
District Accountability2
AYP Status
4 MadeAYP
✔SH MadeAYPUsingSafeHarborTarget
✘ DidNotMakeAYP
— InsufficientNumberofStudents toDetermineAYPStatus
Accountability Status Levels Federal State GoodStanding GoodStanding
Improvement(Year1) RequiringAcademicProgress(Year1)
Improvement(Year2) RequiringAcademicProgress(Year2)
Improvement(Year3) RequiringAcademicProgress(Year3)
Improvement(Year4) RequiringAcademicProgress(Year4)
Improvement(Year5&Above) RequiringAcademicProgress(Year5 &Above)
Pending–RequiresSpecialEvaluation
Title I Part A Funding Years the District Received Title I Part A Funding
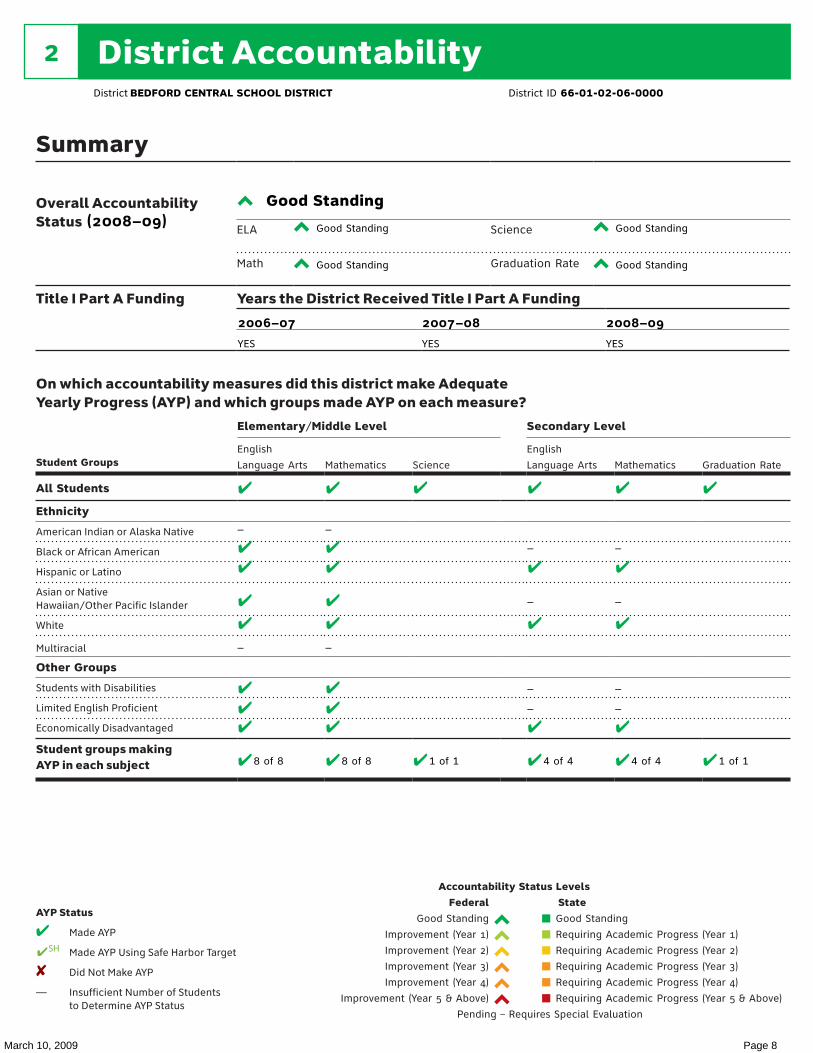
Summary
Overall Accountability Status
ELA Science
Math GraduationRate
On which accountability measures did this district make Adequate Yearly Progress (AYP) and which groups made AYP on each measure?
Elementary/Middle Level Secondary Level
Student GroupsEnglish
LanguageArts Mathematics Science
English
LanguageArts Mathematics GraduationRate
All Students
Ethnicity
AmericanIndianorAlaskaNative
BlackorAfricanAmerican
HispanicorLatino
AsianorNativeHawaiian/OtherPacificIslander
White
Multiracial Other Groups
StudentswithDisabilities
LimitedEnglishProficient
EconomicallyDisadvantaged
Student groups making AYP in each subject
District BEDFORD CENTRAL SCHOOL DISTRICT District ID 66-01-02-06-0000
(2008–09)Good Standing
Good Standing Good Standing
Good Standing Good Standing
2006–07 2007–08 2008–09
YES YES YES
✔
–
✔
✔
✔
✔
–
✔
✔✔
✔
✔
–
✔
✔
✔
✔
–
✔
✔✔
✔
✔
✔
✔
–
✔
–
✔
–
–
✔
✔
✔
–
✔
–
✔
–
–
✔
✔
✔
✔8 of 8 8 of 8 1 of 1 4 of 4 4 of 4 1 of 1
March 10, 2009 Page 9
District Accountability2
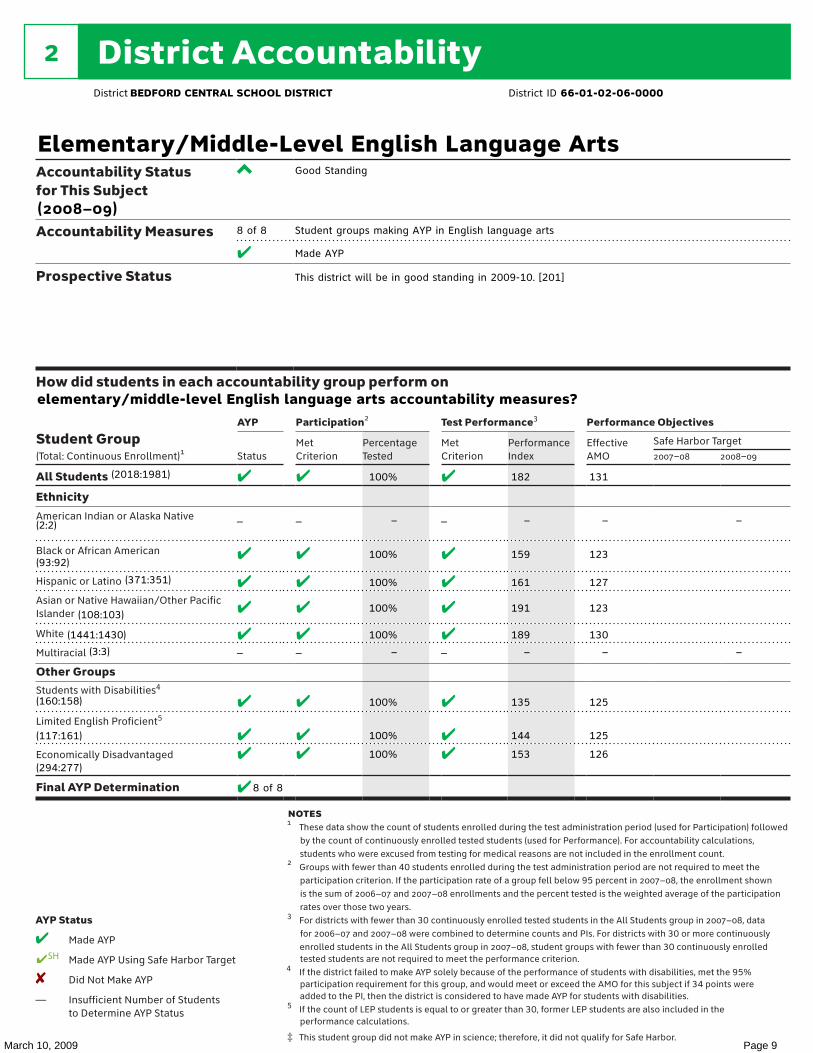
Accountability Status for This Subject
Accountability Measures
Prospective Status
How did students in each accountability group perform on
Student Group (Total: Continuous Enrollment)1
AYP Participation2 Test Performance3 Performance Objectives
StatusMet Criterion
Percentage Tested
Met Criterion
Performance Index
Effective AMO
Safe Harbor Target2007–08 2008–09
All Students
Ethnicity
American Indian or Alaska Native
Black or African American
Hispanic or Latino
Asian or Native Hawaiian/Other Pacific Islander
White
Multiracial
Other GroupsStudents with Disabilities4
Limited English Proficient5
Economically Disadvantaged
Final AYP Determination
AYP Status
4 Made AYP
✔SH Made AYP Using Safe Harbor Target
✘ Did Not Make AYP
— Insufficient Number of Students to Determine AYP Status
notes1 These data show the count of students enrolled during the test administration period (used for Participation) followed
by the count of continuously enrolled tested students (used for Performance). For accountability calculations, students who were excused from testing for medical reasons are not included in the enrollment count.
2 Groups with fewer than 40 students enrolled during the test administration period are not required to meet the participation criterion. If the participation rate of a group fell below 95 percent in 2007–08, the enrollment shown is the sum of 2006–07 and 2007–08 enrollments and the percent tested is the weighted average of the participation rates over those two years.
3 For districts with fewer than 30 continuously enrolled tested students in the All Students group in 2007–08, data for 2006–07 and 2007–08 were combined to determine counts and PIs. For districts with 30 or more continuously enrolled students in the All Students group in 2007–08, student groups with fewer than 30 continuously enrolled tested students are not required to meet the performance criterion.
4 If the district failed to make AYP solely because of the performance of students with disabilities, met the 95% participation requirement for this group, and would meet or exceed the AMO for this subject if 34 points were added to the PI, then the district is considered to have made AYP for students with disabilities.
5 If the count of LEP students is equal to or greater than 30, former LEP students are also included in the performance calculations.
‡ This student group did not make AYP in science; therefore, it did not qualify for Safe Harbor.
District BEDFORD CENTRAL SCHOOL DISTRICT District ID 66-01-02-06-0000
Elementary/Middle-Level English Language Arts
(2008–09)
Good Standing
8 of 8 Student groups making AYP in English language arts
✔ Made AYP
This district will be in good standing in 2009-10. [201]
elementary/middle-level English language arts accountability measures?
✔
–
✔
✔
✔
✔–
✔
✔✔
✔
–
✔
✔
✔
✔–
✔
✔✔
100%
–
100%
100%
100%
100%
–
100%
100%
100%
✔
–
✔
✔
✔
✔–
✔
✔✔
182
–
159
161
191
189
–
135
144
153
131
–
123
127
123
130
–
125
125
126
–
–
✔ 8 of 8
(2018:1981)
(2:2)
(93:92)
(371:351)
(108:103)
(1441:1430)
(3:3)
(160:158)
(117:161)
(294:277)
March 10, 2009 Page 10
District Accountability2
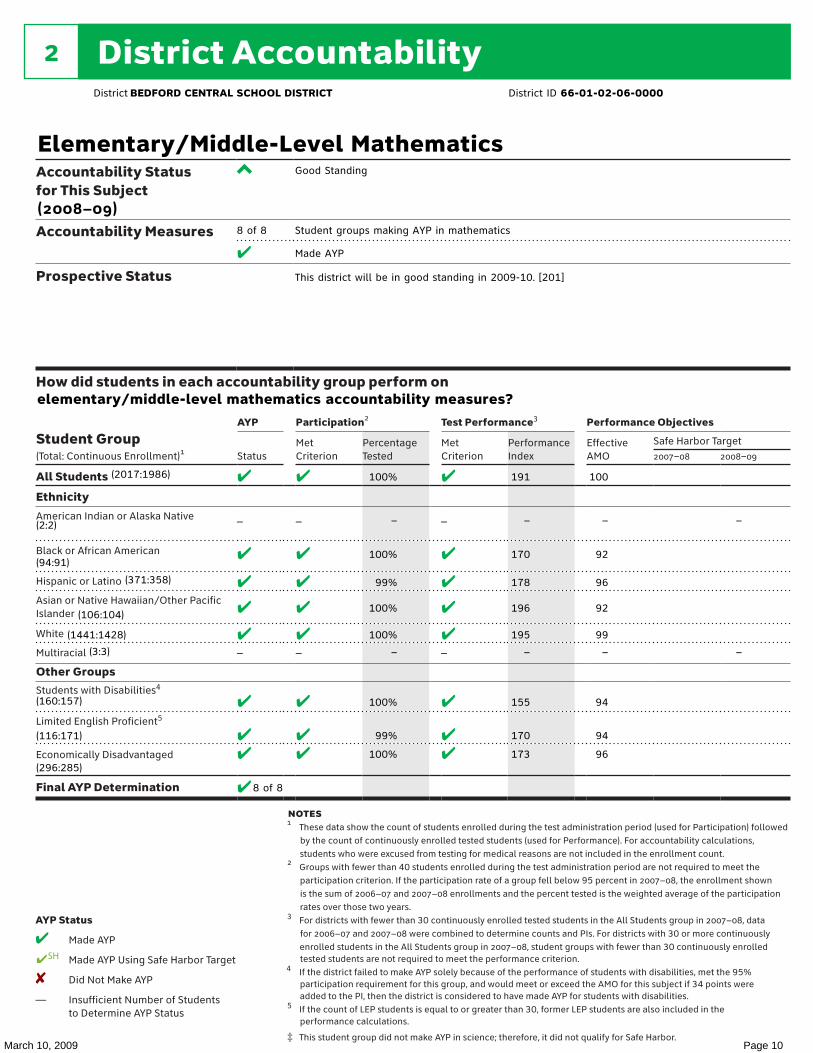
Accountability Status for This Subject
Accountability Measures
Prospective Status
How did students in each accountability group perform on
Student Group (Total: Continuous Enrollment)1
AYP Participation2 Test Performance3 Performance Objectives
StatusMet Criterion
Percentage Tested
Met Criterion
Performance Index
Effective AMO
Safe Harbor Target2007–08 2008–09
All Students
Ethnicity
American Indian or Alaska Native
Black or African American
Hispanic or Latino
Asian or Native Hawaiian/Other Pacific Islander
White
Multiracial
Other GroupsStudents with Disabilities4
Limited English Proficient5
Economically Disadvantaged
Final AYP Determination
AYP Status
4 Made AYP
✔SH Made AYP Using Safe Harbor Target
✘ Did Not Make AYP
— Insufficient Number of Students to Determine AYP Status
notes1 These data show the count of students enrolled during the test administration period (used for Participation) followed
by the count of continuously enrolled tested students (used for Performance). For accountability calculations, students who were excused from testing for medical reasons are not included in the enrollment count.
2 Groups with fewer than 40 students enrolled during the test administration period are not required to meet the participation criterion. If the participation rate of a group fell below 95 percent in 2007–08, the enrollment shown is the sum of 2006–07 and 2007–08 enrollments and the percent tested is the weighted average of the participation rates over those two years.
3 For districts with fewer than 30 continuously enrolled tested students in the All Students group in 2007–08, data for 2006–07 and 2007–08 were combined to determine counts and PIs. For districts with 30 or more continuously enrolled students in the All Students group in 2007–08, student groups with fewer than 30 continuously enrolled tested students are not required to meet the performance criterion.
4 If the district failed to make AYP solely because of the performance of students with disabilities, met the 95% participation requirement for this group, and would meet or exceed the AMO for this subject if 34 points were added to the PI, then the district is considered to have made AYP for students with disabilities.
5 If the count of LEP students is equal to or greater than 30, former LEP students are also included in the performance calculations.
‡ This student group did not make AYP in science; therefore, it did not qualify for Safe Harbor.
District BEDFORD CENTRAL SCHOOL DISTRICT District ID 66-01-02-06-0000
Elementary/Middle-Level Mathematics
(2008–09)
Good Standing
8 of 8 Student groups making AYP in mathematics
✔ Made AYP
This district will be in good standing in 2009-10. [201]
elementary/middle-level mathematics accountability measures?
✔
–
✔
✔
✔
✔–
✔
✔✔
✔
–
✔
✔
✔
✔–
✔
✔✔
100%
–
100%
99%
100%
100%
–
100%
99%
100%
✔
–
✔
✔
✔
✔–
✔
✔✔
191
–
170
178
196
195
–
155
170
173
100
–
92
96
92
99
–
94
94
96
–
–
✔ 8 of 8
(2017:1986)
(2:2)
(94:91)
(371:358)
(106:104)
(1441:1428)
(3:3)
(160:157)
(116:171)
(296:285)

March 10, 2009 Page 11
District Accountability2
Elementary/Middle-Level ScienceAccountability Status for This Subject
Accountability Measures
Prospective Status
How did students in each accountability group perform on elementary/middle-level science accountability measures?
Student Group (Total: Continuous Enrollment)1
AYP Participation2 Test Performance3 Performance Objectives
StatusSafe Harbor Qualification
Met Criterion
Percentage Tested
Met Criterion
Performance Index
State Standard
Progress Target
2007–08 2008–09
All Students
Ethnicity
American Indian or Alaska Native
Black or African American
Hispanic or Latino
Asian or Native Hawaiian/Other Pacific Islander
White
Multiracial
Other Groups
Students with Disabilities
Limited English Proficient4
Economically Disadvantaged
Final AYP Determination
AYP Status
4 Made AYP
✔SH Made AYP Using Safe Harbor Target
✘ Did Not Make AYP
— Insufficient Number of Students to Determine AYP Status
notes1 These data show the count of students enrolled during the test administration period (used for Participation) followed
by the count of continuously enrolled tested students (used for Performance). For accountability calculations, students who were excused from testing for medical reasons are not included in the enrollment count.
2 Groups with fewer than 40 students enrolled during the test administration period are not required to meet the participation criterion. If the participation rate of a group fell below 80 percent in 2007–08, the enrollment shown is the sum of 2006–07 and 2007–08 enrollments and the percent tested is the weighted average of the participation rates over those two years.
3 Groups with fewer than 30 continuously enrolled tested students are not required to meet the performance criterion. For districts with fewer than 30 continuously enrolled tested students in 2007–08, data for 2006–07 and 2007–08 were combined to determine counts and performance indices.
4 If the count of LEP students is equal to or greater than 30, former LEP students are also included in the performance calculations.
District BEDFORD CENTRAL SCHOOL DISTRICT District ID 66-01-02-06-0000
(2008–09)
Good Standing
1 of 1 Student groups making AYP in science
✔ Made AYP
This district will be in good standing in 2009-10. [201]
✔ ✔
–
✔
✔
✔
–
✔
–
✔
98%
–
98%
98%
99%
–
96%
–
97%
✔
✔
✔
✔
✔
–
✔
–
✔
191
175
174
195
196
–
177
–
165
100
100
100
100
100
–
100
–
100
–
–
Qualified
Qualified
Qualified
Qualified
Qualified
–
Qualified
–
Qualified
✔ 1 of 1
(697:676)
(0:0)
(38:36)
(122:116)
(45:42)
(491:481)
(1:1)
(56:52)
(30:26)
(102:95)
March 10, 2009 Page 12
District Accountability2
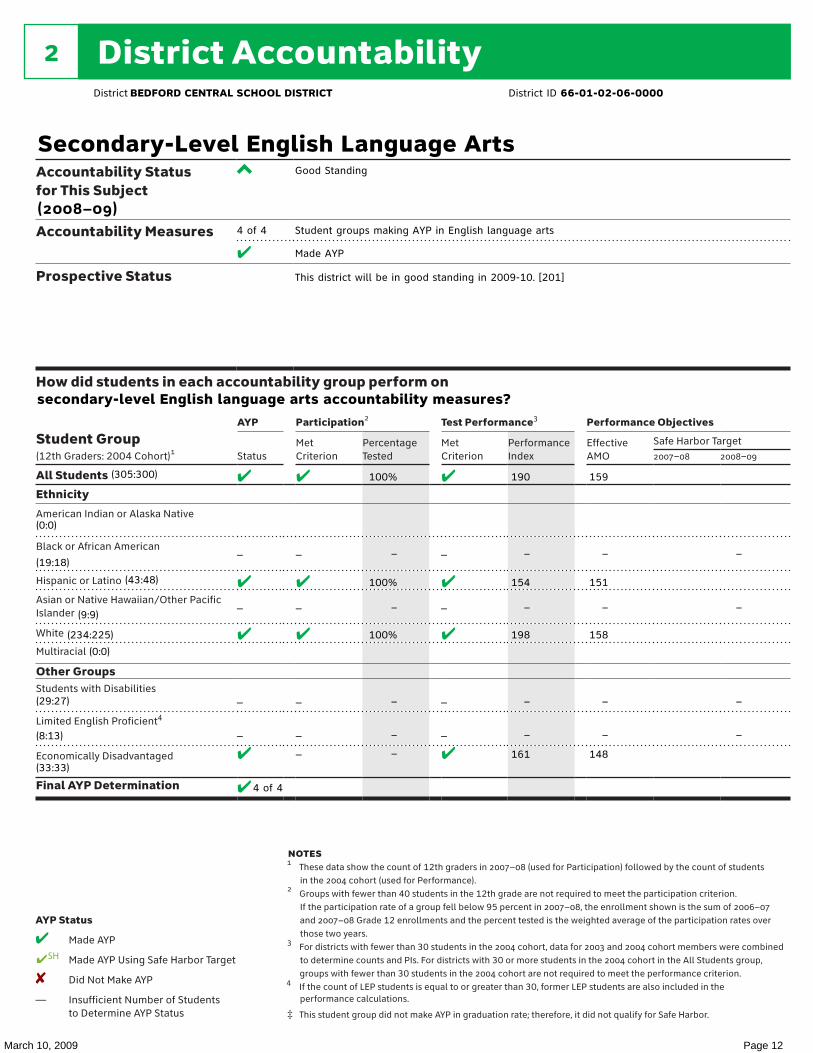
Accountability Status for This Subject
Accountability Measures
Prospective Status
How did students in each accountability group perform on
Student Group (12th Graders: 2004 Cohort)1
AYP Participation2 Test Performance3 Performance Objectives
StatusMet Criterion
Percentage Tested
Met Criterion
Performance Index
Effective AMO
Safe Harbor Target2007–08 2008–09
All Students
Ethnicity
American Indian or Alaska Native
Black or African American
Hispanic or Latino
Asian or Native Hawaiian/Other Pacific Islander
White
Multiracial
Other GroupsStudents with Disabilities
Limited English Proficient4
Economically Disadvantaged
Final AYP Determination
AYP Status
4 Made AYP
✔SH Made AYP Using Safe Harbor Target
✘ Did Not Make AYP
— Insufficient Number of Students to Determine AYP Status
notes1 These data show the count of 12th graders in 2007–08 (used for Participation) followed by the count of students
in the 2004 cohort (used for Performance).2 Groups with fewer than 40 students in the 12th grade are not required to meet the participation criterion.
If the participation rate of a group fell below 95 percent in 2007–08, the enrollment shown is the sum of 2006–07 and 2007–08 Grade 12 enrollments and the percent tested is the weighted average of the participation rates over those two years.
3 For districts with fewer than 30 students in the 2004 cohort, data for 2003 and 2004 cohort members were combined to determine counts and PIs. For districts with 30 or more students in the 2004 cohort in the All Students group, groups with fewer than 30 students in the 2004 cohort are not required to meet the performance criterion.
4 If the count of LEP students is equal to or greater than 30, former LEP students are also included in the performance calculations.
‡ This student group did not make AYP in graduation rate; therefore, it did not qualify for Safe Harbor.
District BEDFORD CENTRAL SCHOOL DISTRICT District ID 66-01-02-06-0000
Secondary-Level English Language Arts
(2008–09)
Good Standing
4 of 4 Student groups making AYP in English language arts
✔ Made AYP
This district will be in good standing in 2009-10. [201]
secondary-level English language arts accountability measures?
✔
–
✔
–
✔
–
–
✔
✔
–
✔
–
✔
–
–
–
100%
–
100%
–
100%
–
–
–
✔
–
✔
–
✔
–
–
✔
190
–
154
–
198
–
–
161
159
–
151
–
158
–
–
148
–
–
–
–
✔ 4 of 4
(305:300)
(0:0)
(19:18)
(43:48)
(9:9)
(234:225)
(0:0)
(29:27)
(8:13)
(33:33)
March 10, 2009 Page 13
District Accountability2
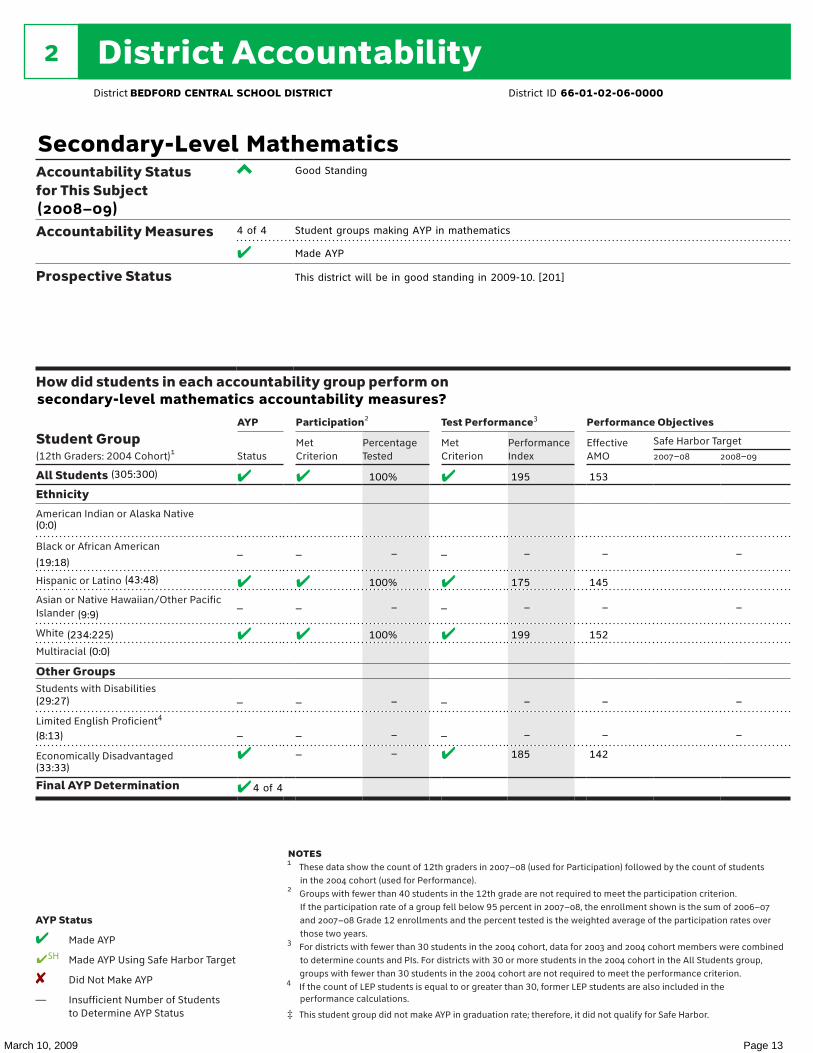
Accountability Status for This Subject
Accountability Measures
Prospective Status
How did students in each accountability group perform on
Student Group (12th Graders: 2004 Cohort)1
AYP Participation2 Test Performance3 Performance Objectives
StatusMet Criterion
Percentage Tested
Met Criterion
Performance Index
Effective AMO
Safe Harbor Target2007–08 2008–09
All Students
Ethnicity
American Indian or Alaska Native
Black or African American
Hispanic or Latino
Asian or Native Hawaiian/Other Pacific Islander
White
Multiracial
Other GroupsStudents with Disabilities
Limited English Proficient4
Economically Disadvantaged
Final AYP Determination
AYP Status
4 Made AYP
✔SH Made AYP Using Safe Harbor Target
✘ Did Not Make AYP
— Insufficient Number of Students to Determine AYP Status
notes1 These data show the count of 12th graders in 2007–08 (used for Participation) followed by the count of students
in the 2004 cohort (used for Performance).2 Groups with fewer than 40 students in the 12th grade are not required to meet the participation criterion.
If the participation rate of a group fell below 95 percent in 2007–08, the enrollment shown is the sum of 2006–07 and 2007–08 Grade 12 enrollments and the percent tested is the weighted average of the participation rates over those two years.
3 For districts with fewer than 30 students in the 2004 cohort, data for 2003 and 2004 cohort members were combined to determine counts and PIs. For districts with 30 or more students in the 2004 cohort in the All Students group, groups with fewer than 30 students in the 2004 cohort are not required to meet the performance criterion.
4 If the count of LEP students is equal to or greater than 30, former LEP students are also included in the performance calculations.
‡ This student group did not make AYP in graduation rate; therefore, it did not qualify for Safe Harbor.
District BEDFORD CENTRAL SCHOOL DISTRICT District ID 66-01-02-06-0000
Secondary-Level Mathematics
(2008–09)
Good Standing
4 of 4 Student groups making AYP in mathematics
✔ Made AYP
This district will be in good standing in 2009-10. [201]
secondary-level mathematics accountability measures?
✔
–
✔
–
✔
–
–
✔
✔
–
✔
–
✔
–
–
–
100%
–
100%
–
100%
–
–
–
✔
–
✔
–
✔
–
–
✔
195
–
175
–
199
–
–
185
153
–
145
–
152
–
–
142
–
–
–
–
✔ 4 of 4
(305:300)
(0:0)
(19:18)
(43:48)
(9:9)
(234:225)
(0:0)
(29:27)
(8:13)
(33:33)
March 10, 2009 Page 14
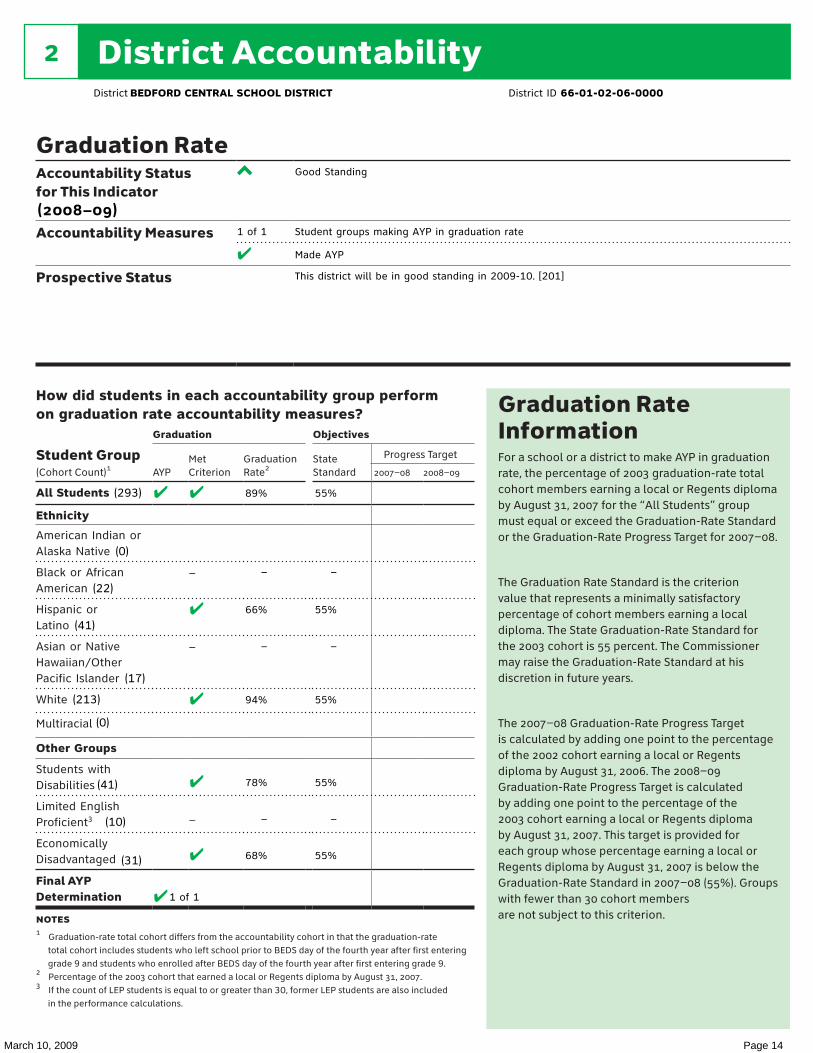
Graduation Rate InformationFor a school or a district to make AYP in graduation rate, the percentage of 2003 graduation-rate total cohort members earning a local or Regents diploma by August 31, 2007 for the “All Students” group must equal or exceed the Graduation-Rate Standard or the Graduation-Rate Progress Target for 2007–08.
The Graduation Rate Standard is the criterion value that represents a minimally satisfactory percentage of cohort members earning a local diploma. The State Graduation-Rate Standard for the 2003 cohort is 55 percent. The Commissioner may raise the Graduation-Rate Standard at his discretion in future years.
The 2007–08 Graduation-Rate Progress Target is calculated by adding one point to the percentage of the 2002 cohort earning a local or Regents diploma by August 31, 2006. The 2008–09 Graduation-Rate Progress Target is calculated by adding one point to the percentage of the 2003 cohort earning a local or Regents diploma by August 31, 2007. This target is provided for each group whose percentage earning a local or Regents diploma by August 31, 2007 is below the Graduation-Rate Standard in 2007–08 (55%). Groups with fewer than 30 cohort members are not subject to this criterion.
District Accountability2
How did students in each accountability group perform on graduation rate accountability measures?
Student Group (Cohort Count)1
Graduation Objectives
AYPMet Criterion
Graduation Rate2
State Standard
Progress Target
2007–08 2008–09
All Students
Ethnicity
American Indian or Alaska Native
Black or African American
Hispanic or Latino
Asian or Native Hawaiian/Other Pacific Islander
White
Multiracial
Other Groups
Students with Disabilities
Limited English Proficient3
Economically Disadvantaged
Final AYP Determination
notes1 Graduation-rate total cohort differs from the accountability cohort in that the graduation-rate
total cohort includes students who left school prior to BEDS day of the fourth year after first entering grade 9 and students who enrolled after BEDS day of the fourth year after first entering grade 9.
2 Percentage of the 2003 cohort that earned a local or Regents diploma by August 31, 2007.3 If the count of LEP students is equal to or greater than 30, former LEP students are also included
in the performance calculations.
Graduation RateAccountability Status for This Indicator
Accountability Measures
Prospective Status
District BEDFORD CENTRAL SCHOOL DISTRICT District ID 66-01-02-06-0000
(2008–09)
Good Standing
1 of 1 Student groups making AYP in graduation rate
✔ Made AYP
This district will be in good standing in 2009-10. [201]
✔ ✔
–
✔
–
✔
✔
–
✔
89%
–
66%
–
94%
78%
–
68%
55%
–
55%
–
55%
55%
–
55%
(293)
(0)
(22)
(41)
(17)
(213)
(0)
(41)
(10)
(31)
✔ 1 of 1
March 10, 2009 Page 15
School Accountability Status3
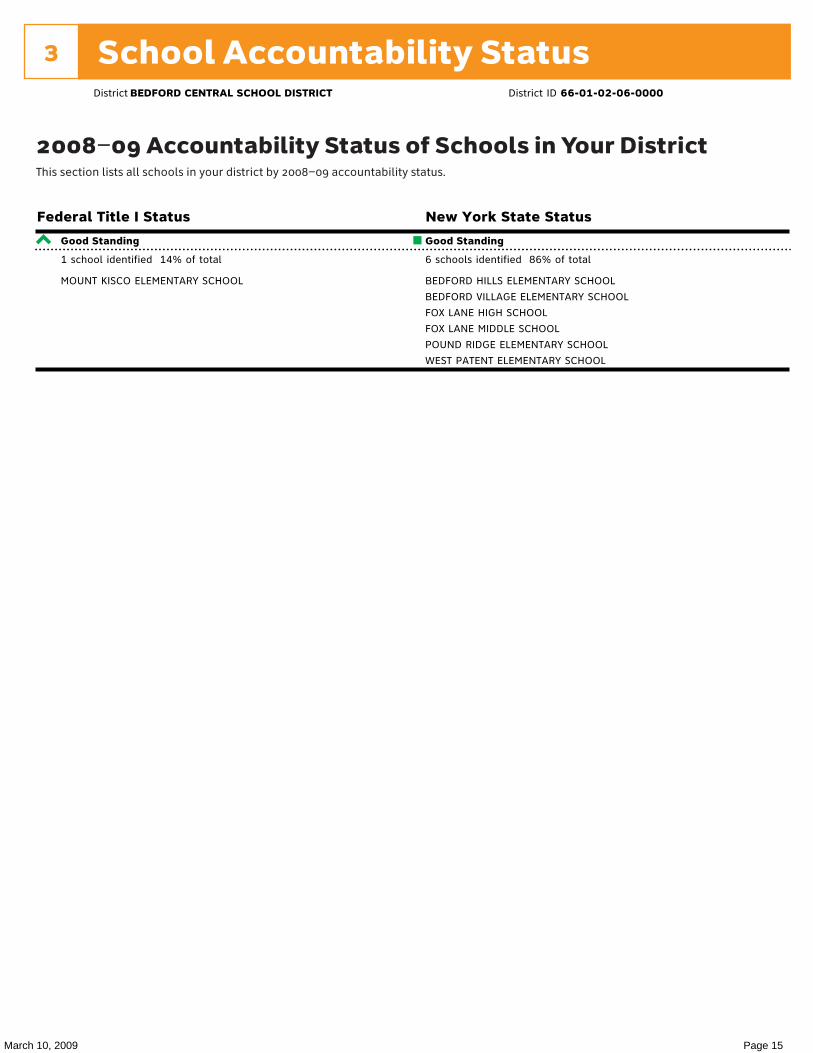
2008–09 Accountability Status of Schools in Your DistrictThis section lists all schools in your district by 2008–09 accountability status.
District BEDFORD CENTRAL SCHOOL DISTRICT District ID 66-01-02-06-0000
Federal Title I Status New York State Status
Good Standing
1 school identified 14% of total
MOUNT KISCO ELEMENTARY SCHOOL
Good Standing
6 schools identified 86% of total
BEDFORD HILLS ELEMENTARY SCHOOL
BEDFORD VILLAGE ELEMENTARY SCHOOL
FOX LANE HIGH SCHOOL
FOX LANE MIDDLE SCHOOL
POUND RIDGE ELEMENTARY SCHOOL
WEST PATENT ELEMENTARY SCHOOL
March 10, 2009 Page 16
About the Performance Level DescriptorsLevel 1: Not Meeting Learning Standards. Student performance does not demonstrate an understanding of the content expected in the subject and grade level.
Level 2: Partially Meeting Learning Standards. Student performance demonstrates a partial understanding of the content expected in the subject and grade level.
Level 3: Meeting Learning Standards. Student performance demonstrates an understanding of the content expected in the subject and grade level.
Level 4: Meeting Learning Standards with Distinction. Student performance demonstrates a thorough understanding of the content expected in the subject and grade level.
How are Need/Resource Capacity (N/RC) categories determined?Districts are divided into high, average, and low need categories based on their ability to meet the special needs of their students with local resources. Districts in the high need category are subdivided into four categories based on enrollment size and, in some cases, number of students per square mile. More information about the categories can be found in the Report to the Governor and the Legislature on the Educational Status of the State’s Schools at www.emsc.nysed.gov/irts.
In this section, this district’s performance is compared with that of public schools statewide.
This District’s N/RC Category:
Summary of
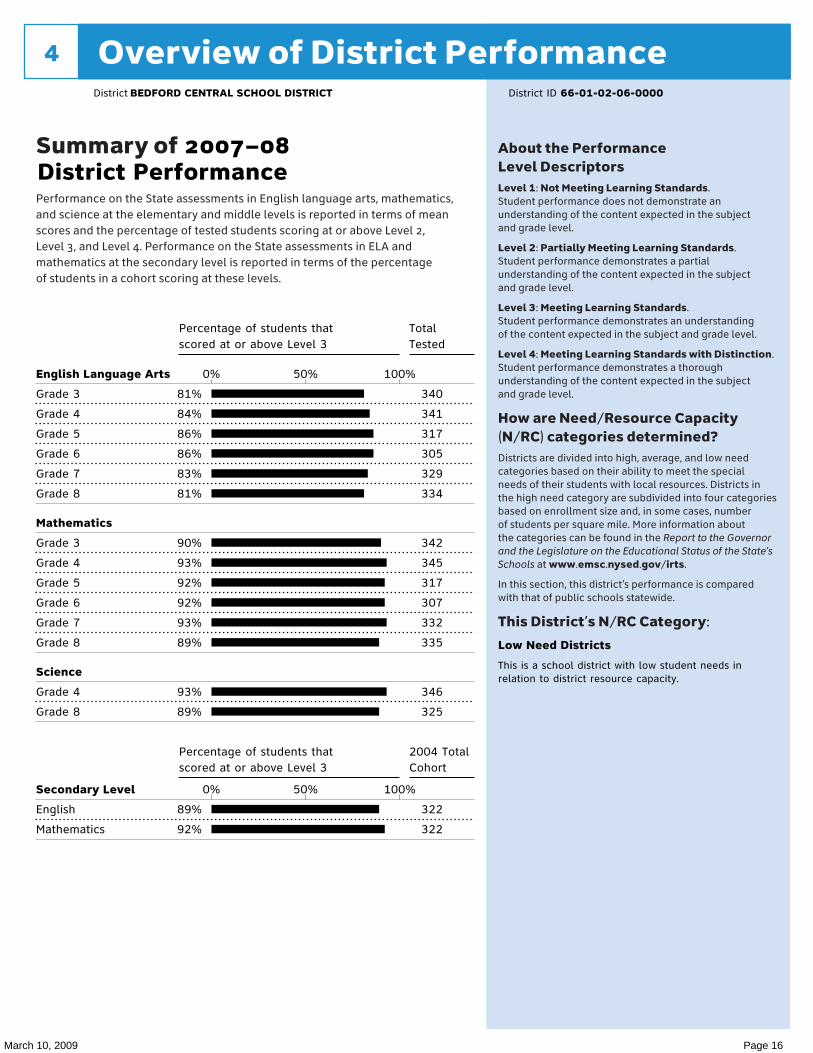
Performance on the State assessments in English language arts, mathematics, and science at the elementary and middle levels is reported in terms of mean scores and the percentage of tested students scoring at or above Level 2, Level 3, and Level 4. Performance on the State assessments in ELA and mathematics at the secondary level is reported in terms of the percentage of students in a cohort scoring at these levels.
Overview of District Performance4
District Performance
District BEDFORD CENTRAL SCHOOL DISTRICT District ID 66-01-02-06-0000
2007–08
Percentage of students that Totalscored at or above Level 3 Tested
0% 50% 100%English Language Arts
Grade 3 81% 340
Grade 4 84% 341
Grade 5 86% 317
Grade 6 86% 305
Grade 7 83% 329
Grade 8 81% 334
Mathematics
Grade 3 90% 342
Grade 4 93% 345
Grade 5 92% 317
Grade 6 92% 307
Grade 7 93% 332
Grade 8 89% 335
Science
Grade 4 93% 346
Grade 8 89% 325
Percentage of students that 2004 Totalscored at or above Level 3 Cohort
0% 50% 100%Secondary Level
English 89% 322
Mathematics 92% 322
Low Need Districts
This is a school district with low student needs inrelation to district resource capacity.
March 10, 2009 Page 17
Overview of District Performance4
100%100%
Results by Student Group
Percentage scoring at level(s): Percentage scoring at level(s):
2–4 3–4 4 2–4 3–4 4
All StudentsFemale
Male
American Indian or Alaska Native
Black or African American
Hispanic or Latino
Asian or Native Hawaiian/Other Pacific Islander
White
Multiracial
Small Group Totals
General-Education Students
Students with Disabilities
English Proficient
Limited English Proficient
Economically Disadvantaged
Not Disadvantaged
Migrant
Not Migrant
notes ,
Other Assessments
Number scoring at level(s): Number scoring at level(s):
2–4 3–4 4 2–4 3–4 4
This District NY State Public
Percentage scoring at level(s): Percentage scoring at level(s):
2–4 3–4 4 2–4 3–4 4
District BEDFORD CENTRAL SCHOOL DISTRICT District ID 66-01-02-06-0000
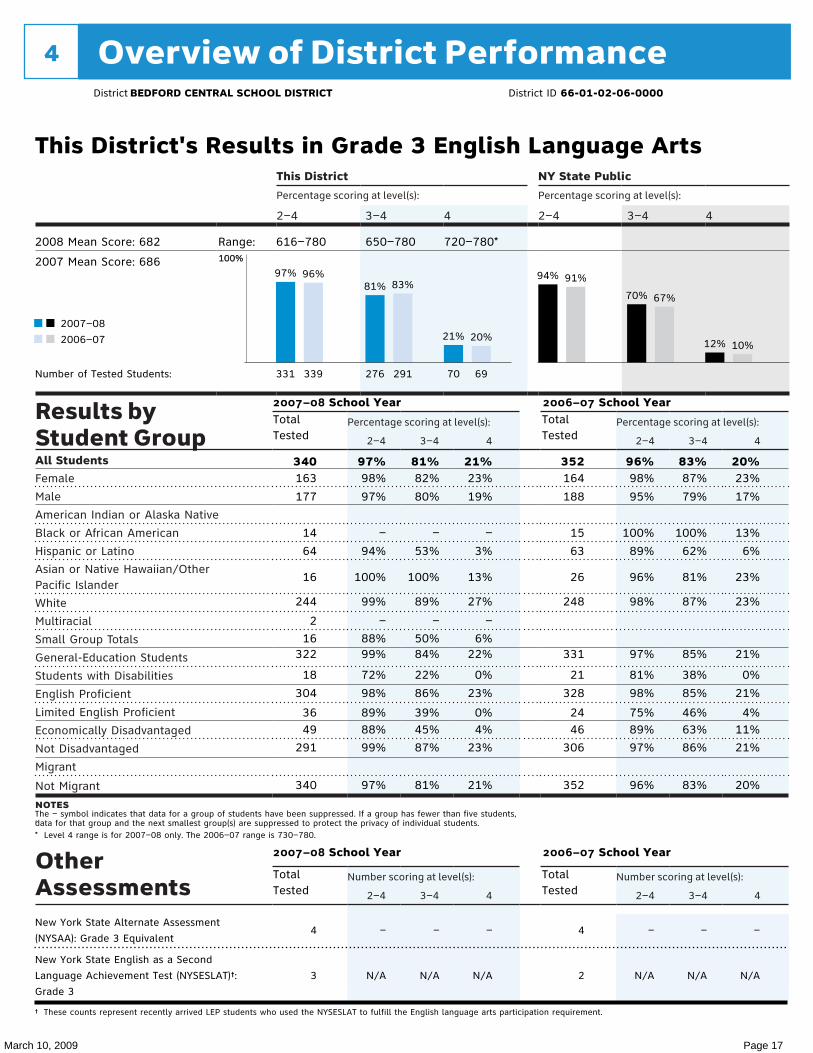
This District's Results in Grade 3 English Language Arts
2008 Mean Score: 682
2007 Mean Score: 686
Range: 616–780 650–780 720–780*
97% 96%81% 83%
21% 20%
94% 91%
70% 67%
12% 10%
Number of Tested Students: 331 276 70339 291 69
2007–08
2006–07
2007–08 School Year 2006–07 School YearTotalTested
TotalTested
340 97% 81% 21% 352 96% 83% 20%163
177
14
64
16
244
2
16322
18
304
3649
291
340
98%
97%
–
94%
100%
99%
–
88%99%
72%
98%
89%88%
99%
97%
82%
80%
–
53%
100%
89%
–
50%84%
22%
86%
39%45%
87%
81%
23%
19%
–
3%
13%
27%
–
6%22%
0%
23%
0%4%
23%
21%
164
188
15
63
26
248
331
21
328
2446
306
352
98%
95%
100%
89%
96%
98%
97%
81%
98%
75%89%
97%
96%
87%
79%
100%
62%
81%
87%
85%
38%
85%
46%63%
86%
83%
23%
17%
13%
6%
23%
23%
21%
0%
21%
4%11%
21%
20%
The – symbol indicates that data for a group of students have been suppressed. If a group has fewer than five students,data for that group and the next smallest group(s) are suppressed to protect the privacy of individual students.* Level 4 range is for 2007–08 only. The 2006–07 range is 730–780.
2007–08 School Year 2006–07 School Year
TotalTested
TotalTested
New York State Alternate Assessment
(NYSAA): Grade 3 Equivalent4 – – – 4 – – –
New York State English as a Second
Language Achievement Test (NYSESLAT)†:
Grade 3
3 N/A N/A N/A 2 N/A N/A N/A
† These counts represent recently arrived LEP students who used the NYSESLAT to fulfill the English language arts participation requirement.
March 10, 2009 Page 18
Overview of District Performance4
100%100%
Results by Student Group
Percentage scoring at level(s): Percentage scoring at level(s):
2–4 3–4 4 2–4 3–4 4
All StudentsFemale
Male
American Indian or Alaska Native
Black or African American
Hispanic or Latino
Asian or Native Hawaiian/Other Pacific Islander
White
Multiracial
Small Group Totals
General-Education Students
Students with Disabilities
English Proficient
Limited English Proficient
Economically Disadvantaged
Not Disadvantaged
Migrant
Not Migrant
notes ,
Other Assessments
Number scoring at level(s): Number scoring at level(s):
2–4 3–4 4 2–4 3–4 4
This District NY State Public
Percentage scoring at level(s): Percentage scoring at level(s):
2–4 3–4 4 2–4 3–4 4
District BEDFORD CENTRAL SCHOOL DISTRICT District ID 66-01-02-06-0000
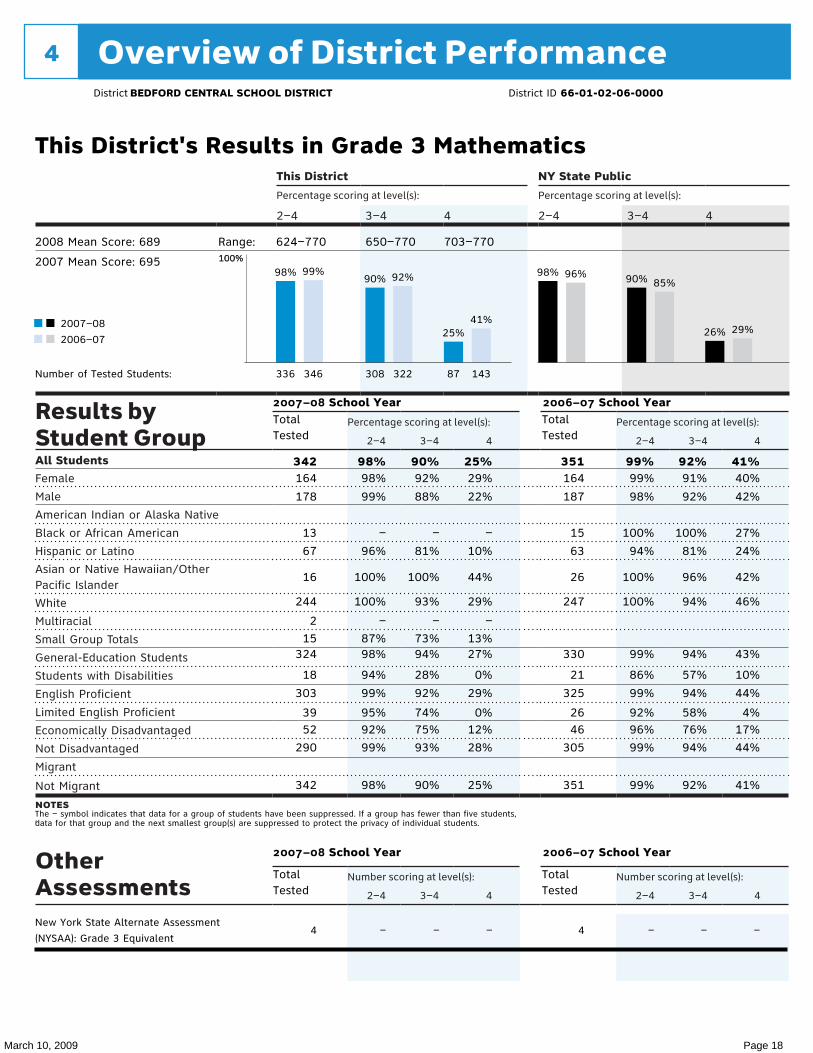
This District's Results in Grade 3 Mathematics
2008 Mean Score: 689
2007 Mean Score: 695
Range: 624–770 650–770 703–770
98% 99%90% 92%
25%41%
98% 96% 90% 85%
26% 29%
Number of Tested Students: 336 308 87346 322 143
2007–08
2006–07
2007–08 School Year 2006–07 School YearTotalTested
TotalTested
342 98% 90% 25% 351 99% 92% 41%164
178
13
67
16
244
2
15324
18
303
3952
290
342
98%
99%
–
96%
100%
100%
–
87%98%
94%
99%
95%92%
99%
98%
92%
88%
–
81%
100%
93%
–
73%94%
28%
92%
74%75%
93%
90%
29%
22%
–
10%
44%
29%
–
13%27%
0%
29%
0%12%
28%
25%
164
187
15
63
26
247
330
21
325
2646
305
351
99%
98%
100%
94%
100%
100%
99%
86%
99%
92%96%
99%
99%
91%
92%
100%
81%
96%
94%
94%
57%
94%
58%76%
94%
92%
40%
42%
27%
24%
42%
46%
43%
10%
44%
4%17%
44%
41%
The – symbol indicates that data for a group of students have been suppressed. If a group has fewer than five students,data for that group and the next smallest group(s) are suppressed to protect the privacy of individual students.
2007–08 School Year 2006–07 School Year
TotalTested
TotalTested
New York State Alternate Assessment
(NYSAA): Grade 3 Equivalent4 – – – 4 – – –
March 10, 2009 Page 19
Overview of District Performance4
100%100%
Results by Student Group
Percentage scoring at level(s): Percentage scoring at level(s):
2–4 3–4 4 2–4 3–4 4
All StudentsFemale
Male
American Indian or Alaska Native
Black or African American
Hispanic or Latino
Asian or Native Hawaiian/Other Pacific Islander
White
Multiracial
Small Group Totals
General-Education Students
Students with Disabilities
English Proficient
Limited English Proficient
Economically Disadvantaged
Not Disadvantaged
Migrant
Not Migrant
notes ,
Other Assessments
Number scoring at level(s): Number scoring at level(s):
2–4 3–4 4 2–4 3–4 4
This District NY State Public
Percentage scoring at level(s): Percentage scoring at level(s):
2–4 3–4 4 2–4 3–4 4
District BEDFORD CENTRAL SCHOOL DISTRICT District ID 66-01-02-06-0000
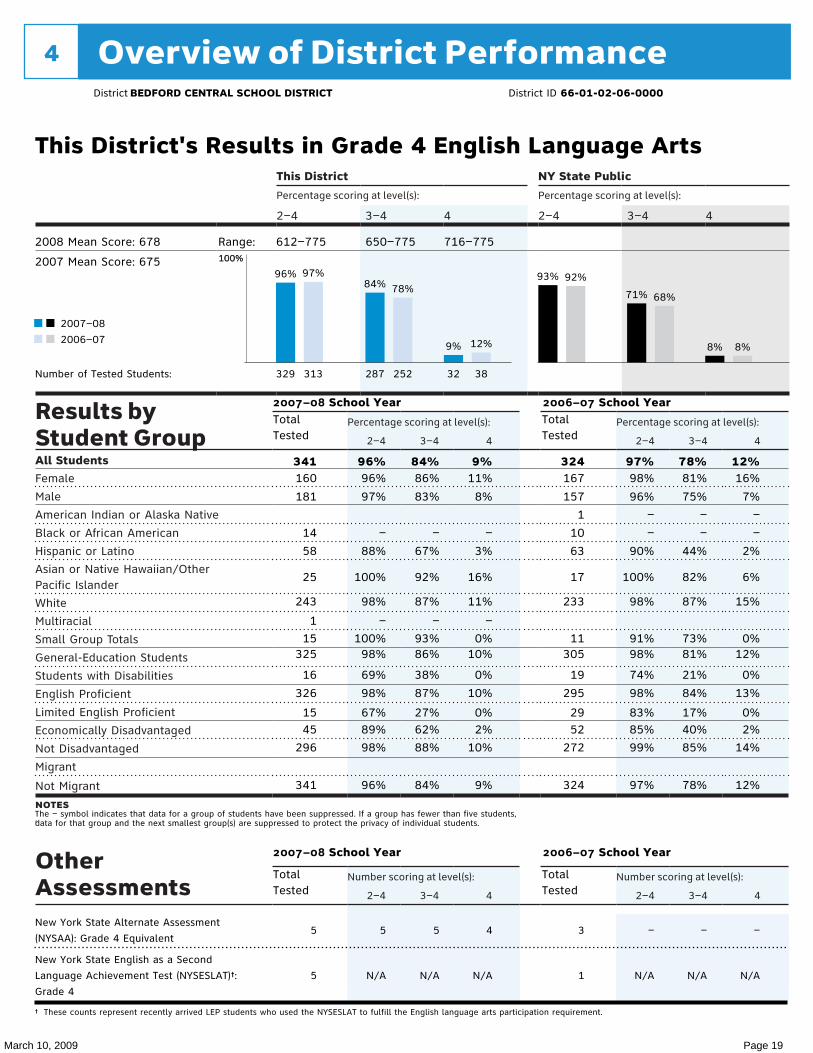
This District's Results in Grade 4 English Language Arts
2008 Mean Score: 678
2007 Mean Score: 675
Range: 612–775 650–775 716–775
96% 97%84% 78%
9% 12%
93% 92%
71% 68%
8% 8%
Number of Tested Students: 329 287 32313 252 38
2007–08
2006–07
2007–08 School Year 2006–07 School YearTotalTested
TotalTested
341 96% 84% 9% 324 97% 78% 12%160
181
14
58
25
243
1
15325
16
326
1545
296
341
96%
97%
–
88%
100%
98%
–
100%98%
69%
98%
67%89%
98%
96%
86%
83%
–
67%
92%
87%
–
93%86%
38%
87%
27%62%
88%
84%
11%
8%
–
3%
16%
11%
–
0%10%
0%
10%
0%2%
10%
9%
167
157
1
10
63
17
233
11305
19
295
2952
272
324
98%
96%
–
–
90%
100%
98%
91%98%
74%
98%
83%85%
99%
97%
81%
75%
–
–
44%
82%
87%
73%81%
21%
84%
17%40%
85%
78%
16%
7%
–
–
2%
6%
15%
0%12%
0%
13%
0%2%
14%
12%
The – symbol indicates that data for a group of students have been suppressed. If a group has fewer than five students,data for that group and the next smallest group(s) are suppressed to protect the privacy of individual students.
2007–08 School Year 2006–07 School Year
TotalTested
TotalTested
New York State Alternate Assessment
(NYSAA): Grade 4 Equivalent5 5 5 4 3 – – –
New York State English as a Second
Language Achievement Test (NYSESLAT)†:
Grade 4
5 N/A N/A N/A 1 N/A N/A N/A
† These counts represent recently arrived LEP students who used the NYSESLAT to fulfill the English language arts participation requirement.
March 10, 2009 Page 20
Overview of District Performance4
100%100%
Results by Student Group
Percentage scoring at level(s): Percentage scoring at level(s):
2–4 3–4 4 2–4 3–4 4
All StudentsFemale
Male
American Indian or Alaska Native
Black or African American
Hispanic or Latino
Asian or Native Hawaiian/Other Pacific Islander
White
Multiracial
Small Group Totals
General-Education Students
Students with Disabilities
English Proficient
Limited English Proficient
Economically Disadvantaged
Not Disadvantaged
Migrant
Not Migrant
notes ,
Other Assessments
Number scoring at level(s): Number scoring at level(s):
2–4 3–4 4 2–4 3–4 4
This District NY State Public
Percentage scoring at level(s): Percentage scoring at level(s):
2–4 3–4 4 2–4 3–4 4
District BEDFORD CENTRAL SCHOOL DISTRICT District ID 66-01-02-06-0000
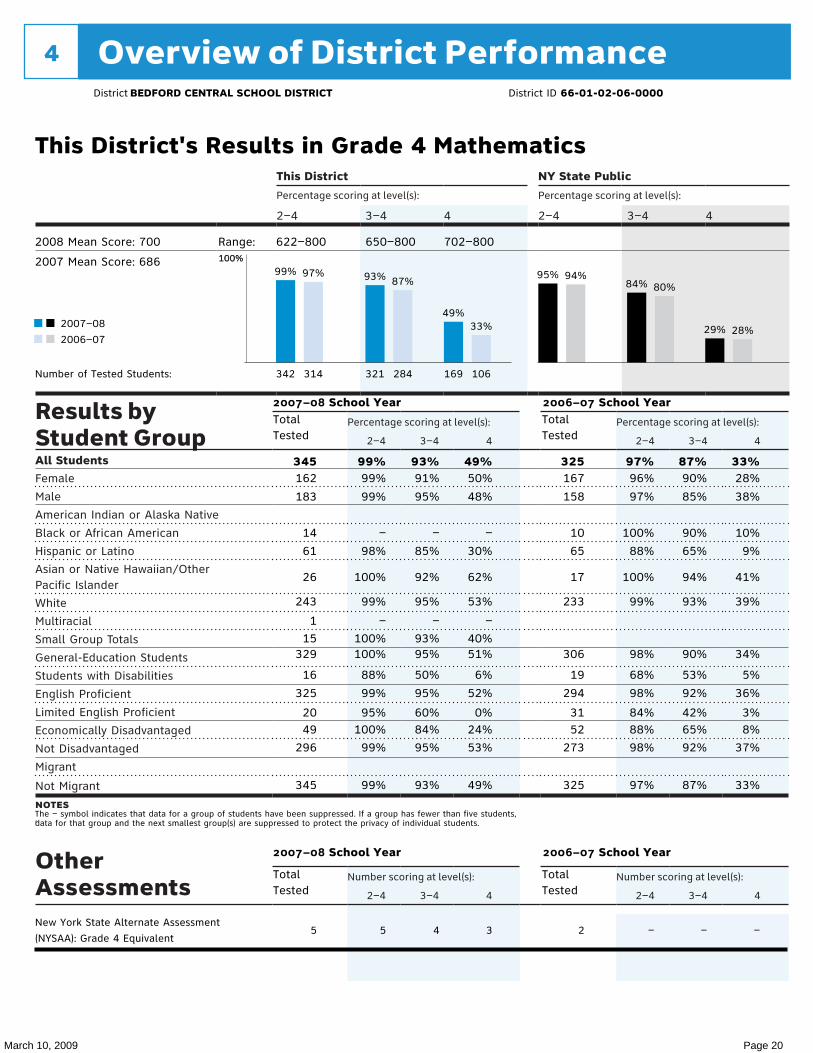
This District's Results in Grade 4 Mathematics
2008 Mean Score: 700
2007 Mean Score: 686
Range: 622–800 650–800 702–800
99% 97% 93% 87%
49%33%
95% 94%84% 80%
29% 28%
Number of Tested Students: 342 321 169314 284 106
2007–08
2006–07
2007–08 School Year 2006–07 School YearTotalTested
TotalTested
345 99% 93% 49% 325 97% 87% 33%162
183
14
61
26
243
1
15329
16
325
2049
296
345
99%
99%
–
98%
100%
99%
–
100%100%
88%
99%
95%100%
99%
99%
91%
95%
–
85%
92%
95%
–
93%95%
50%
95%
60%84%
95%
93%
50%
48%
–
30%
62%
53%
–
40%51%
6%
52%
0%24%
53%
49%
167
158
10
65
17
233
306
19
294
3152
273
325
96%
97%
100%
88%
100%
99%
98%
68%
98%
84%88%
98%
97%
90%
85%
90%
65%
94%
93%
90%
53%
92%
42%65%
92%
87%
28%
38%
10%
9%
41%
39%
34%
5%
36%
3%8%
37%
33%
The – symbol indicates that data for a group of students have been suppressed. If a group has fewer than five students,data for that group and the next smallest group(s) are suppressed to protect the privacy of individual students.
2007–08 School Year 2006–07 School Year
TotalTested
TotalTested
New York State Alternate Assessment
(NYSAA): Grade 4 Equivalent5 5 4 3 2 – – –
March 10, 2009 Page 21
Overview of District Performance4
100%100%
Results by Student Group
Percentage scoring at level(s): Percentage scoring at level(s):
2–4 3–4 4 2–4 3–4 4
All StudentsFemale
Male
American Indian or Alaska Native
Black or African American
Hispanic or Latino
Asian or Native Hawaiian/Other Pacific Islander
White
Multiracial
Small Group Totals
General-Education Students
Students with Disabilities
English Proficient
Limited English Proficient
Economically Disadvantaged
Not Disadvantaged
Migrant
Not Migrant
notes ,
Other Assessments
Number scoring at level(s): Number scoring at level(s):
2–4 3–4 4 2–4 3–4 4
This District NY State Public
Percentage scoring at level(s): Percentage scoring at level(s):
2–4 3–4 4 2–4 3–4 4
District BEDFORD CENTRAL SCHOOL DISTRICT District ID 66-01-02-06-0000
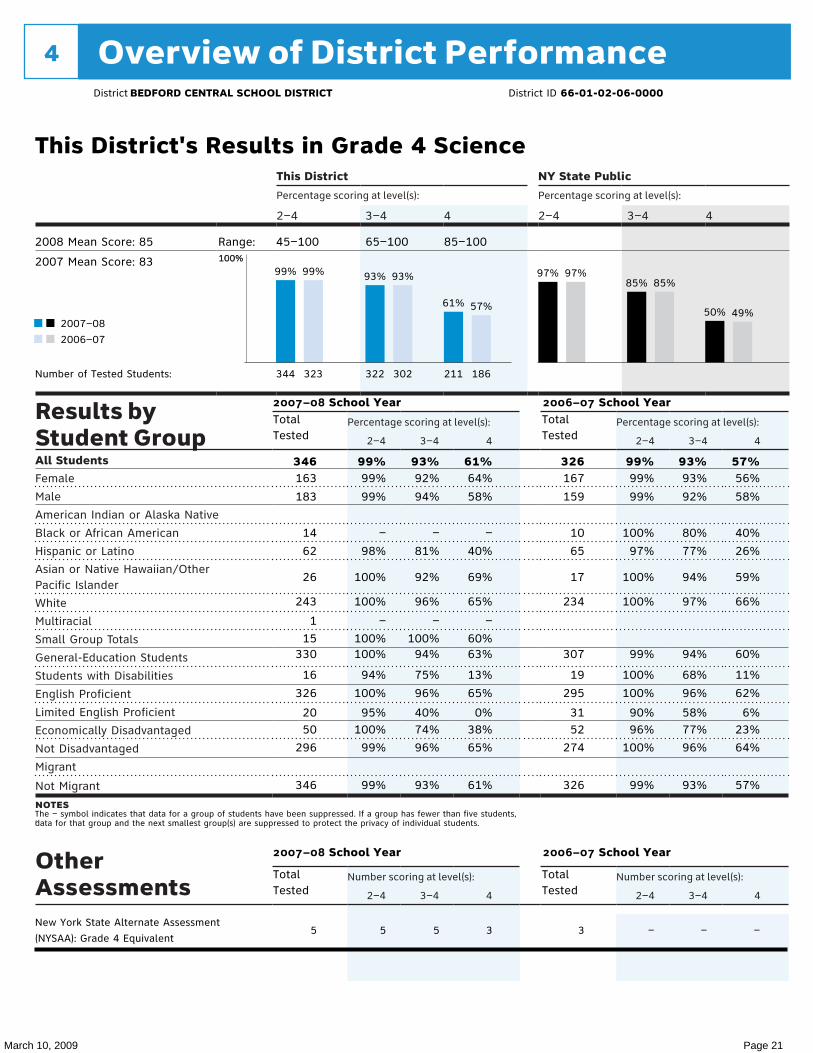
This District's Results in Grade 4 Science
2008 Mean Score: 85
2007 Mean Score: 83
Range: 45–100 65–100 85–100
99% 99% 93% 93%
61% 57%
97% 97%85% 85%
50% 49%
Number of Tested Students: 344 322 211323 302 186
2007–08
2006–07
2007–08 School Year 2006–07 School YearTotalTested
TotalTested
346 99% 93% 61% 326 99% 93% 57%163
183
14
62
26
243
1
15330
16
326
2050
296
346
99%
99%
–
98%
100%
100%
–
100%100%
94%
100%
95%100%
99%
99%
92%
94%
–
81%
92%
96%
–
100%94%
75%
96%
40%74%
96%
93%
64%
58%
–
40%
69%
65%
–
60%63%
13%
65%
0%38%
65%
61%
167
159
10
65
17
234
307
19
295
3152
274
326
99%
99%
100%
97%
100%
100%
99%
100%
100%
90%96%
100%
99%
93%
92%
80%
77%
94%
97%
94%
68%
96%
58%77%
96%
93%
56%
58%
40%
26%
59%
66%
60%
11%
62%
6%23%
64%
57%
The – symbol indicates that data for a group of students have been suppressed. If a group has fewer than five students,data for that group and the next smallest group(s) are suppressed to protect the privacy of individual students.
2007–08 School Year 2006–07 School Year
TotalTested
TotalTested
New York State Alternate Assessment
(NYSAA): Grade 4 Equivalent5 5 5 3 3 – – –
March 10, 2009 Page 22
Overview of District Performance4
100%100%
Results by Student Group
Percentage scoring at level(s): Percentage scoring at level(s):
2–4 3–4 4 2–4 3–4 4
All StudentsFemale
Male
American Indian or Alaska Native
Black or African American
Hispanic or Latino
Asian or Native Hawaiian/Other Pacific Islander
White
Multiracial
Small Group Totals
General-Education Students
Students with Disabilities
English Proficient
Limited English Proficient
Economically Disadvantaged
Not Disadvantaged
Migrant
Not Migrant
notes ,
Other Assessments
Number scoring at level(s): Number scoring at level(s):
2–4 3–4 4 2–4 3–4 4
This District NY State Public
Percentage scoring at level(s): Percentage scoring at level(s):
2–4 3–4 4 2–4 3–4 4
District BEDFORD CENTRAL SCHOOL DISTRICT District ID 66-01-02-06-0000
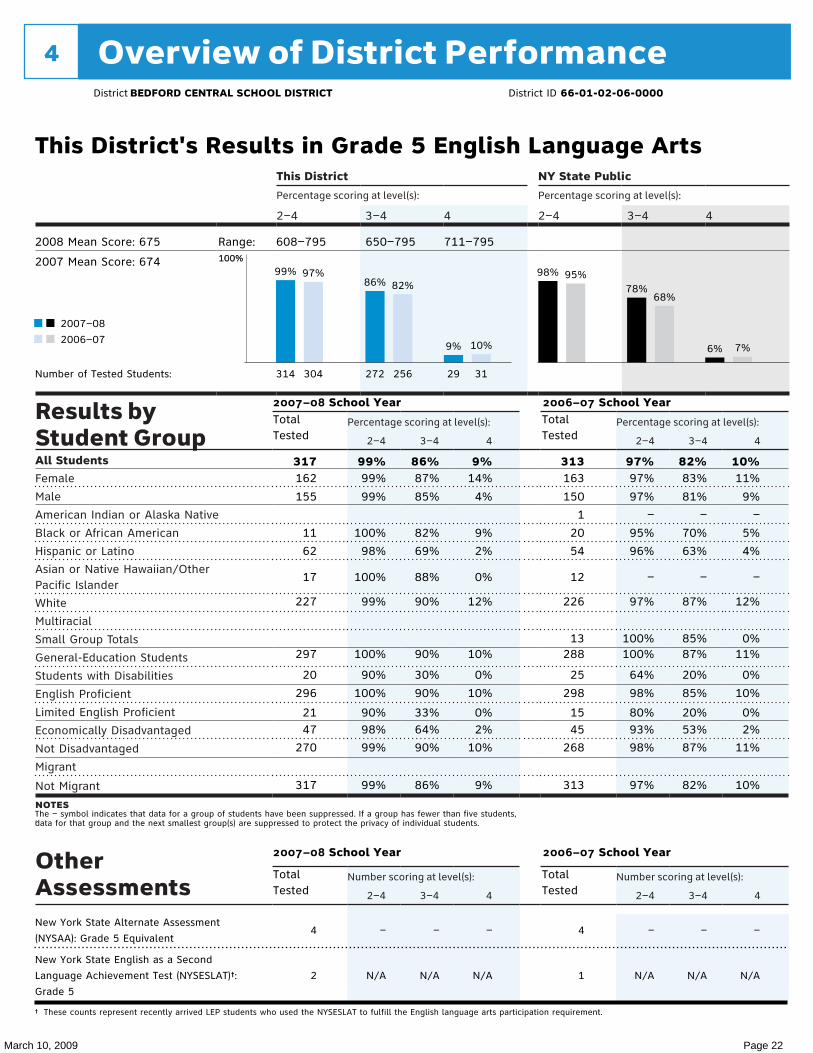
This District's Results in Grade 5 English Language Arts
2008 Mean Score: 675
2007 Mean Score: 674
Range: 608–795 650–795 711–795
99% 97%86% 82%
9% 10%
98% 95%78%
68%
6% 7%
Number of Tested Students: 314 272 29304 256 31
2007–08
2006–07
2007–08 School Year 2006–07 School YearTotalTested
TotalTested
317 99% 86% 9% 313 97% 82% 10%162
155
11
62
17
227
297
20
296
2147
270
317
99%
99%
100%
98%
100%
99%
100%
90%
100%
90%98%
99%
99%
87%
85%
82%
69%
88%
90%
90%
30%
90%
33%64%
90%
86%
14%
4%
9%
2%
0%
12%
10%
0%
10%
0%2%
10%
9%
163
150
1
20
54
12
226
13288
25
298
1545
268
313
97%
97%
–
95%
96%
–
97%
100%100%
64%
98%
80%93%
98%
97%
83%
81%
–
70%
63%
–
87%
85%87%
20%
85%
20%53%
87%
82%
11%
9%
–
5%
4%
–
12%
0%11%
0%
10%
0%2%
11%
10%
The – symbol indicates that data for a group of students have been suppressed. If a group has fewer than five students,data for that group and the next smallest group(s) are suppressed to protect the privacy of individual students.
2007–08 School Year 2006–07 School Year
TotalTested
TotalTested
New York State Alternate Assessment
(NYSAA): Grade 5 Equivalent4 – – – 4 – – –
New York State English as a Second
Language Achievement Test (NYSESLAT)†:
Grade 5
2 N/A N/A N/A 1 N/A N/A N/A
† These counts represent recently arrived LEP students who used the NYSESLAT to fulfill the English language arts participation requirement.
March 10, 2009 Page 23
Overview of District Performance4
100%100%
Results by Student Group
Percentage scoring at level(s): Percentage scoring at level(s):
2–4 3–4 4 2–4 3–4 4
All StudentsFemale
Male
American Indian or Alaska Native
Black or African American
Hispanic or Latino
Asian or Native Hawaiian/Other Pacific Islander
White
Multiracial
Small Group Totals
General-Education Students
Students with Disabilities
English Proficient
Limited English Proficient
Economically Disadvantaged
Not Disadvantaged
Migrant
Not Migrant
notes ,
Other Assessments
Number scoring at level(s): Number scoring at level(s):
2–4 3–4 4 2–4 3–4 4
This District NY State Public
Percentage scoring at level(s): Percentage scoring at level(s):
2–4 3–4 4 2–4 3–4 4
District BEDFORD CENTRAL SCHOOL DISTRICT District ID 66-01-02-06-0000
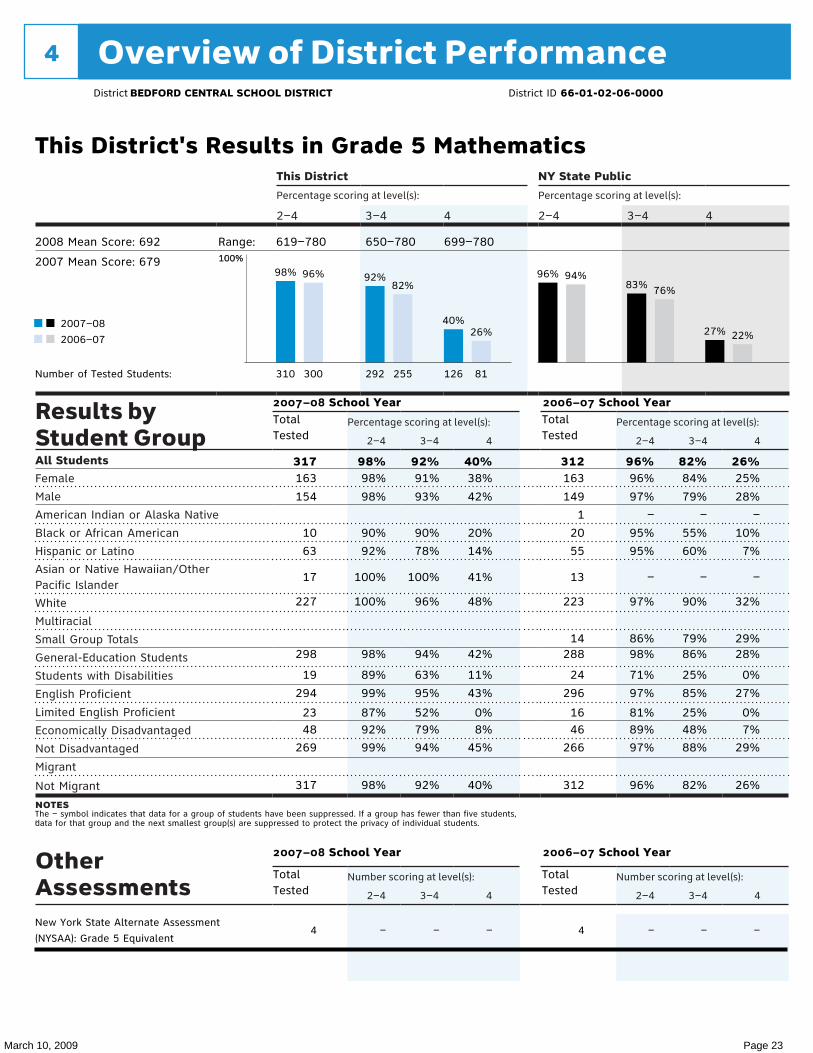
This District's Results in Grade 5 Mathematics
2008 Mean Score: 692
2007 Mean Score: 679
Range: 619–780 650–780 699–780
98% 96% 92%82%
40%26%
96% 94%83% 76%
27% 22%
Number of Tested Students: 310 292 126300 255 81
2007–08
2006–07
2007–08 School Year 2006–07 School YearTotalTested
TotalTested
317 98% 92% 40% 312 96% 82% 26%163
154
10
63
17
227
298
19
294
2348
269
317
98%
98%
90%
92%
100%
100%
98%
89%
99%
87%92%
99%
98%
91%
93%
90%
78%
100%
96%
94%
63%
95%
52%79%
94%
92%
38%
42%
20%
14%
41%
48%
42%
11%
43%
0%8%
45%
40%
163
149
1
20
55
13
223
14288
24
296
1646
266
312
96%
97%
–
95%
95%
–
97%
86%98%
71%
97%
81%89%
97%
96%
84%
79%
–
55%
60%
–
90%
79%86%
25%
85%
25%48%
88%
82%
25%
28%
–
10%
7%
–
32%
29%28%
0%
27%
0%7%
29%
26%
The – symbol indicates that data for a group of students have been suppressed. If a group has fewer than five students,data for that group and the next smallest group(s) are suppressed to protect the privacy of individual students.
2007–08 School Year 2006–07 School Year
TotalTested
TotalTested
New York State Alternate Assessment
(NYSAA): Grade 5 Equivalent4 – – – 4 – – –

March 10, 2009 Page 24
Overview of District Performance4
100%100%
Results by Student Group
Percentage scoring at level(s): Percentage scoring at level(s):
2–4 3–4 4 2–4 3–4 4
All StudentsFemale
Male
American Indian or Alaska Native
Black or African American
Hispanic or Latino
Asian or Native Hawaiian/Other Pacific Islander
White
Multiracial
Small Group Totals
General-Education Students
Students with Disabilities
English Proficient
Limited English Proficient
Economically Disadvantaged
Not Disadvantaged
Migrant
Not Migrant
notes ,
Other Assessments
Number scoring at level(s): Number scoring at level(s):
2–4 3–4 4 2–4 3–4 4
This District NY State Public
Percentage scoring at level(s): Percentage scoring at level(s):
2–4 3–4 4 2–4 3–4 4
District BEDFORD CENTRAL SCHOOL DISTRICT District ID 66-01-02-06-0000
This District's Results in Grade 6 English Language Arts
2008 Mean Score: 682
2007 Mean Score: 676
Range: 598–785 650–785 705–785
100% 99%86% 82%
16% 16%
98% 98%
67% 63%
5% 9%
Number of Tested Students: 305 261 50325 270 53
2007–08
2006–07
2007–08 School Year 2006–07 School YearTotalTested
TotalTested
305 100% 86% 16% 329 99% 82% 16%159
146
1
19
50
13
222
14285
20
294
1140
265
305
100%
100%
–
100%
100%
–
100%
100%100%
100%
100%
100%100%
100%
100%
88%
83%
–
63%
78%
–
90%
79%89%
30%
88%
27%68%
88%
86%
21%
12%
–
5%
8%
–
19%
14%18%
0%
17%
0%0%
19%
16%
153
176
1
13
59
13
243
14305
24
319
1046
283
329
99%
99%
–
100%
97%
–
99%
100%100%
83%
99%
100%96%
99%
99%
82%
82%
–
54%
51%
–
91%
57%86%
29%
84%
20%46%
88%
82%
21%
12%
–
8%
3%
–
18%
7%17%
0%
17%
0%0%
19%
16%
The – symbol indicates that data for a group of students have been suppressed. If a group has fewer than five students,data for that group and the next smallest group(s) are suppressed to protect the privacy of individual students.
2007–08 School Year 2006–07 School Year
TotalTested
TotalTested
New York State Alternate Assessment
(NYSAA): Grade 6 Equivalent5 5 4 1 6 6 6 6
New York State English as a Second
Language Achievement Test (NYSESLAT)†:
Grade 6
2 N/A N/A N/A 1 N/A N/A N/A
† These counts represent recently arrived LEP students who used the NYSESLAT to fulfill the English language arts participation requirement.
March 10, 2009 Page 25
Overview of District Performance4
100%100%
Results by Student Group
Percentage scoring at level(s): Percentage scoring at level(s):
2–4 3–4 4 2–4 3–4 4
All StudentsFemale
Male
American Indian or Alaska Native
Black or African American
Hispanic or Latino
Asian or Native Hawaiian/Other Pacific Islander
White
Multiracial
Small Group Totals
General-Education Students
Students with Disabilities
English Proficient
Limited English Proficient
Economically Disadvantaged
Not Disadvantaged
Migrant
Not Migrant
notes ,
Other Assessments
Number scoring at level(s): Number scoring at level(s):
2–4 3–4 4 2–4 3–4 4
This District NY State Public
Percentage scoring at level(s): Percentage scoring at level(s):
2–4 3–4 4 2–4 3–4 4
District BEDFORD CENTRAL SCHOOL DISTRICT District ID 66-01-02-06-0000
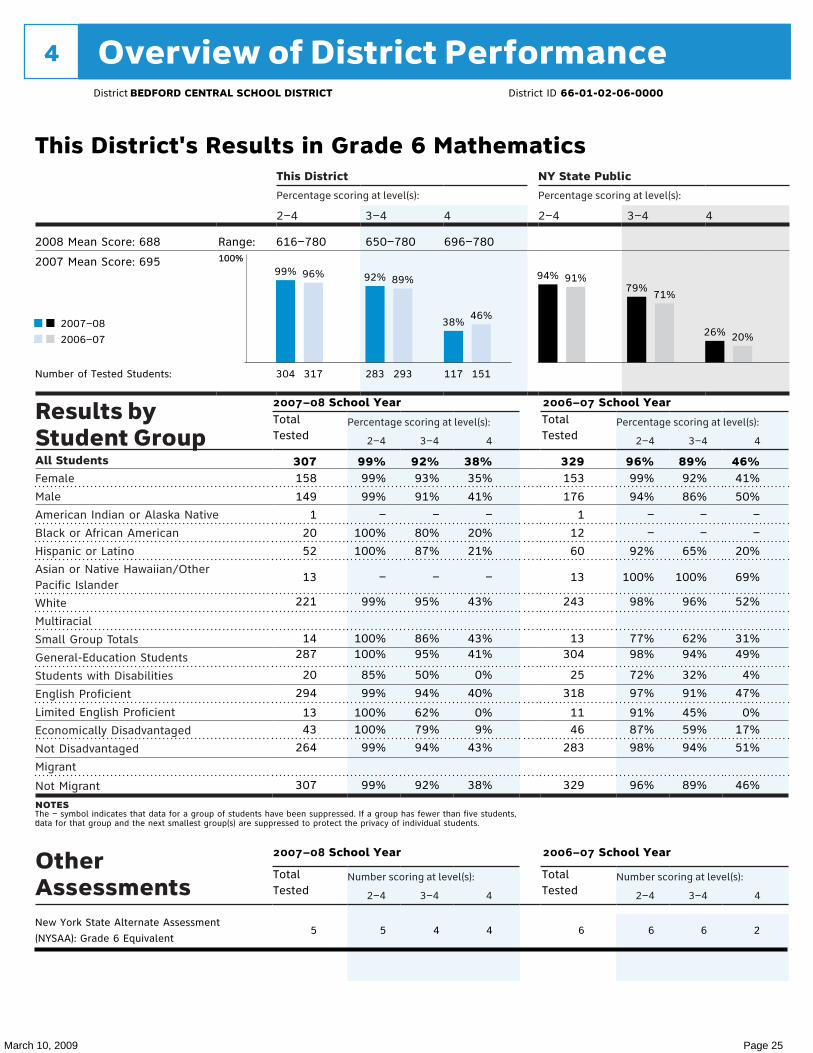
This District's Results in Grade 6 Mathematics
2008 Mean Score: 688
2007 Mean Score: 695
Range: 616–780 650–780 696–780
99% 96% 92% 89%
38%46%
94% 91%79%
71%
26% 20%
Number of Tested Students: 304 283 117317 293 151
2007–08
2006–07
2007–08 School Year 2006–07 School YearTotalTested
TotalTested
307 99% 92% 38% 329 96% 89% 46%158
149
1
20
52
13
221
14287
20
294
1343
264
307
99%
99%
–
100%
100%
–
99%
100%100%
85%
99%
100%100%
99%
99%
93%
91%
–
80%
87%
–
95%
86%95%
50%
94%
62%79%
94%
92%
35%
41%
–
20%
21%
–
43%
43%41%
0%
40%
0%9%
43%
38%
153
176
1
12
60
13
243
13304
25
318
1146
283
329
99%
94%
–
–
92%
100%
98%
77%98%
72%
97%
91%87%
98%
96%
92%
86%
–
–
65%
100%
96%
62%94%
32%
91%
45%59%
94%
89%
41%
50%
–
–
20%
69%
52%
31%49%
4%
47%
0%17%
51%
46%
The – symbol indicates that data for a group of students have been suppressed. If a group has fewer than five students,data for that group and the next smallest group(s) are suppressed to protect the privacy of individual students.
2007–08 School Year 2006–07 School Year
TotalTested
TotalTested
New York State Alternate Assessment
(NYSAA): Grade 6 Equivalent5 5 4 4 6 6 6 2

March 10, 2009 Page 26
Overview of District Performance4
100%100%
Results by Student Group
Percentage scoring at level(s): Percentage scoring at level(s):
2–4 3–4 4 2–4 3–4 4
All StudentsFemale
Male
American Indian or Alaska Native
Black or African American
Hispanic or Latino
Asian or Native Hawaiian/Other Pacific Islander
White
Multiracial
Small Group Totals
General-Education Students
Students with Disabilities
English Proficient
Limited English Proficient
Economically Disadvantaged
Not Disadvantaged
Migrant
Not Migrant
notes ,
Other Assessments
Number scoring at level(s): Number scoring at level(s):
2–4 3–4 4 2–4 3–4 4
This District NY State Public
Percentage scoring at level(s): Percentage scoring at level(s):
2–4 3–4 4 2–4 3–4 4
District BEDFORD CENTRAL SCHOOL DISTRICT District ID 66-01-02-06-0000
This District's Results in Grade 7 English Language Arts
2008 Mean Score: 672
2007 Mean Score: 669
Range: 600–790 650–790 712–790
100% 97%83% 76%
5% 9%
98% 94%
70%58%
3% 6%
Number of Tested Students: 328 273 18328 257 30
2007–08
2006–07
2007–08 School Year 2006–07 School YearTotalTested
TotalTested
329 100% 83% 5% 337 97% 76% 9%152
177
1
12
56
13
247
13304
25
323
641
288
329
100%
99%
–
–
98%
100%
100%
100%100%
96%
100%
100%98%
100%
100%
88%
79%
–
–
59%
85%
89%
62%88%
24%
84%
17%51%
88%
83%
6%
5%
–
–
2%
15%
6%
0%6%
0%
6%
0%0%
6%
5%
163
174
25
55
18
239
309
28
330
752
285
337
98%
97%
92%
93%
100%
99%
99%
82%
98%
71%90%
99%
97%
82%
71%
44%
49%
89%
85%
81%
21%
77%
29%38%
83%
76%
12%
6%
0%
2%
11%
11%
10%
0%
9%
0%2%
10%
9%
The – symbol indicates that data for a group of students have been suppressed. If a group has fewer than five students,data for that group and the next smallest group(s) are suppressed to protect the privacy of individual students.
2007–08 School Year 2006–07 School Year
TotalTested
TotalTested
New York State Alternate Assessment
(NYSAA): Grade 7 Equivalent8 8 8 8 7 7 7 6
New York State English as a Second
Language Achievement Test (NYSESLAT)†:
Grade 7
4 N/A N/A N/A 3 N/A N/A N/A
† These counts represent recently arrived LEP students who used the NYSESLAT to fulfill the English language arts participation requirement.

March 10, 2009 Page 27
Overview of District Performance4
100%100%
Results by Student Group
Percentage scoring at level(s): Percentage scoring at level(s):
2–4 3–4 4 2–4 3–4 4
All StudentsFemale
Male
American Indian or Alaska Native
Black or African American
Hispanic or Latino
Asian or Native Hawaiian/Other Pacific Islander
White
Multiracial
Small Group Totals
General-Education Students
Students with Disabilities
English Proficient
Limited English Proficient
Economically Disadvantaged
Not Disadvantaged
Migrant
Not Migrant
notes ,
Other Assessments
Number scoring at level(s): Number scoring at level(s):
2–4 3–4 4 2–4 3–4 4
This District NY State Public
Percentage scoring at level(s): Percentage scoring at level(s):
2–4 3–4 4 2–4 3–4 4
District BEDFORD CENTRAL SCHOOL DISTRICT District ID 66-01-02-06-0000
This District's Results in Grade 7 Mathematics
2008 Mean Score: 701
2007 Mean Score: 677
Range: 611–800 650–800 693–800
98% 97% 93%83%
55%
33%
96% 93%79%
67%
28%18%
Number of Tested Students: 327 308 181327 280 111
2007–08
2006–07
2007–08 School Year 2006–07 School YearTotalTested
TotalTested
332 98% 93% 55% 336 97% 83% 33%155
177
1
13
58
13
247
14307
25
323
942
290
332
99%
98%
–
100%
95%
–
99%
100%99%
92%
99%
78%98%
99%
98%
93%
93%
–
69%
74%
–
98%
71%95%
68%
94%
44%76%
95%
93%
51%
58%
–
38%
17%
–
63%
43%58%
16%
56%
0%14%
60%
55%
161
175
25
57
18
236
309
27
326
1053
283
336
98%
97%
88%
93%
100%
99%
99%
81%
98%
80%91%
99%
97%
84%
82%
60%
56%
100%
91%
88%
33%
85%
30%49%
90%
83%
33%
33%
12%
7%
61%
39%
36%
0%
34%
0%8%
38%
33%
The – symbol indicates that data for a group of students have been suppressed. If a group has fewer than five students,data for that group and the next smallest group(s) are suppressed to protect the privacy of individual students.
2007–08 School Year 2006–07 School Year
TotalTested
TotalTested
New York State Alternate Assessment
(NYSAA): Grade 7 Equivalent8 8 8 6 7 7 7 5
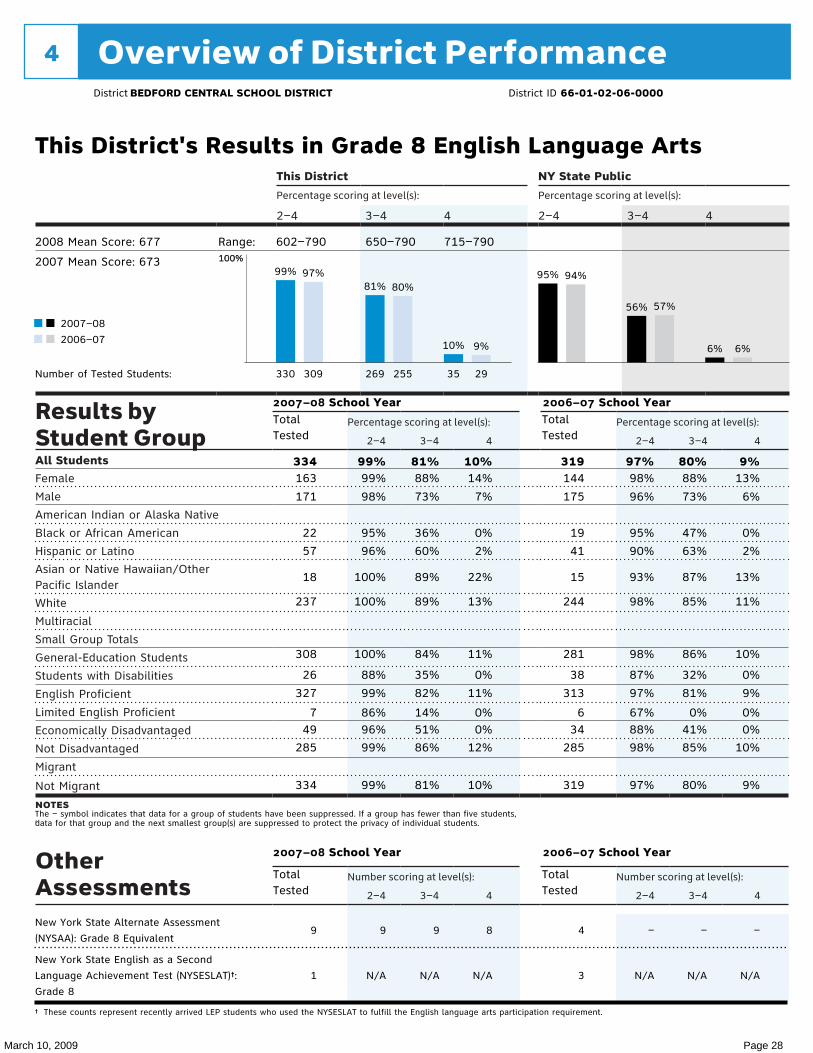
March 10, 2009 Page 28
Overview of District Performance4
100%100%
Results by Student Group
Percentage scoring at level(s): Percentage scoring at level(s):
2–4 3–4 4 2–4 3–4 4
All StudentsFemale
Male
American Indian or Alaska Native
Black or African American
Hispanic or Latino
Asian or Native Hawaiian/Other Pacific Islander
White
Multiracial
Small Group Totals
General-Education Students
Students with Disabilities
English Proficient
Limited English Proficient
Economically Disadvantaged
Not Disadvantaged
Migrant
Not Migrant
notes ,
Other Assessments
Number scoring at level(s): Number scoring at level(s):
2–4 3–4 4 2–4 3–4 4
This District NY State Public
Percentage scoring at level(s): Percentage scoring at level(s):
2–4 3–4 4 2–4 3–4 4
District BEDFORD CENTRAL SCHOOL DISTRICT District ID 66-01-02-06-0000
This District's Results in Grade 8 English Language Arts
2008 Mean Score: 677
2007 Mean Score: 673
Range: 602–790 650–790 715–790
99% 97%81% 80%
10% 9%
95% 94%
56% 57%
6% 6%
Number of Tested Students: 330 269 35309 255 29
2007–08
2006–07
2007–08 School Year 2006–07 School YearTotalTested
TotalTested
334 99% 81% 10% 319 97% 80% 9%163
171
22
57
18
237
308
26
327
749
285
334
99%
98%
95%
96%
100%
100%
100%
88%
99%
86%96%
99%
99%
88%
73%
36%
60%
89%
89%
84%
35%
82%
14%51%
86%
81%
14%
7%
0%
2%
22%
13%
11%
0%
11%
0%0%
12%
10%
144
175
19
41
15
244
281
38
313
634
285
319
98%
96%
95%
90%
93%
98%
98%
87%
97%
67%88%
98%
97%
88%
73%
47%
63%
87%
85%
86%
32%
81%
0%41%
85%
80%
13%
6%
0%
2%
13%
11%
10%
0%
9%
0%0%
10%
9%
The – symbol indicates that data for a group of students have been suppressed. If a group has fewer than five students,data for that group and the next smallest group(s) are suppressed to protect the privacy of individual students.
2007–08 School Year 2006–07 School Year
TotalTested
TotalTested
New York State Alternate Assessment
(NYSAA): Grade 8 Equivalent9 9 9 8 4 – – –
New York State English as a Second
Language Achievement Test (NYSESLAT)†:
Grade 8
1 N/A N/A N/A 3 N/A N/A N/A
† These counts represent recently arrived LEP students who used the NYSESLAT to fulfill the English language arts participation requirement.
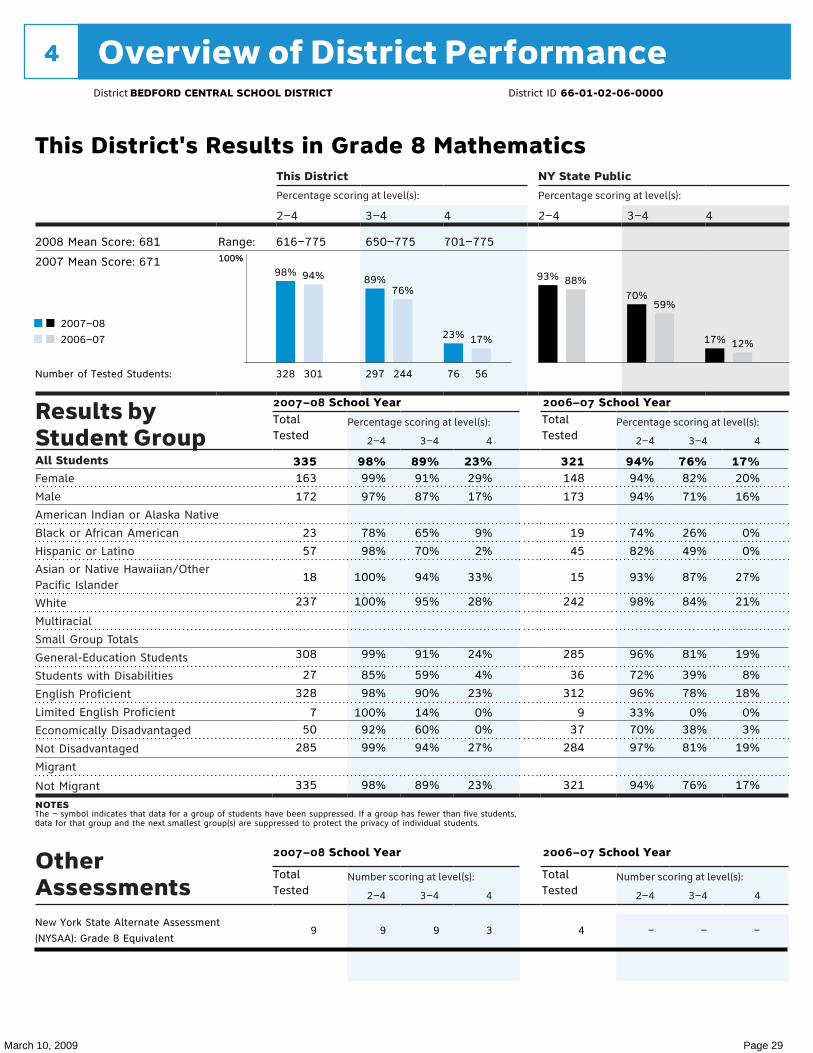
March 10, 2009 Page 29
Overview of District Performance4
100%100%
Results by Student Group
Percentage scoring at level(s): Percentage scoring at level(s):
2–4 3–4 4 2–4 3–4 4
All StudentsFemale
Male
American Indian or Alaska Native
Black or African American
Hispanic or Latino
Asian or Native Hawaiian/Other Pacific Islander
White
Multiracial
Small Group Totals
General-Education Students
Students with Disabilities
English Proficient
Limited English Proficient
Economically Disadvantaged
Not Disadvantaged
Migrant
Not Migrant
notes ,
Other Assessments
Number scoring at level(s): Number scoring at level(s):
2–4 3–4 4 2–4 3–4 4
This District NY State Public
Percentage scoring at level(s): Percentage scoring at level(s):
2–4 3–4 4 2–4 3–4 4
District BEDFORD CENTRAL SCHOOL DISTRICT District ID 66-01-02-06-0000
This District's Results in Grade 8 Mathematics
2008 Mean Score: 681
2007 Mean Score: 671
Range: 616–775 650–775 701–775
98% 94% 89%76%
23% 17%
93% 88%70%
59%
17% 12%
Number of Tested Students: 328 297 76301 244 56
2007–08
2006–07
2007–08 School Year 2006–07 School YearTotalTested
TotalTested
335 98% 89% 23% 321 94% 76% 17%163
172
23
57
18
237
308
27
328
750
285
335
99%
97%
78%
98%
100%
100%
99%
85%
98%
100%92%
99%
98%
91%
87%
65%
70%
94%
95%
91%
59%
90%
14%60%
94%
89%
29%
17%
9%
2%
33%
28%
24%
4%
23%
0%0%
27%
23%
148
173
19
45
15
242
285
36
312
937
284
321
94%
94%
74%
82%
93%
98%
96%
72%
96%
33%70%
97%
94%
82%
71%
26%
49%
87%
84%
81%
39%
78%
0%38%
81%
76%
20%
16%
0%
0%
27%
21%
19%
8%
18%
0%3%
19%
17%
The – symbol indicates that data for a group of students have been suppressed. If a group has fewer than five students,data for that group and the next smallest group(s) are suppressed to protect the privacy of individual students.
2007–08 School Year 2006–07 School Year
TotalTested
TotalTested
New York State Alternate Assessment
(NYSAA): Grade 8 Equivalent9 9 9 3 4 – – –
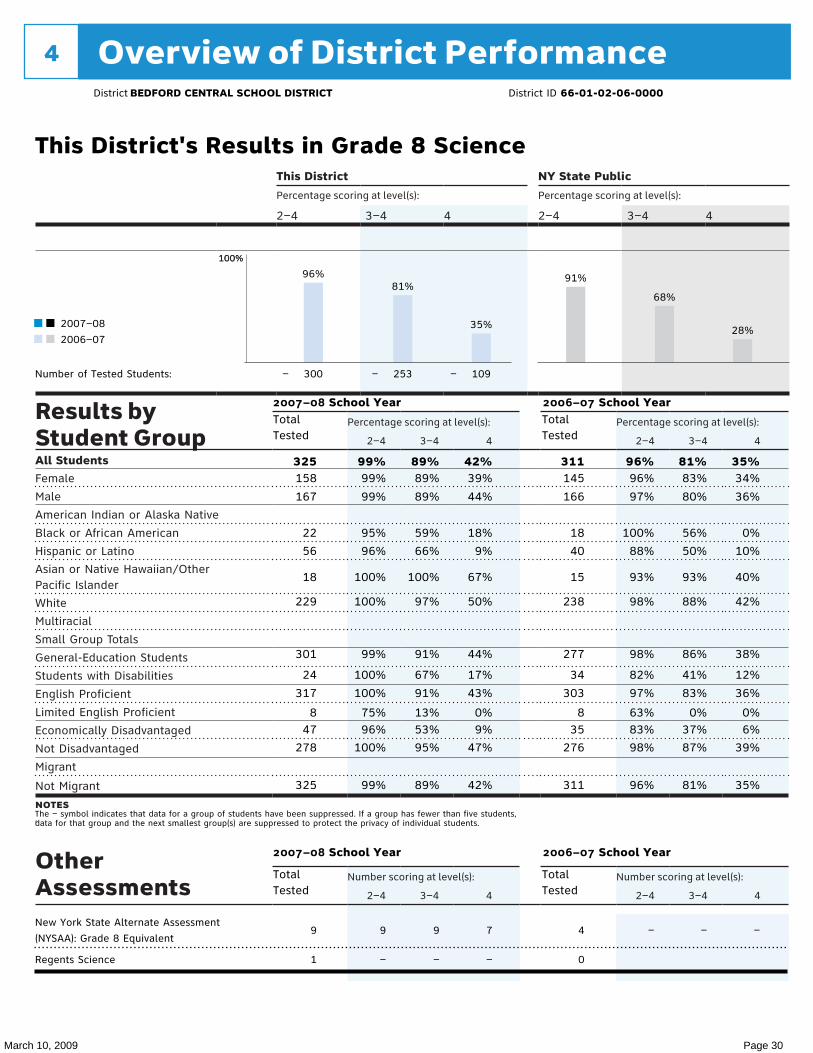
March 10, 2009 Page 30
Overview of District Performance4
100%100%
Results by Student Group
Percentage scoring at level(s): Percentage scoring at level(s):
2–4 3–4 4 2–4 3–4 4
All StudentsFemale
Male
American Indian or Alaska Native
Black or African American
Hispanic or Latino
Asian or Native Hawaiian/Other Pacific Islander
White
Multiracial
Small Group Totals
General-Education Students
Students with Disabilities
English Proficient
Limited English Proficient
Economically Disadvantaged
Not Disadvantaged
Migrant
Not Migrant
notes ,
Other Assessments
Number scoring at level(s): Number scoring at level(s):
2–4 3–4 4 2–4 3–4 4
This District NY State Public
Percentage scoring at level(s): Percentage scoring at level(s):
2–4 3–4 4 2–4 3–4 4
District BEDFORD CENTRAL SCHOOL DISTRICT District ID 66-01-02-06-0000
This District's Results in Grade 8 Science
96%81%
35%
91%
68%
28%
Number of Tested Students: – – –300 253 109
2007–08
2006–07
2007–08 School Year 2006–07 School YearTotalTested
TotalTested
325 99% 89% 42% 311 96% 81% 35%158
167
22
56
18
229
301
24
317
847
278
325
99%
99%
95%
96%
100%
100%
99%
100%
100%
75%96%
100%
99%
89%
89%
59%
66%
100%
97%
91%
67%
91%
13%53%
95%
89%
39%
44%
18%
9%
67%
50%
44%
17%
43%
0%9%
47%
42%
145
166
18
40
15
238
277
34
303
835
276
311
96%
97%
100%
88%
93%
98%
98%
82%
97%
63%83%
98%
96%
83%
80%
56%
50%
93%
88%
86%
41%
83%
0%37%
87%
81%
34%
36%
0%
10%
40%
42%
38%
12%
36%
0%6%
39%
35%
The – symbol indicates that data for a group of students have been suppressed. If a group has fewer than five students,data for that group and the next smallest group(s) are suppressed to protect the privacy of individual students.
2007–08 School Year 2006–07 School Year
TotalTested
TotalTested
New York State Alternate Assessment
(NYSAA): Grade 8 Equivalent9 9 9 7 4 – – –
Regents Science 1 – – – 0
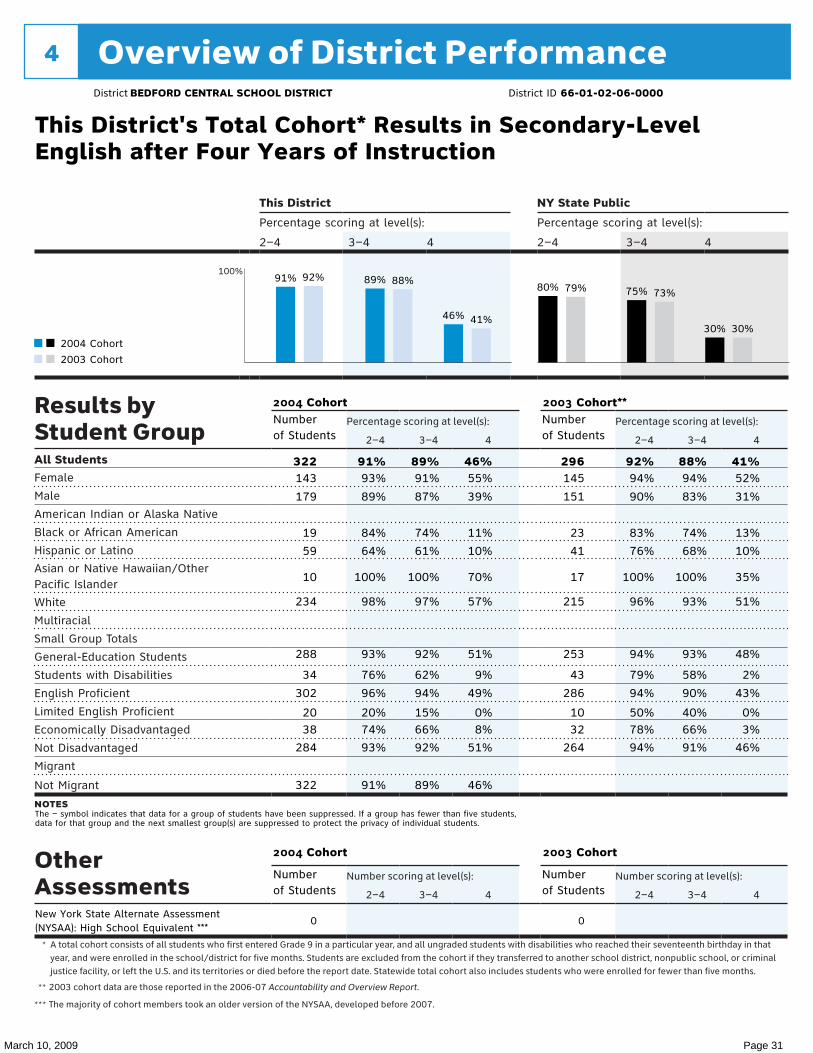
March 10, 2009 Page 31
Overview of District Performance4
This District NY State Public
Percentage scoring at level(s): Percentage scoring at level(s):
2–4 3–4 4 2–4 3–4 4
Results by Student Group
Percentage scoring at level(s): Percentage scoring at level(s):
2–4 3–4 4 2–4 3–4 4
All StudentsFemale
Male
American Indian or Alaska Native
Black or African American
Hispanic or Latino
Asian or Native Hawaiian/Other Pacific Islander
White
Multiracial
Small Group Totals
General-Education Students
Students with Disabilities
English Proficient
Limited English Proficient
Economically Disadvantaged
Not Disadvantaged
Migrant
Not Migrant
notes
Other Assessments
Number scoring at level(s): Number scoring at level(s):
2–4 3–4 4 2–4 3–4 4
100%
* A total cohort consists of all students who first entered Grade 9 in a particular year, and all ungraded students with disabilities who reached their seventeenth birthday in that year, and were enrolled in the school/district for five months. Students are excluded from the cohort if they transferred to another school district, nonpublic school, or criminal justice facility, or left the U.S. and its territories or died before the report date. Statewide total cohort also includes students who were enrolled for fewer than five months.
** 2003 cohort data are those reported in the 2006-07 Accountability and Overview Report.
*** The majority of cohort members took an older version of the NYSAA, developed before 2007.
District BEDFORD CENTRAL SCHOOL DISTRICT District ID 66-01-02-06-0000
This District's Total Cohort* Results in Secondary-LevelEnglish after Four Years of Instruction
91% 92% 89% 88%
46% 41%
80% 79% 75% 73%
30% 30%2004 Cohort
2003 Cohort
2004 Cohort 2003 Cohort**Numberof Students
Numberof Students
322 91% 89% 46% 296 92% 88% 41%143
179
19
59
10
234
288
34
302
2038
284
322
93%
89%
84%
64%
100%
98%
93%
76%
96%
20%74%
93%
91%
91%
87%
74%
61%
100%
97%
92%
62%
94%
15%66%
92%
89%
55%
39%
11%
10%
70%
57%
51%
9%
49%
0%8%
51%
46%
145
151
23
41
17
215
253
43
286
1032
264
94%
90%
83%
76%
100%
96%
94%
79%
94%
50%78%
94%
94%
83%
74%
68%
100%
93%
93%
58%
90%
40%66%
91%
52%
31%
13%
10%
35%
51%
48%
2%
43%
0%3%
46%
The – symbol indicates that data for a group of students have been suppressed. If a group has fewer than five students,data for that group and the next smallest group(s) are suppressed to protect the privacy of individual students.
2004 Cohort 2003 Cohort
Numberof Students
Numberof Students
New York State Alternate Assessment(NYSAA): High School Equivalent ***
0 0
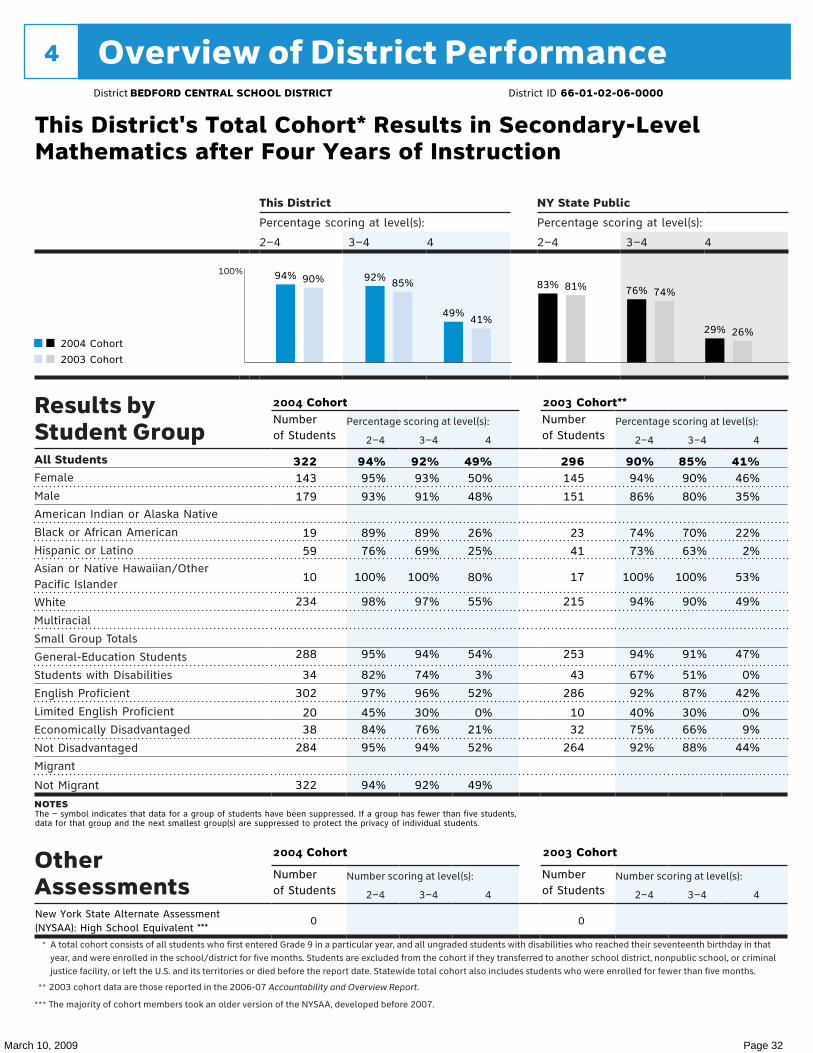
March 10, 2009 Page 32
Overview of District Performance4
This District NY State Public
Percentage scoring at level(s): Percentage scoring at level(s):
2–4 3–4 4 2–4 3–4 4
Results by Student Group
Percentage scoring at level(s): Percentage scoring at level(s):
2–4 3–4 4 2–4 3–4 4
All StudentsFemale
Male
American Indian or Alaska Native
Black or African American
Hispanic or Latino
Asian or Native Hawaiian/Other Pacific Islander
White
Multiracial
Small Group Totals
General-Education Students
Students with Disabilities
English Proficient
Limited English Proficient
Economically Disadvantaged
Not Disadvantaged
Migrant
Not Migrant
notes
Other Assessments
Number scoring at level(s): Number scoring at level(s):
2–4 3–4 4 2–4 3–4 4
100%
* A total cohort consists of all students who first entered Grade 9 in a particular year, and all ungraded students with disabilities who reached their seventeenth birthday in that year, and were enrolled in the school/district for five months. Students are excluded from the cohort if they transferred to another school district, nonpublic school, or criminal justice facility, or left the U.S. and its territories or died before the report date. Statewide total cohort also includes students who were enrolled for fewer than five months.
** 2003 cohort data are those reported in the 2006-07 Accountability and Overview Report.
*** The majority of cohort members took an older version of the NYSAA, developed before 2007.
District BEDFORD CENTRAL SCHOOL DISTRICT District ID 66-01-02-06-0000
This District's Total Cohort* Results in Secondary-LevelMathematics after Four Years of Instruction
94% 90% 92% 85%
49%41%
83% 81% 76% 74%
29% 26%2004 Cohort
2003 Cohort
2004 Cohort 2003 Cohort**Numberof Students
Numberof Students
322 94% 92% 49% 296 90% 85% 41%143
179
19
59
10
234
288
34
302
2038
284
322
95%
93%
89%
76%
100%
98%
95%
82%
97%
45%84%
95%
94%
93%
91%
89%
69%
100%
97%
94%
74%
96%
30%76%
94%
92%
50%
48%
26%
25%
80%
55%
54%
3%
52%
0%21%
52%
49%
145
151
23
41
17
215
253
43
286
1032
264
94%
86%
74%
73%
100%
94%
94%
67%
92%
40%75%
92%
90%
80%
70%
63%
100%
90%
91%
51%
87%
30%66%
88%
46%
35%
22%
2%
53%
49%
47%
0%
42%
0%9%
44%
The – symbol indicates that data for a group of students have been suppressed. If a group has fewer than five students,data for that group and the next smallest group(s) are suppressed to protect the privacy of individual students.
2004 Cohort 2003 Cohort
Numberof Students
Numberof Students
New York State Alternate Assessment(NYSAA): High School Equivalent ***
0 0