the new york noncustodial parent eitc: its impact on child
TRANSCRIPT

The New York Noncustodial Parent EITC: Its Impact on Child Support Payments and Employment
Austin Nichols, Elaine Sorensen, and Kye Lippold The Urban Institute
June 27, 2012
Support for this research was provided by the Federal Office of Child Support Enforcement under grant number 90FI0096 and by the Smith Richardson Foundation under grant number 2009-8692. The views expressed in this paper are those of the authors and do not necessarily reflect the views of the New York Office of Temporary and Disability Assistance, the New York Department of Taxation and Finance, the Urban Institute, its trustees, or its funders. The authors thank the New York Office of Temporary and Disability Assistance for providing the data used in this paper and for providing useful comments on earlier drafts.

i
Table of Contents
Executive Summary .......................................................................................................... iii
I. Introduction .................................................................................................................... 1
II. Policy Intervention ....................................................................................................... 2
A. The Federal EITC .............................................................................................................................. 2
B. The New York State EITC ................................................................................................................ 2
C. The Noncustodial Parent EITC ....................................................................................................... 3
III. Potential Incentive Effect of the Noncustodial Parent EITC.................................. 5
IV. Study Findings ............................................................................................................. 6
A. Trends in Eligibility, Receipt, and Average Benefit ...................................................................... 6
B. Profiles of Noncustodial Parents ..................................................................................................... 8
C. Regression Results ........................................................................................................................ 13
V. Conclusions .................................................................................................................. 19
VI. References .................................................................................................................. 21
VII. Appendices ............................................................................................................... 22
A. Methodology Used to Produce the Regression Results ............................................................ 22
B. Data Used in the Report ................................................................................................................. 24
C. Appendix Tables .............................................................................................................................. 27

ii
List of Figures and Tables
FIGURES Figure 1. Value of the NCP EITC and the NYS EITC for Single Filers, 2009 .................. 4
Figure 2. Proportion of Noncustodial Parents who Paid their Child Support in Full by Age of Youngest Child, All Orders, 2007–09 .............................................. 13
TABLES Table 1. Noncustodial Parents Eligible For and Receiving the NCP EITC, 2006–09 ........ 7
Table 2. Demographic Characteristics of Specific Groups of Noncustodial Parents in New York, 2009 ............................................................................................. 10
Table 3.Economic Characteristics of Specific Groups of Noncustodial Parents in New York, 2009 ............................................................................................. 11
Table 4. Estimated Discontinuity in the Proportion Paying in Full at Age 18 by Year .... 14
Table 5. Estimated Discontinuity in the Proportion Paying in Full, the Proportion Eligible for a Net Benefit from the NCP EITC, the Amount of the Net Benefit, and Their Associated Local Wald Estimators ...................................... 16
Table 6. Estimated Discontinuities for the Amount of Child Support Paid and Whether Noncustodial Parents Earned More than $3,000 a Year .............. 17
Table 7. Estimated Discontinuities for Three Outcome Variables, Ordered Amount Less than $3,000 a Year ....................................................................... 17
Table 8. Local Wald Estimators (LWE) for Three Outcome Variables, Ordered Amount Less than $3,000 a Year ....................................................................... 18

iii
Executive Summary
In 2006, New York instituted a new earned income tax credit (EITC) for low-income noncustodial parents to encourage them to work and pay child support, building on the success of the New York State EITC first enacted in 1994. The original New York State EITC has been credited with reducing poverty among low-income working families while motivating them to work and reduce their reliance on public assistance. Based on this positive experience with the state EITC, the New York Legislature decided to expand the EITC to low-income noncustodial parents who pay their full child support, creating a noncustodial parent EITC (NCP EITC). This credit is similar to other New York State EITCs; it is a refundable tax credit available to those who file a New York state income tax return and meet certain eligibility criteria. The credit aims to motivate low-income noncustodial parents to work and pay their child support in full.
This study examines whether the NCP EITC encouraged work and child support payments during its first few years. First, we review the number of noncustodial parents who received the NCP EITC, which increased 50 percent from 2006 (the first year of the credit) to 2010 (the latest year in which data are available). While several factors have contributed to this increase, greater awareness of the credit appears to be playing a role.
• In 2006, the first year of the tax credit, just over 5,100 noncustodial parents received the tax credit; by 2010, this number exceeded 7,700, a 50 percent increase.
We also describe the characteristics of noncustodial parents who received the NCP EITC in 2009, the latest year for which case-level data are available. We find that most recipients are white males, and their median age is 36 years old. Nearly 60 percent of these parents owe child support for just one child. Their median reported income is $20,717. The median amount of child support paid is $3,628. Just over 40 percent of the recipients (42 percent) owe child support arrears; the median amount of arrears owed is $409.
• Most recipients of the tax credit are white males who owe child support for one child.
To evaluate the NCP EITC’s impact, we use a rigorous method called a regression discontinuity model. This method takes advantage of a discontinuity in the eligibility for the NCP EITC to measure its effect. Specifically, we exploit the fact that individuals are eligible for the NCP EITC if they have children under 18 years old for whom they owe child support. In New York, nearly all parents are obligated to pay child support for their children until they turn 21. So, if we see that child support payments (or work) fall significantly as children turn 18, this suggests that the NCP EITC may be affecting these outcomes. We also examine these discontinuities before the NCP EITC was enacted to see whether they existed before the tax credit.
Using this method, we find that the NCP EITC increased the proportion of noncustodial parents paying their child support in full by approximately 1 percentage point. In 2009, 56 percent of noncustodial parents in New York who had a child support order for at least half the year paid

iv
their child support in full. Because of the NCP EITC, this figure is 1 percentage point higher than it would otherwise be, meaning about 2,300 more parents paid their child support in full.
• The Noncustodial Parent EITC increased the percent of noncustodial parents paying their child support in full by one percentage point, adding 2,300 full paying parents.
As noted above, the aim of the NCP EITC is to encourage work and child support payments among low-income noncustodial parents. Thus, it is not surprising that the impact of the credit is relatively small among all noncustodial parents regardless of their income level. The question is: What impact did it have on low-income noncustodial parents? Unfortunately, we cannot limit our impact analysis to low-income noncustodial parents because the credit influences the decision to work and the amount earned. Thus, limiting our analysis to low-income noncustodial parents would bias our results, possibly suggesting a positive effect on child support payments and work when in fact there is none. However, we can examine noncustodial parents with low child support orders, which are associated with low incomes, since order amounts are not influenced by the credit. When we limit our analysis to noncustodial parents with low child support orders (below $3,000 a year), we find that among these parents, the NCP EITC significantly increased child support compliance and the likelihood of working. Specifically, the NCP EITC increased the share paying in full by 2 percentage points and increased the share working by 1.6 percentage points.
• Among parents with low orders, the Noncustodial Parent EITC increased the percent of noncustodial parents paying their full child support by 2 percentage points and increased the percent working by 1.6 percentage points.
These estimates may represent upper-bound estimates of the NCP EITC’s impact because we are not subtracting the discontinuities that occurred before enactment of the NCP EITC. Based on the data available, we estimate that these prior discontinuities are small and insignificant, so we focus on the discontinuities after the tax credit was enacted. However, this may result in an over-estimate of the NCP EITC’s impact. On the other hand, we are estimating the tax credit’s impact in its first few years. We anticipate that the incentive effect will grow over time as more parents become aware of the credit.
We conclude by discussing alternative options for expanding the NCP EITC. The first approach we discuss is increasing the amount of the NCP EITC. Increasing the amount of the credit has two benefits: more parents will receive an incentive to pay their child support in full, and more parents who already pay their child support in full will claim the credit, increasing the NCP EITC participation rate. Another suggestion is allowing noncustodial parents to receive the NCP EITC and the New York State EITC if they are eligible for both. Currently, noncustodial parents cannot receive both credits; they must select the higher one. This means that most low-income parents who have custody of some children but owe child support for others are not eligible for the NCP EITC and thus are not incentivized to pay their child support in full. We also discuss extending the NCP EITC to noncustodial parents who pay part or none of their child support.

1
I. Introduction
During the past two decades, Congress and state legislatures have enacted policies to help low-income families make ends meet and encourage work. Increasing the earned income tax credit, transforming the cash assistance program into a work-first program, and strengthening child support enforcement have been key elements of this policy mix. Today, many low-income families escape poverty because they work and receive the EITC and child support. However, low-income noncustodial parents are ineligible for the EITC for families with qualifying children, even when they work and pay child support in full. Many noncustodial parents who work and pay child support live in poverty and could benefit from a tax credit.
After successfully reducing poverty among custodial families through welfare reform and an expanded EITC, the New York state Legislature decided to apply the same policy levers to low-income noncustodial parents. In June 2006, the legislature enacted the Strengthening Families Through Stronger Fathers Initiative, which established a refundable noncustodial parent EITC and funded employment-oriented pilot programs across the state.1 New York became the first state in the country to enact this combination of services for low-income noncustodial parents. Legislation has since been introduced to create a similar federal tax credit and employment programs. This legislation was first introduced in the 109th Congress by senators Bayh and Obama (S. 3607) and was reintroduced in the 112th Congress by Rep. Danny Davis (H.R. 2193).
The purpose of the New York NCP EITC is to support low-income noncustodial parents who are working and paying child support. It also aims to encourage more low-income parents to do the same. The NCP EITC is administered through the New York tax code and operates like other New York State EITCs. Noncustodial parents must file a New York state tax return and meet other eligibility criteria to receive the tax credit. If they are eligible, the amount of the tax credit is determined as a percentage of the federal EITC. This provision of the New York State Tax Law (Section 606 (d-1)) was extended by Article VII budget bill (chapter 59 of the laws of 2012) until 2015.
This report focuses on the New York NCP EITC and examines whether the new credit has encouraged noncustodial parents to work and pay child support. First, we describe the federal and New York State EITCs, followed by the New York NCP EITC. Then we present descriptive results and quantitative estimates of the NCP EITC’s effect on child support and work. Data and methods used in this report are discussed in the appendix. Earlier reports by the Urban Institute about the New York NCP EITC have already examined the tax credit’s implementation and reported on first-year outcomes (see Sorensen 2010).
1 The Urban Institute has already published an impact evaluation of the pilot employment programs implemented as part of the Strengthening Families Through Stronger Fathers. See Lippold and Sorensen (2011).

2
II. Policy Intervention
Since all New York State EITCs are designed as a percentage of the federal EITC, we will start with a brief overview of the federal earned income tax credit. We then discuss the New York State EITC, followed by a description of New York’s noncustodial parent EITC. A. The Federal EITC
The federal EITC is one of the largest income support programs in the country, providing $59.2 billion in benefits to 21 million low-income working families with children and $1.6 billion in benefits to 6 million low-income workers without qualifying children in 2009.2 The federal EITC’s primary goals are financially supporting low-income working families and providing an incentive to work. The federal EITC is widely credited with increased labor force participation among single mothers during the 1990s (Eissa and Hoynes 2006; Hotz, Mullin, and Scholz 2005; Meyer and Rosenbaum 2001).
Federal EITC eligibility depends on a taxpayer’s income and filing status, among other requirements. The size of the credit depends on the number of “qualifying” children a taxpayer has. A qualifying child resides with the taxpayer for more than half the year and is either younger than 19, a full-time student under age 24, or a permanently and totally disabled child of any age. The child must also be the child or sibling of the taxpayer or a descendent of the taxpayer’s child or sibling. For workers without qualifying children, a childless EITC is available for those between 25 and 64 years old. The federal EITC structure can be broken up into three phases: phase-in, plateau, and phase-out. Initially, the credit is a percentage of income, and it rises until it hits a maximum amount. The credit then plateaus, staying at that maximum amount even as income goes up. When earnings go beyond the plateau amount, the credit begins to decline and ultimately phases out.
A key feature of the EITC is that it is refundable, so if the amount of the credit exceeds the amount of taxes owed, the taxpayer gets a refund. In 2009, federal EITCs could be as much as $3,956 for taxpayers with one qualifying child, $6,536 for taxpayers with two qualifying children, and $7,354 for taxpayers with three or more qualifying children. For taxpayers with no qualifying children, the credit was a maximum of $594.
B. The New York State EITC
New York and 24 other states have a state EITC.3 In 2009, the New York State (NYS) EITC was 30 percent of the federal EITC.4 Like the federal EITC, the NYS EITC is refundable for state residents. To receive the New York State EITC, tax filers must claim the federal EITC and meet
2 IRS, SOI Tax Stats–Individual Income Tax Returns, “Table 4. Returns with Earned Income Credit, by Size of Adjusted Gross Income, Tax Year 2009.” 3 For more information about the New York State EITC and a list of other states that have a state EITC, see New York State Department of Taxation and Finance (2011). 4 New York City also has an EITC, which, in 2009, was 5 percent of the federal EITC.

3
other eligibility criteria. In 2009, approximately 1,576,000 New York tax filers received a NYS EITC. The total cost of providing these credits in 2009 was $966.9 million (NYS Department of Taxation and Finance [DTF] 2011).
C. The Noncustodial Parent EITC
In 2006, New York established the noncustodial parent EITC, which is also a refundable tax credit. It is available to individuals who meet the following eligibility criteria during the tax year. The person must
1. be a full-year resident of New York state; 2. be 18 years old or older at the end of the tax year; 3. be a parent of a child who did not reside with him or her in the tax year and who was
under 18 at the end of the tax year; 4. provide the names, relationships, and dates of birth of up to two children who meet
criteria #3;5 5. have a current child support order payable through the New York child support collection
unit for at least half of the year;6 6. have paid all the child support he or she owes for the tax year; 7. have federal adjusted gross income and total earned income below the maximum income
level for the noncustodial parent EITC ($35,463 in 2009); 8. have a Social Security number that allows him or her to work or that is valid for federal
earned income tax purposes (the person’s spouse must also meet this requirement if filing a joint return);
9. have a federal filing status that is not married filing separately; 10. not file federal forms related to foreign earned income; 11. have less than $2,800 in investment income; and 12. have total earned income that is positive.
The amount of the credit can be determined in two different ways, with the taxpayer receiving whichever amount is greater. The credit is equal to either
• 20 percent of the federal EITC that would be allowed if the noncustodial child met the definition of a qualifying child, computed as if the taxpayer had one qualifying child and without the benefit of the joint return phase-out amount; or
• 2.5 times the federal EITC that would be allowed if the taxpayer had no qualifying children.
Figure 1 shows the New York state tax credit amounts for noncustodial parents who filed as single individuals in 2009 by their income level. Because the NCP EITC is based on the higher
5 The New York NCP EITC tax form (IT-209) asks for the Social Security numbers of the children who do not live with the parent, but the instructions for 2008 and forward say that the Social Security numbers are not required. Thus, we did not list the Social Security number of the children as a requirement. 6 Because the New York Department of Taxation and Finance requires a Social Security number to match child support eligible noncustodial parents to their tax records, the Office of Temporary and Disability Assistance only transfers the names of noncustodial parents who meet all child support eligibility criteria and have a Social Security number in the New York child support data system.

4
of two calculations from the federal EITC, its structure differs from the NYS EITC. In 2009, the noncustodial parent EITC rose with income until it reached its maximum amount of $1,143. The credit remained at this level while income was between $5,970 and $7,470. After that, the credit declined as income increased, falling from $1,143 to $609, until income reached $9,916. The credit remained at $609 as income rose from $9,916 to $16,420. Then the credit phased out as income rose to a maximum threshold of $35,463.
It is important to note that noncustodial parents cannot claim both the noncustodial parent EITC and the New York State EITC. If a noncustodial parent claims the federal EITC, then he or she is instructed to calculate the amount of both the NCP and NYS EITCs and select the higher of the two credits.
S
Source: Authors’ calculations based on instructions for 2009 New York tax returns.
As figure 1 shows, single noncustodial parents with no qualifying children are always better off claiming the noncustodial parent EITC as opposed to the state EITC. On the other hand, single noncustodial parents who have qualifying children may be better off claiming the state EITC than the noncustodial parent EITC, depending on their income level. In fact, single noncustodial parents with any qualifying children and income greater than $8,769 are always better off claiming the NYS EITC than the NCP EITC since the NYS EITC is always greater than the NCP EITC for these parents.
$1,697
$1,143
$913
$609
$137
$1,508

5
III. Potential Incentive Effect of the Noncustodial Parent EITC
The NCP EITC creates an incentive for noncustodial parents to pay their child support in full because it provides a subsidy to those who do. The incentive is equal to the additional tax credit available when child support orders are fully paid. As noted above, noncustodial parents cannot receive both the regular NYS EITC and the NCP EITC; they are instructed to select the higher credit. Thus, the additional tax credit available to those who pay their child support in full is equal to the difference between the NCP EITC credit and the NYS EITC credit (both credits are shown in figure 1), which we refer to as the “net benefit” of the NCP EITC.
The maximum net benefit of the NCP EITC is the largest for noncustodial parents who qualify for the NCP EITC but not for the NYS EITC. This group consists of noncustodial parents who have no qualifying children for the NYS EITC and are not eligible for the childless NYS EITC because their incomes are above the maximum income allowed ($13,440 in 2009) or they are outside the eligible age range (25 to 64 years old). For these individuals, their net benefit equals the total credit amount. In 2009, the maximum credit was $1,134, which was available for those with adjusted gross incomes between $5,970 and $7,470 that year. If adjusted gross incomes were below or above these amounts, the credit was less. The credit disappeared when noncustodial parents’ adjusted gross incomes reached $35,463.
For individuals who are eligible for the noncustodial parent EITC and the childless New York State EITC, the maximum net benefit of the NCP EITC was $1,005 in 2009, which was available to individuals earning $5,970 to $7,470 a year. If their incomes were below or above these amounts, the net benefit was less.
For noncustodial parents eligible for the NCP EITC and the NYS EITC with qualifying children, the maximum net benefit of the NCP EITC is much lower and the benefit phases out at much lower income levels. In 2009, the maximum net benefit of the NCP EITC was $534 for noncustodial parents who were eligible for the NYS EITC with one qualifying child and who filed as single individuals. Further, the maximum net benefit amount was only available for those who had adjusted gross incomes of $5,970 a year. Once these parents’ incomes were above $8,769, the net benefit of the NCP EITC was zero. For noncustodial parents with two or more qualifying children, the maximum net benefits are even lower and disappear at even lower levels of income. In 2009, the NCP EITC had no incentive effect for noncustodial parents with qualifying children once their incomes exceeded $8,769 a year.
The net benefit from the NCP EITC also depends on the size of the noncustodial parent’s child support order(s). In general, smaller child support orders are easier to pay in full than larger ones; thus, all things equal, noncustodial parents with lower orders will be more encouraged by the NCP EITC to comply with their order than noncustodial parents with higher orders. For example, someone who owes $600 a year and anticipates an $800 net benefit from the EITC has a strong incentive to pay in full, since the effective subsidy rate is more than 100 percent. In contrast, someone who owes $6,000 a year and expects an $800 net benefit from the EITC has much less incentive to pay in full.

6
Finally, the net benefit of the NCP EITC depends on the amount of child support arrears a noncustodial parent owes. If a person owes child support arrears, federal law requires that the person’s federal income tax refund be intercepted and used to reduce the debt. New York, like most states that have an income tax, also intercepts state income tax refunds and applies those to a person’s arrears. This means that if a noncustodial parent pays his child support in full but owes child support arrears, the credit will go toward reducing his arrears. While this benefits the parent, it does not have the same incentive effect that receiving a tax credit would. So, individuals who owe arrears are less incentivized by the NCP EITC than individuals who do not owe arrears.
IV. Study Findings
In this section, we discuss the annual take-up rate for the NCP EITC from 2006 to 2009, present profiles of various groups of noncustodial parents in New York relevant for this analysis, illustrate the discontinuity in our key outcome variable, and describe the regression results. Data used throughout this section is described in the appendix.
A. Trends in Eligibility, Receipt, and Average Benefit
The number of noncustodial parents eligible for and receiving the NCP EITC is presented in table 1. The first row of table 1 shows the number of noncustodial parents who had a child support order for at least half the year, which is one of the NCP EITC eligibility requirements. In general, each subsequent row in the table is a subset of the previous row. In 2006, 341,895 noncustodial parents in the New York child support program had a current support order for at least half the year. That number increased slightly between 2006 and 2009, reaching 353,681 in 2009.
The second row of table 1 shows the number of noncustodial parents who were considered child support eligible for the NCP EITC by OTDA. By January 15 of each year, OTDA is required to give the New York Department of Taxation and Finance (DTF) a list of noncustodial parents who meet the child support eligibility criteria for the prior year (i.e., parents who meet eligibility criteria numbers 3, 5, and 6 in the earlier list). These individuals have a current support order for at least one child under age 18, have had that order for at least half the year, and have paid all their current support orders in full. The number of noncustodial parents found child support eligible by OTDA was 153,000 in 2006; it declined in 2007, then increased to 157,748 in 2009.
Seeing only a slight increase in the number of noncustodial parents who are child support eligible for the NCP EITC might lead one to conclude that the tax credit hasn’t encouraged people to pay their child support in full, but we show below that drawing this conclusion is a mistake. Parents are only incentivized by the NCP EITC if they meet all the eligibility criteria for the tax credit. Most parents who are child support eligible for the NCP EITC do not meet all the other eligibility criteria. An estimated 30,490 parents met all the eligibility criteria for the NCP EITC in 2009, 19 percent of those who were child support eligible that year (table 1, row 6).

7
The third row of table 1 reports the number of noncustodial parents who were child support eligible for the NCP EITC and who filed state income tax returns. About 64 percent of noncustodial parents who are found child support eligible for the NCP EITC in any one year file a state tax return. Most individuals who do not file a state tax return do not live in New York and are probably not required to file a New York tax return. Also, some individuals probably had incomes below the threshold required to file a state tax return. The number of noncustodial parents who filed state tax returns started near 96,000 in 2006, declined in 2007, then increased to around 101,000 in 2008 and 2009.
Table 1. Noncustodial Parents Eligible For and Receiving the NCP EITC, 2006–09 2006 2007 2008 2009
Number of noncustodial parents who: 1 Have a current support order for at least half of yeara 341,895 346,207 350,298 353,681 2 Are child support eligible for the NCP EITCa 153,000 130,000 157,745 157,748 3 Filed a tax returnb 95,890 84,904 101,251 101,628 4 Have reported income below credit ceiling 45,625 42,656 47,200 54,369 5 Received NYS EITC (estimate) 21,177 20,750 22,600 23,879 6 Are eligible for the NCP EITC (estimate) 24,448 21,906 24,600 30,490 7 Received NCP EITCb 5,161 5,233 6,439 9,647 8 Claimed NCP EITCb 6,509 6,552 8,343 12,700 9 Percent receiving NYS EITC rather than NCP EITC 46% 49% 48% 44% 10 Take-up rate for the NCP EITC 21% 24% 26% 32% 11 Total cost of the NCP EITCb $2,021,006 $2,151,555 $2,731,101 $4,353,445 12 Average NCP EITC received $392 $411 $424 $451
a. Official numbers reported by the New York Office of Temporary and Disability Assistance (OTDA). b. These data are from the New York Department of Taxation and Finance. Source for all other data: Authors’ analysis of case-level data from the New York OTDA.
The number of noncustodial parents who were child support eligible for the NCP EITC, filed a tax return, and had positive reported incomes below the credit ceiling started at 45,625 in 2006, declined in 2007, then increased in 2008 and 2009, reaching 54,369 in 2009 (table 1, row 4).7 This group of noncustodial parents meets the three key eligibility criteria for the NCP EITC: they are child support eligible, have incomes below the credit ceiling, and have filed state tax returns.
In 2006, an estimated 21,117 noncustodial parents who met the child support and income criteria for the NCP EITC and filed a state tax return chose to receive the New York State EITC rather than the NCP EITC (table 1, row 5).8 As noted earlier, noncustodial parents cannot receive both tax credits; they are instructed to take the larger one. This figure declined slightly in 2007, then increased in 2008 and 2009. This means that nearly half (44–49 percent) of the noncustodial
7 We generate reported income by taking the maximum of the following income sources: W2 earnings, quarterly earnings, and adjusted gross income. 8 We estimate the number of noncustodial parents who receive the NYS EITC rather than the NCP EITC even though they are income and child support eligible for the NCP EITC and file a tax return. OTDA does not have precise figures for this population. We use case-level data from OTDA to determine the number of noncustodial parents who meet child support eligibility criteria for the NCP EITC and have reported income below the maximum income limit for the NYS EITC. We then determine what percent of these parents have incomes below the maximum level for the NCP EITC. We apply this percent to the number of noncustodial parents who OTDA reports received the NYS EITC even though they were child support eligible for the NCP EITC and had filed a tax return.

8
parents who are child support and income eligible for the NCP EITC and file a tax return receive the New York State EITC rather than the noncustodial parent EITC.
The number of noncustodial parents estimated to be eligible for the NCP EITC increased from 24,448 in 2006 to 30,490 in 2009, a 25 percent increase (table 1, row 6). Thus, the population of parents who can be incentivized by the NCP EITC increased substantially during the first four years of the credit.
The number of noncustodial parents who received the NCP EITC also increased substantially over this period. During the first two years of the tax credit, just over 5,000 people received it, but that number increased to over 9,000 in 2009, an 87 percent increase in four years (table 1, row 7). In 2010, the New York Department of Finance reported that the number of noncustodial parents who received the NCP EITC declined to 7,744 (not shown in table 1), but this still represents a 50 percent increase since the inception of the credit. Further, the number of noncustodial parents who claimed the NCP EITC (including some who are denied the credit) increased even more: it doubled during the tax credit’s first four years, reaching 12,700 in 2009 (table 1, row 8). The recession that started in December 2007 and ended in June 2009 probably affected these numbers, but we think the increases reported in rows 7 and 8 reflect a growing awareness of the tax credit.
The estimated take-up rate for the NCP EITC increased during this period, from 21 percent in 2006 to 32 percent in 2009 (row 10 in table 1). While this take-up rate is still low, the take-up rate for the federal childless EITC was estimated at 45 percent five years after it was implemented (GAO 2001). At that time, it was generally believed that the participation rate for the childless EITC was so low because of the relatively small size of the credit and the lack of knowledge about the credit (GAO 2001). We suspect that these two factors also contribute to the low participation rate for the NCP EITC.
The final two rows of table 1 report the total cost of the NCP EITC and the average size of the credit received. The cost of the NCP EITC more than doubled from 2006 ($2 million) to 2009 ($4.3 million).9 However, the NCP EITC cost still represents less than 0.5 percent of the total cost of all EITCs provided in New York (NYS DTF 2011). The average benefit received was $451 in 2009; the average credit across all New York EITCs was $614 that year (NYS DTF 2011).
B. Profiles of Noncustodial Parents
Tables 2 and 3 list attributes of three specific groups of noncustodial parents in 2009. The first group has met the following basic eligibility criteria for the NCP EITC: they are at least 18 years old, have a current support order for at least six months of the year, live in New York, and did not file a tax return as married filing separately. This is the group of noncustodial parents we use
9 In 2010, the total cost of the NCP EITC was $3.5 million, for an average credit of $456 (NYS DTF).

9
in the regression analysis discussed below.10 The second group is noncustodial parents eligible for a net benefit from the NCP EITC. This is the group we think are most likely to be incentivized by the NCP EITC. The final group is noncustodial parents who actually received the NCP EITC in 2009. The numbers in table 3 differ slightly from table 1 for noncustodial parents who received the NCP EITC because some data presented in table 1 were reported by OTDA and DTF, while all the numbers in tables 2 and 3 were generated by the authors using case-level data from OTDA.
Group 1: Noncustodial parents in the first column of tables 2 and 3 meet the basic eligibility criteria for the NCP EITC but do not necessarily meet other eligibility criteria, such as paying all of their current support orders in full for the year, owing current support for a child under 18, having income within the eligible range, and filing a state tax return. For example, only 56 percent of noncustodial parents who meet the basic eligibility criteria paid all of their current support orders in full in 2009. In addition, 15 percent of these parents did not have any children under the age of 18 for whom they owe current support. Table 3 shows that 27 percent of the parents in the first group had no reported income in 2009 and another 30 percent had reported incomes above the tax credit limit. This suggests that many of these parents did not meet the income eligibility criteria for the NCP EITC.
Table 3 also shows that 51 percent of parents who meet the basic eligibility criteria for the NCP EITC were missing their tax filing status. In other words, the New York Office of Temporary and Disability Assistance did not have a tax filing status for these parents. This means that these parents did not file a tax return in 2009 or that the transfer of this information from the New York Department of Taxation and Finance to OTDA was unsuccessful. Data transfers are conducted routinely between these two departments and thus it is unlikely that such a large number of parents’ tax filing statuses were unsuccessfully transferred. It is more likely that most of these parents did not file a tax return.
Turning back to table 2, we see that the first group of noncustodial parents are nearly all male. Just under half of these parents have one child covered by a current support order; 54 percent have two or more children. Further, 39 percent of them are white, non-Hispanic, 38 percent are black, non-Hispanic, 23 percent are Hispanic, and 1 percent are other race. Their median age is 40 years old.
These parents owed a median amount of $3,796 in current support in 2009. Among those who paid at least a portion of their child support, the median amount paid was $4,147 that year. The median share of reported income owed as current support among these parents was 16 percent. This was also the median share of reported income going to child support. Sixty-four percent of these parents owed child support arrears; the median amount of arrears owed was $2,574.
Table 3 also shows that the first group of noncustodial parents could have been eligible for an average of $111 from the NCP EITC if they paid their child support in full and met the other 10 In the regression analysis, we further limit this group to noncustodial parents whose youngest child for whom child support is owed is between 15 and 21.

10
eligibility requirements. After paying down their arrears, these individuals could have received an average of $66 from the NCP EITC. If we take into account the amount of the New York State (and New York City) EITC for which they are eligible, the average net benefit from the NCP EITC would have been $30 if they had paid their child support in full.
Table 2. Demographic Characteristics of Specific Groups of Noncustodial Parents in New York, 2009
Group 1: Meet basic
eligibility criteria for the NCP
EITCa
Group 2: Eligible for a net benefit from the NCP EITC after
subtracting arrears
Group 3: Received the NCP
EITC Number 232,380 17,065 9,443 Characteristics of Children Covered by an Order Number of children covered
1 46% 58% 59% 2 29% 27% 27% 3 or more 25% 15% 14%
Percent whose youngest child is 18 or older 15% 0% 0% Median age of youngest child (years) 12 10 9 Characteristics of Noncustodial Parentsb Gender
Male 94% 92% 92% Female 6% 8% 8%
Race/ethnicity White, non-Hispanic 39% 52% 63% Black, non-Hispanic 38% 25% 21% Hispanic 23% 21% 15% Other Race 1% 2% 1%
Age distribution 18–29 years old 12% 23% 26% 30–39 years old 35% 38% 39% 40 or older 53% 39% 35%
Median age of noncustodial parent 40 37 36 Source: Authors’ analysis of case-level data from the New York Office of Temporary and Disability Assistance.
a. Basic eligibility criteria: must be at least 18, have an order for at least half the year, live in New York, and not file as married filing separately.
b. Some of the noncustodial parents are missing their demographic information. These individuals are not included when determining the percentages reported above.
Group 2: The second group of noncustodial parents (column 2 in tables 2 and 3) is most likely to be incentivized by the NCP EITC since these parents are eligible for a positive net benefit from the NCP EITC after subtracting their arrears balance from the credit amount. They meet all the eligibility criteria for the NCP EITC that we can measure except one: they haven’t paid all their current support orders in full. In 2009, there were only 17,065 individuals in this group, representing 7 percent of the noncustodial parents who meet the basic eligibility criteria for the NCP EITC. Just under 75 percent of these parents already paid their child support in full. These individuals are much more likely than the larger group to have one current support order

11
Table 3. Economic Characteristics of Specific Groups of Noncustodial Parents in New York, 2009
Group 1: Meet basic
eligibility criteria for the NCP
EITCa
Group 2: Eligible for a net benefit from the NCP EITC after
subtracting arrears
Group 3: Received the NCP
EITC Number 232,380 17,065 9,443 Child Support Characteristicsb Median annual current support due $3,796 $2,829 $3,016 Percent who paid full amount of current support due 56% 74% 100%
Median annual amount paid (among payers) $4,147 $3,150 $3,628 Percent with arrears 64% 37% 42%
Median amount of arrears owed (among debtors) $2,574 $119 $409
Percent with 1 current support order 86% 91% 91% Percent with 2+ current support orders 14% 9% 8% Reported Income Informationc Percent with:
No reported income 27% 0% 3% Annual reported income between $0.01 and $35,452 43% 90% 87% Annual reported income above $35,452 30% 10% 10%
Median annual reported income (among those w/ income) $25,745 $18,249 $20,717 Median total due as a percent of income 16% 14% 14% Median total paid as a percent of income 16% 16% 18% Filing Status Single 19% 89% 74% Married, filed jointly 13% 6% 4% Head of household 17% 4% 8% Missing tax filing status 51% 0% 15% Tax Credit Characteristicsd Average NCP EITC $111 $533 $442 Average NCP EITC after paying arrears $66 $466 $407 Average net benefit from NCP EITC after
paying arrears $30 $387 $382 Source: Authors’ analysis of case-level data from the New York Office of Temporary and Disability Assistance. a. Basic eligibility criteria: must be at least 18, have an order for at least half the year, live in New York, and not file as married filing separately. b. Child support paid includes payments toward current support and arrears. c. Reported incomes equal the maximum of adjusted gross income, annual reported wages, and the annual value of quarterly reported wages. d. These values are estimated unless the noncustodial parent received an EITC, in which case the actual value of the credit received is used.

12
and have one child for whom they owe current support. These characteristics tend to lower the amount of the current support order, making it easier to pay the order in full. Also, a lower share of these parents (37 percent) owes arrears, and the median amount that they owe is considerably lower ($119) than parents in group 1.
To be in this group, the parents have to meet the basic income eligibility criteria for the NCP EITC: they have to have reported income and their adjusted gross income (AGI) has to be below $35,452. Ten percent of these parents have reported incomes above $35,452, but that is because their annual wages (not their AGI) are greater than $35,452. The median reported income for this group is $18,249. In addition, noncustodial parents have to file a tax return to be in this group, and 89 percent of them file as single.
In contrast to the first group, just over half these parents are white, Non-Hispanic. Only 25 percent are African American, and 21 percent are Hispanic. Ninety-two percent are male. The median age of these parents is 37 years old, 3 years younger than the first group. They are younger, in part, because all these parents have a child under 18 years old who is covered by a current support order, a requirement of the NCP EITC.
Table 3 shows that nearly all noncustodial parents who are eligible for a net benefit from the NCP EITC file tax returns as single. This occurs, in part, because we assume that noncustodial parents who file as head of households or married, filing jointly are eligible for the NYS EITC, which is higher than the NCP EITC over most of the income eligibility range. This assumption may cause us to overestimate the share of eligibles who file as single.
The average net benefit from the NCP EITC that this group could receive if they paid their child support in full is nearly $400, which is considerably higher than the amount among noncustodial parents in group 1. It is also slightly higher than the amount actually received (column 3).
Group 3: The final group of noncustodial parents in tables 2 and 3 is those who actually received the NCP EITC in 2009. Similar to group 2, these noncustodial parents are more likely than the larger group (group 1) to have one current support order and one child for whom they owe current support. As noted above, these characteristics tend to lower the current support obligation and make it easier to pay the full amount due.
Noncustodial parents who received the NCP EITC had median reported income of $20,717 in 2009, slightly higher than group 2.11 All these parents paid their current support order in full, and the median amount of their reported income that they spent on child support was 18 percent. Only 42 percent of these parents owed arrears, and the median amount of arrears owed was $409, considerably less than the amount owed among the larger group of noncustodial parents.
11 Three percent of the noncustodial parents who received the NCP EITC in 2009 had no reported income that year in the data we received from OTDA. As noted elsewhere, noncustodial parents must work and have positive AGI to receive the NCP EITC. Thus, the 3 percent reflects the limitations of the income data available to us.
13
We are missing the tax filing status for 15 percent of the noncustodial parents who received the NCP EITC in 2009. Among those who have a tax filing status, nearly all (87 percent) file as single. This result is expected since most noncustodial parents who file as head of household or married, filing jointly are probably eligible for the NYS EITC, which is higher over most of the income eligibility range.
In 2009, 63 percent of the recipients of the NCP EITC were white, Non-Hispanic. Only 21 percent were African American, and 15 percent were Hispanic. The median age of this group is 36 years old and the median age of their youngest child for whom they owe child support was 9.
The average NCP EITC received was $442 in 2009. After paying down arrears, the average credit was $407. After paying down arrears and taking into account the amount that could have been received from the NYS EITC, the average credit was worth $382.
C. Regression Results
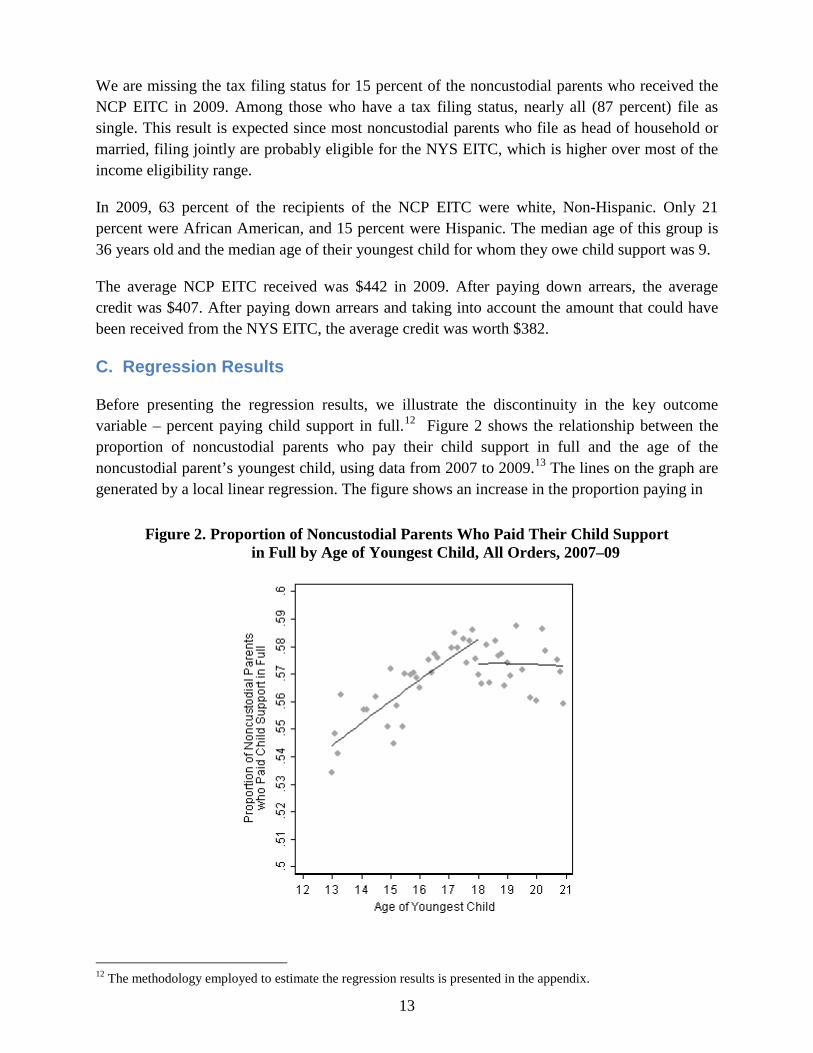
Before presenting the regression results, we illustrate the discontinuity in the key outcome variable – percent paying child support in full.12 Figure 2 shows the relationship between the proportion of noncustodial parents who pay their child support in full and the age of the noncustodial parent’s youngest child, using data from 2007 to 2009.13 The lines on the graph are generated by a local linear regression. The figure shows an increase in the proportion paying in
Figure 2. Proportion of Noncustodial Parents Who Paid Their Child Support in Full by Age of Youngest Child, All Orders, 2007–09
12 The methodology employed to estimate the regression results is presented in the appendix.

14
full through the noncustodial child’s teen years, probably because the parents earn more as they get older. At age 18, the local linear regression shows a discontinuous drop in the proportion paying child support in full. This drop is evidence of the NCP EITC’s effect. Because the credit is limited to noncustodial parents with children under 18, the average potential NCP EITC drops discontinuously at age 18. After age 18, the proportion paying in full tapers off slightly, probably due to a drop in perceived need. However, as we show later, there is no evidence of a discontinuous drop at age 18 in the absence of the NCP EITC.
Table 4 presents estimates of the discontinuity in the proportion of noncustodial parents paying their full child support, depending upon the size of the bandwidth and the year of the data.14 Although payments could drop discontinuously at the age 18 boundary, even absent the new incentive, for other reasons, we find no evidence of a pre-program effect at the discontinuity. Column 1 shows no significant discontinuity in the proportion of noncustodial parents paying their child support in full in 2005, the year before the enactment of the NCP EITC, regardless of the bandwidth used. The estimated jumps in payment rates for single years after the NCP EITC is enacted are shown in columns 2 to 5. Most single-year estimates do not differ significantly from zero, except for 2007. That year shows a significant discontinuity in the proportion paying their full child support across a range of bandwidths. Specifically, the proportion paying in full increases 2.56 percentage points at the age boundary using a bandwidth of two years.
Table 4. Estimated Discontinuity in the Proportion Paying in Full at Age 18 by Year (all order sizes included)
(1) (2) (3) (4) (5) Bandwidth 2005 2006 2007 2008 2009 3 years 0.0073
(0.85) 0.0029 (0.34)
0.0225** (2.76)
0.0006 (0.08)
0.0061 (0.78)
2 years 0.0051 (0.48)
-0.0021 (-0.20)
0.0256** (2.58)
0.0028 (0.29)
0.0042 (0.44)
1 year 0.0002 (0.01)
-0.0227 (-1.52)
0.0266+ (1.91)
0.0056 (0.40)
0.0052 (0.38)
Observations 64,304 62,308 68,759 69,987 74,158
Note: t statistics in parentheses. + p < .10, * p < 0.05, ** p < 0.01, *** p < 0.001
In 2006, the first year the credit was available, there was some confusion regarding the definition of a minor child. The statute authorizing the NCP EITC says that the noncustodial parent must have a minor child with whom he or she does not reside to qualify for the NCP EITC. In New York, for tax purposes, a child is a minor until age 18, but the age of majority for child support purposes is 21. Initially, OTDA identified noncustodial parents as child support–eligible for the NCP EITC if they had children under 21 and met the other child support requirements. Partway through 2006, the two departments realized they were using different definitions of a minor, so OTDA revised its definition and resubmitted the list of child support–eligible noncustodial 13 We use this period because it corresponds to the years of our analysis, as described below. 14 For more bandwidths, see appendix table 2.

15
parents. Because of this confusion, about 8 percent of the noncustodial parents who received the NCP EITC in 2006 did not have children under 18 for whom current support was owed.
Because of the confusion over the definition of a minor child, we are not surprised that the results for 2006 are not significant. Perhaps 2007 was the first year in which noncustodial parents fully responded to the incentive. The incentive effect may be weaker in 2008 and 2009 because of the recession, which made it harder for noncustodial parents to pay their child support in full. Because of the confusion in 2006, we combine data from 2007 to 2009 to estimate the effect of the NCP EITC below.
Table 5 presents our results for the proportion paying in full at the age boundary for various bandwidths using data from 2007 to 2009.15 The first column of table 5 shows a significant discontinuity in the proportion paying in full if a bandwidth of two or three years is used. This suggests that the NCP EITC had a significant effect on the proportion paying their child support in full.16 Specifically, the proportion paying in full increases by 1 percentage point at the age boundary in 2007 through 2009. In 2009, 56 percent of noncustodial parents who met the basic eligibility criteria for the NCP EITC paid their child support in full. The results presented in table 5 suggest that because of the NCP EITC this figure is 1 percentage point higher than it would be otherwise, increasing the number of parents paying in full by about 2,300 people. However, if we constructed a difference-in-difference estimate by subtracting the pre-program estimate from the 2007 to 2009 estimates, we would get a smaller effect and one that is no longer statistically significant.
The second and third columns of table 5 present the estimated jumps in the discontinuities of the eligibility for a net benefit from the NCP EITC and the amount of the net benefit at the age boundary. Using a bandwidth of two years, the estimated jump in the eligibility rate for the NCP EITC is 8.07 percentage points, and the estimated jump in the net benefit amount is $28.09 at the age boundary.
The fourth and fifth columns of table 5 present the local Wald estimators, which measure the responsiveness of paying in full to a percentage change in the eligibility rate for the NCP EITC and a dollar change in the amount of the net benefit. Using a bandwidth of two years, we estimate that a 1 percentage point increase in the eligibility rate for the NCP EITC would generate a .134 percentage point increase in the share of noncustodial parents paying their child support in full. We also estimate that a $100 increase in the NCP EITC would generate a .04 percentage point increase in the share paying in full. In 2009, 56 percent of noncustodial parents
15 For more bandwidths, see the appendix tables. 16 Strictly speaking, the estimates are only generalizable to those NCPs whose youngest nonresident child is exactly 18 years old. But other methods with high internal validity would also have strong limitations on external validity. In addition, it is possible that the incentive effect we observe is the result of receiving the NCP EITC. If a parent owes child support arrears, then the credit is used to reduce those arrears and appears in our data as a child support payment. To ascertain whether this reverse causality is affecting our results, we conducted the same analysis presented here on the first instance of receiving the NCP EITC and found similar results.

16
who met the basic eligibility criteria for the NCP EITC paid their child support in full. If the share of noncustodial parents who are eligible for a net benefit from the NCP EITC were to increase 1 percentage point from 8.07 percent to 9.07 percent, then we estimate that the share of noncustodial parents who met the basic eligibility criteria for the NCP EITC would increase from 56 percent to 56.134 percent, adding about 300 noncustodial parents paying their child support in full. If the NCP EITC increased by $100, we estimate that the share of noncustodial parents who met the basic eligibility criteria for the NCP EITC would increase from 56 percent to 56.04 percent, adding about 100 noncustodial parents paying in full.
Table 5. Estimated Discontinuity in the Proportion Paying in Full, the Proportion Eligible for a Net Benefit from the NCP EITC, the Amount of the Net Benefit, and Their
Associated Local Wald Estimators (combining data from 2007 to 2009 and including all order sizes)
Bandwidth
(1) Proportion
paying in full
(2) Proportion eligible for net benefit from the
NCP EITC
(3) Amount of net benefit from the
NCP EITC
(4) Local Wald
estimator (1)/(2)
(5) Local Wald
estimator (1)/(3)
3 years .0096*
(2.08) .0803*** (44.36)
27.38***
(71.73) .125* (2.18)
.0004*
(2.08) 2 years .0108+
(1.92) .0807*** (37.87)
28.09***
(31.59) .134+ (1.92)
.0004+
(1.92) 1 year .0124
(1.56) .0797*** (50.24)
27.81***
(41.93) .155 (1.56)
.0004
(1.56)
Note: t statistics in parentheses. + p < .10, * p < 0.05, ** p < 0.01, *** p < 0.001. N = 212,904
As noted above, we also examine the NCP EITC’s effect on two other outcomes: the amount of child support paid, and whether noncustodial parents worked. We find no evidence of an effect on either variable. Table 6 reports the estimated discontinuities for these two outcomes. The lack of an effect on the amount of child support paid is somewhat surprising, given that we found a positive effect on the proportion paying in full. Perhaps the increase in full payment is the result of those who are already paying nearly the full amount due and are incentivized to pay slightly more because of the new credit. For example, noncustodial parents who have made 11 months of payments may be encouraged to make the 12th payment. The absence of any discernible effect on labor market attachment is not particularly surprising, if for no other reason than that we do not have sufficient power to detect very small effects, and any effect on labor force attachment is likely to be very small.
Because noncustodial parents with low orders have a stronger incentive to respond to the NCP EITC than noncustodial parents with high orders, we re-estimate the regression discontinuities discussed above for this population. We define low orders as those below $3,000 in 2009 dollars, roughly the median order for noncustodial parents who receive the NCP EITC.

17
Table 6. Estimated Discontinuities for the Amount of Child Support Paid and Whether Noncustodial Parents Earned More than $3,000 a Year
(combining data from 2007 to 2009 and all order sizes included)
Bandwidth
Amount of child support
paid
Proportion earning more than $3,000/
year 3 years -11.24
(-0.24) 0.002 (0.42)
2 years -19.47 (-0.34)
0.004 (0.69)
1 year -72.08 (-0.90)
0.005 (0.64)
Note: t statistics in parentheses. + p < .10, * p < 0.05, ** p < 0.01, *** p < 0.001
Table 7 shows significant impacts of the NCP EITC on all three outcomes for noncustodial parents with low orders when a bandwidth of two years is used.17 Using this bandwidth, we find that the proportion paying in full increases 2.1 percentage points at the age boundary, roughly double the effect size found among all noncustodial parents who meet the basic eligibility criteria for the NCP EITC. Using the same bandwidth, we find that the amount of child support paid increased $56.44 at the age boundary, suggesting that a small impact on the amount paid among noncustodial parents with low orders. Finally, table 7 shows that the estimated discontinuity in the share earning more than $3,000/year among noncustodial parents with low orders is 1.6 percentage points at the age boundary, using a bandwidth of two years. This suggests that the NCP EITC increased the share earning at least $3,000 a year among noncustodial parents with low orders by 1.6 percentage points. However, as noted earlier, if we construct a difference-in-difference estimate by subtracting the pre-program estimate from the 2007 to 2009 estimates, we would get smaller effects, and none of them would be statistically significant.
Table 7. Estimated Discontinuities for Three Outcome Variables, Ordered Amount Less than $3,000 a Year (2007–09 data)
Bandwidth Proportion paid in full
Amount paid
Proportion earning more than $3,000/yr.
3 years .018* (2.36)
34.77 (1.33)
.011 (1.38)
2 years .021* (2.21)
56.44+ (1.80)
.016+ (1.68)
1 year .032* (2.38)
94.84* (2.16)
.313* (2.37)
Note: t statistics in parentheses. + p < .10, * p < 0.05, ** p < 0.01, *** p < 0.001. N = 79,614
17 Single-year results are presented in the appendix tables.

18
Table 8 reports the local Wald estimators for the three outcome variables when noncustodial parents have low orders. Using a bandwidth of two years, the local Wald estimator suggests that a 1 percentage point increase in the eligibility rate for the NCP EITC would increase
• the share paying child support in full by .18 percentage points, • the average amount of child support paid by $490.20, and • the share earning at least $3,000 a year by .136 percentage points.
Table 8 also reports the effect of increasing the amount of the NCP EITC among noncustodial parents with low orders. Using a bandwidth of two years, we find that a $100 increase in the amount of the NCP EITC would increase
• the share paying child support in full by .05 percentage points, • the average amount of child support paid by $122.40, and • the share earning at least $3,000 a year by .03 percentage points.
These results suggest that increasing the eligibility rates for the NCP EITC have a much larger impact on behavior than increasing the amount of the credit.
Table 8. Local Wald Estimators (LWE) for Three Outcome Variables, Ordered Amount Less than $3,000 a Year (2007–09 data)
LWE using the Proportion Eligible for
Net Benefit from NCP EITC as the Denominator
LWE using the Amount of the Net Benefit from the NCP EITC as the Denominator
Bandwidth
(1) Proportion paying in
full
(2) Amount of
child support
paid
(3) Proportion earning at
least $3,000/ year
(4) Proportion paying in
full
(5) Amount of
child support
paid
(6) Proportion earning at
least $3,000/
year 3 years .156*
(2.37) 299.7 (1.33)
.091
(1.39) .0004* (2.37)
.754
(1.33) .0002
(1.39) 2 years .180**
(2.79) 490.2* (2.17)
.136*
(2.14) .0005** (2.79)
1.224*
(2.17) .0003*
(2.14) 1 year .276**
(3.02) 827.0** (2.65)
.273**
(3.05) .0007* (2.39)
2.089*
(2.14) .0007*
(2.41) Note: t statistics in parentheses. + p < .10, * p < 0.05, ** p < 0.01, *** p < 0.001
19
V. Conclusions
The take-up rate for New York’s noncustodial parent EITC has increased over 50 percent since the tax credit was enacted in 2006. During the first year of the credit, only 21 percent of eligible noncustodial parents received it. By 2009, this figure had increased to 32 percent, representing a 52 percent increase in four years. While this participation rate is still lower than desired, the federal EITC available to workers with no qualifying children had a participation rate of 45 percent five years after it was first introduced. This comparison is informative because New York’s NCP EITC is similar in size to the federal childless EITC. The take-up rate for the federal childless EITC has continued to improve over time. Hopefully, New York’s NCP EITC will do the same.
New York’s NCP EITC is encouraging parents to pay their current support orders in full. We estimate that the share of noncustodial parents who pay in full increased 1 percentage point because of the credit. In 2009, 56 percent of noncustodial parents who had a current support order for at least half the year and lived in New York paid their current support orders in full. Our research suggests that the NCP EITC added a percentage point to this figure, encouraging another 2,300 noncustodial parents to pay their current support order in full each year.
The purpose of the NCP EITC is to increase the work and child support payments of low-income noncustodial parents. Unfortunately, we cannot measure the effect of the NCP EITC on low-income noncustodial parents because the amount of income they earn is influenced by the NCP EITC. To avoid this endogeneity, we examine the impact of the NCP EITC on noncustodial parents with low orders, which is associated with low incomes but not influenced by the NCP EITC. Specifically, we focus on noncustodial parents with orders below $3,000 a year, which is about 45 percent of all noncustodial parents with an order.
We find that the NCP EITC has had a significant impact on child support compliance and work among noncustodial parents with low orders, increasing the share paying in full by 2 percentage points and increasing the share working by 1.6 percentage points. These results suggest that the NCP EITC is encouraging low-income noncustodial parents to work and pay their child support in full.
These estimates are probably upper-bound estimates of the NCP EITC’s effect during the 2007–09 period. We estimate these impacts by measuring the outcome variables for noncustodial parents as the age of their youngest child for whom child support is due increases from 15 to 21. For noncustodial parents with low orders, we find a significant drop in all our outcome variables as the youngest child turns 18 and the parent is no longer eligible for the NCP EITC. We attribute this drop to the NCP EITC. While it is possible that this discontinuity is not caused by the tax credit, we find no significant drop in outcomes when the youngest child turns 18 in 2005, the year before the enactment of the NCP EITC. When we conduct a difference-in-difference analysis of the pre-post period, our results are no longer statistically significant because the 2005 estimates are measured very imprecisely. More years of data before the enactment of the NCP EITC would assist this comparison, but these data were not available.

20
As time passes and more individuals learn about the NCP EITC, its incentive effect will increase. We anticipate that if this analysis is conducted on data from 2010 and later, the estimated impacts will be larger than reported here. The estimated impacts of the NCP EITC reported here are probably indicative of the tax credit’s longer-term effects.
One way to increase the participation rate and incentive effect of the NCP EITC is to increase the amount of the credit. We estimate that if the NCP credit amount were increased by $100, noncustodial parents with low orders would increase their child support by $122 and their likelihood of working by .03 percentage points.
The eligibility rate for the NCP EITC could be increased by allowing noncustodial parents to receive both the NCP EITC and the New York State EITC if they qualify for both credits. Currently, a parent must choose the larger of the two credits. However, this means that most low-income noncustodial parents who have resident children are receiving the larger NYS EITC and are not being encouraged to pay their child support. We estimate that 44–49 percent of noncustodial parents who are child support– and income-eligible for the NCP EITC are receiving the NYS EITC and not being incentivized to pay their child support.
Another way to increase the eligibility rate for the NCP EITC would be to give partial credit to parents who pay part of their child support. For example, noncustodial parents who paid at least half their child support due during the year could receive a credit reduced by twice the proportion of unpaid child support. Someone who paid three-quarters of their child support due would receive half the NCP EITC. This would ensure the incentive could still affect the behavior of noncustodial parents who suffered income reversals, such as job loss, during the year and cannot hope to pay the full amount due. These parents might be able to increase payments from half to three-quarters of their child support due and would receive partial credit for doing so.
Some experts have argued that the NCP EITC should be available to noncustodial parents who are poor regardless of whether they pay their child support in full (Mincy 2011). Parents with income above the poverty threshold would be required to pay their current support in full, but parents with incomes below that level would not be required to meet this requirement. This alternative would take away the incentive for poor noncustodial parents to pay their child support in full, but the work incentive that we find for noncustodial parents with low orders would remain in effect.

21
VI. References
Eissa, Nada, and Hilary Hoynes. 2006. “Behavioral Responses to Taxes: Lessons from the EITC and Labor Supply.” In Tax Policy and the Economy, vol. 20, edited by James Poterba. Cambridge, MA: MIT Press.
General Accounting Office (GAO). 2001. “Earned Income Tax Credit Participation.” GAO-02-290R. Washington, DC: Government Printing Office.
Hahn, Jinyong, Petra Todd, and Wilbert van der Klaauw. 2001. “Identification and Estimation of Treatment Effects with a Regression-Discontinuity Design.” Econometrica 69(1): 201–09.
Hotz, V. Joseph, Charles Mullin, and John Karl Scholz. 2005. “The Earned Income Tax Credit and the Labor Market Participation of Families on Welfare.” In The Incentives of Government Programs and the Well-Being of Families, edited by Bruce Meyer and Greg Duncan. Evanston/Chicago, IL: Joint Center for Poverty Research, Northwestern University/University of Chicago.
Imbens, Guido W. and Karthik Kalyanaraman. 2009. “Optimal Bandwidth Choice for the Regression Discontinuity Estimator.” Working paper 14,726. Cambridge, MA: National Bureau of Economic Research.
Imbens, Guido W., and Thomas Lemieux. 2008. “Regression Discontinuity Designs: A Guide to Practice.” Journal of Econometrics 142(2): 615–35.
Lippold, Kye, and Elaine Sorensen. 2011. Strengthening Families Through Stronger Fathers: Final Impact Report for the Pilot Employment Programs. Washington, DC: The Urban Institute.
Meyer, Bruce D. and Dan T. Rosenbaum. 2001. “Welfare, the earned income tax credit, and the labor supply of single mothers.” Quarterly Journal of Economics 116:1,063–1,114.
Mincy, Ronald B. 2011. “Making the EITC Work for Low-Income Noncustodial Fathers.” Presentation at “Helping Disadvantaged Men” conference, the Brookings Institution, Washington, D.C., December 5.
New York State Department of Taxation and Finance (NYS DTF). Office of Tax Policy Analysis. 2011. “Earned Income Tax Credit: Analysis for Credits Claimed in 2009.” Albany: NYS DTF.
Nichols, Austin. 2007. “Causal Inference with Observational Data.” Stata Journal 7(4): 507–41.
Sorensen, Elaine. 2010. “New York Noncustodial Parent EITC: Implementation and First-Year Findings.” Washington, DC: The Urban Institute.

22
VII. Appendices
A. Methodology Used to Produce the Regression Results
To measure the impact of the NCP EITC on child support and work, we cannot simply compare individuals with different net benefits from the NCP EITC because these net benefit amounts depend on income, which can be affected by the NCP EITC. However, there is a comparison that is largely free of this bias and relies on the eligibility cutoff. Noncustodial parents in New York still owe child support until their child is 21, but they are not eligible for the NCP EITC after their youngest nonresident child turns 18. We use this discontinuity in eligibility to model the effects of the NCP EITC using a regression discontinuity method (Nichols 2007; Hahn, Todd, and van der Klaauw 2001; Imbens and Lemieux 2008).
The idea behind regression discontinuity is to compare otherwise identical cases that differ only with respect to treatment status, where we assume that a case just on one side of the boundary is like a case just on the other. For our study, that means assuming someone whose youngest child was born late on December 31 is like someone whose youngest child was born early on January 1, except that the former has a child who turned 18 at the end of the year and therefore is not eligible for the tax credit. Through an accident of timing, otherwise identical parents face different incentives to pay child support in full. A comparison of their propensity to pay child support in full tells us about the effect of the policy.
In reality, we do not have enough data to compare people whose youngest children were born on only two days of the year. We must regress outcomes on age relative to the year 18 boundary, and project out to that boundary to estimate the jump in incentives and corresponding jump in outcomes at that boundary. Still, we reduce the weight of observations farther from the boundary and give maximal weight to observations closest to the boundary. The degree to which we include observations farther from the boundary is determined by the bandwidth of the estimator, with weights declining linearly to zero. A bandwidth of three years means that observations at age 18 get relative weight 1, observations at age 19 (or 17) get relative weight 2/3, observations at age 20 (or 16) get relative weight 1/3, and observations at age 21 (or 15) get weight zero.
In the regression discontinuity design, there is a trade-off between bias and efficiency in bandwidth selection. A smaller bandwidth reduces bias but increases the variability of estimates, leaving us unable to conclude much about the effect of interest. A larger bandwidth results in more precise estimates but may also introduce bias as we rely more on observations that are not otherwise identical except for treatment. Mean squared error is the sum of bias squared and the variance of the estimator. An expected MSE minimizing “optimal” bandwidth selector is given by Imbens and Kalyanaraman (2009). We report these optimal bandwidths (OB) in appendix table 1. Since these bandwidths depend on the curvature at the boundary and many other features of the data that vary by dependent variable, we report estimates for several bandwidths.

23
Appendix Table 1. Imbens and Kalyanaraman (2009) Optimal Bandwidth (OB) Estimates, in Years Year Paid in full OB Amount paid OB Working OB 2005 1.3816 2.1333 1.2376 2006 1.1307 3.0172 1.3586 2007 1.3436 2.9208 1.1357 2008 1.5038 2.9863 1.4695 2009 1.4460 4.2884 1.0569
Notes: Estimates constructed using local linear regression (triangle kernel, bandwidth 3), bootstrap SE.
We use a regression discontinuity design to examine three outcomes:
• whether a person is paying their child support in full, • the amount of child support paid, and • whether a person is working.
Because of the NCP EITC’s structure, we anticipate that the primary impact of the credit will be on the likelihood of paying child support in full. However, the NCP EITC could also influence the amount of child support paid and whether the individual is working, since the credit represents a subsidy for both activities. In general, the NCP EITC should incentivize the amount of child support paid until the order is fully paid and then have no incentive effect after that. With regard to working, we would expect the NCP EITC to encourage noncustodial parents to work since the credit is only available to workers. The tax credit’s effect on the amount of income earned depends on whether the net benefit is increasing. While the net benefit is increasing in size, there is an incentive to increase earned income; while the net benefit is decreasing in size, there is an incentive to decrease earned income.
The next step in our analysis is measuring the responsiveness of noncustodial parents to a change in the NCP EITC’s eligibility criteria or credit amount. For example, we want to estimate what will happen to child support compliance if the eligibility criteria for the NCP EITC are changed. To do this, we use the same regression discontinuity method discussed above to estimate the jump in eligibility for the NCP EITC at the age boundary and the jump in the amount of the net benefit from the NCP EITC at the age boundary We then examine the ratio of the jump in an outcome variable to the jump in either the eligibility rate or the amount of the net benefit. This ratio is equivalent to estimating a local Wald estimator.
The regression discontinuity estimator for the jump in outcome y takes the form shown in equation 1, where a is the age of youngest child with a current support order and K() is a kernel function.
−
−−
−
−=∆
∑∑∑
∑∑∑∑
∑∑∑
∑∑∑∑
≥∋≥∋≥∋
≥∋≥∋≥∋≥∋
<∋<∋<∋
<∋<∋<∋<∋2
181818
2
181818182
181818
2
18181818
)()()(
)()()()(
)()()(
)()()()(ˆ
iii
iiii
iii
iiii
aiii
aii
aiii
aiii
aiii
aii
aiiii
aiii
aii
aiii
aiii
aiii
aii
aiiii
aKaaKaKa
aKaaKyaKaKay
aKaaKaKa
aKaaKyaKaKayy
(1)

24
The local Wald estimator (LWE) can be written as shown in equation 2, or simply formed as the ratio of estimates from a regression discontinuity estimate for payment rates (y) divided by a regression discontinuity estimate for eligibility (z) of the NCP EITC.
−
−−
−
−
−
−−
−
−
=∆
∆=
∑∑∑
∑∑∑∑
∑∑∑
∑∑∑∑
∑∑∑
∑∑∑∑
∑∑∑
∑∑∑∑
≥∋≥∋≥∋
≥∋≥∋≥∋≥∋
<∋<∋<∋
<∋<∋<∋<∋
≥∋≥∋≥∋
≥∋≥∋≥∋≥∋
<∋<∋<∋
<∋<∋<∋<∋
2
181818
2
181818182
181818
2
18181818
2
181818
2
181818182
181818
2
18181818
)()()(
)()()()(
)()()(
)()()()(
)()()(
)()()()(
)()()(
)()()()(
ˆˆ
iii
iiii
iii
iiii
iii
iiii
iii
iiii
aiii
aii
aiii
aiii
aiii
aii
aiiii
aiii
aii
aiii
aiii
aiii
aii
aiiii
aiii
aii
aiii
aiii
aiii
aii
aiiii
aiii
aii
aiii
aiii
aiii
aii
aiiii
aKaaKaKa
aKaaKzaKaKaz
aKaaKaKa
aKaaKzaKaKaz
aKaaKaKa
aKaaKyaKaKay
aKaaKaKa
aKaaKyaKaKay
zy
LWE
(2)
All these estimates are easily computed for a triangle kernel using weighted least squares, with weights declining linearly as age a differs from 18, to zero at ages 15 and 21. For example, for equation 1, the weighted regression would include all observations where the youngest child with a current support order is age 15 to 21, and regress outcome y (e.g., payment in full) on Z (defined as a-18), a dummy D for Z at least zero (a at least 18), and DZ (Z interacted with D). The regression discontinuity estimator is the coefficient on D in that regression.
As noted above, the local Wald estimator in equation 2 is the ratio of two regression discontinuity estimators, one measuring the jump in an outcome such as payment in full (regression of outcome on Z, D, and DZ) as the numerator, and one measuring the jump in eligibility for the credit (regression of eligibility on Z, D, and DZ) as the denominator. Equivalent to the local Wald estimator is the estimated coefficient in a locally weighted instrumental variables regression where eligibility for the credit is instrumented by the dummy D (i.e., we can also estimate this in one equation instead of forming the ratio shown in equation 2). In either case, the point estimates are identical and standard errors virtually identical. In fact, local linear regression gives a predicted outcome at each value for the age of the youngest child with a current support order, and the regression discontinuity estimate is visible as the size of the break in the conditional expectation, where the estimates are constructed on either side of the discontinuity using only observations on that side.
B. Data Used in the Report
We have data from the New York Office of Temporary and Disability Assistance (OTDA) on the amount of child support paid and due in 2005, 2006, 2007, 2008, and 2009 for all cases in the New York Support Collections Unit system that meet one of three conditions: the case had a current support order at some point during the year; the case was flagged as eligible for the NCP EITC; or the case was open at the end of the year. These data also contain demographic characteristics about the noncustodial parent and his or her children, the noncustodial parent’s tax filing status, and three measures of income: quarterly earnings, W2 wages, and adjusted gross
25
income. In addition, we observe claiming of the NCP EITC and the amount of the credit received in 2006 and later.
We prepared the raw files for analysis by first merging all five years of data and sorting by case. We then used (scrambled) Social Security numbers (SSNs) to identify which cases were associated with a particular noncustodial parent.18 Finally, we used the (scrambled) SSNs to roll up all variables to the person level. If there were discrepancies in a person’s gender or race across the years of data, we took the mode value. All other variables were aggregated separately by year, taking means or totals depending on the desired final variable. The final dataset contained 977,799 individuals, with data structured by person-year.
We restricted the regression analysis to noncustodial parents who are at least 18 years old, have a current support order for at least half the year, do not have a filing status of married filing separately, and have a New York address (based on their ZIP code). We impose these restrictions since they reflect some of the basic eligibility requirements for the NCP EITC and are unlikely to be affected by the availability of the credit. The last characteristic is a proxy for being a full-year New York resident, which is an eligibility requirement for the NCP EITC. As discussed further below, for the regression analyses we kept only those noncustodial parents whose youngest child covered by a current support order was in the range of 15 to 21 years old (three years on either side of the age 18 eligibility boundary).
The primary outcome variable—proportion paying in full—is measured by assessing whether the amount of child support each noncustodial parent paid exceeds or equals the amount of current support due that year for all current support orders. The NCP EITC does not require a noncustodial parent to pay his or her current support order in full every month to qualify for the credit. Imposing this requirement would have been quite limiting. Most noncustodial parents fall behind in their child support for at least one month, if for no other reason than their biweekly checks do not coincide precisely with a monthly support obligation. In New York, as in most states, there is no grace period for late payments. If an obligation is not paid in the month it is due, it is considered late, even if the payment is made just one day late. The NCP EITC recognizes this and allows noncustodial parents to pay the total amount of current support due for the year at any point during the year.
The other two outcomes of interest are the amount of child support paid during the year and whether the noncustodial parent worked during the year. The amount of child support paid includes any payments toward current support or arrears since that is the amount that OTDA uses when determining whether a person has paid his or her current support orders in full. We define working as having reported income of more than $3,000 a year (measured in 2009 dollars), which is roughly a quarter of substantial gainful activity as defined by the Social Security Administration. As noted above, we have three sources of reported income: quarterly earnings, adjusted gross income, and W-2 earnings. If a noncustodial parent has reported income of at least 18 If a case was marked as having different SSNs in different years, we used the value that appeared most often; 2,502 of 1,571,306 cases were modified in this way. Because cases without a recorded SSN could not be precisely matched, we dropped those cases from our analysis; this eliminated 217,680 cases (13.9 percent of the total).

26
$3,000 a year from any single source, then he is considered working. We use this definition rather than defining working as having any reported income to avoid counting people who have very limited involvement in the labor market.
The other key variables that we measure are whether a noncustodial parent is eligible for a net benefit from the NCP EITC, and the amount of the net benefit. These two variables are used to measure the responsiveness of noncustodial parents to a change in the eligibility criteria or the amount of the NCP EITC. We consider a noncustodial parent eligible for a net benefit from the NCP EITC if he still receives a tax credit after child support arrears are deducted. As noted above, state tax refunds are intercepted to pay child support arrears in New York, so a noncustodial parent will receive the remainder of the NCP EITC after his arrears are paid. Although a reduction in arrears is a benefit to the noncustodial parent, it is not as tangible as receiving the credit.
Ideally, we would have information about noncustodial parents’ receipt of the New York State EITC to measure the net benefit from the noncustodial parent EITC. Unfortunately, we do not have this information, but we do know the noncustodial parent’s tax filing status. We assume that individuals who file as single or do not have a tax filing status are eligible for the childless NYS EITC if they meet the age and income requirements, which state that they must be between the ages of 25 and 64 and have positive adjusted gross income that is less than the eligibility ceiling ($13,440 in 2009). We assume that individuals who file as head of household, married filing jointly, or as a qualifying widow(er) are eligible for the child qualifying NYS EITC with one qualifying child if they meet the income eligibility requirement (adjusted gross income less than $35,463 in 2009).19
19 OTDA does not receive the adjusted gross income of noncustodial parents who file as married filing jointly. For these individuals, we use the maximum of their W-2 or quarterly earnings when determining whether they are income-eligible for the NCP EITC.

27
C. Appendix Tables
Appendix Table 2. Estimated Discontinuities in Proportion Paying in Full, Single Years (all order sizes included)
Bandwidth 2005 2006 2007 2008 2009 2 years .0051
(0.48) -.0021 (-0.20)
.0256** (2.58)
.0028 (0.29)
.0042 (0.44)
3 years .0073 (0.85)
.0029 (0.34)
.0225** (2.76)
.0006 (0.08)
.0061 (0.78)
2.5 years .0067 (0.71)
.0015 (0.16)
.0243** (2.73)
.0010 (0.12)
.0048 (0.57)
1.5 years .0018 (0.14)
-.0096 (-0.79)
.0272* (2.39)
.0065 (0.58)
.0033 (0.29)
1 year .0002 (0.01)
-.0227 (-1.52)
.0266+ (1.91)
.0056 (0.40)
.0052 (0.38)
Observations 64,304 62,308 68,759 69,987 74,158 Note: t statistics in parentheses. + p < 0.10, * p < 0.05, ** p < 0.01, *** p < 0.001
Appendix Table 3. Estimated Discontinuities in the Amount of Child Support Paid, Single Years (all order sizes included)
Bandwidth 2005 2006 2007 2008 2009 2 years 203.9+
(1.93) -82.86 (-0.78)
31.85 (0.32)
-91.16 (-0.93)
2.682 (0.03)
3 years 176.0* (2.07)
-67.16 (-0.78)
-15.84 (-0.19)
-39.63 (-0.50)
21.88 (0.27)
2.5 years 201.7* (2.15)
-74.33 (-0.79)
0.779 (0.01)
-58.09 (-0.66)
19.69 (0.23)
1.5 years 194.1 (1.57)
-87.08 (-0.70)
60.12 (0.52)
-142.6 (-1.26)
-13.61 (-0.12)
1 year 158.2 (1.03)
-122.8 (-0.80)
75.02 (0.55)
-239.2+ (-1.69)
-50.22 (-0.36)
Observations 64,304 62,308 68,759 69,987 74,158 Note: t statistics in parentheses. + p < 0.10, * p < 0.05, ** p < 0.01, *** p < 0.001
Appendix Table 4. Estimated Discontinuities in the Proportion Earning over $3,000 in 2009 Dollars, Single Years (all orders sizes included) Bandwidth 2005 2006 2007 2008 2009
2 years .0095 (0.97)
-.0025 (-0.26)
-.0032 (-0.35)
.0004 (0.04)
.0130 (1.45)
3 years .0041 (0.51)
-.0006 (-0.08)
-.0016 (-0.21)
-.0042 (-0.56)
.0105 (1.43)
2.5 years .0065 (0.73)
-.0007 (-0.08)
-.0013 (-0.16)
-.0020 (-0.24)
.0118 (1.46)
1.5 years .0110 (0.96)
-.0054 (-0.48)
-.0082 (-0.78)
.0013 (0.13)
.0190 (1.83)
1 year .0195 (1.40)
-.0146 (-1.05)
-.0128 (-0.99)
.0029 (0.23)
.0231 (1.81)
Observations 64,304 62,308 68,759 69,987 74,158 Note: t statistics in parentheses. + p < 0.10, * p < 0.05, ** p < 0.01, *** p < 0.001

28
Appendix Table 5. Estimated Discontinuities in Proportion Paying in Full, Single Years (orders under $3,000 in 2009 dollars)
Bandwidth 2005 2006 2007 2008 2009 2 years .0105
(0.60) -.0072 (-0.41)
.0435** (2.64)
.0198 (1.22)
.0004 (0.02)
3 years .0118 (0.83)
.0023 (0.16)
.0397** (2.93)
.0165 (1.24)
-.0002 (-0.02)
2.5 years .0116 (0.75)
-.0009 (-0.06)
.0416** (2.81)
.0168 (1.16)
-.0007 (-0.05)
1.5 years .0121 (0.60)
-.0138 (-0.69)
.0465* (2.45)
.0194 (1.03)
.0097 (0.52)
1 year .0162 (0.65)
-.0132 (-0.54)
.0484* (2.08)
.0232 (1.01)
.0231 (1.02)
Observations 24,046 23,427 25,758 26,450 27,406 Note: t statistics in parentheses. + p < 0.10, * p < 0.05, ** p < 0.01, *** p < 0.001
Appendix Table 6. Estimated Discontinuities in the Amount of Child Support Paid, Single Years (orders under $3,000 in 2009 dollars)
Bandwidth 2005 2006 2007 2008 2009 2 years -6.957
(-0.11) -19.78 (-0.34)
140.2** (2.65)
-4.238 (-0.08)
37.09 (0.69)
3 years -11.27 (-0.22)
0.106 (0.00)
93.11* (2.09)
1.749 (0.04)
12.74 (0.29)
2.5 years -8.745 (-0.16)
-14.10 (-0.27)
113.4* (2.36)
-5.931 (-0.12)
25.04 (0.52)
1.5 years -10.64 (-0.15)
-11.85 (-0.18)
155.4* (2.57)
1.717 (0.03)
55.76 (0.90)
1 year 28.64 (0.33)
-31.20 (-0.40)
161.9* (2.19)
39.32 (0.50)
82.43 (1.09)
Observations 24,046 23,427 25,758 26,450 27,406 Note: t statistics in parentheses. + p < 0.10, * p < 0.05, ** p < 0.01, *** p < 0.001
Appendix Table 7. Estimated Discontinuities in the Proportion Earning over $3,000 in 2009 Dollars, Single Years (orders under $3,000 in 2009 dollars)
Bandwidth 2005 2006 2007 2008 2009 2 years .0108
(0.62) -.0171 (-0.99)
.0270+ (1.65)
.0092 (0.57)
0.0109 (0.68)
3 years .0022 (0.16)
-.0004 (-0.03)
.0226+ (1.68)
.0058 (0.44)
0.0036 (0.28)
2.5 years .0058 (0.37)
-.0078 (-0.50)
.0238 (1.61)
.0077 (0.53)
0.0069 (0.48)
1.5 years .0201 (1.00)
-.0278 (-1.40)
.0277 (1.46)
.0124 (0.66)
0.0224 (1.21)
1 year .0472+ (1.92)
-.0490* (-2.00)
.0272 (1.17)
.0284 (1.25)
0.0367 (1.62)
Observations 24,046 23,427 25,758 26,450 27,406 Note: t statistics in parentheses. + p < 0.10, * p < 0.05, ** p < 0.01, *** p < 0.001

29
Appendix Table 8. Estimated Discontinuity in the Proportion Paying in Full, the Proportion Eligible for a Net Benefit from the NCP EITC, the Amount of the Net Benefit, and Their Associated Local Wald Estimators (combining data from 2007 to 2009 and including all order sizes)
Bandwidth
(1) Proportion
paying in full
(2) Proportion
eligible for net benefit from the
NCP EITC
(3) Amount of net benefit from the
NCP EITC
(4) Local Wald
estimator (1)/(2)
(5) Local Wald
estimator (1)/(3)
2 years .0108+ (1.92)
.0807*** (37.87)
28.09*** (31.59)
.0108+ (1.92)
.0004+ (1.92)
3 years .0096* (2.08)
.0803*** (44.36)
27.38*** (71.73)
.0096* (2.08)
.0004* (2.08)
2.5 years .0099* (1.97)
.0804*** (42.29)
27.43*** (65.44)
.0099* (1.97)
.0004* (1.97)
1.5 years .0122+ (1.88)
.0810*** (31.88)
27.89*** (27.14)
.0122+ (1.88)
.0004* (2.38)
1 year .0124 (1.56)
.0797*** (50.24)
27.81*** (41.93)
.0124 (1.56)
.0004 (1.56)
Observations 212,904 212,904 212,904 212,904 212,904 Note: t statistics in parentheses. + p < 0.10, * p < 0.05, ** p < 0.01, *** p < 0.001
Appendix Table 9. Estimated Discontinuity in the Amount of Child Support Paid, the Proportion Eligible for a Net Benefit from the NCP EITC, the Amount of the Net Benefit, and Their Associated Local Wald Estimators (combining data from 2007 to 2009 and including all order sizes)
Bandwidth
(1) Amount of
child support paid
(2) Proportion
eligible for net benefit from the
NCP EITC
(3) Amount of net benefit from the
NCP EITC
(4) Local Wald
estimator (1)/(2)
(5) Local Wald
estimator (1)/(3)
2 years -19.47 (-0.34)
.0807*** (37.87)
28.09*** (31.59)
-241.3 (-0.34)
-.693 (-0.34)
3 years -11.24 (-0.24)
.0803*** (44.36)
27.38*** (71.73)
-52.36 (-0.09)
-.411 (-0.24)
2.5 years -12.98 (-0.25)
.0804*** (42.29)
27.43*** (65.44)
-161.3 (-0.25)
-.473 (-0.25)
1.5 years -32.49 (-0.49)
.0810*** (31.88)
27.89*** (27.14)
-407.2 (-0.50)
-1.165 (-.63)
1 year -72.08 (-0.90)
.0797*** (50.24)
27.81*** (41.93)
-904.8 (-0.90)
-2.592 (-0.90)
Observations 212,904 212,904 212,904 212,904 212,904 Note: t statistics in parentheses. + p < 0.10, * p < 0.05, ** p < 0.01, *** p < 0.001
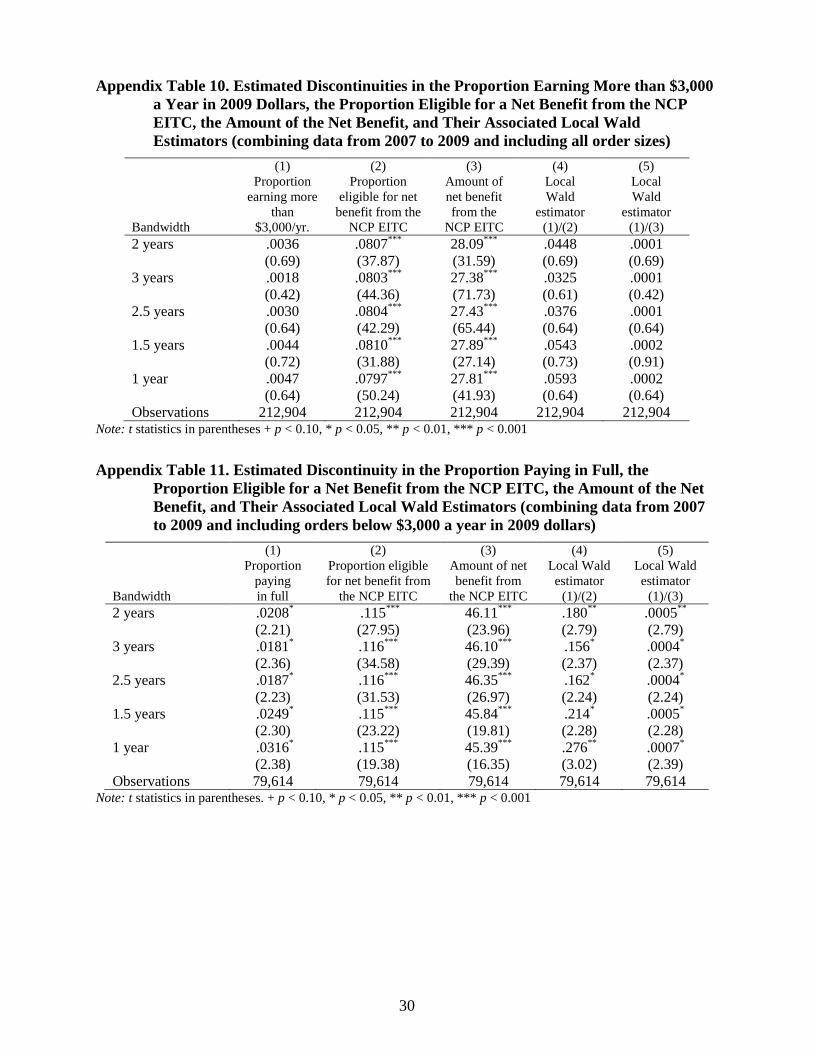
30
Appendix Table 10. Estimated Discontinuities in the Proportion Earning More than $3,000 a Year in 2009 Dollars, the Proportion Eligible for a Net Benefit from the NCP EITC, the Amount of the Net Benefit, and Their Associated Local Wald Estimators (combining data from 2007 to 2009 and including all order sizes)
Bandwidth
(1) Proportion
earning more than
$3,000/yr.
(2) Proportion
eligible for net benefit from the
NCP EITC
(3) Amount of net benefit from the
NCP EITC
(4) Local Wald
estimator (1)/(2)
(5) Local Wald
estimator (1)/(3)
2 years .0036 (0.69)
.0807*** (37.87)
28.09*** (31.59)
.0448 (0.69)
.0001 (0.69)
3 years .0018 (0.42)
.0803*** (44.36)
27.38*** (71.73)
.0325 (0.61)
.0001 (0.42)
2.5 years .0030 (0.64)
.0804*** (42.29)
27.43*** (65.44)
.0376 (0.64)
.0001 (0.64)
1.5 years .0044 (0.72)
.0810*** (31.88)
27.89*** (27.14)
.0543 (0.73)
.0002 (0.91)
1 year .0047 (0.64)
.0797*** (50.24)
27.81*** (41.93)
.0593 (0.64)
.0002 (0.64)
Observations 212,904 212,904 212,904 212,904 212,904 Note: t statistics in parentheses + p < 0.10, * p < 0.05, ** p < 0.01, *** p < 0.001
Appendix Table 11. Estimated Discontinuity in the Proportion Paying in Full, the Proportion Eligible for a Net Benefit from the NCP EITC, the Amount of the Net Benefit, and Their Associated Local Wald Estimators (combining data from 2007 to 2009 and including orders below $3,000 a year in 2009 dollars)
Bandwidth
(1) Proportion
paying in full
(2) Proportion eligible for net benefit from
the NCP EITC
(3) Amount of net benefit from
the NCP EITC
(4) Local Wald estimator
(1)/(2)
(5) Local Wald estimator
(1)/(3) 2 years .0208*
(2.21) .115*** (27.95)
46.11*** (23.96)
.180** (2.79)
.0005** (2.79)
3 years .0181* (2.36)
.116*** (34.58)
46.10*** (29.39)
.156* (2.37)
.0004* (2.37)
2.5 years .0187* (2.23)
.116*** (31.53)
46.35*** (26.97)
.162* (2.24)
.0004* (2.24)
1.5 years .0249* (2.30)
.115*** (23.22)
45.84*** (19.81)
.214* (2.28)
.0005* (2.28)
1 year .0316* (2.38)
.115*** (19.38)
45.39*** (16.35)
.276** (3.02)
.0007* (2.39)
Observations 79,614 79,614 79,614 79,614 79,614 Note: t statistics in parentheses. + p < 0.10, * p < 0.05, ** p < 0.01, *** p < 0.001

31
Appendix Table 12. Estimated Discontinuity in the Amount of Child Support Paid, the Proportion Eligible for a Net Benefit from the NCP EITC, the Amount of the Net Benefit, and Their Associated Local Wald Estimators (combining data from 2007 to 2009 and including orders below $3,000 a year in 2009 dollars)
Bandwidth
(1) Amount of
child support
paid
(2) Proportion
eligible for net benefit from the
NCP EITC
(3) Amount of net benefit from the
NCP EITC
(4) Local Wald
estimator (1)/(2)
(5) Local Wald
estimator (1)/(3)
2 years 56.44+ (1.80)
.115*** (27.95)
46.11*** (23.96)
490.2* (2.17)
1.224* (2.17)
3 years 34.77 (1.33)
.116*** (34.58)
46.10*** (29.39)
299.7 (1.33)
0.754 (1.33)
2.5 years 42.73 (1.51)
.116*** (31.53)
46.35*** (26.97)
368.6 (1.51)
0.922 (1.51)
1.5 years 70.66* (1.96)
.115*** (23.22)
45.84*** (19.81)
613.6+ (1.95)
1.537+ (1.94)
1 year 94.84* (2.16)
.115*** (19.38)
45.39*** (16.35)
827.0** (2.65)
2.089* (2.14)
Observations 79,614 79,614 79,614 79,614 79,614 Note: t statistics in parentheses. + p < 0.10, * p < 0.05, ** p < 0.01, *** p < 0.001
Appendix Table 13. Estimated Discontinuities in the Proportion Earning More than $3,000 a Year in 2009 Dollars, the Proportion Eligible for a Net Benefit from the NCP EITC, the Amount of the Net Benefit, and Their Associated Local Wald Estimators (combining data from 2007 to 2009 and including orders below $3,000 a year in 2009 dollars)
Bandwidth
(1) Proportion
earning more than
$3,000/yr.
(2) Proportion
eligible for net benefit from the
NCP EITC
(3) Amount of net benefit from the
NCP EITC
(4) Local Wald
estimator (1)/(2)
(5) Local Wald
estimator (1)/(3)
2 years .0157+ (1.68)
.115*** (27.95)
46.11*** (23.96)
.136* (2.14)
0.0003* (2.14)
3 years .0106 (1.38)
.116*** (34.58)
46.10*** (29.39)
.0912 (1.39)
0.0002 (1.39)
2.5 years .0127 (1.52)
.116*** (31.53)
46.35*** (26.97)
.110 (1.53)
0.0003 (1.53)
1.5 years .0211* (1.96)
.115*** (23.22)
45.84*** (19.81)
.182* (1.97)
0.0005* (1.97)
1 year .0313* (2.37)
.115*** (19.38)
45.39*** (16.35)
.273** (3.05)
0.0007* (2.41)
Observations 79,614 79,614 79,614 79,614 79,614 Note: t statistics in parentheses. + p < 0.10, * p < 0.05, ** p < 0.01, *** p < 0.001