the new standard - advisors.td.com · 4 august 2017 monthly perspectives i special edition...
TRANSCRIPT

This document is for distribution to Canadian clients only. Please refer to the last page of this report for important information.
Monthly Perspectives Special Edition, August 2017
Alternative Investments
the new standard

2
Monthly Perspectives I Special EditionAugust 2017
In this issue
The new standard ����������������������������������������������������������������������������������������������������������������� 3
Performance ��������������������������������������������������������������������������������������������������������������������������� 4
Standard allocations ����������������������������������������������������������������������������������������������������������� 7
The final word �����������������������������������������������������������������������������������������������������������������������10
Monthly market review ������������������������������������������������������������������������������������������������������11
Important information �������������������������������������������������������������������������������������������������������12
the new standardThe experiences of the past decade have inspired many investors, pensions, endowments and wealth managers to find additional ways to construct and manage investment portfolios� Many have turned to hedge funds (absolute return), private capital and real assets, which are often referred to as “alternatives”� For many of these investors today, constructing a portfolio without “alternatives” would be as unthinkable as driving a car without airbags�
In this month’s special addition of Monthly Perspectives, we take a close look at these investments to provide greater understanding of what they are, how they work, where they fit and why they are an important part of building an asset balanced and risk diversified portfolio�
We believe these investments should no longer be categorized or referred to as “alternative�” Instead, there should be universal agreement that from this day forward, using these investments to build contemporary portfolios should be known for what it is: the new standard�
Brad Simpson Chief Wealth Strategist, TD Wealth

3
Monthly Perspectives I Special EditionAugust 2017
The new standard
One of the big topics of discussion in investment management today is the use of alternative investments� While there is no official definition, hedge funds (aka: absolute return), private capital and real assets are the securities that are typically bucketed together as “alternatives�” In the last few decades, the traditional 60/40 stock and bond portfolio dominated both institutional and individual client portfolios� During this era, the utilization of these “alternative” strategies was limited to a fringe group of ultra-high net worth individuals and their personal foundations� Today, according to the July release of the Global Alternatives Survey 2017 by Willis Towers Watson, a leading investment consultant to global pensions and endowments, total alternative assets under management globally stand at US$6.5 trillion (Source: Bloomberg Finance L�P�)
That’s US$6,500,000,000,000� Now we know that in the modern world of monetary policy and government debt, the word “trillion” is thrown around like a hockey card in a school yard, but my Scottish ancestry senses that this is no wee sum� The fact is that the use of these so-called alternatives today is widespread� The allocations to these investments by pensions, endowments and many individual investors are significant� For these investors, alternatives offer different risk and return characteristics from traditional assets, which make them a compelling asset and risk diversifier, and often, they offer an opportunity for higher yields� As a result, many of these investors commit large portions of their overall allocation to hedge funds, private capital and real assets� Here’s the reality: these investments should no longer be categorized or referred to as “alternative�” Instead, there should be universal agreement that from this day forward,
$6,500,000,000,000the inclusion of these assets should be known for what they have become: the new standard�
This advancement in portfolio construction reminds me of what happened with automobiles in the past� Consider airbags� Patents for these life saving devices go back to the 1950s, but it was not until the mid-1980s that Mercedes Benz fitted its
S-Class vehicles with an airbag—the culmination of over 13 years of development and the beginning
of a new era in vehicle safety� Just like hedge funds, private capital and real
assets, airbags were considered an alternative component, something
only found in the vehicles of the wealthy� Today, almost all cars come with front, front-side and side-curtain airbags� This is true of many safety and performance innovations including: the crumple zone, safety steering system, seat belt tensioner, traction control and
anti-lock braking systems� Look what is happening today with the
all-electric powertrain� Just a few years ago, the Tesla Model S was a
marvel that only few could hope to own, and now we are at the beginning of mass
production of the Tesla Model 3� As such, many other car manufactures have quickly followed�
Ask yourself this question the next time you are driving your family somewhere: are the performance and safety gear in your modern car alternatives? No, they are standard, just like hedge funds, private capital and real assets are standard part of your contemporary portfolio� The reason for this is that portfolios with these new standard components provide better risk adjusted performance because they are designed to traverse our new environment and get you and your family to where you need to go�
USD

4
Monthly Perspectives I Special EditionAugust 2017
PerformanceHedge fundsHedge funds are private pools of investment capital with broad flexibility to buy and/or sell a wide range of assets. One common attribute is that they seek to profit from market inefficiencies rather than relying purely on economic growth to drive returns. There is no “one-size-fits-all,” and the types of investment strategies pursued by individual hedge funds are extremely diverse.
While not all hedge fund strategies could be considered standard, the following three are:
Long/ShortAn investment strategy that uses leverage to buy securities that are expected to increase in value (go “long”) and sell borrowed securities that are expected to decrease in value (“short selling” or “shorting”). The goal of shorting is to buy the same securities back for a lower price at a future date, thereby profiting from the difference. Whereas long-only investing enables profits from a positive outlook on a security, short selling also allows the manager to profit from a negative outlook.
Market neutralAn investment strategy that seeks to hedge out all or a significant majority of market risk by offsetting long and short positions, resulting in extremely low or zero market exposure.
Fund of fundsA fund that allocates to multiple funds and possibly to direct private transactions as well. One benefit to this approach is that investors gain broad exposure to different strategies and managers for a smaller initial investment (compared to investing in each one separately). In addition, a professional manager selects investments and provides oversight, deciding when to buy, sell or reallocate. Funds of funds tend to have additional fees in compensation for this professional management.
Unprecedented intervention by the visible hand of central banks over the past decade has led to grand distortions in financial markets (Coming soon: Grand Distortions: Portfolio Strategy and Implementation, Summer 2017)�
With much of the global economy stuck in neutral, low interest rates leaving investors yearning for yield and the Trump Effect leading uncertainty to historical highs, many pension and endowments have transformed how they think about constructing investment portfolios� Every year, Natixis Global Asset Management does a comprehensive survey of institutional clients� In their most recent publication (Spring 2017) they surveyed 660 institutional investors including: corporate, public and government pension funds, sovereign wealth funds, insurance companies, and endowments and foundations collectively managing more than US$35 trillion in assets�
What became abundantly clear is that Institutional investors worldwide are having a hard time diversifying portfolios with traditional asset classes� 54% of institutions indicated that equities stocks and bonds are too highly correlated to provide distinctive sources of return and 84% stated that the low-yield environment is their biggest concern when managing risk, followed by generating returns (82%) and funding their long-term liabilities (72%)�
Percent of institutions stated that the low-yield investment environment is their biggest concern
when managing risk�
Eighty-Four
Nearly seven in ten (68%) say meeting growth objectives and short-term liquidity needs are a challenge to their organization� The similarities between these responses and the views of an individual wealth client are considerable� All told, institutions are clearly worried about managing volatility, which is the foundation as to why they have been migrating to building portfolios with the new standards�

5
Monthly Perspectives I Special EditionAugust 2017
Return Standard Deviation Beta vs� Market Sharpe Ratio PAIN Index
Real Assets 8.21% 10.29% 0.53 0.57 5.68%
Global Equities 7.15% 14.85% 1.00 0.36 11.58%
Canadian Equities 8.06% 19.81% 1.10 0.36 13.73%
Canadian Bonds 6.17% 9.21% 0.34 0.41 3.73%
Table 1: Real assets versus traditional assets
Source: Bloomberg Finance L.P. and Morningstar Direct. Annualized returns from Jan. 1, 1994 - Dec. 31, 2016. Real Assets = 33% DJ Global World Real Estate Total Return Index, 33% Bloomberg Commodity Total Return Index, 33% Cambridge Associates US Private Equity Index; Global Equities = MSCI World Gross Return Index; Canadian Equities = S&P/TSX Composite Total Return Index; Canadian Bonds = FTSE TMX Canada Universe Bond Index. All index returns are in USD. Cash equivalent for the Sharpe ratio is BofAML US Treasury Bill 3 Month Total Return Index and Beta is measured against the MSCI World Gross Return Index.
Let’s consider real assets� Real assets tend to have a complementary return profile with equities and bonds� Their compelling attributes include:
• Stability: Steady cash flow supported by regulated or contractual revenues and attractive operating margins
• Income: Reliable current income with long-term capital appreciation
• Upside potential – Meaningful leverage to economic growth
• Visible growth drivers: Positive growth momentum led by significant fundamental trends
• Inflation protection: Cash flows tend to increase in an inflationary environment
Real assets provide portfolio diversification in the form of low volatility and attractive
risk adjusted returns�
Table 1 considers the performance of real assets compared to the traditional assets in terms of return, deviation (volatility), value of return (Sharpe Ratio) and correlation to the S&P/TSX (beta)� The comparative performance is excellent�
Finally, we considered the Pain Index, which measures the depth, duration and frequency of losses of an investment� In this case, the type of risk being measured is capital preservation risk� The lower the value, the better: a value of 0.0% indicates that an investment has never lost money� Real assets had the second best Pain Index after Canadian bonds� This in itself is a big positive, but it is only half the story� One of the key attributes to our Risk Priority Management philosophy at TD Wealth is to innovate and look forward� With interest rates at all-time lows, the future Pain Index returns for Canadian bonds are likely going to change� This contrasts significantly with real assets where performance, based on supply and demand, could be considerable as we move into an era where governments around the world have a need to renew essential infrastructure� In 2016, McKinsey Global Institute estimated that there would be US$42 trillion spent on infrastructure projects like ports, airports, rail water, telecom, roads and power, over the next 15 years� These past positive return attributes, combined with future prospects are a big reason behind why this asset has become a new standard�
Private CapitalOwnership interest in a company or portion of a company or debt obligation that is not publicly owned, quoted or traded on a stock exchange� From an investment perspective, private capital generally refers to equity or debt-related finance (pools of capital formed through funds or private investors) designed to bring about some sort of change in a private company, such as helping to grow a new business�
Real AssetsPhysical assets valued for their intrinsic worth, such as:
Real EstateReal estate debt; private real estate equity; public real estate securities (REITS)�
InfrastructureDebt and equity in hard assets (e�g� power plants and toll roads) that generate cash flows by providing essential services�
CommoditiesExposure to energy, metals or agricultural products via physical commodities, natural resource equities or private commingled funds�
Timber and farmlandAlso considered as real assets�
Source: BlackRock Inc.

6
Monthly Perspectives I Special EditionAugust 2017
Return Standard Deviation
Beta vs� Market
Sharpe Ratio PAIN Index
Market Neutral 4.50% 3.02% 0.07 0.75 1.47%
Long/Short Equity 7.94% 9.12% 0.48 0.64 4.28%
Global Equities 6.23% 15.50% 1.00 0.32 13.13%
Canadian Equities 7.43% 20.67% 1.12 0.34 15.15%
Canadian Bonds 4.57% 5.54% 0.08 0.43 1.86%
Table 2: Hedge fund strategies versus traditional assets
Source: Bloomberg Finance L.P. and Morningstar Direct. Annualized returns from Jan. 1, 1997 - Dec. 31, 2016. Market Neutral = HFRI Market Neutral Index; Long/Short Equity=HFRI Equity Hedge Index; Global Equities = MSCI World Gross Return Index ; Canadian Equities= S&P/TSX Composite Total Return Index; Global Bonds = BofAML Global Broad Market Total Return Index. All index returns are in USD. Cash equivalent for the Sharpe ratio is BofAML US Treasury Bill 3 Month Total Return Index and Beta is measured against the MSCI World Gross Return Index.
In terms of performance, the story is very similar for low volatility conservative hedge fund (absolute return) strategies except they are even more conservative� Long/short and market neutral strategies have had a lower level of correlation to equity markets� This means they have shown the tendency to move in a different direction than equity markets� As such, adding a long/short or market neutral strategy to a traditional portfolio can act as a diversifier and potentially lead to a higher return and a lower level of volatility�
Table 2 considers the performance of hedge funds utilizing the same measure as above and are equally compelling looking through the rear view mirror� In particular, the Pain Index for both is very favorable�
As a further illustration of the downside protection offered by hedge fund strategies, the following chart highlights the returns of global equity markets versus long/short and market neutral strategies during periods of extreme equity market volatility� In each of the periods, the losses of hedge fund strategies were less than that of the traditional long-only equity markets�
Figure 1: Periods of extreme equity market downturns
Source: Bloomberg Finance L.P. and Morningstar Direct. Returns are reported in U.S. dollars and are not annualized.
HFRI Market Neutral Index HFRI Equity Market Hedge (Long/Short) MSCI World ex Canada
Median of Returns -0.8% -7.0% -19.0%
Mean of Returns 1.5% -10.9% -23.8%
Beta/Correlation
Considers how an investment’s price reacts to changes in an equity market�
Standard Deviation
Considers risk by the volatility of total returns�
Sharpe Ratio
A measure to evaluate an investment’s realized returns versus the risk taken�
Pain Index
Quantifies three measures simultaneously:
1) Depth of losses
2) Duration of losses
3) Frequency of losses
-60%
-50%
-40%
-30%
-20%
-10%
0%
10%
20%
30%
MSCI World ex Canada
HFRI Equity Market Hedge (Long/Short)
HFRI Market Neutral Index
Apr 2011 - Sep 2011
Apr 2010 - June 2010
Oct 2007 - Feb 2009
Mar 2002 - Sep 2002
Mar 2000 - Sep 2001
Jun 1998 - Aug 1998
Retu
rn
7
Monthly Perspectives I Special EditionAugust 2017
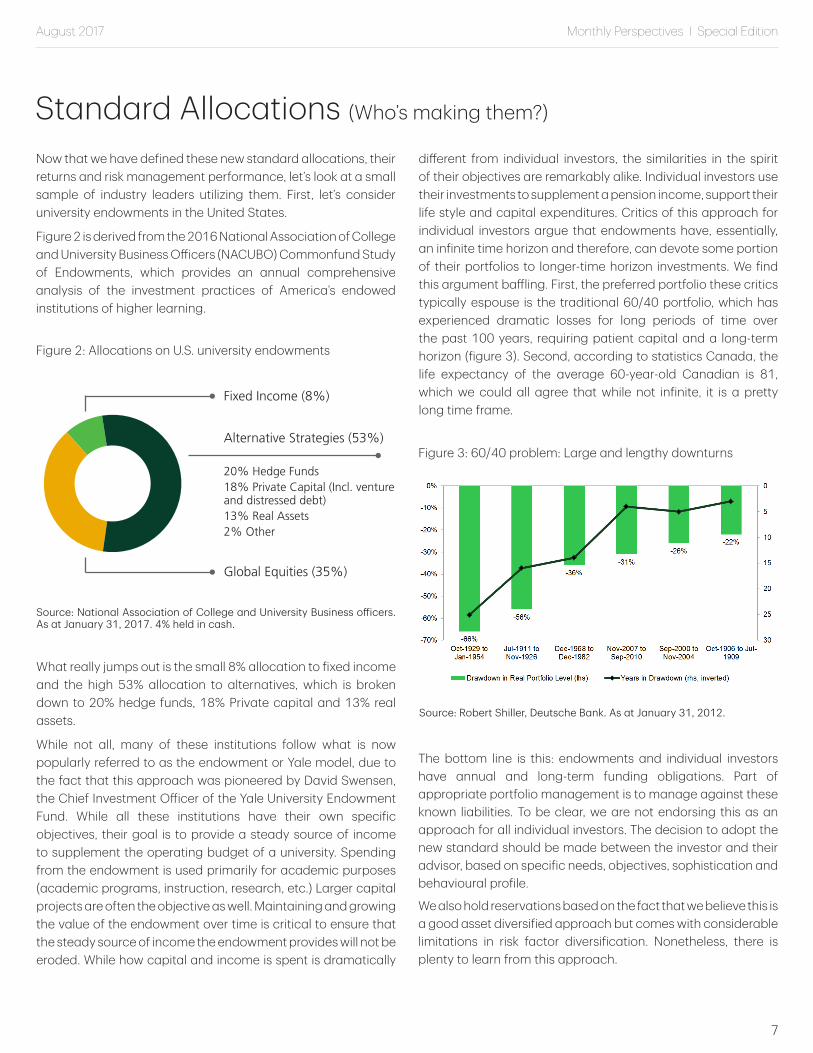
Now that we have defined these new standard allocations, their returns and risk management performance, let’s look at a small sample of industry leaders utilizing them� First, let’s consider university endowments in the United States�
Figure 2 is derived from the 2016 National Association of College and University Business Officers (NACUBO) Commonfund Study of Endowments, which provides an annual comprehensive analysis of the investment practices of America’s endowed institutions of higher learning�
What really jumps out is the small 8% allocation to fixed income and the high 53% allocation to alternatives, which is broken down to 20% hedge funds, 18% Private capital and 13% real assets�
While not all, many of these institutions follow what is now popularly referred to as the endowment or Yale model, due to the fact that this approach was pioneered by David Swensen, the Chief Investment Officer of the Yale University Endowment Fund� While all these institutions have their own specific objectives, their goal is to provide a steady source of income to supplement the operating budget of a university� Spending from the endowment is used primarily for academic purposes (academic programs, instruction, research, etc�) Larger capital projects are often the objective as well� Maintaining and growing the value of the endowment over time is critical to ensure that the steady source of income the endowment provides will not be eroded� While how capital and income is spent is dramatically
Standard Allocations (Who’s making them?)
Figure 2: Allocations on U�S� university endowments
Source: National Association of College and University Business officers. As at January 31, 2017. 4% held in cash.
20%HedgeFunds18%PrivateCapital(Incl.ventureanddistresseddebt)13%RealAssets2%Other
FixedIncome(8%)
AlternativeStrategies(53%)
GlobalEquities(35%)
Figure 3: 60/40 problem: Large and lengthy downturns
Source: Robert Shiller, Deutsche Bank. As at January 31, 2012.
different from individual investors, the similarities in the spirit of their objectives are remarkably alike� Individual investors use their investments to supplement a pension income, support their life style and capital expenditures� Critics of this approach for individual investors argue that endowments have, essentially, an infinite time horizon and therefore, can devote some portion of their portfolios to longer-time horizon investments� We find this argument baffling� First, the preferred portfolio these critics typically espouse is the traditional 60/40 portfolio, which has experienced dramatic losses for long periods of time over the past 100 years, requiring patient capital and a long-term horizon (figure 3)� Second, according to statistics Canada, the life expectancy of the average 60-year-old Canadian is 81, which we could all agree that while not infinite, it is a pretty long time frame�
The bottom line is this: endowments and individual investors have annual and long-term funding obligations� Part of appropriate portfolio management is to manage against these known liabilities� To be clear, we are not endorsing this as an approach for all individual investors� The decision to adopt the new standard should be made between the investor and their advisor, based on specific needs, objectives, sophistication and behavioural profile�
We also hold reservations based on the fact that we believe this is a good asset diversified approach but comes with considerable limitations in risk factor diversification� Nonetheless, there is plenty to learn from this approach�

8
Monthly Perspectives I Special EditionAugust 2017
Total Portfolio Approach
Figure 4: CPPIB Total Portfolio Approach
This leads us to our second example of industry leaders utilizing the new standards: the Canadian Pension Plan� In November 2016, we wrote a piece called “Newtonian Wisdom”, which questioned the effectiveness of traditional finance, in particular, the ability of experts to foresee the future� In a nut shell, we challenged the notion of cause and effect that lies at the heart of traditional finance suggesting that this type of thinking works well in closed ended systems (like a conveyer belt) but not so well in complex adaptive systems (a world like ours made up of humans, who learn, adapt, change and interact)� Consequently, advisors and their clients can better understand markets if they consider them as a complex adaptive system� We then introduced the concept of building portfolios that are risk allocated, focused on the active management of income, volatility, liquidity, real asset and foreign exchange risk� These risk allocated portfolios look to harvest and manage this array of risk factors in pursuit of returns and risk management� In contrast, traditional asset allocation portfolios almost exclusively use fixed allocations to bonds in order to control risk�
Practitioners utilizing risk factors tend to employ a greater spectrum of strategies and mandates including: hedge funds, private capital, and real assets� The Canadian Pension Plan Investment Board (CPPIB), which utilizes what they call the Total Portfolio Approach, can be described as follows:
Their distinctive investment strategy—which focuses on the risk/return characteristics of investments rather than on traditional asset labels—helps them make decisions in the context of the characteristics and performance of the total fund�
CPPIB’s Total Portfolio Approach (TPA) is a principal element of their overall investment strategy� It is designed to ensure that planned risk exposures at the total portfolio level are maintained as individual investments enter, leave or change in value�
As they seek to add value through active investing by extending beyond the Reference Portfolio (representing a set of economic exposures and systematic risks which they treat as a starting point), they use this approach to safeguard against unintended risks�
The approach essentially diversifies the portfolio at the level of risk and return streams, rather than at the level of specific asset classes such as real estate or infrastructure� By adopting this approach—essentially taking a total portfolio view—they are able to avoid the pressure to buy or dispose of illiquid investments at non-preferable times just in order to stay close to allocation targets� Instead, they look through asset class labels to assess risk—and make decisions accordingly�
Ultimately, TPA is a means of challenging assumptions, minimizing unintended exposures, accommodating diverse investment programs and building line of sight into the true substance of their portfolio�
Figure 5: CPPIB asset mix
Source: CPPIB 2017 Annual Report.
Source: CPPIB 2017 Annual Report
Asset Diversification
Geographic Diversification
Program Diversification
Risk Diversification
Ass
et M
ix
Canadian private equity
Foreign developed market public equities
Foreign developed market private equities
Gov. bonds, cash and absolute return
Real estate
Infrastructure
Credit investments
Emerging market public equities
Canadian public equity
Other real assets
Emerging market private equities
27.9%
16.3%
16.0%
12.6%
7.7%
5.7%
5.5%
3.3%
2.8%
1.8%
0.4%
They believe that by recognizing that the portfolio is a collection of interrelated parts and strategies that together make the whole, their Total Portfolio Approach enables them to build a portfolio that is consistently superior to those that focus on more traditional, rigid asset allocations�
Figure 4 illustrates their Total Portfolio Approach and figure 5 shows the broad use of asset classes and risk factors for building portfolios�

9
Monthly Perspectives I Special EditionAugust 2017
This multi-factor approach is designed to help investors better understand the key sources of long-term return across asset classes� It also provides investors with a new way to think about portfolio diversification, allowing them to focus not only on diversification across asset classes but also on diversification across the underlying sources of risk and return�
The use of absolute returns, private capital and real assets, combined with risk factor diversification, is a critical part of the portfolio construction and ongoing portfolio management process at TD Wealth� Similar to the CPPIB’s Total Portfolio Approach, we call our process Risk Priority Management, where we utilize broader asset allocation on the surface and risk factor diversification below the surface to manage risk while pursuing returns (Figure 7)� We believe that if this blend of traditional and contemporary thinking is good enough for your public pension, it is probably the right fit for a personal pension plan as well, which is how we think most wealth investors look at their investment portfolio�
Figure 6: Risk Priority Management allocations
Source: PAIR. For illustration purposes only.
Figure 7: Risk Priority Management risk factor diversification
Source: PAIR. For illustration purposes only.
What about Canadian wealth investors?
In Canada, alternative strategies are generally only available through private pooled funds sold under offering memorandums to “accredited investors�” This used to be the case in the United States but a new category of investment known as liquid alternatives has emerged�
Liquid alternatives seek returns via assets that have low (or zero) correlation with traditional asset classes and employ nontraditional investment strategies� They have many of the same characteristics of traditional alternatives but eliminate some disadvantages by offering daily liquidity, transparence and low investment minimums, to name a few�
Currently, there are no liquid alternatives in Canada; however, in the fall of 2016, the Canadian Securities Administrators published a proposal for a “liquid alternatives” regulatory framework�
If this proposal is ratified, the framework would potentially create a new category of prospectus offered investment funds called “alternative funds” that would be able to use investment strategies that are not currently permitted� AIMA (Alternative Investment Management Association) Canada suggests that the proposal could be in place by Spring 2018�
Risk Priority Portfolios are built with investment solutions that span beyond traditional asset allocation� The blend of traditional and alternative asset classes helps manage the individual risk factors, providing better control of risks in a portfolio� We have incorporated this methodology because we believe that investors need to take their diversification strategy beyond asset allocation to incorporate risk factor allocation�
Equity Risk Factor Allocation
Fixed Income Risk Factor Allocation
Mul
ti an
d Re
al Asse
t Risk
Factor Allocation
Private Equity
AbsoluteReturns
Real Assets
Multi-factors
Private Debt
UnconstrainedFunds
Bonds
Equities
AbsoluteReturns
Equities
Fixed Income
Cash
Equity Risk Income RiskVolatility Risk Liquidity RiskReal Asset Risk Foreign Exchange Risk
Source: Morningstar Direct as at December 31, 2016. Growth of U.S. liquid alternatives measures AUM growth within the following Morningstar defined categories for Open End and Exchange Traded Funds: multialternative, long-short equity, managed futures, market neutral and trading (inverse commodities, inverse debt, inverse equity, leveraged commodities, leveraged debt, leveraged equity).
Growth of liquid alternatives in the U.S.
$0
$100
$200
$300
$400
2012 2013 2014 2015 2016
Bill
ion
s

10
Monthly Perspectives I Special EditionAugust 2017
ThefinalwordWhen it comes to portfolio construction techniques and portfolio management strategy and tactics, time changes everything� What works in one environment might not work so well in the next� Often with advancements there is a small group of early adopters before there is a usage breakout to a larger group, this is precisely what has happened with the use of the new standards�
The contemporary asset allocation and risk factor diversification model has no division of the investment universe along asset class or product type� Additionally, there is no distinction between traditional and alternative strategies� All investments—active or passive, traditional or alternative—are simply return distributions that provide building blocks for portfolio construction to provide returns�
The 60/40 portfolio and traditional market benchmarks are less relevant today� Most asset owners’ investment objectives involve absolute return requirements, not relative performance� The key risk is the shortfall in portfolio returns in meeting liability streams or other investment objectives that bear little relation to market indices� Perhaps the only thing that stays the same is the fact that most wealth clients, like pensions and endowments, want more balanced gain with less financial and emotional pain� Building portfolios with new standards and risk factor diversification goes a long way to delivering just that�
Attributes Risk Priority Management
Our goal is to build bespoke portfolios with institution grade asset allocation and risk diversification� Specifically, we want portfolios to have the following defined attributes:
Focused on client goalsProperly places investor goals and needs ahead of “benchmark” performance�
Reduced volatilityReduces the reliance on interest sensitive low-return/high-risk investments to protect against expected volatility�
Consistent returnsAims to deliver consistent returns with less pain: lower losses, less often for shorter periods of time�
Enhanced asset allocationEnhances the traditional asset allocation process, which is full of equity risk and rising correlations�
Proper diversificationProvides the foundation for a properly diversified portfolio�
“We believe Risk Priority Management at TD Wealth will change the way diversified portfolios are constructed for wealth clients�”
The right fit
Brad Simpson Chief Wealth Strategist, TD Wealth

11
Monthly Perspectives I Special EditionAugust 2017
(%) (%) (%) (%) (%) (%) (%) (%) (%)
CanadianIndices($CA)Return Index 1Month 3Months YTD 1Year 3Years 5YearsSince
1/1/201210Years 20Years
S&P/TSXComposite(TR) 49,834 -0.06 -2.13 -0.17 6.81 2.58 8.56 7.61 3.90 6.50
S&P/TSXComposite(PR) 15,144 -0.25 -2.84 -1.57 3.85 -0.41 5.36 4.37 0.88 4.03
S&P/TSX60(TR) 2,371 0.05 -2.29 -0.55 8.22 3.29 9.26 8.26 4.04 6.83
S&P/TSXSmallCap(TR) 966 -0.01 -3.54 -4.63 -1.68 -0.77 4.61 3.09 0.71 -
U.S.Indices($US)Return Index 1Month 3Months YTD 1Year 3Years 5YearsSince
1/1/201210Years 20Years
S&P500(TR) 4,754 1.62 3.70 9.05 15.55 10.72 14.68 15.09 7.69 6.83
S&P500(PR) 2,461 1.54 3.21 7.98 13.20 8.42 12.27 12.46 5.39 4.85
DowJonesIndustrial(PR) 21,575 1.05 3.03 8.61 17.05 9.21 10.65 10.51 5.03 4.94
NASDAQComposite(PR) 6,344 3.32 4.91 12.99 22.90 13.23 16.63 16.59 9.56 7.15
Russell2000(TR) 6,980 0.90 2.26 5.51 18.63 9.95 14.22 14.06 7.77 7.79
U.S.Indices($CA)Return Index 1Month 3Months YTD 1Year 3Years 5YearsSince
1/1/201210Years 20Years
S&P500(TR) 5,935 -2.23 -5.24 4.49 10.62 15.88 19.85 20.34 9.41 6.29
S&P500(PR) 3,072 -2.32 -5.69 3.46 8.37 13.47 17.33 16.99 7.07 4.32
DowJonesIndustrial(PR) 26,935 -2.78 -5.85 4.07 12.05 14.30 15.64 14.86 6.70 4.41
NASDAQComposite(PR) 7,920 -0.60 -4.13 8.27 17.65 18.51 21.89 21.67 11.31 6.61
Russell2000(TR) 8,714 -2.93 -6.55 1.10 13.57 15.07 19.37 19.26 9.49 7.24
MSCIIndices($US)TotalReturn Index 1Month 3Months YTD 1Year 3Years 5YearsSince
1/1/201210Years 20Years
World 7,774 1.79 4.49 10.32 16.06 7.03 12.12 11.45 4.98 5.87
EAFE(Europe,Australasia,FarEast) 7,547 2.03 5.76 13.25 17.33 2.97 9.37 8.44 1.86 4.74
EM(EmergingMarkets) 2,272 4.65 8.92 17.67 23.65 2.31 4.86 4.32 2.18 5.93
MSCIIndices($CA)TotalReturn Index 1Month 3Months YTD 1Year 3Years 5YearsSince
1/1/201210Years 20Years
World 9,705 -2.07 -4.52 5.71 11.10 12.01 17.17 16.53 6.65 5.34
EAFE(Europe,Australasia,FarEast) 9,422 -1.84 -3.35 8.51 12.32 7.77 14.30 13.38 3.48 4.21
EM(EmergingMarkets) 2,837 0.68 -0.46 12.75 18.37 7.08 9.59 9.07 3.81 5.39
Currency Level 1Month 3Months YTD 1Year 3Years 5Years 10Years 20Years
CanadianDollar($US/$CA) 80.10 3.94 9.43 4.36 4.46 -4.45 -4.31 -1.57 0.51
RegionalIndices(NativeCurrency)PriceReturn
Index 1Month 3Months YTD 1Year 3Years 5YearsSince
1/1/201210Years 20Years
LondonFTSE100(UK) 7,390 1.06 2.59 4.10 9.90 3.17 5.57 4.99 1.51 0.02
HangSeng(HongKong) 26,672 3.52 8.36 14.17 21.84 2.52 6.14 6.18 1.41 2.47
Nikkei225(Japan) 20,000 -0.17 4.18 5.03 20.70 8.59 18.13 16.70 1.49 -0.08
BenchmarkBondYields 3Month 5Year 10Year 30Year
GovernmentofCanadaYields 0.74 1.53 1.92 2.34
U.S.TreasuryYields 1.07 1.80 2.24 2.82
CanadianBondIndices($CA)TotalReturn Index 1Month 3Months YTD 1Year 3Years 5YearsSince
1/1/201210Years
FTSETMXCanadaUniverseBondIndex 1015.61 -1.90 -2.22 0.42 -2.70 2.91 2.76 2.96 4.90
FTSETMXCanadianShortTermBondIndex(1-5Years) 695.28 -0.41 -1.22 -0.17 -0.36 1.53 1.82 1.83 3.46
FTSETMXCanadianMidTermBondIndex(5-10) 1106.89 -1.52 -3.00 -0.20 -2.91 3.10 3.14 3.43 5.64
FTSETMXLongTermBondIndex(10+Years) 1615.52 -4.32 -3.21 1.49 -5.86 4.63 3.66 4.10 6.71
Sources: TD Securities Inc�, Bloomberg Finance L�P� TR: total return, PR: price return� As at July 31, 2017�
Monthlymarketreview

12
Monthly Perspectives I Special EditionAugust 2017
Importantinformation
Percentage of subject companies under each rating category—BUY (covering Action List BUY, BUY and Spec. BUY ratings), HOLD and REDUCE (covering TENDER and REDUCE ratings). As at August 1, 2017.
Distribution of Research Ratings
Percentage of subject companies within each of the three categories (BUY, HOLD and REDUCE) for which TD Securities Inc. has provided investment banking services within the last 12 months. As at August 1, 2017.
Investment Services Provided0%
10%20%30%40%50%60%70%80%
BUY HOLD REDUCE
REDUCE2.7%
BUY58.3%
HOLD39.0%
61.82%
37.27%
0.91%
0%10%20%30%40%50%60%70%80%
BUY HOLD REDUCE
REDUCE2.7%
BUY58.3%
HOLD39.0%
61.82%
37.27%
0.91%
This report is for informational purposes only and is not an offer or solicitation with respect to the purchase or sale of any investment fund, security or other product. Particular investment, trading, or tax strategies should be evaluated relative to each individual’s objectives. [Graphs and charts are used for illustrative purposes only and do not reflect future values or future performance.]This document does not provide individual financial, legal, investment or tax advice. Please consult your own legal, investment and/or tax advisor.
TD Waterhouse Canada Inc. and/or its affiliated persons or companies may hold a position in the securities mentioned, including options, futures and other derivative instruments thereon, and may, as principal or agent, buy or sell such securities. Affiliated persons or companies may also make a market in and participate in an underwriting of such securities.
Certain statements in this document may contain forward-looking statements (“FLS”) that are predictive in nature and may include words such as “expects”, “anticipates”, “intends”, “believes”, “estimates” and similar forward-looking expressions or negative versions thereof. FLS are based on current expectations and projections about future general economic, political and relevant market factors, such as interest and foreign exchange rates, equity and capital markets, the general business environment, assuming no changes to tax or other laws or government regulation or catastrophic events. Expectations and projections about future events are inherently subject to risks and uncertainties, which may be unforeseeable. Such expectations and projections may be incorrect in the future. FLS are not guarantees of future performance. Actual events could differ materially from those expressed or implied in any FLS. A number of important factors including those factors set out above can contribute to these digressions. You should avoid placing any reliance on FLS.
Full disclosures for all companies covered by TD Securities Inc. can be viewed at https://www.tdsresearch.com/equities/welcome.important.disclosure.action
Company Ticker Disclosures
- - -
- - -
- - -
- - -
- - -
1� TD Securities Inc., TD Securities (USA) LLC or an affiliated company has managed or co-managed a public offering of securities within the last 12 months with respect to the subject company. 2. TD Securities Inc., TD Securities (USA) LLC or an affiliated company has received compensation for investment banking services within the last 12 months with respect to the subject company. 3. TD Securities Inc., TD Securities (USA) LLC or an affiliated company expects to receive compensation for investment banking services within the next three months with respect to the subject company. 4� TD Securities Inc. or TD Securities (USA) LLC has provided investment banking services within the last 12 months with respect to the subject company. 5. A long position in the securities of the subject company is held by the research analyst, by a member of the research analyst’s household, or in an account over which the research analyst has discretion or control. 6. A short position in the securities of the subject company is held by the research analyst, by a member of the research analyst’s household, or in an account over which the research analyst has discretion or control. 7� A long position in the derivative securities of the subject company is held by the research analyst, by a member of the research analyst’s household, or in an account over which the research analyst has discretion or control. 8. A short position in the derivative securities of the subject company is held by the research analyst, by a member of the research analyst’s household, or in an account over which the research analyst has discretion or control. 9. TD Securities Inc. and/or an affiliated company is a market maker, or is associated with the specialist that makes a market, in the securities of the subject company. 10. TD Securities Inc. and/or affiliated companies own 1% or more of the equity securities of the subject company. 11. A partner, director or officer of TD Securities Inc. or TD Securities (USA) LLC, or a research analyst involved in the preparation of this report has, during the preceding 12 months, provided services to the subject company for remuneration. 12. Subordinate voting shares. 13. Restricted voting shares. 14. Non-voting shares. 15. Common/variable voting shares. 16. Limited voting shares.
Research Ratings
Action List BUY: The stock’s total return is expected to exceed a minimum of 15%, on a risk-adjusted basis, over the next 12 months and it is a top pick in the Analyst’s sector.
BUY: The stock’s total return is expected to exceed a minimum of 15%, on a risk-adjusted basis, over the next 12 months. SPECULATIVE BUY: The stock’s total return is expected to exceed 30% over the next 12 months; however, there is material event risk associated with the investment that could result in significant loss. HOLD: The stock’s total return is expected
to be between 0% and 15%, on a risk-adjusted basis, over the next 12 months. TENDER: Investors are advised to tender their shares to a specific offer for the company’s securities. REDUCE: The stock’s total return is expected to be negative over the next 12 months.
Overall Risk Rating in order of increasing risk: Low (7.6% of coverage universe), Medium (38.9%), High (44.1%), Speculative (9.4%)
TD Waterhouse Canada Inc. makes its research products available in electronic format. These research products are posted to our proprietary websites for all eligible clients to access by password and we distribute the information to our sales personnel who then may distribute it to their retail clients under the appropriate circumstances either by email, fax or regular mail. No recipient may pass on to any other person, or reproduce by any means, the information contained in this report without our prior written consent.
The Portfolio Advice and Investment Research analyst(s) responsible for this report hereby certify that (i) the recommendations and technical opinions expressed in the research report accurately reflect the personal views of the analyst(s) about any and all of the securities or issuers discussed herein, and (ii) no part of the research analyst’s compensation was, is, or will be, directly or indirectly, related to the provision of specific recommendations or views expressed by the research analyst in the research report.
The Portfolio Advice & Investment Research analyst(s) responsible for this report may own securities of the issuer(s) discussed in this report. As with most other employees, the analyst(s) who prepared this report are compensated based upon (among other factors) the overall profitability of TD Waterhouse Canada Inc. and its affiliates, which includes the overall profitability of investment banking services, however TD Waterhouse Canada Inc. does not compensate its analysts based on specific investment banking transactions.
TD Wealth represents the products and services offered by TD Waterhouse Canada Inc. (Member – Canadian Investor Protection Fund), TD Waterhouse Private Investment Counsel Inc., TD Wealth Private Banking (offered by The Toronto-Dominion Bank) and TD Wealth Private Trust (offered by The Canada Trust Company).
The Portfolio Advice and Investment Research team is part of TD Waterhouse Canada Inc., a subsidiary of The Toronto-Dominion Bank.
FTSE TMX Global Debt Capital Markets Inc. 2017 “FTSE®” is a trade mark of FTSE International Ltd and is used under licence. “TMX” is a trade mark of TSX Inc. and is used under licence. All rights in the FTSE TMX Global Debt Capital Markets Inc.’s indices and / or FTSE TMX Global Debt Capital Markets Inc.’s ratings vest in FTSE TMX Global Debt Capital Markets Inc. and/or its licensors. Neither FTSE TMX Global Debt Capital Markets Inc. nor its licensors accept any liability for any errors or omissions in such indices and / or ratings or underlying data. No further distribution of FTSE TMX Global Debt Capital Markets Inc.’s data is permitted without FTSE TMX Global Debt Capital Markets Inc.’s express written consent.
Bloomberg and Bloomberg.com are trademarks and service marks of Bloomberg Finance L.P., a Delaware limited partnership, or its subsidiaries. All rights reserved.
“TD Securities” is the trade name which TD Securities Inc. and TD Securities (USA) LLC jointly use to market their institutional equity services.
TD Securities is a trade-mark of The Toronto-Dominion Bank representing TD Securities Inc., TD Securities (USA) LLC, TD Securities Limited and certain corporate and investment banking activities of The Toronto-Dominion Bank.
All trademarks are the property of their respective owners.
® The TD logo and other trade-marks are the property of The Toronto-Dominion Bank.