the new jersey turnpike’s time of day pricing initiative ... · trb 2007 annual meeting cd-rom...
TRANSCRIPT

The New Jersey Turnpike’s Time of Day Pricing Initiative’s Behavioral Impacts and the Observed Role of Travel Distance on the Underlying Elasticities
José Holguín-VerasProfessor, Ph.D., P.E.Department of Civil and Environmental Engineering, Rensselaer Polytechnic InstituteJEC 4030, 110 8th Street, Troy, NY 12180, U.S.ATel: (518) 276- 6221 Fax: (518) 276-4833, Email: [email protected]
Ning XuGraduate Research Assistant, M.S., M.EDepartment of Civil and Environmental Engineering, Rensselaer Polytechnic InstituteJEC 4037, 110 8th Street, Troy, NY 12180, U.S.A Tel: (518) 276-3121 Fax: (518) 276-4833, Email: [email protected]
Qian WangGraduate Research Assistant, M.S.Department of Civil and Environmental Engineering, Rensselaer Polytechnic InstituteJEC 4037, 110 8th Street, Troy, NY 12180, U.S.ATel: (518) 276-3121 Fax: (518) 276-4833, Email: [email protected]
Kaan OzbayAssociate Professor, Ph.D., P.E.Department of Civil and Environmental Engineering, Rutgers UniversityP.O. Box 909, Piscataway, NJ 07855, U.S.ATel: (732) 445-2792 Fax: (732) 445-0577, Email: [email protected]
Juan C. ZorrillaTransportation Analyst, M.S.Cambridge Systematics, Inc.100 Cambridge Park Drive, Suite 400Cambridge, MA 02140, U.S.A, Email: [email protected]
Submitted to Transportation Research BoardNov 15, 2006 7361=4611+ 2750 words
TRB 2007 Annual Meeting CD-ROM Paper revised from original submittal.

Holguín-Veras et al. 1
ABSTRACT
This paper discusses the key findings of a research project aimed at assessing the behavioral impacts of the time of day pricing implementation at the New Jersey Turnpike. The paper analyzes data collected by the authors that included both behavioral and travel patterns before and after the time of day pricing initiative.
The analyses of the data revealed that: (1) About 7.0% of individual drivers (6.6% of car trips) changed behavior as a consequence of the time of day pricing initiative, which translates into market elasticities with respect to toll changes equal to -0.398 using the number of individuals as the unit of demand, and -0.545 using the number of trips per month; (2) Users responded to time of day pricing by implementing multidimensional strategies, including changes in facility usage, changes in time of travel, changes in the productivity of car travel, and changes in mode/occupancy; (3) Users traveling relatively shorter distances exhibited more elastic behavior than those traveling long distances; and, (4) Only around 5% had more than half hour flexibility and traveled during peak hours, which could be the target of the time of day pricing initiative since they have the flexibility to shift to off-peak periods.
KEY WORDS: time of day pricing, behavioral impacts of pricing
TRB 2007 Annual Meeting CD-ROM Paper revised from original submittal.

Holguín-Veras et al. 2
1. INTRODUCTION
In September 2000, the New Jersey Turnpike Authority (NJTA) introduced a time of day pricing program, which provided toll discounts for passenger car drivers that travel on the New Jersey turnpike and pay tolls using their electronic toll collection (E-ZPass), and deeper discounts if they travel during off-peak (i.e., 9:00 AM - 4:30 PM, and 6:30 PM - 7:00 AM on weekdays). Following this implementation, the Federal Highway Administration’s Value Pricing Program decided to sponsor research aimed at assessing the behavioral impacts produced by this initiative. This paper discusses the main findings of that research project.
The New Jersey Turnpike (referred here as the turnpike) is a 148 mile-toll road that extends from the Delaware Memorial Bridge in the South of New Jersey to the George Washington Bridge in New York City. The road was built between December 1949 and January 1951 after legislation was enacted establishing the NJTA (1). The Authority's mandate included the construction and implementation of a 'pay-as-you-use' facility, and the management of the facility to enhance traffic flow and quality of service for users. The turnpike was built on the State Highway 100 corridor at a cost of $278 million.
According to the information provided to the authors by NJTA staff, previous tollschedules at the turnpike did not change with time of day or traffic conditions, because tolls were only a function of vehicle type. This situation changed in September 2000, when a time of day pricing initiative was put in place (in January 2003, the tolls were increased as a second stage of the time of day pricing program). Several operational changes took place, including:
1. The introduction of electronic toll collection system (E-ZPass) to the facility in September 2000, eliminating the need for cash, tickets or tokens on the facility.
2. Toll increases for cash users and peak E-ZPass users, while E-ZPass off-peak period users continued to pay the same toll amounts as in 1991. As part of this program, different toll levels were charged to users depending on time of day and vehicle type; such that, E-ZPass users started to pay discounted tolls while using the turnpike during off-peak hours. Currently, for passenger cars using E-ZPass the toll differential between peak and off-peak hours rangesbetween 10 to 60 cents depending on distance traveled. On average, peak hour tolls are 15% higher than off-peak hour tolls (2).
The main objective of this research was to conduct a comprehensive assessment of traffic and behavioral impacts, though this paper only discusses behavioral impacts. The analyses are based on data that contain travel and behavioral patterns of current and former regular users of the facility (a regular user was defined as an individual using the facility more than once a week). The reader is referred to (3) for traffic impact analyses, and (4) for the project final report.
The remainder of the paper is organized as follows: Section 2 briefly overviews the survey methodology used and data collected. Section 3 summarizes the key results from the passenger survey. Section 4 discusses the key findings. For space reasons, the paper does not include a comprehensive literature review, which could be found in (4).
2. THE SURVEY DATA
The survey was conducted during the period June-July, 2004, using computer aided telephone interviews and a single stage random sample based on random digit telephone calls. The target population was defined as all individuals who have or had used the turnpike on a regular basis (at least once per week) since the September 2000 time of day pricing implementation. Throughout the paper these two groups of users are referred to as current users and former users. Although
TRB 2007 Annual Meeting CD-ROM Paper revised from original submittal.

Holguín-Veras et al. 3
the turnpike is used for thru trips, cost considerations suggested to collect data only from the counties in New Jersey that concentrate the bulk of the users.
Due to the time elapsed since the implementation of the toll changes, the interviewers spent considerable time ensuring that the individuals included in the survey did remember the 2000 toll changes. The survey included questions designed to assess users’ behavioral patterns before and after the time of day pricing initiative, socio economic and travel profiles. The survey had four sections: (1) demographics; (2) characteristics of the most recent car trips (for both current and former users); (3) usage and awareness of E-ZPass and toll discount programs; and (5) impacts of the time of day pricing initiative. The overall response rate was 9.7%.
The data contain 513 observations comprised of 483 (94.2%) current users, i.e., travelers who have continued using the turnpike on a regular basis (at least once per week) since before September 2000; and 30 (5.8%) former users who drove through the turnpike on regular basis before September 2000 and now travel on alternate routes or public transportation. The sample was expanded using the trip frequencies for each user as the expansion factor (there were no datathat could be used as control totals). After sample expansion, the original 513 observations were found to represent 4044 trips/month, in which 3804 trips (94.1%) were made by current users and 240 trips (5.9%) were made by former users.
3. KEY FINDINGS
This section summarizes the findings about socio-economic characteristics, trip attributes, awareness of toll discounts, and the impact of the time of day pricing initiative on their behavior.
3.1 Demographics
The data indicate that white (75.8%), middle-aged (43.9 years in average) people dominated the sample, with a relatively larger proportion of males (58.5%). The majority of respondents have at least some college education (69.9%), with a median household income of $82,000/year. These results are not surprising because experience shows that the population segment most likely to participate in telephone surveys is the group of middle aged white males with above average income and education level.
The majority of respondents (52.8%) reported no significant change in household income from 2001 to 2003, 24.3% reported that income increased, and 11.2% indicated that income decreased. Approximately three-fourths of respondents said they work full time (73.8%), while 8.8% work part time. The majority (71.1%) of those who work said that they cannot work at home, which suggests that work trips are an important component of their travel.
The households tended to be of small size with 2.2 adults and 0.8 children on average.The average number of cars in household (2.1) is the same as the average number of licensed drivers (2.1) with 82.8% of the sampled households owning at least as many cars as licensed drivers. This suggests that these households produce a significant number of car trips.
3.2 Respondents’ Most Recent Trips
The survey collected data about the characteristics of current and former users’ most recent trips including trip frequency, purpose, time of travel, travel costs, and exit numbers traveled on the turnpike for current users. The results showed that the vast majority (73.7%) of car trips were made for work, either commuting to work (54.1%) or for job related purposes (19.6%). As expected, work related trips dominate every day of the week except for Sunday,
TRB 2007 Annual Meeting CD-ROM Paper revised from original submittal.

Holguín-Veras et al. 4
when most trips are made for recreation/shopping purposes. There is a significant peak on Fridays (30.0% of trips), and a smaller one on Wednesdays (16.1%). The relatively larger amount of car trips on Fridays may be related to after hour social activities in New York City. Monday is slightly lower than the rest of the week, making up for 10.2% of trips, which was expected given that people are coming off the weekend and are likely to do fewer recreation/shopping trips, as well as job travel. Traveling on Sundays represents 4.3% of weekly trips.
The trip purpose distribution for former users is different than that for current users (see Table 1). More than half of former users (56.8%) made their trips for recreation/shopping purposes, with work related trips making up 20.7% of trips. These are probably due to the different employment patterns among current and former users. The majority of current users(78.3%) work full time, while only about half of former users (53.3%) do; 16.7% current userswork part time, while only 8.6% former users do; only 7.2% current users are retired, while about a quarter of former users (26.7%) are.
Table 1 also shows the day of the week distributions of trips by trip purpose for former users. The distribution of trips by day varies significantly from that of current users. The busiest days are Friday and Saturday, each making up for 36.1% of the total number of trips. Sunday accounted for 15.5% of the trips, while only 12.3% of the trips took place between Monday and Thursday. This distribution can be explained by the fact that most trips (56.8%) were made for recreational purposes, therefore they were more likely to be made on weekends. However, thesmall sample of former users suggests caution when interpreting results. The data show that the average travel time through the turnpike for current users is slightly more than 57 minutes, which makes up for two-thirds of the average door to door travel time (85 minutes).
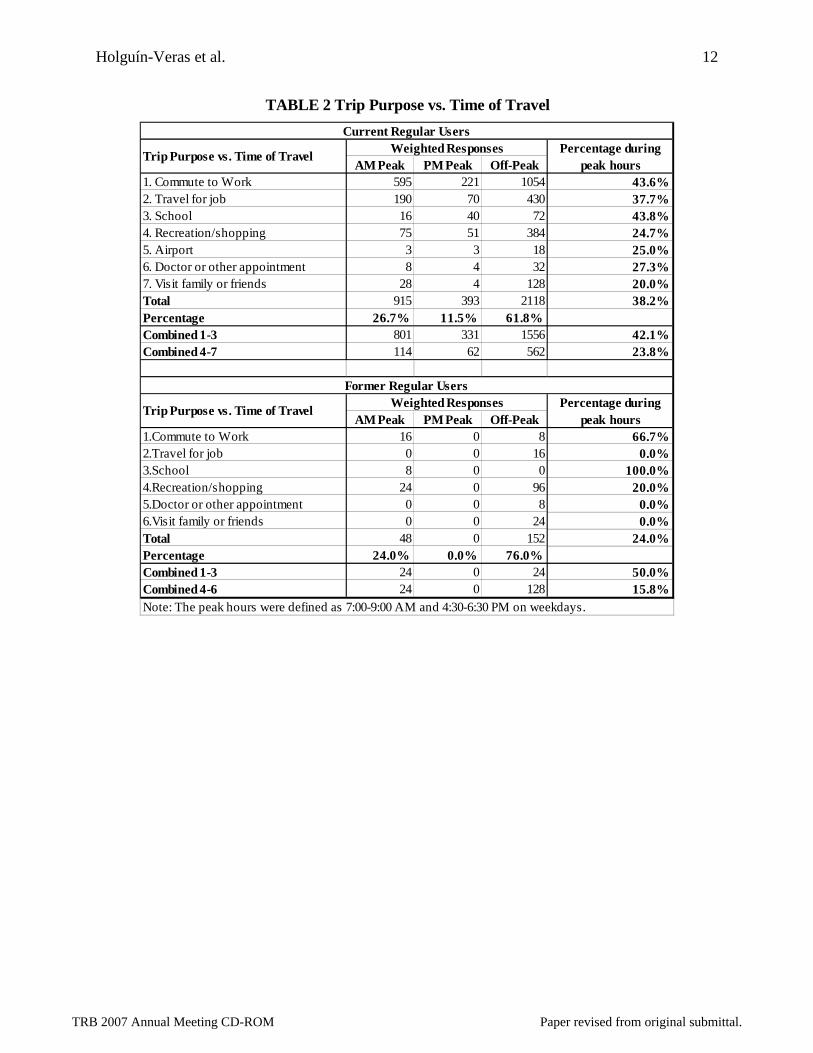
The differences between time of travel by trip purpose are significant for current users, 42.1% of work commute, job travel and school trips travel during peak hours, compared to only 23.8% of all other trip purposes. Also, weekday trips are more likely to be during peak hours than weekend trips (41.4% vs. 27.1% in Table 3). Similarly, for former users, a higher percentage of work commute, job travel and school trip were made during peak hours than all other trip purposes (50.0% vs.15.8% in Table 3). This difference is also marked between weekdays and weekends (30.8% vs. 20.0%) as shown in Table 3. The average door-to-door travel time for former users’ most recent transit trips was approximately 100 minutes, which is 15 minutes longer than the car trips for current users.
The survey collected data about the respondents’ flexibility to depart later/earlier and to arrive later/earlier and still meet travel constraints. The key finding is that current users do not have much flexibility to shift their time of travel (see Table 4). Work related trips (commuting to work or traveling as part of a job) are the least flexible group, followed by trips with other purposes (school, airport, doctor or other appointment, visit family or friends) and then recreation/shopping trips. Another pattern revealed by Table 4 is that the average flexibility of late departure/arrival is always smaller than that of early departure/arrival, which makes sense.The data show only around 10% of current users reported more than half hour flexibility, and approximately half of them already travel during off-peak. Therefore, only 5% of current users could switch time of travel without major inconveniences.
Former users’ work related trips are the least flexible category (see Table 4), followed by recreation/shopping trips. The average flexibility for other trips is relatively high. Another pattern consistent with the findings for current users, is that the flexibility of late
TRB 2007 Annual Meeting CD-ROM Paper revised from original submittal.

Holguín-Veras et al. 5
departure/arrival is always smaller than that of early departure/arrival. Similar as current users, only about 10% of former users reported more than half hour flexibility.
Regarding parking expenses, 88.8% of respondents did not pay for parking (either free, or someone else paid), while only 8.7% paid parking. About 1.1% respondents’ parking fees were shared by passengers, and the other 1.4% did not know or refused to provide an answer. The group that paid parking (either by themselves or shared) paid $10.14 on average for parking.
In terms of toll costs, current users indicated that they paid, in average, $1.84 in tolls at the turnpike during their last trip; and that 80.1% of current users paid less than $3.00. About two-thirds of them (64.9%) paid the tolls with E-ZPass. As an average, users estimated that using transit would have cost them $15.97 on average, which is larger than their toll expenses. The data show that 11.9% travel by car because transit is not available to them. About 68.7% of all trips were made alone while the remaining trips were made with at least one companion. The average number of persons in the car, including the driver, is 1.52.
The average travel cost for former users’ most recent trip was $5.60. The majority (61.1%) of former users paid $5.00 or less for their trips, about 27.8% said that they paid somewhere between $6.00 and $10.00, and 11.11% paid more than $10.00. The average cost is about $7.56, which is only about $2.00 more than the average cost of their transit trips.
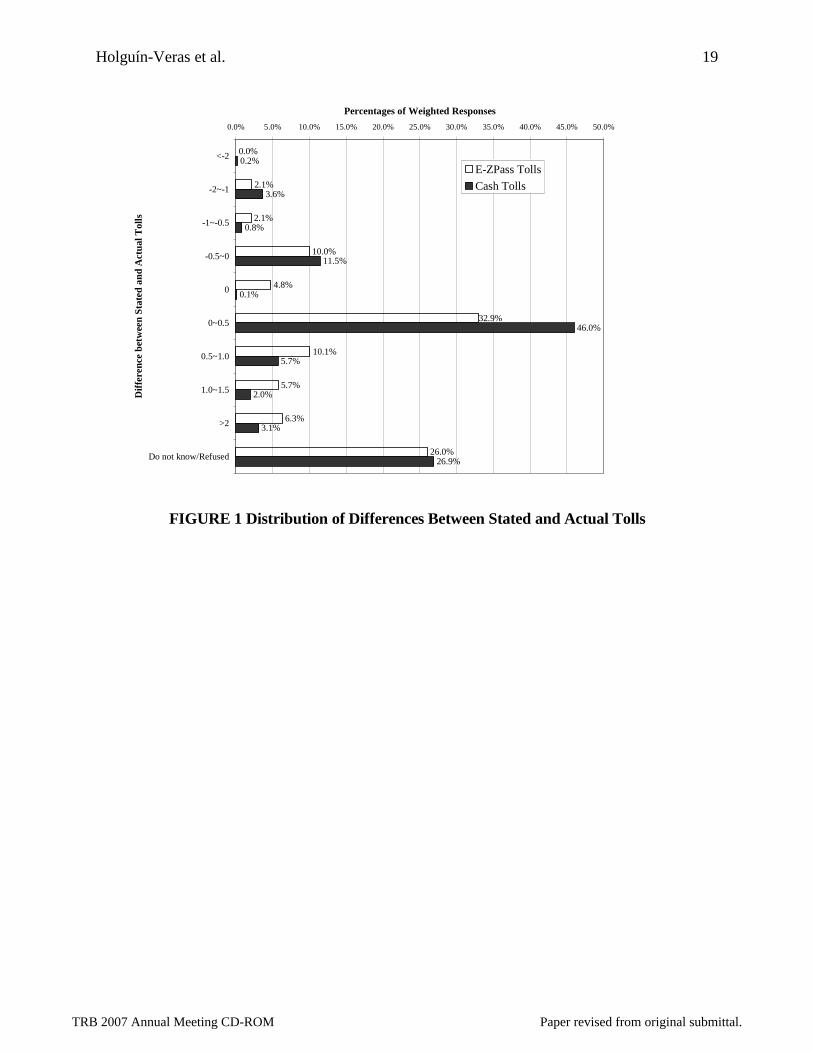
Figure 1 shows the distributions of the difference between the respondents’ stated tolls and the actual tolls. As shown, few respondents correctly remembered the tolls. The data showthat E-ZPass users have a higher error than cash users. The mean value of misreporting is $0.4 (overreporting) with a standard deviation of $0.3 for E-ZPass users; while the mean value for cash users is smaller, $0.1 (overreporting) with a standard deviation of $0.4.
3.3 E-ZPass Usage and Awareness of Toll Discount Programs
The majority of users (64.0%) said that they currently have an E-ZPass tag. Although most respondents (77.4%) said that they pay their own E-ZPass account, a small group said that their account was paid by a family member (10.9%) or their employer (10.5%).
The majority (61.0%) were not aware of any discounts on the turnpike, 11.1% of respondents heard of discounts but do not know specifics, another 11.1% of respondents knew about general discounts. Only 10.5% were aware of discounts associated with the time of travel. The large percentage of individuals that reported not knowing about the time of day discounts may indicate that their attention only focused on the toll increases, without thinking much about the toll discounts offered (for using E-ZPass or the off-peak hours).
3.4 Impacts of the September 2000 Time of Day Pricing Initiative
The analysis of the data found that 36 out of 513 respondents changed travel behavior because of time of day pricing (representing 7.0% of individuals and 6.6% of car trips). Among the 36 respondents who changed travel behavior because of time of day pricing, 35 still remain as regular users, accounting for 6.4% of car trips in the sub-sample. Only one respondent travels regularly by an alternate route (0.2% of car trips). The main reasons for not changing travel behavior include: have no choice, no flexibility (40.2%) and my choice, I go when I want to go (32.3%). Other respondents felt that the toll difference was not enough to justify a change(8.7%); some said that they did not use the facilities enough in order to change (8.6%) or it was paid by their employers (5.0%).
TRB 2007 Annual Meeting CD-ROM Paper revised from original submittal.

Holguín-Veras et al. 6
Interestingly, when asked a follow up question about why they chose to travel at the stated time, only 2 current users (0.4%) said that they did so to take advantage of cheaper tolls. Most current users did so due to work schedule (51.6%), to avoid congestion (22.0%), or had an appointment (16.1%). Some respondents mentioned they travel out of habit or what they usually do (3.3%), because they could return at a certain time (1.8%), or they could find easier/cheaper parking (0.4%). None of the former users said that they chose the time of travel to take advantage of cheaper tolls. Similarly, former users traveled at the stated time to avoid congestion(40.0%), had an appointment (24.0%) or due to their work schedule (16.0%). Some respondents mentioned they travel out of habit or what they usually do (8.0%), others mentioned they travel at the stated time so that they could return at a certain time (4.0%), or they could find easier/cheaper parking (4.0%).
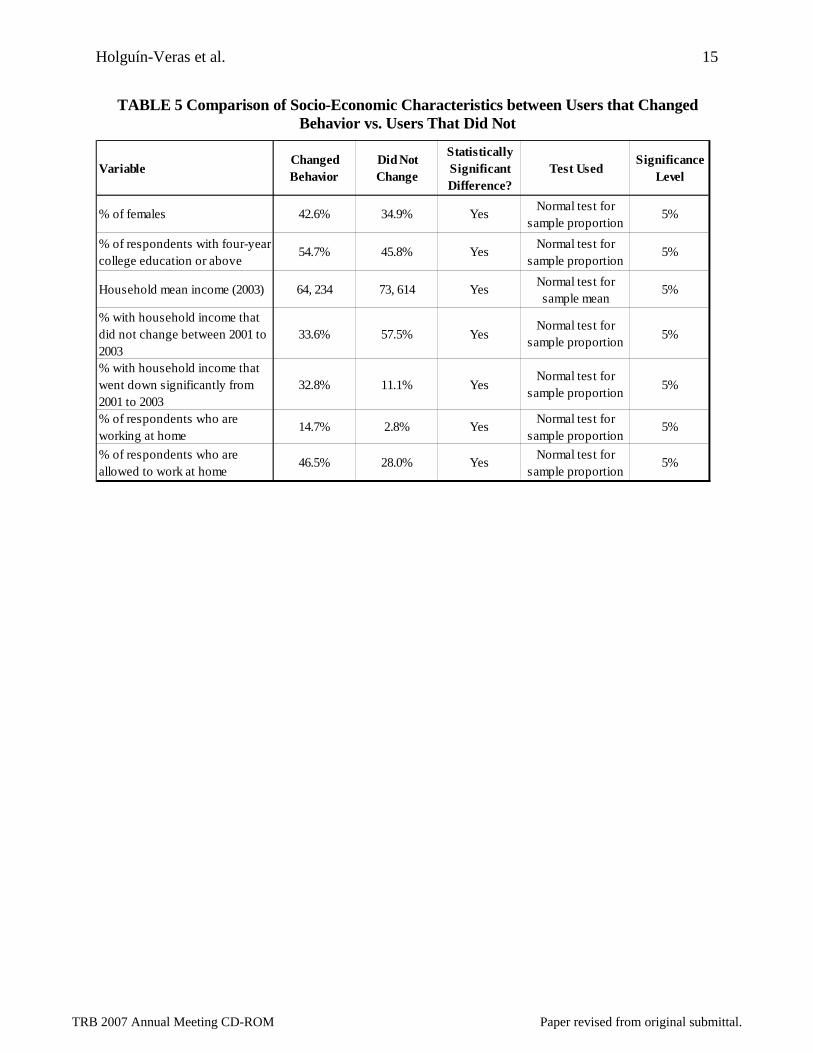
Although the sample size of users who changed behavior is small—which suggests caution when analyzing results—some interesting results were found. The individuals who changed their behavior are statistically different than those that did not in terms of socio-economic attributes such as gender, education level, household income, and work status. Table 5shows the results of the statistical tests conducted to assess the significance of the observed differences in the socio-economic characteristics. The results are based on 238 respondents who could recall the 2000 toll increase. Among these respondents, only 36 respondents changed their travel behavior because of time of day pricing, which accounts for 7.0% of individuals and 6.6% of car trips. The individuals that changed behavior tend to:
a) Be females, suggesting that women are more sensitive to price changes.b) Have a relative higher education level.c) Have relatively lower income.d) Annual household incomes are more likely to change significantly from 2001 to 2003
and more likely to drop.e) More likely to not work outside the home or be allowed to work at home.
Most respondents that reported behavioral changes because of pricing indicated multiple changes (see Table 6). As shown, the different behavioral changes were classified in four major groups: (1) Changes in facility usage; (2) Changes in time of travel; (3) Changes in the productivity of car travel; and (4) Changes in mode/occupancy. In terms of facility usage, the time of day pricing initiative seems to have produced a shift, though a minor one, from the turnpike to the local non-tolled routes. The second set of changes involve an across the board reduction of travel. The third set of changes is associated with measures aimed at increasing the productivity of travel by car, by means of longer trip chains, and starting to use E-ZPass. Mode changes comprises the smallest group. Table 7 summarizes the dimensions of travel behavior changes. The main reactions to time of day pricing include increased car trips along alternate routes, decreased the frequency of travel on Turnpike, decreased weekday peak trips and decreased number of trips driving totally alone (see Table 7). Table 7 makes a distinction between those who traveled less than 15 miles and those who traveled longer. Fifteen miles was chosen as the separation distance to group the respondents, since it creates two meaningful samples and thus allows statistical comparison. As shown in the table, users traveling less than 15 miles implemented more behavioral changes in three out the four behavioral strategy groups (i.e., changes in facility usage, trip productivity, and mode changes). Only in the group of time of day changes, those traveling more than 15 miles implemented more changes.
TRB 2007 Annual Meeting CD-ROM Paper revised from original submittal.

Holguín-Veras et al. 7
3.5 Elasticities vs. Travel Distance
A unique feature of this project is that it enables to study the demand elasticities with respect to toll changes. Although limited by sample size, these analyses provide some useful indications of the role played by the travel distance. Figure 2 shows the trip length distribution from the data. The estimates produced by the nonlinear model are shown in Equation (1). As shown, the number of trips at the turnpike consistently increases for the range of distances between 1 and 20 miles, after which it starts to decrease.
DisteDistTrips 2393.00316.3 *491.12 −+= (1)(2.054) (18.506) (-8.490)
Adjusted R2=0.52
Where: Trips represent the number of trips/month;Dist is the travel distance and the values of parentheses are the corresponding t-values.
The analysis of the travel distances of the users that changed behavior suggests the existence of two markedly different user segments, as shown in Table 8. The first segment is the group of users that travel less than 30 miles on the turnpike. As shown, this group exhibited a more elastic behavior than those who travel more than 30 miles, that did not change behavior. While the group elasticity for the users traveling less than 30 miles is -0.650, the elasticity for those that travel longer is 0.00. The market elasticity for all users is -0.545, if computed using the trips/month reported by participants; and -0.398 if one uses the number of individuals as the unit of demand. These estimates of elasticity are consistent with previous research in the subject. Burris and Pendyala estimated that price elasticities for pricing projects are usually in the –0.1 to -0.4 range (5). Another study suggests that the most likely range for off-peak elasticity of auto traffic is –0.2 to –1.1 (6).
Conceptually speaking, this behavior seems to make sense given the fact that it is easier to find a suitable substitute (either transit or another highway) for a short trip than for a long one. This is consistent with the results shown in Table 7, that respondents who traveled shorter distances implemented more behavioral changes than those that traveled longer. Another factor may be that, for short trips, tolls are likely to represent a proportionally larger share of the total cost; as opposed to long trips, where tolls may be of lesser importance.
Figure 3 shows the traffic assignment that results from assigning the trips made by users that changed behavior to the turnpike. As shown, the bulk of the changes took place in Northern New Jersey between the Garden State Parkway (exit 11) and the exit to Newark (exit 15W). This is an area in which there are suitable highway (e.g., Route 1/9), and transit alternatives (e.g., NJ Transit).
4. CONCLUSION
This paper has discussed the key findings from a research project aimed at assessing the behavioral changes produced by the time of day pricing initiative implemented at the New Jersey Turnpike in September, 2000. The analyses conducted are based on a sample of 513 complete passenger surveys collected by the authors.
Although the toll increases associated with the time of day pricing initiative were relatively small, they seem to have produced behavioral changes consistent with the previous
TRB 2007 Annual Meeting CD-ROM Paper revised from original submittal.
Holguín-Veras et al. 8
literature in the subject. The data show that 36 respondents changed their travel behavior because of time of day pricing, representing 7.0% of individuals and 6.6% of car trips. These numbers translate into market elasticities equal to -0.398 using the number of individuals as the unit of demand, and -0.545 using the number of trips per month.
The analysis of demand elasticity with respect to toll changes indicate that the more elastic user segment is the one with relatively short travel distances, i.e., less than 30 miles. Users traveling longer were found not to have changed their travel behaviors at all. Taking into account that thru trips were not included in the survey, only New Jersey residents, and that long distance thru trips may not have exhibited any behavioral changes, the authors would expect that the true market elasticities are smaller than the values found in the paper.
The analysis of the time of travel flexibility data collected indicates that the users do not have much flexibility to shift their time of travel, only around 5% had more than half hour flexibility and traveled during peak hours. This group of users could be the target of the time of day pricing initiative since they have the flexibility to shift to off-peak periods. The analyses also show that although the E-ZPass penetration rate is high (61.0%), the majority of them are not aware of the time of day discounts. This lack of awareness is bound to diminish the effectiveness of the time of day pricing initiative.
Respondents who changed behaviors tended to be female, have a relative highereducation level, have relatively lower income, annual household incomes are more likely to change significantly from 2001 to 2003 and more likely to drop, and that tend to either work at home, or are allowed to work at home. The analyses conducted indicate that these differences are statistically significant.
The research reported in this paper has highlighted the multidimensional nature of the behavioral responses to time of day pricing. As discussed in the paper, users reacted to the time of day pricing initiative by implementing combinations of responses drawn from four different groups: (1) Changes in facility usage; (2) Changes in time of travel; (3) Changes in the productivity of car travel; and (4) Changes in mode/occupancy.
It is the authors’ hope that the analyses in this paper have contributed to shed light into the complex and nuanced responses of users to time of day pricing, though there shall be no doubt that much research is needed. In this context, full understanding of the behavioral impacts of pricing remains a long term goal attainable, perhaps, by future generations of researchers.
5. ACKNOWLEDGEMENTS
This project was sponsored by a grant from the Federal Highway Administration’s Value Pricing Program. Additional support was provided by the New Jersey Department of Transportation. The opinions and conclusions presented are the sole responsibility of the authors and do not reflect the views of sponsors and other participating agencies.
6. REFERENCES
1. New Jersey Turnpike Authority, Annual Report, 1999, Available online, http://www.state.nj.us/turnpike/99arfull.pdf, Accessed 10/10/06.
2. New Jersey Turnpike Toll Rates Schedule for Passenger Cars, Available online, http://www.state.nj.us/turnpike/nj-vcenter-tollmap.htm. Accessed 3/03/05.
TRB 2007 Annual Meeting CD-ROM Paper revised from original submittal.
Holguín-Veras et al. 9
3. Ozbay, K., O. Yanmaz, and Holguín-Veras, J. 2005 “Analysis of the Observed Behavior of Users to Value Pricing and Travel Time: The New Jersey Turnpike Case” Forthcoming in Transportation Research Record.
4. Ozbay, K., Holguín-Veras, J., and A. De Cerreño, 2005. “Evaluation Study of New Jersey turnpike Authority’s Time of Day Pricing Initiative”, Final Report submitted to the Federal Highway Administration and the New Jersey Department of Transportation, Available online, http://www.cait.rutgers.edu/finalreports/FHWA-NJ-2005-012.pdf. Accessed 10/10/06.
5. Burris, M.W. and Pendyala, R.M. 2002. “Discrete choice models of traveler participation in differential time of day pricing programs.” Transport Policy, 9(3), 241-251.
6. Oum, T.H., Waters II, W.G., Yong, J.S. 1990. “A survey of recent estimates of price elasticities of demand for transport.” The World Bank, WPS # 359.
TRB 2007 Annual Meeting CD-ROM Paper revised from original submittal.

Holguín-Veras et al. 10
List of Tables
TABLE 1 Trip Purpose vs. Day of the Week
TABLE 2 Trip Purpose vs. Time of Travel
TABLE 3 Trip Day vs. Time of Travel
TABLE 4 Average Time of Travel Flexibility (minutes)
TABLE 5 Comparison of Socio-Economic Characteristics between Users that Changed Behavior vs. Users That Did Not
TABLE 6 Behavioral Changes Reported by Current and Former Users
TABLE 7 Dimensions of Behavioral Changes
TABLE 8 Elasticities as a Function of Travel Distance
List of Figures
FIGURE 1 Distribution of Differences Between Stated and Actual Tolls
FIGURE 2 Trip Length Distribution (trips/week)
FIGURE 3 Traffic Assignment of Users that Changed Behavior
TRB 2007 Annual Meeting CD-ROM Paper revised from original submittal.

Holguín-Veras et al. 11
TABLE 1 Trip Purpose vs. Day of the Week
Mon Tues Wed Thurs Fri Sat Sun Total
Commute to Work 187 221 306 255 663 119 17 1768 54.1%Travel for job 100 120 130 60 150 70 10 640 19.6%Recreation/shopping 27 45 45 63 96 156 78 510 15.6%Visit family or friends 8 20 16 12 28 56 28 168 5.1%School 8 16 24 16 40 16 0 120 3.7%Doctor or other appointment 4 0 4 16 4 8 8 44 1.3%Airport 0 3 0 9 0 9 0 21 0.6%Total 334 425 525 431 981 434 141 3271 100.0%Percentage 10.2% 13.0% 16.1% 13.2% 30.0% 13.3% 4.3% 100.0%
Mon Tues Wed Thurs Fri Sat Sun Total
Commute to Work 8 0 0 0 16 0 0 24 15.5%Travel for job 0 0 0 0 0 8 0 8 5.2%School 0 0 3 0 0 0 0 3 1.9%Recreation/shopping 0 4 0 4 32 32 16 88 56.8%Doctor or other appointment 0 0 0 0 0 8 0 8 5.2%Visit family or friends 0 0 0 0 8 8 8 24 15.5%Total 8 4 3 4 56 56 24 155 100.0%Percentage 5.2% 2.6% 1.9% 2.6% 36.1% 36.1% 15.5% 100.0%
Current Regular Users
Former Regular Users
Trip Purpose vs. Day of Travel
Weighted Responses Percentage of Weighted Responses
Weighted ResponsesTrip Purpose vs. Day of Travel
Percentage of Weighted Responses
TRB 2007 Annual Meeting CD-ROM Paper revised from original submittal.
Holguín-Veras et al. 12
TABLE 2 Trip Purpose vs. Time of Travel
AM Peak PM Peak Off-Peak1. Commute to Work 595 221 1054 43.6%2. Travel for job 190 70 430 37.7%3. School 16 40 72 43.8%4. Recreation/shopping 75 51 384 24.7%5. Airport 3 3 18 25.0%6. Doctor or other appointment 8 4 32 27.3%7. Visit family or friends 28 4 128 20.0%Total 915 393 2118 38.2%Percentage 26.7% 11.5% 61.8% 342600.0%Combined 1-3 801 331 1556 42.1%Combined 4-7 114 62 562 23.8%
AM Peak PM Peak Off-Peak1.Commute to Work 16 0 8 66.7%2.Travel for job 0 0 16 0.0%3.School 8 0 0 100.0%4.Recreation/shopping 24 0 96 20.0%5.Doctor or other appointment 0 0 8 0.0%6.Visit family or friends 0 0 24 0.0%Total 48 0 152 24.0%Percentage 24.0% 0.0% 76.0% 200Combined 1-3 24 0 24 50.0%Combined 4-6 24 0 128 15.8%Note: The peak hours were defined as 7:00-9:00 AM and 4:30-6:30 PM on weekdays.
Weighted Responses Percentage during peak hours
Trip Purpose vs. Time of Travel
Current Regular Users
Trip Purpose vs. Time of Travel Weighted Responses Percentage during
peak hours
Former Regular Users
TRB 2007 Annual Meeting CD-ROM Paper revised from original submittal.

Holguín-Veras et al. 13
TABLE 3 Trip Day vs. Time of Travel
AM Peak PM Peak Off-PeakWeekdays 834 292 1593 41.4%Weekends 105 101 555 27.1%Total 939 393 2148 38.3%Percentage 27.0% 11.3% 61.7% 3480
AM Peak PM Peak Off-PeakWeekdays 32 0 72 30.8%Weekends 16 0 64 20.0%Total 48 0 136 26.1%Percentage 26.1% 0.0% 73.9% 184
Note: The peak hours were defined as 7:00-9:00 AM and 4:30-6:30 PM on weekdays.
Weighted ResponsesDay of Week vs. Time of Travel
Percentage during peak hours
Current Regular Users
Former Regular Users
Day of Week vs. Time of Travel
Weighted Responses Percentage during peak hours
TRB 2007 Annual Meeting CD-ROM Paper revised from original submittal.

Holguín-Veras et al. 14
TABLE 4 Average Time of Travel Flexibility (minutes)
Current Former Current Former Current Former Current Former Late departure 15.3 9.0 21.0 12.8 19.2 11.7 16.6 11.6Early departure 16.3 11.3 21.5 20.7 19.5 52.7 17.5 24.1Late arrival 12.0 6.0 18.8 12.8 17.2 25.0 13.7 13.5Early arrival 14.2 11.3 21.6 13.6 18.8 64.0 15.9 19.0Note: “Current” and “Former” refer to current and former users, respectively.
Time of Travel Flexibility
Other AllTrip Purpose
Work related Recreation/shopping
TRB 2007 Annual Meeting CD-ROM Paper revised from original submittal.
Holguín-Veras et al. 15
TABLE 5 Comparison of Socio-Economic Characteristics between Users that Changed Behavior vs. Users That Did Not
VariableChanged Behavior
Did Not Change
Statistically Significant Difference?
Test UsedSignificance
Level
% of females 42.6% 34.9% YesNormal test for
sample proportion5%
% of respondents with four-year college education or above
54.7% 45.8% YesNormal test for
sample proportion5%
Household mean income (2003) 64, 234 73, 614 YesNormal test for sample mean
5%
% with household income that did not change between 2001 to 2003
33.6% 57.5% YesNormal test for
sample proportion5%
% with household income that went down significantly from 2001 to 2003
32.8% 11.1% YesNormal test for
sample proportion5%
% of respondents who are working at home
14.7% 2.8% YesNormal test for
sample proportion5%
% of respondents who are allowed to work at home
46.5% 28.0% YesNormal test for
sample proportion5%
TRB 2007 Annual Meeting CD-ROM Paper revised from original submittal.

Holguín-Veras et al. 16
TABLE 6 Behavioral Changes Reported by Current and Former Users
Use
r T
ype
Fre
quen
cy o
n tu
rnpi
ke
Tri
ps a
long
al
tern
ate
rout
esW
eekd
ay
peak
tri
ps
Wee
kday
off
-pe
ak t
rips
Wee
kend
tr
ips
Tri
ps d
rivi
ng
tota
lly a
lone
Num
ber
of
stop
s
Got
E-Z
pass
Usa
ge o
f ca
rpoo
l
Tra
nsit
use
Tri
ps/m
onth
CU I I S 15CU I D D 1CU D I I I I I 16CU D I 30CU D I D D D 30CU D I 5CU D I D 20CU D D 20CU D I D 22CU D I D D D 8CU D I I 2CU D I 4CU D I D 10CU D I D D I 10CU D I I D Y 3CU D I D D I D D I 1CU D I D 20CU D I D D D D I 2CU D D D I 5CU D I D D D S 3CU I 3CU 2CU I I I I I Y S I 6CU I D 1CU I 1CU Y 1CU I D 4CU 1CU D D D 2CU D 1CU D D 3CU I 7CU D D D 2CU D 2CU I 1FU D I I 1
I 16 218 27 27 7 22 21 0 1 21
D 212 28 73 35 51 75 11 0 2 13
S 0 0 0 0 0 0 0 0 24 0
Y 0 0 0 0 0 0 0 10 0 0Total 228 246 97 27 34 100 62 58 32 10
Notation: (1) CU: current regular user; (2) FU: former regular user; (3) I: Increased; (4) D: Decreased; (5) S: Started; (6) Y: Yes; (7) the figures refer to number of trips that changed behavior.
Mode
Dir
ecti
on o
f C
hang
es
Facility usage Time of day Productivity
TRB 2007 Annual Meeting CD-ROM Paper revised from original submittal.

Holguín-Veras et al. 17
TABLE 7 Dimensions of Behavioral Changes
% (2)
% (1)
% (3)
% (1)
% (4)
% (1)
Decreased 80.0% 11.1% 94.0% 3.3% 87.1% 6.7%Increased 6.0% 0.8% 0.0% 0.0% 0.0% 0.0%Decreased 10.6% 1.5% 0.0% 0.0% 15.0% 1.2%Increased 82.3% 11.4% 100.0% 3.5% 78.2% 6.0%
94.7% 13.1% 100.0% 3.5% 93.2% 7.2%Decreased 27.5% 3.8% 19.4% 0.7% 34.0% 2.6%Increased 10.2% 1.5% 23.9% 0.8% 0.7% 0.1%Decreased 13.2% 1.9% 4.5% 0.2% 21.8% 1.7%Increased 10.2% 1.5% 23.9% 0.8% 0.0% 0.0%Decreased 19.2% 2.7% 17.9% 0.6% 22.4% 1.7%Increased 2.6% 0.4% 1.5% 0.1% 0.0% 0.0%
50.6% 7.0% 43.3% 1.5% 57.1% 4.4%Decreased 28.3% 4.0% 43.3% 1.5% 25.9% 2.0%Increased 8.3% 1.1% 23.9% 0.8% 0.0% 0.0%Decreased 4.2% 0.6% 16.4% 0.6% 0.0% 0.0%Increased 7.9% 1.1% 23.9% 0.8% 0.0% 0.0%
Got E-ZPass Yes 3.8% 0.4% 0.0% 0.0% 0.7% 0.1%42.6% 5.9% 82.1% 2.9% 26.5% 2.0%
Decreased 0.8% 0.2% 0.0% 0.0% 1.4% 0.1%Increased 9.5% 1.3% 1.5% 0.1% 0.0% 0.0%Decreased 4.9% 0.6% 0.0% 0.0% 8.2% 0.6%Increased 7.9% 1.1% 20.9% 0.7% 0.7% 0.1%
20.8% 2.9% 22.4% 0.8% 10.2% 0.8%Note: (1) Percentages are based on 1913 trips of those who remembered the Sept 2000 toll increase. (2) Percentages are based on 265 trips of 36 respondents who changed behavior.(3) Percentages are based on 8 respondents (67 trips) who traveled less than 15 miles on the turnpike.(4) Percentages are based on 14 respondents (147 trips) who traveled more than 15 miles on the turnpike.(5) Respondents reported multiple changes; therefore the percentages do not add up to 100%.(6) These percentages are based on respondents who did any of the changes in this category.(7) Only 22 out of 36 respondents provided exit numbers traveled on the turnpike.
Fac
ilit
y us
age
Overall (6)
Overall (6)
Pro
duct
ivit
y T
ime
of d
ay
Overall (6)
Weekday peak trips
Weekday off-peak trips
Weekend trips
Trips along alternate routes
Mod
e
Trips driving totally alone
Number of stops
Usage of carpool
Transit use
Respondents traveling more than 15 miles
Frequency on turnpike
Direction of Change
Overall (6)
Beh
avio
ral
stra
tegy
gr
oup
Dimensions of Change
Respondents that changed behavior
Respondents traveling less than 15 miles
TRB 2007 Annual Meeting CD-ROM Paper revised from original submittal.

Holguín-Veras et al. 18
TABLE 8 Elasticities as a Function of Travel Distance
Distance (miles)
Trips that Changed
Total
Trips (1)
Toll
Change (2)
Previous
Toll (3) Elasticity
0~5 98 520 0.07 0.48 -1.276~10 33 216 0.15 0.77 -0.8011~15 42 231 0.22 1.12 -0.9016~20 25 240 0.27 1.36 -0.5421~25 94 262 0.27 1.40 -1.8426~30 38 165 0.31 1.54 -1.1431~35 0 34 0.29 1.52 0.0036~40 0 60 0.35 1.72 0.0041~45 0 32 0.41 2.03 0.0046~50 0 37 0.43 2.13 0.0051~55 0 0 0.43 2.10 n/a56~60 0 25 0.54 2.67 0.0061~65 0 6 0.51 2.53 0.0066~70 0 1 0.55 2.75 0.0071~75 0 0 0.56 2.77 n/a76~80 0 13 0.61 3.02 0.0081~85 0 22 0.65 3.21 0.0086~90 0 1 0.59 2.92 0.0091~95 0 0 0.71 3.49 n/a96~100 0 0 0.74 3.69 n/a101~105 0 2 0.83 4.12 0.00106~110 0 9 0.82 4.06 0.00111~115 0 37 0.88 4.38 0.00Total 330 1913Weighted average 0.22 1.2Market elasticitites (trips) -0.545Market elasticitites (individuals) -0.398
Note: (1) Number of trips for respondents who recalled the 2000 toll increase.(2) Average of cash toll changes after pricing.(3) Average of cash tolls before pricing.
TRB 2007 Annual Meeting CD-ROM Paper revised from original submittal.
Holguín-Veras et al. 19
0.0%
2.1%
2.1%
10.0%
4.8%
10.1%
5.7%
6.3%
26.0%
0.2%
3.6%
0.8%
11.5%
0.1%
46.0%
5.7%
2.0%
26.9%
32.9%
3.1%
0.0% 5.0% 10.0% 15.0% 20.0% 25.0% 30.0% 35.0% 40.0% 45.0% 50.0%
<-2
-2~-1
-1~-0.5
-0.5~0
0
0~0.5
0.5~1.0
1.0~1.5
>2
Do not know/Refused
Dif
fere
nce
betw
een
Stat
ed a
nd A
ctua
l Tol
ls
Percentages of Weighted Responses
E-ZPass Tolls
Cash Tolls
FIGURE 1 Distribution of Differences Between Stated and Actual Tolls
TRB 2007 Annual Meeting CD-ROM Paper revised from original submittal.

Holguín-Veras et al. 20
0
20
40
60
80
100
120
140
160
180
200
0 20 40 60 80 100 120
Distance (miles)
Tri
psTrips
Estimates
FIGURE 2 Trip Length Distribution (trips/week)
Note: (1) Distance was based on the exit numbers provided by respondents.(2) Trips refer to number of trips per month respondents traveled on the turnpike.
TRB 2007 Annual Meeting CD-ROM Paper revised from original submittal.

Holguín-Veras et al. 21
FIGURE 3 Traffic Assignment of Users that Changed Behavior
8(1)
16(2)
5(1)
83(5)
44(5)
5(1)
5(1)
36(4)
36(4)
30(3)
64(4)
30(3)
64(4)
46(4)
46(4)
60(6)
71(5)
10(2)
71(5)
31(3)
28(3)
9(2)
Garden State Parkway
14 Newark Airport
95(7)
40(2)
6(1)
30(3)
10(2)
8(1)
10
13A
15E
13
12
16W
15W16E/18E
17 Lincoln Tunnel
HollandTunnel
17
16E/18E15W
GWB
9
8
Bordentown-Trenton7
1411
14 — Exit number
6(1) — number of trips that changed behavior (number of individuals that changed behavior)
7A
8A
14W
14A 14B
14C
14B
14C
14A
TRB 2007 Annual Meeting CD-ROM Paper revised from original submittal.