the new industry paradigm: industry specialist private equity investors as drivers in the mining...
TRANSCRIPT

The New Industry Paradigm: Industry Specialist Private Equity Investors as Drivers in the Mining Sector
SME’s Third Annual Mining Finance ConferenceNew York City
Joel Schneyer – Managing DirectorApril 28, 2015

Difficult Investment Landscape for Miners
Source: Modified from NovaGold - Presentation at San Francisco Gold Conference, November 2013
South America1.Peru: Construction halted at largest mine due to gov’t review and social unrest.2.Ecuador: Political obstacles and windfall tax discourage foreign investment in mining.3.Venezuela: Five mining companies seeking compensation through World Bank’s arbitration court following nationalizations.4.Bolivia: Nationalization of various natural resources assets.5.Argentina: Miners required to repatriate revenues from foreign sales, limitations imposed on foreign exchange. Controls on imports of equipment/supplies have also been tightened
Africa•Ghana: Increase in tariffs on mines and introduced a windfall tax, halting project expansions.•Guinea: New law gives government a 35% stake; threat of nationalization.•Mali: Recent military coup creating political uncertainty•Kenya: Rising mineral royalties and drilling fees for mining.•Congo: Plans to revise mining code, raise taxes and increase stake in mining projects•Zimbabwe: Gov’t plans to seize control of foreign-owned mines.•South Africa: Ongoing dialogue to nationalize mining industry.
Russia, Asia & Australia13.Indonesia: Newly proposed legislation limits foreign ownership of mines to 49%.14.Philippines: New royalties and taxes being imposed on mining companies.15.Mongolia: Drafting investment law to restrict foreign ownership.16.Kyrgyzstan: Parliamentary motion calling for increased government stake in one of its largest mines
Heightened Geopolitical/Permitting Risk in North America
2
BC: Mt Polly tailings dam spill
Quebec: Innu First Nations launch $900M lawsuit against Rio Tinto
BC: First Nations Supreme Court Ruling
MEX: Torex kidnappings
Aust: BHP & Rio Tinto iron ore tax avoidance investigation
Greece: Revokes Skouries mine development license
Zambia: Planned royalty hike to 9%

Access To Public Capital Decreasing – Exploration Decreasing
3
Source:
Toronto Stock Exchange and TSX Venture Exchange Total Financing (C$ Billions)
Source:
Global Exploration Budget Trends ($ Millions)

Disconnect Between Gold Miner ETFs and Broader Market
4
Source: Yahoo Finance

Why Buy An Illiquid Share When You Can Buy An ETF?
5
Source: Yahoo Finance

Source: Headwaters Research
Industry Experiencing Mining Cost Inflation – N American Example
6

$/oz
$535/oz
Margins Under Pressure
7
Source: Metals Focus

8
Development Stage Gold Companies trade at an Enterprise Value of $12 per ounce of M, I, & I (NI 43-101) with average estimated project development costs of $91 per ounce
*EV = (share price x # shares) – current assets + total liabilities**4/18/2015 share prices Au=$1203.35/oz, Ag=$16.23/oz
The Development Stage Business Model Looks To Be Unsustainable

9
Once the Project enters the Development Investment Analysis Phase (PEA – Prefeasibility – Feasibility), companies see a long period of share price erosion as studies, permitting and de-risking drag on
Life Cycle of a Gold Mining Share

10
Actual Trading Market Multiples
Small Gold Producers $51/oz Resource
Intermediate Gold Producers $64/oz Resource
Large Gold Producers $117/oz Resource
So What Is the Problem?
Development Stage Gold Companies Trade on Average at $12/oz Resource
Costs to Complete Drilling, Feasibility & Permitting ~$10/oz Resource
Capital Development Costs $91/oz Resource
Owners Costs Not in Feasibility (25%) $23/oz Resource
Total $136/oz Resource

11
The Institutional Money has lost confidence that…
costs can be controlled
capital discipline will occur
restructurings can deliver on promises
returns on capital employed will improve
the industry won’t pile back into too many new projects or expensive deals
when prices rebound
resource nationalism will not overwhelm the industry
commodity prices will not collapse
“stuckholders” have an exit
… and the markets reflect this loss of confidence
Institutional Money Is Not Buying Any More Lottery Tickets

PE Investment Criteria
Project in the lowest quartile of cost curve
Favorable technical review Board representation or control Permitting timeline Aligned financial interests Singular execution focus Exit strategy
12
Company
Project
Retail
Sovereign Wealth
Inst
itut
iona
l Mon
ey
Private Equity
Streaming & Royalty
Strategics
Merchant Traders
Mutual Funds
Major Shift In How Institutional Money Invests In Sector

1. Commodity
2. Location
5. Technical & Legal Review
7. Execution and/or Completion Risk
Private Equity – Key Considerations
13
8. Size of Investment
4. Control & Board Representation
3. Quality & Focus of Management Team
6. Project Competitiveness
9. Hold Period & Exit
+ 20% Annualized Returns6 to 10 year timeframe

SNL Mine Economics Cost Curve
14
Source:
Iron Ore Cost Curve25% - $35/dmt50% - $39/dmt
Copper Cost Curve25% - $1.25/lb50% - $1.60/lb

Permitting Times Are Increasing – The Donlin Gold Example
Source: NovaGold 2nd Q & Project Update Presentation, July 2014
15
1.5 Moz/yearFirst five full years 1
1.1 Moz/yearlife of mine 1
WE ARE HERE

Number of Mining Companies by Stage of Project Development - 2013
16
Adapted from:
Increasing Private EquityInterest and activity
Prefeasibility Feasibility ProductionResource PEA
Exploration1149
Production188
AdvancedExploration866
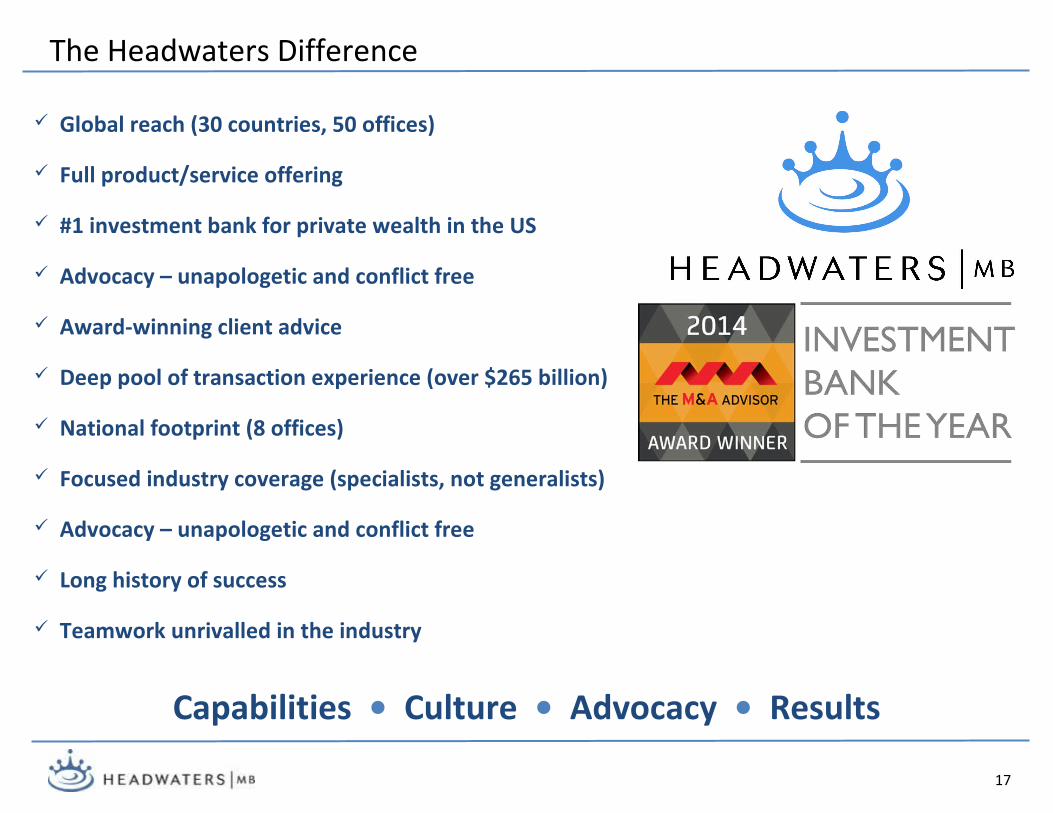
The Headwaters Difference
17
Global reach (30 countries, 50 offices)
Full product/service offering
#1 investment bank for private wealth in the US
Advocacy – unapologetic and conflict free
Award-winning client advice
Deep pool of transaction experience (over $265 billion)
National footprint (8 offices)
Focused industry coverage (specialists, not generalists)
Advocacy – unapologetic and conflict free
Long history of success
Teamwork unrivalled in the industry
Capabilities • Culture • Advocacy • Results