the new entertainment paradigm for the urban poor
TRANSCRIPT

THE NEW ENTERTAINMENT PARADIGM FOR THE URBAN POOR
ANINDITA MUKHERJEE POOJA GUPTA AASTHA JAIN DEEPTI RAJ
Connect
3
ACKNOWLEDGEMENT
This report has been prepared under the research programme Scaling City Institutions for India: Water and Sanitation, funded by the Bill and Melinda Gates Foundation (BMGF). The authors are grateful for the varied contributions by fellow CPR researchers towards the study. In particular, the authors thank Anju Dwivedi for her constructive feedback on the survey design and questionnaire; Tripti Singh for reviewing an early section of the report; and Arushi Gupta and Bhanu for their research support for the report.
A highly dedicated team of field investigators and researchers at Impetus Research Private Limited conducted the data collection in the six cities. All the findings and conclusions remain the sole responsibility of the authors. This report was edited by Rimli Borooah and designed by Sristi Bhatt.
SUGGESTED CITATION: Mukherjee, A., Gupta, P., Jain, A., & Raj, D. 2020. Connect. The New Entertainment Paradigm for the Urban Poor. New Delhi. Centre for Policy Research. DOI. 10.13140/RG.2.2.32104.80648
THE NEW ENTERTAINMENT PARADIGM FOR THE URBAN POOR
Conn
ect

CENTRE FOR POLICY RESEARCH (CPR), INDIA 4
Approach and Methodology
Table of Contents
Sample Profile
Trends in OTT Usage: Insights from the Primary Survey
List of Figures 5List of Tables 6List of Exhibits 6Glossary 7Acronyms 7Abstract 8
Setting the Context
Conclusion
49
References 51Annexure: Top 20 cities in terms of internet users (IMRB Kantar I-Cube 2014) 52
24
17
13
08

CENTRE FOR POLICY RESEARCH (CPR), INDIA 5
Tabl
e of
Con
tent
sLIST OF FIGURES
FIGURE 1: Literacy of the slum population in India, 2001 and 2011 10FIGURE 2: Work Participation Rate of the slum population in India, 2001 and 2011 10FIGURE 3: Mobile and fixed line telephone subscriptions, india, 1960 to 2017 11FIGURE 4: Mobile phone subscriptions vs. Gdp per capita, 2017 12FIGURE 5: Smartphone penetration among respondents 18FIGURE 6: Gender of respondents 18FIGURE 7: Age of the respondents 18FIGURE 8: Gender and age of smartphone owners 18FIGURE 9: Gender and age of the non-owners of smartphone 18FIGURE 10: Condition of dwelling of the respondents 19FIGURE 11: Asset ownership 19FIGURE 12: Occupation of the respondents 20FIGURE 13: Educational qualification of the respondents 20FIGURE 14: Source of entertainment of households with no mobile phone 22FIGURE 15: Percentage of households having radio/transistor in india, 2001-2011 23FIGURE 16: Percentage of households having television in india, 2001-2011 23FIGURE 17: Source of entertainment of households with no mobile phone 24FIGURE 18: Age of smartphone owner/user 25FIGURE 19: Interaction between age and gender of smartphone owner/user 25FIGURE 20: House type of smartphone owners 25FIGURE 21: Handset model 26FIGURE 22: Handset purchase price across various cities 26FIGURE 23: Handset purchase price across Occupational categories 27FIGURE 24: Popular network providers 27FIGURE 25: Monthly recharge amounts (inr) 28FIGURE 26: Time spent on smartphone for entertainment 29FIGURE 27: Platform preference 30FIGURE 28: Most preferred platforms across gender 31FIGURE 29: Most preferred platforms across occupational categories 31FIGURE 30: Most preferred platforms across cities 32FIGURE 31: Most preferred platforms across Educational categories 32FIGURE 32: Most viewed content across cities 34FIGURE 33: Content preference across gender 34FIGURE 34: Content preference across Age categories 34FIGURE 35: Content preference across Occupational Categories 35FIGURE 36: Content preference across Educational categories 35FIGURE 37: Movie viewership across cities 35FIGURE 38: Preference for platforms for various types of content 37FIGURE 39: Time spent on various OTT platforms 37FIGURE 40: Time spent on various OTT platforms across Gender 37FIGURE 41: Time spent on various OTT platforms across educational categories 38FIGURE 42: Preferred time for using OTT 38FIGURE 43: Preferred time for using OTT across cities 39FIGURE 44: Preferred time for using OTT across gender 39FIGURE 45: Preferred time for using OTT across occupational categories 39FIGURE 46: Preference for the regional language in the use of OTT 40FIGURE 47: Preference for English in the use of OTT 41FIGURE 48: Preference for Hindi in the use of OTT 41

CENTRE FOR POLICY RESEARCH (CPR), INDIA 6
FIGURE 49: Language preference in the use of OTT across Educational Categories 42FIGURE 50: City-wise consumption of cleanliness-related content 43FIGURE 51: City-wise types of SBM content consumed 47FIGURE 52: Various mediums used to view SBM related content 47FIGURE 53: City-wise preferred mediums to consume SBM-related content 48FIGURE 54: Age-wise preferred mediums to coonsume SBM-related content 48
LIST OF TABLES
TABLE 1: Comparative analysis of monthly per capita expenditure for slum and the non-slum urban centres 11
TABLE 2: Average recharge amounts across cities 28TABLE 3: Handset median price, smartphone recharge amount and recharge
frequency across Education levels 28TABLE 4: Handset median price, smartphone recharge amount and recharge
frequency across Occupational categories 29TABLE 5: Multivariable logistic regression analysis for YouTube preference 32TABLE 6: Multivariable logistic regression analysis for movies and news viewership 36TABLE 7: Language preference to consume media across cities 40
LIST OF EXHIBITS
EXHIBIT 1: Selection criteria 14EXHIBIT 2: Survey methodology 15EXHIBIT 3: Respondent level: Purposive sampling 16EXHIBIT 4: Type of content being consumed 33EXHIBIT 5: Factors driving OTT market growth 43EXHIBIT 6: Data consumption exponentially increasing post the launch of Jio 44EXHIBIT 7: Type of SBM content consumed 46EXHIBIT 8: Gender-wise preferred mediums to consume SBM-related content 48
Tabl
e of
Con
tent
s

CENTRE FOR POLICY RESEARCH (CPR), INDIA 7
GLOSSARY
Behavioural Sciences They deal with the subject of human actions, and usually include the fields of sociology, social and cultural anthropology, psychology, and behavioural aspects of biology, economics, geography, law, psychiatry and political science.
Urbanisation It is the increase in the proportion of people living in towns and cities. It occurs because people move from rural areas to urban areas.
Literacy rate It is the total number of literate persons in a given age group, expressed as a percentage of the total population in that age group.
Work Participation Rate It is defined as the percentage of total workers to the total population.
Gig Economy It is a free market system in which temporary positions are common and organisations hire independent workers for short-term commitments.
OTT Platform It is a streaming media service offered directly to viewers via the internet. OTT bypasses cable, broadcast and satellite television platforms, the companies that traditionally act as a controller or distributor of such content.
Digital Literacy It refers to an individual’s ability to find, evaluate and compose clear information through writing and other media on various digital platforms.
ACRONYMS
BBBP Beti Bachao, Beti PadhaoBCC Behavioural Change CommunicationC&S Cable & SatelliteCPR Centre for Policy ResearchDTH Direct-to-homeG7 Group of SevenHH HouseholdIEC Information, Education and CommunicationINR Indian National RupeesIP Internet PenetrationIPC Interpersonal CommunicationIT Internet TechnologyMoHUA Ministry of Housing and Urban DevelopmentNSS National Sample SurveyODF Open Defecation FreeOTT Over-the-topSBM Swachh Bharat MissionTVC Television CommercialWPR Work Participation Rate

CENTRE FOR POLICY RESEARCH (CPR), INDIA 8
ABSTRACTWith more and more people becoming upwardly mobile, coupled with increasing connectivity, there has been a spurt in online content consumption. The availability of a wide variety of content has attracted a large number of people, across demographics, with varying tastes and sensibilities. Easy access to low-cost smartphones and af fordable internet plans has accelerated the penetration of digital media, especially among the economically weaker sections of society.
This study involves a household survey in the slums of six big cities of India to throw light on the choices and behaviour of the urban poor population with respect to the digital space. The findings not only detail their choice of handset and recharge pattern, the preferred online platforms, the kind of content being consumed, the number of hours spent on dif ferent platforms, the preferred language of content, etc., but also how these choices vary across various socioeconomic and geographical categories. Learnings from the successful dissemination of the Swachh Bharat Mission (SBM) campaigns are explored by comparing the performance of various traditional media with that of new and upcoming Over-the-Top (OTT) media.
The study points to the necessity of building information systems to generate and use data to glean intelligent insights about urban poor communities as well as the services required for ef fective resource allocation and decision-making for universal improvement. It also talks about the probable COVID-19 influence on the OTT consumption pattern of the urban poor, OTT’s ef fectiveness as a medium to reach the last mile, and OTT platforms as an opportunity to be leveraged in times of a ‘nationally notified’ disaster.
The report concludes that OTT is an emerging media among the urban poor population across cities and has the potential to be used as an ef fective tool for reaching the underserved, especially to implement strategies related to Behaviour Change Communication (BCC).

CENTRE FOR POLICY RESEARCH (CPR), INDIA 9
India is potentially at an inflexion point for OTT growth. It is estimated that this nation would have 966 million total mobile users by 2023, up from 763 million or 56 percent of the population in 2018 (Cisco, 2020). The number of smartphone users in India is estimated to reach over 820 million in 2022 (ICEA-KPMG, 2020).The smartphone provides flexibility in the consumption of content on the web or a mobile app, freeing the dependence on television for content (Samtani & Jindal, 2018). The internet has been and continues to be a disruptive force impacting distribution and consumption channels for media (Deloitte, 2015).
Setting the Context
THE NEW ENTERTAINMENT PARADIGM FOR THE URBAN POOR
Imag
e So
urce
: the
guar
dian
.com

CENTRE FOR POLICY RESEARCH (CPR), INDIA 10
BOX 1: MOHUP, 2013
In India, the appetite for online video and media content continues to accelerate, with promising players entering this market space with offers of a plethora of original content and innovative technology tailored for specific audiences (Samtani & Jindal, 2018). Further, the higher usage of smartphones and affordable internet (especially with the entry of Jio) has contributed to a considerable amount of OTT services being delivered over smart and mobile devices (Jose, 2020). This has shaped OTT as a key driver in the establishment of a high-powered dynamic market in the entertainment space, expected to reach 5 billion dollars by 2023 (Samtani & Jindal, 2018).
Behavioural sciences, popular mainly for understanding consumer choices, are being increasingly recognised by policymakers as potential tools for policy and programme design, resulting in more effective, realistic and efficient development (Kuriakose, 2016). As per the Economic Survey 2018-19, many Indian schemes that employ
insights from behavioural economics have met with success. The Swachh Bharat Mission (SBM) and the Beti Bachao, Beti Padhao (BBBP) scheme are cases in point. These schemes have extensively used OTT platforms to bring about crucial behavioural changes. The rising popularity of these platforms among the poor sections of the urban areas makes them a powerful medium for BCC.
A large share of the urban poor workforce, which comprises domestic help, street vendors and hawkers, construction workers, ragpickers, rickshaw pullers, etc., remain dependent on informal occupation as well as informal living spaces in makeshift settlements, slums and resettlement colonies; this is despite the fact that they contribute significantly to the overall city economy (PRIA, 2013). While cities are the generators of the nation’s wealth and income, there are large sections of the poor in cities, especially slum dwellers, who are bypassed in this process of growth.
SETTING THE CONTEXT THE NEW ENTERTAINMENT PARADIGM FOR THE URBAN POOR
A striking feature of the trends in urbanization in India, as elsewhere in the developing world, is the shift in the focus of poverty to cities and towns. The NSSO 61st round data reavels that about 81 million people lived below the poverty line in 2004-2005. As per the data while the number of poor in rural reas declined by about 231 lakhs between 1993-94 and 2004-05, that in the urban areas registered an increase of about 44 lakhs. As per the Press Note released by Planning Commission, March, 2012 on Poverty Estimates, 2009-10 the number of urban poor is 76 million. A larg part of the increase in urban population occurred in slums due to natural growth factor and inability of migrants to find space in cities othar than slums. As per census 2011, the slum households in the country are 13.7 million.
Imag
e So
urce
: pol
icyf
orum
.net
CENTRE FOR POLICY RESEARCH (CPR), INDIA 11
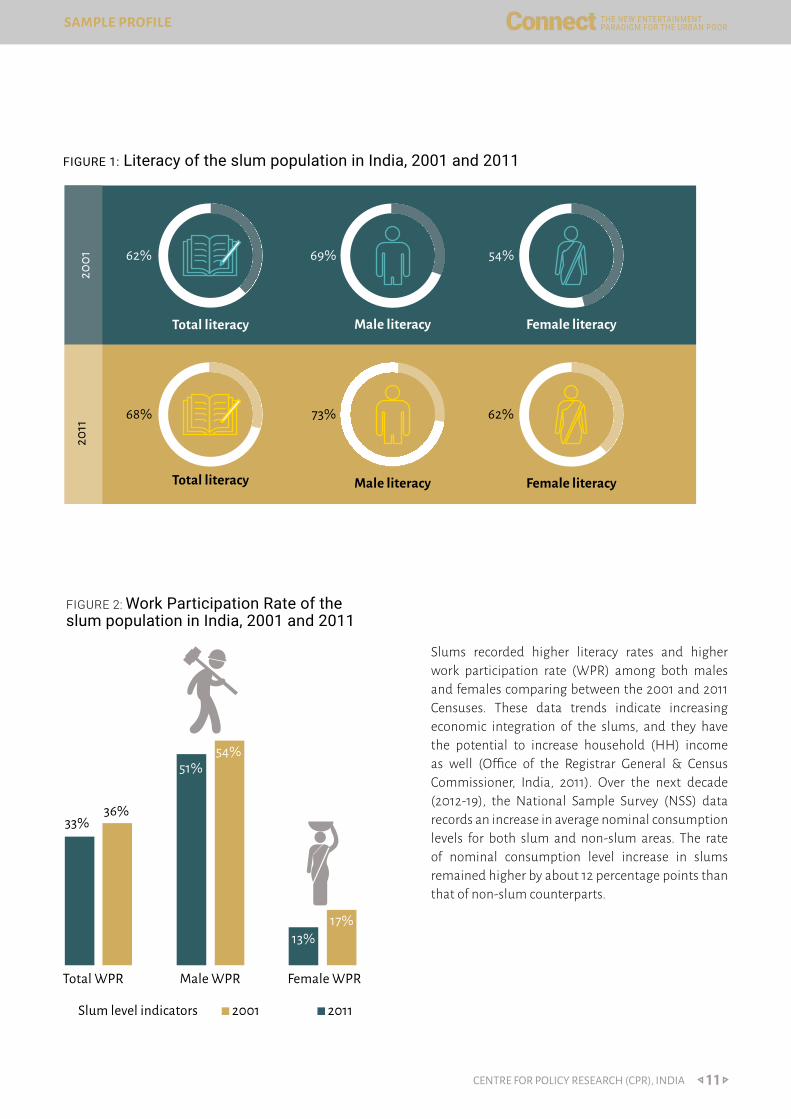
FIGURE 1: Literacy of the slum population in India, 2001 and 2011
Total literacy
Total literacy
2001
2011
62%
68%
Male literacy
69%
Male literacy
73%
Female literacy
54%
Female literacy
62%
Slum level indicators 2001 2011
33%36%
51%54%
13%17%
Total WPR Male WPR Female WPR
Slums recorded higher literacy rates and higher work participation rate (WPR) among both males and females comparing between the 2001 and 2011 Censuses. These data trends indicate increasing economic integration of the slums, and they have the potential to increase household (HH) income as well (Office of the Registrar General & Census Commissioner, India, 2011). Over the next decade (2012-19), the National Sample Survey (NSS) data records an increase in average nominal consumption levels for both slum and non-slum areas. The rate of nominal consumption level increase in slums remained higher by about 12 percentage points than that of non-slum counterparts.
SAMPLE PROFILE THE NEW ENTERTAINMENT PARADIGM FOR THE URBAN POOR
FIGURE 2: Work Participation Rate of the slum population in India, 2001 and 2011

CENTRE FOR POLICY RESEARCH (CPR), INDIA 12
Settlement type
Median of monthly per capita expenditure (INR) Percentage change overtimeNSS 69th round (2012) NSS 76th round (2019)
Non-slum 2175 3572 64%
Slum 1570 2767 76%
TABLE 1: Comparative analysis of monthly per capita expenditure for slum and the non-slum urban centres
Higher economic integration and upward income mobility among the urban poor act as catalysts for the adoption of digital communication. It is not only one can afford the smartphone now, but also it is becoming essential in maintaining the increasing economic and social network (GSMA & Dalberg, 2017).
The increase in smartphone ownership has been fundamental in enabling many people’s first internet experiences, and has offered them a gateway to enter the digital economy and benefit from life-enhancing opportunities. We have seen rapid mobile internet adoption, particularly in emerging markets, where an internet-enabled handset can signify the only form of internet access, and the number of mobile internet connections is approximately three times higher than that of fixed-line internet (ITU. ‘Global ICT Statistics’, 2014).
``
In some instances, Information Technology (IT) systems have spurred casualisation that facilitates expanding or decreasing the size of the workforce with ease and speed. The ‘gig economy’ (also called the ‘on-demand economy’) is a term that has gained widespread use in the media to designate work that is mediated through online web platforms (ILO, 2016). Companies such as Uber, Airbnb, Lyft, Etsy or TaskRabbit act as the medium through which the worker is connected to – and ultimately paid by – the consumer. These companies make it easier for workers to find a quick, temporary job (Istrate & Harris, 2017). Accelerating digitisation rates through rapid smartphone adoption and increasing internet access in hitherto underserved regions are expanding the number of eligible gig freelancers (Mastercard & Kaiser Associates, 2019).
FIGURE 3: Mobile and fixed-line telephone subscriptions, India, 1960 to 2017The Number of fixed landline telephone and mobile cellular phones subscriptions, measured per 100 people.
SAMPLE PROFILE THE NEW ENTERTAINMENT PARADIGM FOR THE URBAN POOR

CENTRE FOR POLICY RESEARCH (CPR), INDIA 13
FIGURE 4:Mobile phone subscriptions vs. GDP per capita, 2017Number of mobile phone subscriptions, measured per 100 people versus gross domestic prodct (GDP) per capita, Measured in 2011 international-$.
Studies have attempted to map the digital penetration and viewership trends at both national and sub-national levels in the past. However, the effort to study the uptake of digital tools among the urban poor in the country has been limited. The scarcity of information acts as an impediment to the industry to understand the preferences of this consumer base and to the policymakers to effectively use the digital space to further development reforms. Therefore, detailed data for this marginalised segment becomes critical to advance an inclusive and technology-driven development agenda.
Against this backdrop, the Centre for Policy Research (CPR) undertook the present study to provide an overview of the urban poor as the new OTT consumers, and to explore the significance of their growing online presence.
The study aims to understand the enabling factors which drive OTT growth among urban poor sections, and sheds light on variations across socioeconomic categories in select million-plus cities of India. The study also seeks to highlight the OTT consumption pattern and behaviour, and OTT content choices and preferences among various categories of urban poor population.
With the challenges of electricity availability, TV screens and Cable & Satellite (C&S) connections, it is possible the urban poor in India will adopt OTT even ahead of C&S in some pockets. Considering prices and penetration, it creates a very healthy environment for OTT to take off in the urban poor technology space (Samtani & Jindal, 2018).
SAMPLE PROFILE THE NEW ENTERTAINMENT PARADIGM FOR THE URBAN POOR
Structure of the Report
The report is organised into six sections. The first section sets the context of the study. The second section describes the approach and methodology adopted to undertake the primary research. It consists of the research questions and sampling techniques that have been applied. The third section gives the profile of the respondents. The fourth section presents a detailed analysis of the study findings. It seeks to understand the variations in preferences (platform, content, time and language) across various parameters such as city, age, gender and occupational categories. Particular emphasis is laid on the content preferences and smartphone ownership of women members in familial structures in poor urban spaces. The fifth section studies the successful dissemination of Swachh Bharat Mission (SBM) campaigns by comparing the performance of various traditional media with that of new and upcoming OTT media. The final section presents a conclusion elaborating lessons learnt from the analysis of primary and secondary data. It also discusses the possible impacts of the ongoing COVID-19 crisis on the OTT consumption pattern.

CENTRE FOR POLICY RESEARCH (CPR), INDIA 14
The present study undertook a sample survey of 1265 HHs in six Indian cities to investigate the OTT consumption patterns among the slum dwellers. The aim was to understand the choices regarding content, OTT platforms, preferred times, languages, etc., besides gaining insights into the success of the SBM digital campaign.
Approach and Methodology
THE NEW ENTERTAINMENT PARADIGM FOR THE URBAN POOR
Imag
e So
urce
: the
wire
.in
CENTRE FOR POLICY RESEARCH (CPR), INDIA 15
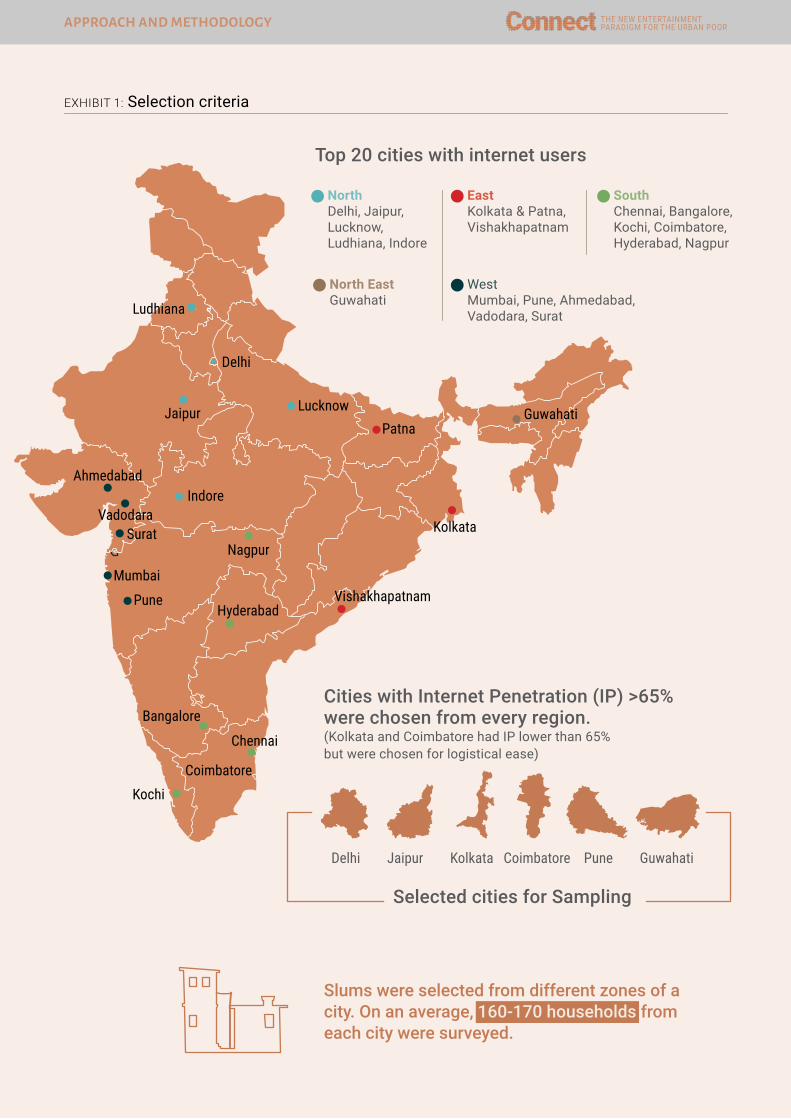
EXHIBIT 1: Selection criteria
Cities with Internet Penetration (IP) >65% were chosen from every region. (Kolkata and Coimbatore had IP lower than 65% but were chosen for logistical ease)
Top 20 cities with internet users
Delhi Jaipur Kolkata Coimbatore Pune Guwahati
Jaipur
Indore
LucknowPatna
Delhi
Chennai
Bangalore
Coimbatore
Hyderabad
Nagpur
Kochi
Guwahati
Vishakhapatnam
Ludhiana
Kolkata
Slums were selected from different zones of a city. On an average, 160-170 households from each city were surveyed.
APPROACH AND METHODOLOGY THE NEW ENTERTAINMENT PARADIGM FOR THE URBAN POOR
NorthDelhi, Jaipur, Lucknow, Ludhiana, Indore
EastKolkata & Patna, Vishakhapatnam
SouthChennai, Bangalore, Kochi, Coimbatore, Hyderabad, Nagpur
North EastGuwahati
WestMumbai, Pune, Ahmedabad, Vadodara, Surat
Selected cities for Sampling
Mumbai
Pune
Ahmedabad
VadodaraSurat
CENTRE FOR POLICY RESEARCH (CPR), INDIA 16
For city selection, the top 20 cities across India with the highest number of internet users were selected (IAMAI & IMRB I-Cube Report, 2014). Of these, cities with a share of Internet Penetration (IP) greater than 65 per cent were analysed, and the final six large cities (Delhi, Jaipur, Kolkata, Coimbatore, Guwahati and Pune) were selected such that there was at least one city in each zone: East, West, North, South and North East. Kolkata and Coimbatore had IP lower than 65% (44% and 62%, respectively) but were chosen for logistical ease .
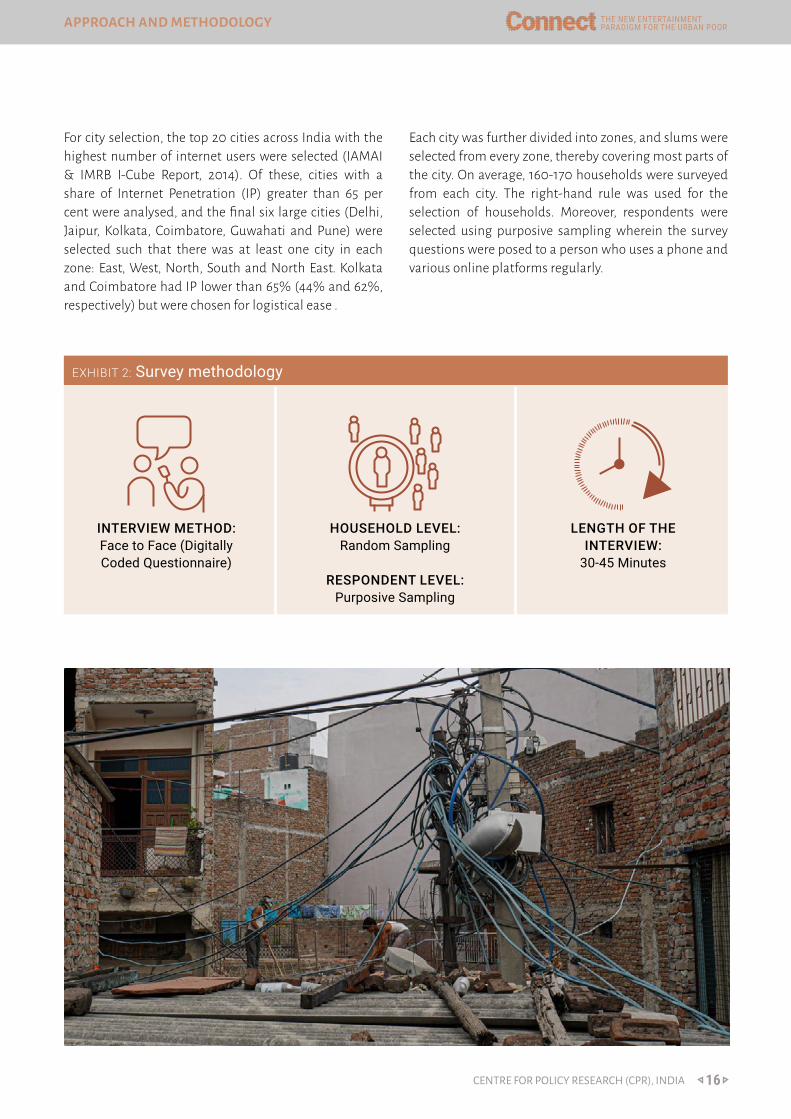
EXHIBIT 2: Survey methodology
INTERVIEW METHOD: Face to Face (Digitally Coded Questionnaire)
HOUSEHOLD LEVEL: Random Sampling
RESPONDENT LEVEL: Purposive Sampling
LENGTH OF THE INTERVIEW:
30-45 Minutes
Each city was further divided into zones, and slums were selected from every zone, thereby covering most parts of the city. On average, 160-170 households were surveyed from each city. The right-hand rule was used for the selection of households. Moreover, respondents were selected using purposive sampling wherein the survey questions were posed to a person who uses a phone and various online platforms regularly.
APPROACH AND METHODOLOGY THE NEW ENTERTAINMENT PARADIGM FOR THE URBAN POOR

CENTRE FOR POLICY RESEARCH (CPR), INDIA 17
UNIQUENESS
For the first time, this study captures the urban poor as a distinct consumer base for digital content, documenting their preferences and choices at disaggregated levels. The study insights can be useful for both public and private entities to incorporate into ongoing and upcoming programmes to improve their reach and effectiveness, keeping the urban poor at the centre.
LIMITATIONS
The definition of ‘urban poor’ is limited to slums; however, it is still a good proxy as slums account for the majority of the urban poor population. The online media consumption in small cities was not captured as the study focused only on million-plus cities. Given that a simple random sampling approach was adopted at the household level, it may have led to under-representation of certain communities. Additionally, the survey uses ‘owners’ and ‘users’ of smartphones interchangeably as specific questions on whether a smartphone was shared were not posed.
EXHIBIT 3: Respondent level: Purposive sampling
A house, selected by using a random sampling technique, is visited. Basic housing profile and the details of the respondent are obtained (1265 HHs)
Do you or any of your family member own a mobile phone?
No
Yes
Yes
Detailed questions related to OTT were asked (1011 HHs)
1. Source of media for entertainment?
2. Do you aspire to own a smart-phone?
(254 HHs)
163 HHs
Do you or anyone else own a smartphone in your family?
No91 HHs
APPROACH AND METHODOLOGY THE NEW ENTERTAINMENT PARADIGM FOR THE URBAN POOR

CENTRE FOR POLICY RESEARCH (CPR), INDIA 18
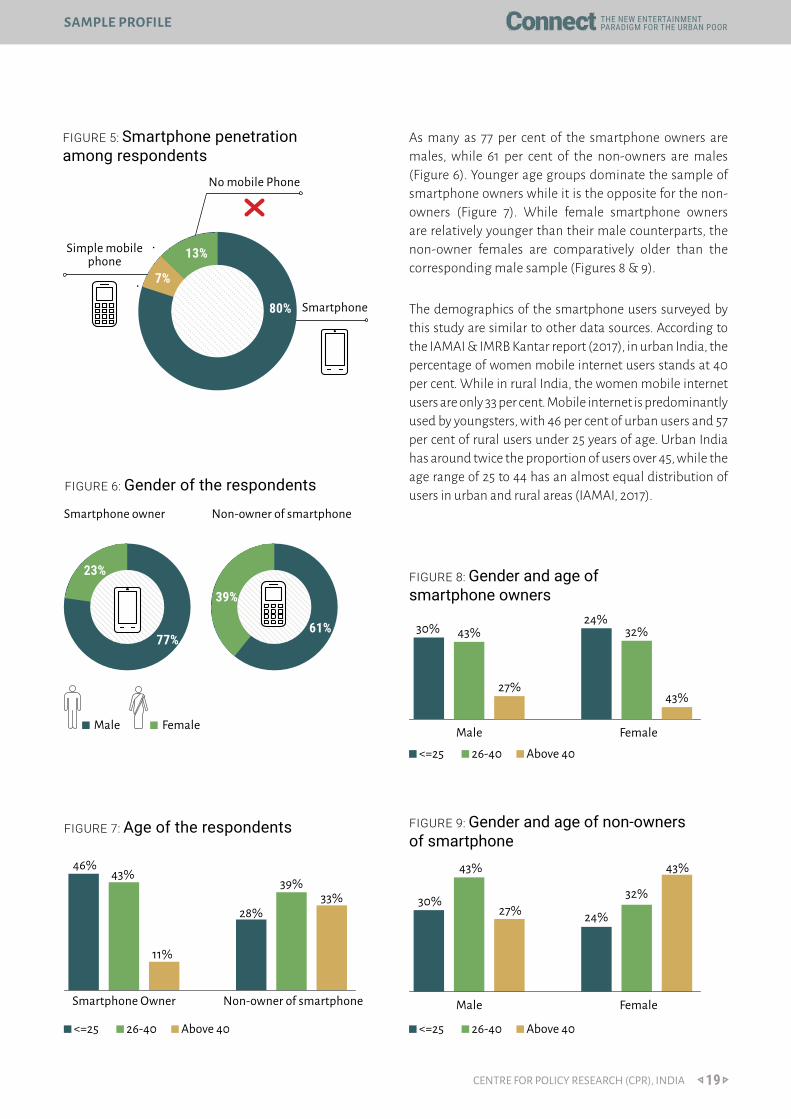
A total of 1265 people were surveyed. It was found that in 80 per cent (n=1011) of the households, at least one member owns a smartphone, while 20 per cent (n=254) do not own a smartphone (Figure 5). The pattern was similar across all the sampled cities. The following section gives the respondent profiles separately for the smartphone owners and the smartphone non-owners.
Sample Profile
THE NEW ENTERTAINMENT PARADIGM FOR THE URBAN POOR
CENTRE FOR POLICY RESEARCH (CPR), INDIA 19
As many as 77 per cent of the smartphone owners are males, while 61 per cent of the non-owners are males (Figure 6). Younger age groups dominate the sample of smartphone owners while it is the opposite for the non-owners (Figure 7). While female smartphone owners are relatively younger than their male counterparts, the non-owner females are comparatively older than the corresponding male sample (Figures 8 & 9).
The demographics of the smartphone users surveyed by this study are similar to other data sources. According to the IAMAI & IMRB Kantar report (2017), in urban India, the percentage of women mobile internet users stands at 40 per cent. While in rural India, the women mobile internet users are only 33 per cent. Mobile internet is predominantly used by youngsters, with 46 per cent of urban users and 57 per cent of rural users under 25 years of age. Urban India has around twice the proportion of users over 45, while the age range of 25 to 44 has an almost equal distribution of users in urban and rural areas (IAMAI, 2017).
7%
Smartphone80%
Simple mobile phone
No mobile Phone
13%
FIGURE 5: Smartphone penetration among respondents
FIGURE 7: Age of the respondents FIGURE 9: Gender and age of non-owners of smartphone
FIGURE 8: Gender and age of smartphone owners
46%
30%
30%
43% 43%
43%
11%
27%
27%
28% 24%
24%
39%32%
32%
33%
43%
43%
Smartphone Owner Male
Male
Non-owner of smartphone Female
Female
<=25 26-40 Above 40 <=25 26-40 Above 40
<=25 26-40 Above 40
SAMPLE PROFILE THE NEW ENTERTAINMENT PARADIGM FOR THE URBAN POOR
FIGURE 6: Gender of the respondents
Smartphone owner
23%
77%
Non-owner of smartphone
61%
Male Female
39%

CENTRE FOR POLICY RESEARCH (CPR), INDIA 20
Around 63 per cent of the HHs have a semi-pucca structure; this holds for both smartphone owners and non-owners. Pucca structures are relatively higher among smartphone owners (Figure 10). In terms of assets, the majority of the houses have a fan, TV and toilet. Overall, smartphone owners show higher ownership of assets compared to non-owners (Figure 11).
FIGURE 10: Condition of the dwellings of the respondents
17%
63%
21% 24%
63%
12%
Smartphone Owner Non-owner of smartphone
Kutcha Semi Pucca Pucca
100%
80%
60%
40%
20%
0%Refrigerator
Smartphone Owner Non-owner of smartphone
TV 4 wheeler 2 wheeler Cycle Fan Water pump
WashingMachine
Toilet
FIGURE 11: Asset ownership
The sample is well distributed across occupational categories. While smartphone owners are mostly students, contractual workers and self-employed, the non-owners are primarily housewives and non-contractual workers and self-employed (Figure 12). All the unemployed respondents in the sample are smartphone owners; 70 per cent of the unemployed smartphone owners are from Guwahati, most of whom are less than 25 years of age.
SAMPLE PROFILE THE NEW ENTERTAINMENT PARADIGM FOR THE URBAN POOR

CENTRE FOR POLICY RESEARCH (CPR), INDIA 21
The survey captured educational details only for smartphone owners. Around 52 per cent of the smartphone owners have studied till class 10th or below. This highlights the growing reach of smartphones among sections with lower education levels as well. Among the better educated section, 30 per cent of the respondents have studied till the intermediate level; 17 per cent are graduates and above (Figure 13). The distribution is
FIGURE 12: Occupation of the respondents
similar across genders. Younger respondents show marginally higher educational attainment than older ones. Students are found to have higher education than others. Around 70 per cent of the students have education at the intermediate level and beyond. On the other hand, non-construction labour has comparatively lower education than other categories.
Self-employed Contractual Non-Contractual Construction Non-Construction Student Housewife Unemployed
16% 16%
12%
3%
8%
14%
19% 19%
9%
0%
10% 11%10%
16%19%
18%
Smartphone Owner Non-owner of smartphone
FIGURE 13: Educational qualification of the respondents
Illiterate Primary Middle school Matric Intermediate Graduate Post graduate
6% 6%
16%
24%
30%
16%
1%
SAMPLE PROFILE THE NEW ENTERTAINMENT PARADIGM FOR THE URBAN POOR

CENTRE FOR POLICY RESEARCH (CPR), INDIA 22
REASONS FOR LOW NUMBERS OF FEMALE RESPONDENTS
• Around 64 per cent of male family members have ownership of smartphones. On the other hand, only 30 per cent of female family members have ownership of smartphones.
• Access to smartphones is more prevalent among males, underscoring the priority the husband or son receives.
• Due to weak technical know-how, parents, especially mothers, rely on their children to operate smartphones.
SAMPLE PROFILE THE NEW ENTERTAINMENT PARADIGM FOR THE URBAN POOR
DIGITAL HESITATION AMONG WOMEN RESPONDENTS
A gender divide with respect to both digital literacy and digital access exists in India, as shown by various studies. The findings of the present study highlight the nature of this divide. The purposive sampling adopted for the study required survey questions to be posed to a person who regularly uses the phone and various online platforms. It was observed that most of the woman members of the HH, during the survey, voluntarily stepped back and nominated someone else from the family to answer the questions. Consequently, the final profile of the respondents shows 70 per cent of the respondents as males.
Some crucial findings in this respect are:
■ Ownership is low among women compared to their male counterparts (as seen in the preceding section). Household access does not ensure women’s access. Many women use a male member’s smartphone if they need one.
■ Entertainment is the primary purpose of using a smartphone; other purposes are not explored much by women users.
■ Usage among women is usually limited to particular apps only; hesitation persists in usage despite ownership.
The nature of the digital divide is thus complex. It is a result of a combination of factors, evolving from digital illiteracy to digital hesitation. We can’t say that women lack access or knowledge entirely. They have both but in a limited way that has a specific pattern. There is access but with surveillance; and the woman is usually the last in line to access a shared phone.
So while underprivileged women in India have entered the digital space, it is still a new phenomenon. Apart from affordability and language barriers, gender norms create negative perceptions regarding smartphone usage. Unless these gender norms are addressed, universal access to digital technology remains a challenge.
Imag
e So
urce
: ind
iatim
es.co
m

CENTRE FOR POLICY RESEARCH (CPR), INDIA 23
In 20 per cent of the surveyed slum HHs, not even a single member owns a smartphone. Findings from the survey highlight that TV remains an essential asset and a popular source of media among the urban poor population. Around 89 per cent of the sampled urban poor have a TV in the house; 77 per cent of the kutcha houses own a TV compared to 92 per cent for semi-pucca and pucca houses.
Of the families with no access to mobile/smartphone, 78 per cent relied on TV for entertainment, 67 per cent had a local cable connection, while 11 per cent used direct-to-home (DTH) connection; 16 per cent used radio as the source of entertainment.
FIGURE 14: Source of entertainment of households with no mobile phone
5%
67%
16%Radio
Others
TV-local cable
11%TV-DTH
SOURCE OF MEDIA FOR NON-OWNERS OF SMARTPHONE (n=254)
Imag
e So
urce
: scr
oll.i
n

CENTRE FOR POLICY RESEARCH (CPR), INDIA 24
FIGURE 16: Percentage of households having television in India, 2001-2011
SOURCE OF MEDIA FOR NON-OWNERS OF SMARTPHONES (N=254)
Around 53 per cent of the non-smartphone owners aspire to own a smartphone in future. For 99 per cent of them, lack of money is the reason for not owning one currently. The remaining 47 per cent of the non-smartphone owners do not aspire to own a smartphone. The most common reason given by them is ‘no knowledge to operate a smartphone, followed by ‘do not feel the need of a smartphone’ and ‘no money to buy’. Non-aspiration is higher among the older age group and the women. In the age group of above 40 years, 55 per cent do not aspire for
a smartphone, compared to 37 per cent of the <=25 years age group. Also, 53 per cent of the women do not aspire to own a smartphone compared to 44 per cent of the men.
Given that the study aims to understand the online media consumption pattern of the urban poor, the coming sections will highlight the findings for smartphone owners only. That is, the sample size for all further analysis is 1011.
TRADITIONAL MEDIA
TV and radio are the two most popular traditional media. Although the relevance of radio has been declining with time in both rural and urban India, TV remains relevant. Radio/transistor ownership declined from 36.1 per cent in 2001 to 19.9 per cent in 2011, while TV ownership in India has increased from 31.6 per cent in 2001 to 47.2 per cent in 2011 (Source: Census 2011).
FIGURE 15: Percentage of households having radio/transistor in India, 2001-2011
50
40
30
20
10
00
80
60
40
20
00Total TotalRural RuralUrban Urban
19.9
47.235.1
31.6 33.4
18.9
76.7
64.3
17.3
31.5
25.3
44.5
2011 2001 2011 2001
FIGURE 17: Source of entertainment of households with no mobile phone
No knowledge
No need
No money
Others 2%
21%
28%
49%

CENTRE FOR POLICY RESEARCH (CPR), INDIA 25
The survey asked smartphone owners/users detailed questions centring on smartphone usage. The questions broadly enquired about two areas: first, the access, including questions on the handset, network, recharge, etc. (Section 1); and second, the preferences of the smartphone user in terms of platform, content, time, etc. (Section 2).
Trends in OTT Usage: Insights from the Primary Survey
THE NEW ENTERTAINMENT PARADIGM FOR THE URBAN POOR
Imag
e So
urce
: pat
rika.
com

CENTRE FOR POLICY RESEARCH (CPR), INDIA 26
TRENDS IN OTT USAGE: INSIGHTS FROM THE PRIMARY SURVEY
THE NEW ENTERTAINMENT PARADIGM FOR THE URBAN POOR
SMARTPHONE OWNERSHIP WITHIN THE HOUSEHOLD (GENDER AND AGE DIVIDE)
Analysis of the family roster highlighted that 30 per cent of the females own a smartphone, while this figure is 64 per cent for the males2. However, there is a possibility that females are using the phone of other family members, which is not captured conclusively in the primary survey. Further, ownership is higher among the younger population of the urban poor, and it decreases with age. Around 67 per cent of the young (<=25 years) members own a mobile phone, this number dropping to 43 per cent and 9 per cent for the age categories 26-40 years and above 40 years, respectively. The interaction between gender and age show that women have lower access than males in every age group. This gender divide is highest for the mid-age population. For both women and men, the access reduces with age, with a steep decline among those aged above 40 years compared to those in the age group of 26-40 years.
More than half of the smartphone owners have owned the smartphone for more than two years. Ownership of a smartphone is the longest for Coimbatore, followed by Jaipur. However, it is more recent for Guwahati and Kolkata, with a majority of them owning a smartphone for less than a year.
FIGURE 18: Age of smartphone owner/user67%
43%
26-40<= 25 Above 40
9%
2 The design of the methodology was purposive sampling, i.e. those respondents were chosen who had access to a smartphone. Therefore, to understand the gender and age divide in phone ownership, the data from the family roster was used, taking into account all the family members of the sampled HHs (n=2301). (It should be noted that 28 respondents refused to disclose information or underreported their family members, so they were not included in this analysis.)
FIGURE 19: Gender of smartphone owner/user
30%
64%
Males Females
FIGURE 20: Interaction between age and Gender of smartphone owner/user
<= 25 years 26 40 years
Males Females
Above 40 years
81%
54%
81%
32% 25% 7%
SECTION 1: ACCESS TO THE DIGITAL WORLD This section presents a detailed analysis of the access-related parameters of smartphones. It includes the impact of age and gender on smartphone access, types and costs of handsets, preferred network providers, recharge patterns, etc. Apart from the city-specific trends, vari-ations across different socioeconomic parameters can be observed.

CENTRE FOR POLICY RESEARCH (CPR), INDIA 27
HANDSET MODELS AND PURCHASE PRICES
For the purchase price of a handset, the median amount for every city is close to INR 10,000. Samsung and Redmi are the most popular brands, with a share of 35 per cent and 21 per cent, respectively. This is followed by Vivo and Oppo. These four brands are owned by more than 80 per cent of the respondents (Figure 21). All four brands are popular among the urban poor for delivering low-cost models. Second-hand phones are also reported.
While the median price is higher for Pune than the overall average, it is lower in Delhi and Coimbatore (Figure 22). On average, females spend less than males
on mobile handsets (females: INR 9000; males: INR 10,000). People above 40 years of age spend INR 8000 on average, compared to INR 10,000 by the younger age groups.
In terms of occupational categories, it is found that the median handset price is highest for non-contractual workers, followed by unemployed. On the other hand, construction labour (91 percent), housewives (69 percent) and contractual workers (68 percent) own a smartphone that costs less than INR 10,000. In every category, the majority owns a handset priced between INR 5000- INR 10,000, except non-contractual workers. Among non-construction labour and non-contractual workers, 16% and 13% have spent more than INR 15,000 on their handset, respectively (Figure 23).
FIGURE 22: Handset purchase prices across various cities
Pric
e of
Han
dset
(IN
R)
0
5,000
10,000
15,000
20,000
GuwahatiPuneCoimbatoreJaipurDelhi Kolkata
TRENDS IN OTT USAGE: INSIGHTS FROM THE PRIMARY SURVEY
THE NEW ENTERTAINMENT PARADIGM FOR THE URBAN POOR
FIGURE 21: Handset models
8%
1%
1%
2%
2%
2%
12%
15%
21%
35%
Others
Intex
Nokia
Motorola
Lava
Micromax
Oppo
Vivo
Redmi
Samsung

CENTRE FOR POLICY RESEARCH (CPR), INDIA 28
TRENDS IN OTT USAGE: INSIGHTS FROM THE PRIMARY SURVEY
THE NEW ENTERTAINMENT PARADIGM FOR THE URBAN POOR
FIGURE 23: Handset purchase price across Occupational categories
48% 63% 34%
81% 46% 48% 56%
40%
28%25%
41%
10%
10%
24% 29%21%
39%
9% 5% 12% 16% 9%10% 10%
14% 5% 11%
Idea 13%
Airtel 34%BSNL 2%
Jio 36%
Vodafone 15%
14% 12% 13% 11%
Self-emp Contractual Non contractual
Construction Non construction
HousewifeStudent Unemployed
1000-5000 5000- 10000 10000-15000 15000-20000 More then 20000
POPULAR NETWORK PROVIDERS
Jio and Airtel are the most popular service providers among the urban poor (Figure 24). Airtel is more common in Coimbatore and Guwahati, while Jio is the choice of the majority in Jaipur, Delhi and Pune. Kolkata is not dominated by any particular provider; it shows an equal preference for Jio and Airtel, and a good share of other providers as well.
In only three years’ time, Jio has become the largest operator in the country with 32 per cent of the market share and more than 340 million subscribers (Business Line, 2019). Incumbents like Airtel and Vodafone continue to face a price war against Jio.
FIGURE 24: Popular network provider
A GSMA study in Nyarugusu Refugee Camp in Tanzania, 2017, reported that basic phones are reported to cost approximately INR 675-1200 ($9-16) in the refugee camp, while the cost of a smartphone ranges from INR 3375 to INR 10,125 ($45-135). For the vast majority (92 per cent) of non-mobile phone users, the cost of a handset is one of the main barriers to owning a phone. It means the refugees need to make significant sacrifices to afford a device, for example, selling food and saving over the long term (Karlsson, et al., 2017).

CENTRE FOR POLICY RESEARCH (CPR), INDIA 29
TRENDS IN OTT USAGE: INSIGHTS FROM THE PRIMARY SURVEY
THE NEW ENTERTAINMENT PARADIGM FOR THE URBAN POOR
RECHARGING PATTERN
Affordable data plans act as a driving factor for digital penetration among the poor. A number of recent reports indicate high data consumption per phone in India. Jio’s entry triggered massive data tariff cuts across the network providers (Doval, P., ET, 2016). In line with this, the study assessed the recharging pattern among the respondents.
The respondents mentioned a minimum recharge of INR 49 to a maximum of INR 500 per month. This includes both calling and data package. Around 60 per cent of the respondents spend INR 100-200, while 33 per cent spend INR 300-400 for recharging their mobile packages every month (Figure 25).
The trend is similar across gender and age groups. One interesting observation is that amongst the respondents paying INR 400-500, 70 per cent are in the 26-40 years age category.
There are inter-city variations in the monthly recharge amounts. In Jaipur and Coimbatore, 80-90 per cent of respondents spend INR 100-200, while 80 per cent of those in Guwahati are in the INR 300-400 amount bracket. Delhi, Pune and Kolkata show more evenly distributed figures across the amount categories. For the highest band of INR 400-500, Kolkata (37 per cent) and Jaipur (34 per cent) show the largest share (Table 2).
TABLE 2: Average recharge amounts across cities
TABLE3: Handset median price, smartphone recharge amount and recharge frequency across Education levels
1.44%
101-200
201-300
301-400
401-500 4.79%
33.20%
60.13%
0.26%
<=100
FIGURE 25: Monthly Recharge Amount (INR)
City Average Recharge Amount (INR)
Guwahati 360.20
Kolkata 316.95
Pune 289.74
New Delhi 248.60
Jaipur 220.76
Coimbatore 185.94
Smartphone owners/users
No formal / primary
Middle/matric Intermediate Graduate and above
Male Monthly recharge (median) 199 199 199 199
Handset price (median) 8,000 10,000 10,000 10,000
Female Monthly recharge (median)
199 200 274.5 399
Handset price (median) 8,000 9,250 10,000 9,600

CENTRE FOR POLICY RESEARCH (CPR), INDIA 30
TRENDS IN OTT USAGE: INSIGHTS FROM THE PRIMARY SURVEY
THE NEW ENTERTAINMENT PARADIGM FOR THE URBAN POOR
TABLE 4: Handset median price, smartphone recharge amount and recharge frequency across Occupational categories
Smartphone owners/users
Working Student Non-working
Male Monthly recharge (median) 199 199 399
Handset price (median) 9,600 10,000 10,750
Female Monthly recharge (median) 200 200 200
Handset price (median) 10,500 9,500 9,000
During the field survey, it was also noted that respondents are able to keep the recharge costs down through sharing of internet via hotspot or tethering Bluetooth between two mobiles. This was a common practice among respondents. This practice allows them to purchase data packs sporadically or sometimes not at all. With the opportunity of unlimited data plans, respondents reported buying a single data pack utilised among immediate family and peers.
It is also found that handset prices and recharge amounts vary across employment and education levels (Tables 3 & 4). For female smartphone users, the handset prices and recharge amounts show a positive relation with education. This is, however, not true for males. Working women have a higher median handset price compared to other female smartphone owners. Among
A study in Kenya (2017) highlighted that female income earner who did own an internet-enabled phone were more likely to own a feature phone or smartphone purchased from their earnings rather than relying on a partner’s. The primary barrier to women’s ownership appeared to be around overall household affordability. If a household could only afford one internet-enabled device, it might belong to the husband rather than the wife (Karlsson, et al., 2017).
FIGURE 26: Time spent on smartphone for entertainment
<1 hour
1-2 hours
3-5 hours
> hours
Not using smartphonefor entertainment
male smartphone owners, working males have a lower handset price than students or non-working males. Recharge amount is the same (INR 200) for all men other than non-working males.
Smartphones are being used by all the respondents for communication; about 97 per cent used them for entertainment and 84 per cent for social media.
The majority of the people spend an average of 3-5 hours on a smartphone for entertainment daily (Figure 26); the average hours spent are lower for females than males. Adults less than 25 years old spend longer hours on entertainment compared to older counterparts. Except for Delhi, where the majority spends 1-2 hours, all other cities predominantly spend more than 3 hours daily on entertainment using smartphones.
49%
33%
6%3%9%

CENTRE FOR POLICY RESEARCH (CPR), INDIA 31
5%
TRENDS IN OTT USAGE: INSIGHTS FROM THE PRIMARY SURVEY
THE NEW ENTERTAINMENT PARADIGM FOR THE URBAN POOR
SECTION 2: CHOICES AND PREFERENCES OF OTT PLATFORMS, CONTENT, ETC.This section focuses explicitly on the OTT usage among the urban poor. It highlights the preferences of the respondents in terms of the OTT platform, the type of content, time of watching and language of the con-tent viewed. It also shows how preferences vary across various parameters such as city, age, gender, occupational categories, etc.
PLATFORM PREFERENCES
For the present study, the respondents were asked to rank various online entertainment platforms. It was found that the most preferred platforms are YouTube, WhatsApp and Facebook (Figure 27), with 36.3 per cent of the respondents citing YouTube as their top preference, 31 per cent WhatsApp, and 23 per cent Facebook. However, WhatsApp is the most popular platform; for more than 80 per cent of people, it is one of the top three platforms for entertainment. The inertia enjoyed by these applications drives this high preference.
Historically, YouTube is considered the application that established the trend for online video watching among Indians (Samtani & Jindal, 2018). WhatsApp has become popular not only as a messaging app but also for features like video calling. Indians log 50 million video-calling minutes a day on WhatsApp (Noshir, et al., 2019). The two applications have become ‘default’ options for many.
96% 95% 93%
5%
84%
FIGURE 27: Platform preference
36% 31% 22% 6%
9%
12%
66%
3%
20%19%
18%
20% 33%
27%
6%
6%
4% 5% 7%10%
18%12% 28%
You Tube WhatsApp Facebook Hotstar Voot Jio TV Airtel TV Others
Rank- 1 Rank- 2 Rank- 3 Rank- 4 Rank- 5 Not among top five platiorms
CENTRE FOR POLICY RESEARCH (CPR), INDIA 32
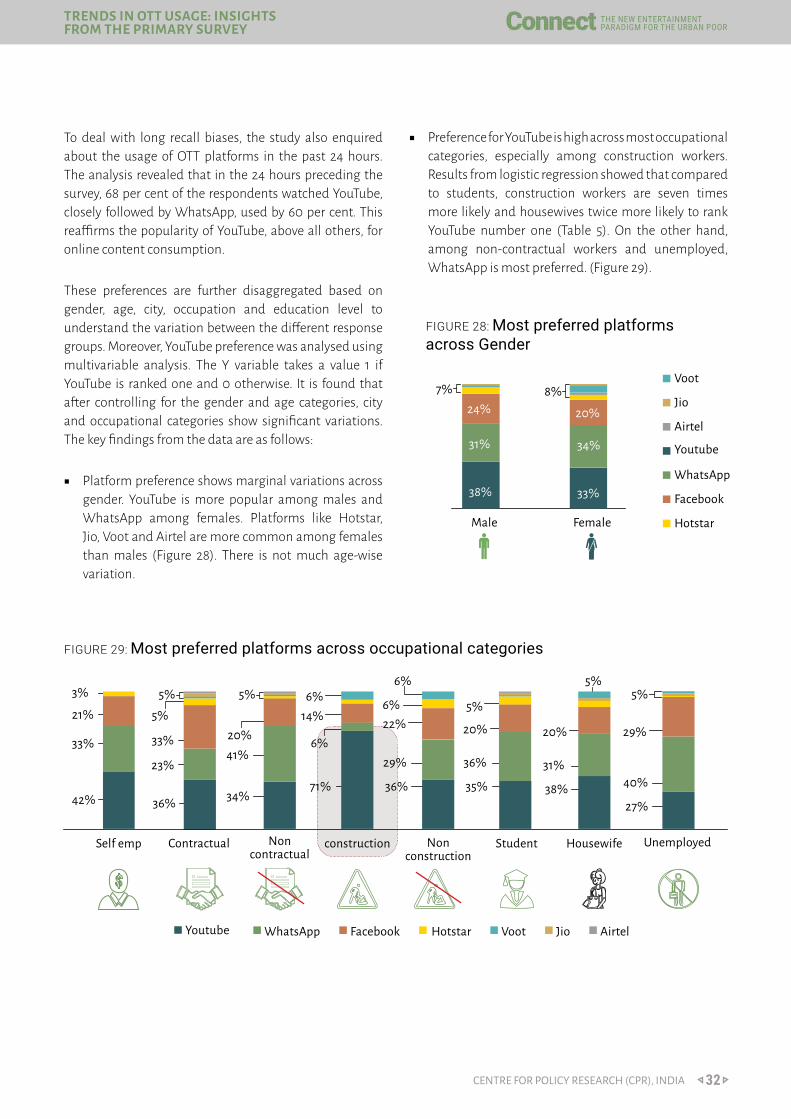
■ Preference for YouTube is high across most occupational categories, especially among construction workers. Results from logistic regression showed that compared to students, construction workers are seven times more likely and housewives twice more likely to rank YouTube number one (Table 5). On the other hand, among non-contractual workers and unemployed, WhatsApp is most preferred. (Figure 29).
To deal with long recall biases, the study also enquired about the usage of OTT platforms in the past 24 hours. The analysis revealed that in the 24 hours preceding the survey, 68 per cent of the respondents watched YouTube, closely followed by WhatsApp, used by 60 per cent. This reaffirms the popularity of YouTube, above all others, for online content consumption.
These preferences are further disaggregated based on gender, age, city, occupation and education level to understand the variation between the different response groups. Moreover, YouTube preference was analysed using multivariable analysis. The Y variable takes a value 1 if YouTube is ranked one and 0 otherwise. It is found that after controlling for the gender and age categories, city and occupational categories show significant variations. The key findings from the data are as follows:
■ Platform preference shows marginal variations across gender. YouTube is more popular among males and WhatsApp among females. Platforms like Hotstar, Jio, Voot and Airtel are more common among females than males (Figure 28). There is not much age-wise variation.
FIGURE 29: Most preferred platforms across occupational categories
42% 36%
23%
33% 33%41%
71% 36% 35% 38%27%
34%
6% 5%5%6%
6% 5%
5% 14% 22% 20% 20% 29%20% 6%29% 36% 31%
40%
21%
3%
FIGURE 28: Most preferred platforms across Gender
38% 33%
31% 34%
24% 20%
Male Female
Youtube
Hotstar
Voot
Jio
Airtel
Self emp Contractual Student Housewife UnemployedNon construction
constructionNon contractual
Youtube WhatsApp Facebook Hotstar Voot Jio Airtel
TRENDS IN OTT USAGE: INSIGHTS FROM THE PRIMARY SURVEY
THE NEW ENTERTAINMENT PARADIGM FOR THE URBAN POOR
7% 8%
5% 5%

CENTRE FOR POLICY RESEARCH (CPR), INDIA 33
6%
FIGURE 30: Most preferred platforms across cities
59% 66% 35% 33%
19% 46%
9% 54%
16% 7% 7%
25%
8%4%
Delhi Jaipur Coimbatore Pune Guwahati Kolkata
24% 13%
34%
36%
10%7%
48%
24%
Youtube WhatsApp Facebook Hotstar Voot Jio Airtel
FIGURE 31: Most preferred platforms across Educational categories
Y variable: YouTube most preferred (Yes=1, No=0)
Odds ratio p-value*
City (Base: Coimbatore)
New Delhi 2.74 0.00
Jaipur 4.76 0.00
Pune 1.19 0.48
Guwahati 0.63 0.12
Kolkata 0.33 0.00
Occupation (Base: Student)
Self-employed 1.59 0.1
Contractual 1.69 0.06
Non-contractual 0.92 0.77
Construction 7.45 0.00
Non-construction 1.77 0.05
Housewife 2.04 0.04
Unemployed 1.24 0.52
Gender (Base: Male)
Female 0.88 0.62
Age (Base: 18-25 years)
26-40 0.92 0.63
Above 40 0.73 0.24
TABLE 5: Multivariable logistic regression analysis for YouTube preference
TRENDS IN OTT USAGE: INSIGHTS FROM THE PRIMARY SURVEY
THE NEW ENTERTAINMENT PARADIGM FOR THE URBAN POOR
■ Platform preference show high city-wise variations. While the most preferred platform in Delhi and Jaipur is YouTube, it is WhatsApp in Pune and Guwahati. Results from logistic regression showed that when compared to Coimbatore, the odds of preferring YouTube are 4.8 times higher in Jaipur and 2.7 times higher in Delhi (Table 5). In Coimbatore, Facebook is the first choice, but in Kolkata, both WhatsApp and Facebook are top preferences. Hotstar and Jio are more popular in Kolkata, followed by Coimbatore (Figure 30).
■ Preference for Facebook has a positive relation with the education level of the smartphone owner. On the other hand, there is a small decline in preference for YouTube as the educational level rises (Figure 31).
No formal/ primary
Middile/ matric
Intermediate Graduate and above
Youtube WhatsApp Facebook Hotstar
Voot Jio Airtel
* A p-value below 0.05 (significance level of 5%) has been taken as the threshold for statistical significance.
41% 40%
31%28% 30% 30%
31%24%21%18%
8%
38% 32%

CENTRE FOR POLICY RESEARCH (CPR), INDIA 34
52%Movies
14%Education
58%News
8%Music
52%Sports
5%Business
32%Web series
Serial
Movies constitute the most viewed content among the respondents, followed by news and sports. Business-related content is viewed the least on OTT platforms – only by 5 per cent of the sampled urban poor. Disaggregation of choices across the socioeconomic parameters showed that movies are the most preferred content across all categories. This is confirmed by multivariable analysis where there is not much variation across gender, age or occupational categories. Cities can be ranked in descending order of their movie preference: Coimbatore, Pune, Jaipur, Guwahati, Kolkata, Delhi.
Except for movies, all other content types – news, sports, serials or education related – show variations across the
different categories. Viewership of news, the second most-viewed content, has also been studied using multivariable analysis. The key findings from the data are as follows:
■ In comparison to other cities, Delhi showed more diversified content consumption by having high viewership of content like education, music and others, for which other cities show little or no preference (Figure 32). On the other hand, Jaipur shows the least variety in the content viewed. Jaipur also had the lowest viewership of news. As per the logistic regression, the odds of watching news are seven times and four times higher for Guwahati and Delhi, respectively, compared to Jaipur (Table 6).
Guwahati Jaipur Kolkata Delhi Pune0%
20%
40%
60%
80%
100%
FIGURE 32: Most viewed content across cities
Coimbatore
Sports News Web series/Serial Movies Business related Education Music Outhers
TRENDS IN OTT USAGE: INSIGHTS FROM THE PRIMARY SURVEY
THE NEW ENTERTAINMENT PARADIGM FOR THE URBAN POOR
CONTENT PREFERENCE
Exhibit 4: Types of content being consumed

CENTRE FOR POLICY RESEARCH (CPR), INDIA 35
FIGURE 33: Content preference across Gender
Sports Movies Business Education Music OuthersNews
Male Female
Serials/web series
62% 64%53%
78%72%
5% 5%12% 8% 10%
2% 4%
19%
38%
26%18%
■ Variation in preferred content across age groups is not very stark, except that content related to education is high only for the age category of <=25 years. Sports is more common among the younger age groups, while the news is more common in the older ones (Figure 34). The odds of watching news are twice for the age group of 40 years and above than those below 25 years of age (Table 6). Serials/web series are popular among the younger population.
0%
20%
40%
60%
80%
Sports Movies Business Education Music OuthersNews Serials/web series
>=25 26-40 40 above
FIGURE 34: Content preference across Age categories
■ Serials are more commonly watched over OTT by females, while sports and news remain more popular among males (Figure 33). The odds of watching the news for males is more than twice as high as that for females (Table 6).
TRENDS IN OTT USAGE: INSIGHTS FROM THE PRIMARY SURVEY
THE NEW ENTERTAINMENT PARADIGM FOR THE URBAN POOR
■ Among the occupational categories, students show significantly higher viewership of news than non-contractual workers and housewives (Table 6). Music is popular mostly among students.
■ For housewives, serials/web series are preferred to sports or news, unlike other categories (Figure 35).
■ Viewership of news and education-related content increases as the education level rises (Figure 36).
■ In Delhi, Jaipur and Coimbatore, the share of females watching movies is lower than that of males. Only Pune and Kolkata show the female preference for movies to be higher, while for Guwahati, there is not much difference across gender. Delhi has the lowest percentage for both males and females, compared to other cities. Males in Coimbatore and females in Pune have the highest viewership (Figure 37).

CENTRE FOR POLICY RESEARCH (CPR), INDIA 36
FIGURE 36: Content preference across Educational categories
FIGURE 37: Movie viewership across cities
TRENDS IN OTT USAGE: INSIGHTS FROM THE PRIMARY SURVEY
THE NEW ENTERTAINMENT PARADIGM FOR THE URBAN POOR
-10% No formal/ primary
Sports News Serial/web seriesMovies Business related Education
Linear [Education]Music Others
Middle/matric Intermediate Graduate and above
10%
30%
50%
70%
90%
60%52%
86%
64%
93%
67%
91%78% 77%
63%79%82%
New Delhi Jaipur
Male Female
Coimbatore Pune Guwahati Kolkata
FIGURE 35: Content preference across Occupational Categories
0%
20%
40%
60%
80%
100%
Sports News Series Movies Business Education Music Others
Self employed Contractual Housewife UnemployedNon construction
construction StudentNon contractual

CENTRE FOR POLICY RESEARCH (CPR), INDIA 37
TRENDS IN OTT USAGE: INSIGHTS FROM THE PRIMARY SURVEY
THE NEW ENTERTAINMENT PARADIGM FOR THE URBAN POOR
Y variable: Movies watched over OTT (Yes=1, No=0)
Odds ratio p-value
Gender (Base: Male)
Female 0.93 0.77
Age (Base: 18-25 years)
26-40 years 0.74 0.16
Above 40 years 0.61 0.09
City (Base: New Delhi)
Jaipur 3.71 0.00
Coimbatore 10.19 0.00
Pune 4.23 0.00
Guwahati 2.99 0.00
Kolkata 1.60 0.06
Occupation (Base: Student)
Self-employed 1.28 0.41
Contractual 0.99 0.99
Non-contractual 1.78 0.08
Construction 1.71 0.37
Non-construction 1.74 0.08
Housewife 1.74 0.13
Unemployed 1.04 0.89
Y variable: News watched over OTT (Yes=1, No=0)
Odds ratio
p-value
Gender (Base: Female)
Male 2.57 0.00
Age (Base: 18-25 years)
26-40 years 1.81 0.00
Above 40 years 2.03 0.01
City (base: Jaipur)
New Delhi 3.87 0.00
Coimbatore 2.82 0.00
Pune 2.02 0.00
Guwahati 6.87 0.00
Kolkata 2.07 0.00
Occupation (Base: Student)
Self-employed 0.86 0.59
Contractual 1.03 0.91
Non-contractual 0.57 0.04
Construction 0.53 0.12
Non-construction 0.74 0.27
Housewife 0.34 0.00
Unemployed 1 0.99
TABLE 6: Multivariable logistic regression analysis for movies and news viewership
To see which platforms are preferred for various content types, an interaction between the two was studied (Figure 38). It was found that YouTube is the preferred platform for almost every piece of content. Education and news are being consumed more through Facebook, followed again by YouTube. Hotstar seems to be the upcoming platform for movies and sports. WhatsApp is most popular for business-related and sports content. The uptake of Jio TV is comparatively low, but it appears to be used to consume diverse content, such as business-related movies, serials and news.
The data points showed that content consumption is primarily an individual activity. Only 3 per cent watch anything in a group, mainly by direct sharing of a smartphone. Chromecast, Amazon Fire TV Stick, etc. are non-existent. The content choice changes for one-third when watching in a group. Users prefer to consume online media individually rather than in groups as OTT platforms provide a more personalised experience. Users can recap and pause viewing at their own pace. This allows a user to identify and engage with the content of their choice, and provides effective time and portability convenience.
MOVIES NEWS

CENTRE FOR POLICY RESEARCH (CPR), INDIA 38
TRENDS IN OTT USAGE: INSIGHTS FROM THE PRIMARY SURVEY
THE NEW ENTERTAINMENT PARADIGM FOR THE URBAN POOR
FIGURE 38: Preference for platforms for various types of content
Youtube WhatsApp Facebook HotStar Jio Voot Airtel TV Others
0% 10% 20% 30% 40% 50% 60% 70% 80% 90% 100%
Sports
News
Serials/ Web
Movies
Business Related
Education
Music
The data found that the urban poor spend on average 3-5 years on a smartphone for entertainment daily (detailed discussion in Section 1). Video-based platforms show longer hours of content consumption (Figure 39). Around 38 per cent of the YouTube users spend more than 60 minutes on it every day. The same is true for 25 per cent of Hotstar users. There is, however, not much
variation across gender and age categories. Women are spending less time than men on YouTube, WhatsApp and Facebook (Figure 40). Time spent on YouTube and Facebook drops as the education level rises. On the other hand, for WhatsApp, more educated smartphone owners are spending a longer duration daily (Figure 41).
TIME PREFERENCE
FIGURE 39: Time spent on various OTT platforms
FIGURE 40: Time spent on various OTT platforms across Gender
43%
43%
14% 14%
46%
39% 34%
40%
25%
49%
26%
25%
22%
Male Male MaleFemale
Youtube WhatApp Facebook
Female Female
31% 41%
38% 35% 45%
35%
51%
48%
37%
40%
50%
40%31%
13% 15% 15% 10%
43%
43%
14%11%
47%
42%
24%
38%
38%
Youtube Whate App
0-30 min 0-30 min30-60 min 30-60 minMore than60 min More than60 min
FB Hotstar Voot Jio Airtel

CENTRE FOR POLICY RESEARCH (CPR), INDIA 39
TRENDS IN OTT USAGE: INSIGHTS FROM THE PRIMARY SURVEY
THE NEW ENTERTAINMENT PARADIGM FOR THE URBAN POOR
FIGURE 41: Time spent on various OTT platforms across educational categories
43% 36%19%
0% 1% 1% 1% 1% 1% 1%0%
25% 33% 34% 39% 36%28% 26%
14%
No
form
al/p
rimar
y
No
form
al/p
rimar
y
No
form
al/p
rimar
y
Mid
dle/
mat
ric
Mid
dle/
mat
ric
Mid
dle/
mat
ric
Inte
rmed
iate
Youtube WhatsApp FacebookIn
term
edia
te
Inte
rmed
iate
Grad
uate
and
abo
ve
Grad
uate
and
abo
ve
Grad
uate
and
abo
ve
23% 26% 29%
42% 41% 35%
38% 35%
36%81% 75% 67% 65% 61%
63% 70%73%
0-30 min 30-60 min More than 60 min
The study also enquired about the time preferred by people to consume online media. It was found that the majority of the people prefer post 7 pm for using a smartphone for OTT (Figure 42). Primetime remains popular across cities, except Delhi and Guwahati, where post 10 pm usage is preferred. The morning before 11 is popular mainly among Coimbatore and Pune respondents. On the one hand, Kolkata and Pune show a fair share of viewership for all time slots. Cities like Jaipur and Coimbatore, on the other hand, have a high preference for specific slots. Other than primetime, Jaipur chooses afternoon, while for Coimbatore, morning and night periods are preferred (Figure 43).
Morning before 11 am
Afternoon 11 am-3 pm
Evening 4 pm-7 pm
Primetime 7 pm-10 pm
Night after 10 pm
FIGURE 43: Preferred time for using OTT across cities
FIGURE 42: Preferred time for using OTT
61%
47%
30%
28%
19%
0%
20%
40%
60%
80%
100%
Coimbatore Guwahati jaipur Kolkata New Delhi Pune
Morning before 11 am Afternoon 11 am-3 pm Evening 4 pm-7 pm
Primetime 7 pm-10 pm Night after 10 pm

CENTRE FOR POLICY RESEARCH (CPR), INDIA 40
TRENDS IN OTT USAGE: INSIGHTS FROM THE PRIMARY SURVEY
THE NEW ENTERTAINMENT PARADIGM FOR THE URBAN POOR
Primetime and nighttime are the most preferred time slots for men (Figure 44). However, women’s preference for these time slots is shared with the afternoon period of 11-3 pm. Around 66 per cent of males use smartphones for entertainment during 7-10 pm, while only 44 per cent of the women do so. Evening 4-7 pm recorded the lowest response for both males and females. Age groups do not show much variation.
There are marginal variations across the occupational categories. Apart from the evening, the afternoon slot is preferred by housewives and non-contractual workers, while morning time is popular among construction and contractual workers (Figure 45). It was also found that as the education level rises, preference for a time after 7 pm increases among the urban poor. The time slots before 7 pm do not show much difference across educational categories.
FIGURE 44: Preferred time for using OTT across gender
FIGURE 45: Preferred time for using OTT across occupational categories
31%24% 24%
66%
44% 44%48%
17%
28%
28%
Morning before 11 am Afternoon 11 am-3 pm Evening 4 pm-7 pm Primetime 7 pm-10 pm Night after 10 pm
Male Female
Morning before 11 am Afternoon 11 am-3 pm Evening 4 pm-7 pm Primetime 7 pm-10 pm Night after 10 pm
Self employed
0%10%20%30%40%50%60%70%80%90%
Contractual
Housewife UnemployedNon-construction
construction
Student
Non-contractual

CENTRE FOR POLICY RESEARCH (CPR), INDIA 41
TRENDS IN OTT USAGE: INSIGHTS FROM THE PRIMARY SURVEY
THE NEW ENTERTAINMENT PARADIGM FOR THE URBAN POOR
LANGUAGE PREFERENCE
To understand which languages are preferred to consume media, respondents were asked to rank three languages: Hindi, English and regional. Except for Coimbatore, the Hindi language is the first or, in some cases, second preference for the majority in every city. Delhi, Coimbatore and Guwahati also chose the English language but predominantly as the second preference (Table 7)
The graph (Figure 46) shows the likelihood of having the regional language as the first preference for use in OTT platforms in different cities across various age categories. Coimbatore shows the highest preference for the regional language across age groups. In Kolkata, Pune and Guwahati, preferences vary across age groups, while in the Hindi-speaking cities of Delhi and Jaipur, no respondent cited a regional language as their first preference. The four cities Coimbatore, Kolkata, Pune and Guwahati show the highest preference for the regional language among the age category of 40 years and above. The younger population show lower preference, especially the age group of 26-40 years. Both Pune and Kolkata show a marked dip in share in this age category.
English is preferred by the young age group, especially in Delhi and Coimbatore (Figure 47). For those above 25 years of age, the preference for English is low and shows significantly lower inter-city variations. Jaipur does not have English as the first preference for any respondent. On the other hand, Hindi is preferred the most by the 26-40 years age group in Delhi and Pune (Figure 48). In the age group of 40 years and above, preference for the regional language (as discussed above) has led to low popularity of Hindi in all cities, except Delhi and Jaipur. (All the respondents of Jaipur chose Hindi as their preferred language, so no variation is seen across age.) Coimbatore has no respondents with Hindi as the preferred language.
TABLE 7: Language preference to consume media across cities
City Preference 1 Preference 2
Delhi Hindi English
Jaipur Hindi Regional
Coimbatore Regional English
Pune Hindi Regional/Hindi
Guwahati Hindi/Regional Hindi/English
Kolkata Hindi/Regional Hindi/Regional
FIGURE 46: Preference for the regional language in the use of OTT
Pr(Regional)
2
<- 25 25- 40
Coimbatore
Age Categories
KolkataGuwahatiPune
Above 40
4
6
8
1

CENTRE FOR POLICY RESEARCH (CPR), INDIA 42
TRENDS IN OTT USAGE: INSIGHTS FROM THE PRIMARY SURVEY
THE NEW ENTERTAINMENT PARADIGM FOR THE URBAN POOR
FIGURE 47: Preference for English in the use of OTT
FIGURE 48: Preference for Hindi in the use of OTT
Pr(Hindi)
<- 25 26- 40 Above 40
Pr(English)
0
.1
.2
.3
CoimbatoreNew Delhi KolkataGuwahatiPune
<- 25 26- 40 Above 40
.2
.4
.6
.8
1
New Delhi KolkataGuwahatiPune

CENTRE FOR POLICY RESEARCH (CPR), INDIA 43
TRENDS IN OTT USAGE: INSIGHTS FROM THE PRIMARY SURVEY
THE NEW ENTERTAINMENT PARADIGM FOR THE URBAN POOR
Preference for the regional language shows an increasing trend against the education level (Figure 49). Results from logistic regression shows that education becomes statistically insignificant when we control for city effects. Possible explanation could be higher educational levels in cities like Coimbatore, Pune and Guwahati, where preference for the regional language is also high. It was also found that preference for English increases with education levels, while it decreases for Hindi. These results remain significant even after controlling for the city.
According to the McKinsey Global India-Digital India Report (Noshir, et al., 2019), local language content and interfaces are important catalysts for growth in internet usage in a country whose Constitution lists 22 scheduled, or official, languages. Digital applications will need to support local languages to succeed in India.
One study found that, in 2016, the number of people using an Indian language on the internet surpassed the number of Indians who use English on the web. Their number rose at a compound annual growth rate of 41 percent between 2011 and 2016 when it reached 234 million users (KPMG, 2017). And that trend shows no sign of slowing: nine out of ten new internet subscribers in India do not speak English and will consume vernacular content (Doval, P., ET, 2017). Facebook in India supports 12 regional languages, and WhatsApp supports 11 local languages. However, more needs to be done. For example, less than 1 percent of all websites in India are in local languages, compared with 6.0 percent in Russia and 3.4 percent in Japan (W3Techs, 2021).
FIGURE 49: Language preference in the use of OTT across Educational Categories
No formal/Primary
Hindi English Regional Linear (english)
Middle/matric Intermediate Graduate and above
72%
19%
27%
65%
29%
53% 53%
11%
36%40%
5% 7%
OTT IN COMPARISON TO TELEVISION
Among the smartphone owners, TV ownership remains high (94 per cent), and 92 per cent of the sample spend more than INR 199 per month on DTH recharge. However, when the respondents were asked about the most preferred media, 64 per cent chose the smartphone while only 23 per cent cited TV. The reason given for this by most
of the respondents is the access to one’s favourite content, anytime and anywhere, through the smartphone. This highlights that though the smartphone has not lowered TV ownership, it is becoming more popular because of its ease of access, especially among the young population.

CENTRE FOR POLICY RESEARCH (CPR), INDIA 44
SECTION 3: FACTORS DRIVING OTT MARKET GROWTHIn line with global trends, the Indian consumer is increasingly consuming content on digital platforms. This trend is observed for all types of content, including video, news (text) or music (audio). Increasing internet penetration and mobile device proliferation, and the convenience of consuming content anytime are the key drivers for this trend. India has around 300,000 app developers and is already the second larg-est Android developer community in the world after the US (PTI., 2014).
TRENDS IN OTT USAGE: INSIGHTS FROM THE PRIMARY SURVEY
THE NEW ENTERTAINMENT PARADIGM FOR THE URBAN POOR
The increasing popularity of digital media has triggered a paradigm shift in entertainment preferences and choices. Marketers are following the changing trends and increasingly developing strategies and products to cater to emerging demands.
The analysis and the data points from the research provide compelling insights. The following are the on-ground trends and their implications.
INCREASING SMARTPHONE USAGE
The analysis from the study showed that 80 per cent of respondents own a smartphone. Of this 80 per cent, 50 per cent owned the smartphone for more than 12 months, and 97 per cent use them for entertainment purposes (as shown in Exhibit 5).
EXHIBIT 5: Factors driving OTT market growth
Rising Adoption
among Women
DRIVERS OF THE
OTT MARKET
Increasing Smartphone
Usage
Affordable Internet
Plans
80% Smartphone Ownership
Most preferred service provider
50% Smartphone Ownership for >12 months
98% Smartphone Ownership
40% Smartphone Ownership for >12 months
43% For entertainment (3-5 hours)/day
74% Paid at least INR 199 per month
38% Paid at least INR 399 per month
97% For entertainment

CENTRE FOR POLICY RESEARCH (CPR), INDIA 45
AFFORDABLE INTERNET PLANS
The trends analysed from the study depicted Jio as the most preferred service provider. The launch of Jio proclaimed a new era of affordable data in the country. It has been observed that post the launch of Jio in September 2016, the quarterly consumption of data has increased nearly tenfold (as shown in Exhibit 6), creating a covert demand for media consumption on the mobile by the urban poor.
The trends also showed that 74 per cent of the respondents spend at least INR 199 per month, and 38 per cent spend at least INR 399 per month on mobile data. The simplicity and efficiency of ‘on-the-go’ content have driven this unprecedented surge.
TRENDS IN OTT USAGE: INSIGHTS FROM THE PRIMARY SURVEY
THE NEW ENTERTAINMENT PARADIGM FOR THE URBAN POOR
RISING INTERNET ACCESS AMONG WOMEN
With the increasing reach and influence of the internet in India, the general profile of internet users is also widening. Research suggests that by 2020, internet penetration will be such that 40 per cent of viewers are likely to be female (BCG, Decoding the Digital opportunity in retail. , 2017) (BCG, Entertainment goes online, 2018). There has been a democratisation of internet access which has expanded the consumer sets (beyond just urban wealthy and male) and penetrated versatile population segments. The study showed 98 per cent of the female sample own a smartphone. Of this 98 per cent, 40 per cent have had smartphone ownership for more than 12 months, and 43 per cent use it for entertainment purposes. This is to note that the female sample size accounted for 23 per cent of the total sample (Exhibit 5).
EXHIBIT 6: Data consumption exponentially increasing post the launch of Jio
SOURCE: Efficient Industry Analysis (Samtani & Jindal, 2018)

CENTRE FOR POLICY RESEARCH (CPR), INDIA 46
SECTION 4: LEARNINGS FROM MULTIMEDIA CAMPAIGNS UNDER SWACHH BHARAT MISSION-URBAN (SBM-U)
With the deployment of national schemes and accelerated investment in health and hygiene in India, the government, international organisations, civil society and other stakeholders realised the need to strengthen the efforts to drive habit change towards safe sanitation and good hygiene practices, seen as one of the biggest challenges in India. Therefore, towards making the Swachhata movement a Jan Andolan – a people’s movement – the Government of India has started various multimedia campaigns on various themes since the launch of SBM-U to address age-old behaviour barriers. Some of these multi-media campaigns include (PIB, 2018):
■ Swachhata-Ministry of Housing and Urban Development (MoHUA) Mobile Application
■ Swachhata Hi Seva
■ Swachh Survekshan League
■ Swachh Shauchalaya-Swachh Shehar
■ Swachhata Selfie Episodes
■ Chacha Chaudhary Bye Bye Kachra
■ Gandagi Se Aazadi – Independence Day
The government rolled out these campaigns to tackle public health challenges across India; the focus was on campaign-based schemes to spark off behavioural change and awareness specifically across large populations. Hence, several questions regarding SBM were asked as part of the survey. The data points from the trends analysed relating to multimedia campaigns implemented under SBM show compelling insights. The following are the viewership trends and their implications.
CONTENT CONSUMPTION RELATED TO SBM
To accelerate the achievement of universal sanitation coverage, the government focused on community mobilisation, triggering of the masses for behaviour change, and generating demand on access to safe sanitation and continued usage of toilets. Respondents were asked if they had ever come across or seen any SBM-related content through OTT platforms, and 63 per cent responded positively. More than 90 per cent of respondents in Pune have seen SBM- or cleanliness-related content, followed by Delhi, Coimbatore and Guwahati (Figure 51). Kolkata and Jaipur have the least reported viewership for SBM/cleanliness content.
TRENDS IN OTT USAGE: INSIGHTS FROM THE PRIMARY SURVEY
THE NEW ENTERTAINMENT PARADIGM FOR THE URBAN POOR
FIGURE 50: City-wise consumption of cleanliness-related content
Coimbatore
New Delhi
Kolkata
Guwahati
Jaipur
Pune
60%
57%
44%
40%
85%
93%

CENTRE FOR POLICY RESEARCH (CPR), INDIA 47
DIFFERENT TYPES OF SANITATION-RELATED CONTENT CONSUMED
Information, Education and Communication (IEC) activities have gone a long way in ensuring Open Defecation Free (ODF) sustainability with regular outreach in suitable communication formats, such as Inter-Personal Communication (IPC), mass and mid media, engagement with civil society and Swachhagrahis (front-line workers of the Swachh Bharat Mission) etc. Multimedia campaigns relating to cleanliness were viewed by 48 per cent of the respondents, while celebrity advertisements were viewed by 22 per cent (Exhibit 7). ODF- or toilet-related collaterals such as construction
TRENDS IN OTT USAGE: INSIGHTS FROM THE PRIMARY SURVEY
THE NEW ENTERTAINMENT PARADIGM FOR THE URBAN POOR
and beneficiary guidelines were viewed by 9 per cent of the sample, information regarding waste management was consumed by 10 per cent, while information relating to handwashing, best practices around hygiene, etc., was viewed by 15 per cent of the total sample.
SBM-related content was the most viewed across cities, except Kolkata and Guwahati, where celebrities’ advertisements and general hygiene content, respectively, were the most consumed (Figure 51). Content related to waste management was viewed the most in Jaipur, Pune and Delhi. In contrast, Coimbatore and Guwahati showed the highest viewership of ODF- or toilet-related content.
EXHIBIT 7: Type of SBM content consumed
Others (Hand Washing, Hygiene)
47.8% Cleanliness Campaigns
21.7%
Celebrity Ads
5%Open Defecation Free
(ODF)/Toilet Related
9%Waste Management
14%

CENTRE FOR POLICY RESEARCH (CPR), INDIA 48
74%
6%
39%
19% 19% 23% 20%
0%
10%
20%
30%
40%
50%
60%
70%
80%
TV Radio Wall painting Advertisementsin print
WhatsApp Facebook YouTube
TRENDS IN OTT USAGE: INSIGHTS FROM THE PRIMARY SURVEY
THE NEW ENTERTAINMENT PARADIGM FOR THE URBAN POOR
FIGURE 51: City-wise types of SBM content consumed
FIGURE 52: Various mediums used to view SBM related content
38%
82%
74%
57%
19%
5%
15% 16%
3%
16%
4%
19%
3%
9%
29%
1% 2%
25%
5%
79%
13%
2%
67%
16%
Delhi Jaipur Coimbatore Pune Guwahati Kolkata
SBM Waste Management ODF/Toilet related Celebrities Ad Others
DIFFERENT MEDIUMS TO VIEW CLEANLINESS-RELATED CONTENT
Largely, SBM-related content was consumed over television, followed by OTT platforms (Figure 52). Digital video consumption is increasingly moving towards emerging OTT platforms. Traditional platforms remain relevant, with TV and wall paintings preferred by 74 per cent and 39 per cent, respectively, of the total sample. Among the OTT platforms, Facebook was preferred by 23 per cent, YouTube by 20 per cent, and WhatsApp by 19 per cent of the respondents. Radio was preferred by 6 per cent of the sample.
Coimbatore and Guwahati had a higher proportion of respondents who watched SBM content over OTT platforms (Figure 53). On the other hand, 88 per cent
of the respondents in Kolkata viewed SBM content on television, indicating the limited penetration of more unconventional platforms for this purpose in this city. Similarly, 54 per cent of the Delhi respondents viewed SBM content on TV, while 38 per cent preferred OTT platforms, signalling enough space for both the mediums to exist simultaneously. SBM engagement through wall paintings was widespread in Coimbatore and Pune. Traditional media (radio and advertisements in print) was preferred but less dominant than OTT platforms in Coimbatore, Guwahati, Delhi and Pune, while Jaipur recorded the highest number of respondents preferring traditional media over TV and OTT platforms.
Across the age group, SBM content was most watched on TV, followed by OTT platforms and wall paintings (Figure 54).

CENTRE FOR POLICY RESEARCH (CPR), INDIA 49
TRENDS IN OTT USAGE: INSIGHTS FROM THE PRIMARY SURVEY
THE NEW ENTERTAINMENT PARADIGM FOR THE URBAN POOR
Leveraging the penetration of the smartphone, the Indian government introduced various thematic mobisodes (mobile episodes) addressing the issues of safe sanitation, toilet usage, better toilet technologies, women’s dignity, toilet construction cost and incentive process, health benefits, etc. For the Swachh Survekshan campaign, a series of television commercials and radio ads, anthems and motivational songs have been brought out by the MoHUA featuring top celebrities (film and sports personalities including Aishwarya Rai, Sachin Tendulkar, Anil Kapoor, Shah Rukh Khan, Ayushman Khurana, Sonu Nigam, Shankar Mahadevan, Deepa Malik, etc.) and released over various OTT platforms. These emerging initiatives contributed
FIGURE 53: City-wise preferred mediums to consume SBM-related content
1%
23% 27%
88%
54%
14%21%
3% 4%
26%
75%65%
3%9%
38%28%25%
35%42%
4% 8%
27%
Coimbatore Guwahati Jaipur Kolkata New Delhi Pune
Only TV Only Wall Painting OTT Platform Traditional Media
74% 73% 74%
38%44%
37%
67%62%
51%
>=25 25-40 above 40
TV Wall Painting OTT platform
EXHIBIT 9: SBM content viewing medium by gender
FIGURE 54: Age-wise preferred mediums to coonsume SBM-related content
EXHIBIT 8: Gender-wise preferred mediums to consume SBM-related content
to awareness reaching the last mile, enabling information dissemination and capacity building initiatives to drive behaviour change for improved sanitation facilities.
The study showed SBM content was most watched on TV across gender. Male respondents had more often watched SBM content over OTT than female.
72% 66% 43%
77% 54% 29%

CENTRE FOR POLICY RESEARCH (CPR), INDIA 50
The Economic Survey 2018-19 outlined the importance of behavioural economics in enhancing the efficacy of public policies and programmes in India. It underscored the critical principles of ‘emphasizing the beneficial social norm’, ‘changing the default option’, and ‘repeated reinforcements’ which has the potential to influence the behaviour of people, that is otherwise guided primarily by social and religious norms.
In this context, this timely and unique study aimed at understanding the enabling factors driving OTT usage – growth, consumption pattern and behaviour, and content choices and preferences – among various categories of the urban poor is crucial for policymakers and industry players. It helps to carefully segment the urban poor audience, based on which appropriate messaging can be disseminated through their preferred media channels; the messaging can then be practical and translational in purpose, and guided by an awareness of real-world policy needs.
The findings revealed that urban poor do have access to smartphones and are consuming online media using OTT platforms. OTT is emerging as a popular source of entertainment across all the categories of gender, age group and occupation. On average, 3-5 hours are spent on OTT daily. Free applications are more popular on OTT platforms among the urban poor, across age, gender and occupation. People are paying to own smartphones, even if second-hand, and recharge every month to remain connected. The simplicity and efficiency of ‘on-the-go’ content is preferred across various categories.
Conclusion
THE NEW ENTERTAINMENT PARADIGM FOR THE URBAN POOR
Imag
e So
urce
: wsj.
com

CENTRE FOR POLICY RESEARCH (CPR), INDIA 51
In a world buffeted by information, there is a need to innovate constantly for targeted communication. The success of various policies and programmes significantly depends on robust IEC campaigns. For SBM, a community-based approach to sanitation was prioritised, through IEC, to achieve ODF, gender empowerment and beneficial social norms, among others; it helped tremendously to build people’s affinity for the scheme. An amount of INR 3500-4000 Cr was spent for SBM IEC activities. Therefore, it becomes imperative to dive deeper into the usage patterns of the urban poor segment consuming OTT. There is a strong potential for OTT to be a part of IEC/BCC planning strategies for a long time to come. It can guide large-scale campaigns and information dissemination.
To conclude, these data insights can be deployed strategically through media messages in identified programme locations. As part of a comprehensive strategy, these platforms could drive interest in further information, with subsequent messages moving towards desired change, greater awareness and support for the urban poor segment. The goal could be to craft messages that reach out to this particular audience efficiently to contribute to better outcomes, financial savings, and more effective and efficient policy.
COVID-19 IS LIKELY TO INFLUENCE OTT CONSUMPTIONIn the face of the ongoing COVID-19 pandemic, the economic lockdown has hit the urban poor the hardest. For the majority of the urban poor, lack of an earning source made survival difficult. The World Bank has
estimated that more than 70 million people would be driven into extreme poverty (living on less than $1.90 per day) globally as a direct impact of the ongoing crisis.
India has seen a spike in poverty numbers as a result of the lockdown due to COVID-19. Amid such an economic shock, it is possible that the average recharge amount for a family may decline significantly, so that they limit the use of phones to essential purposes. Moreover, depleting savings have compelled many to migrate back to their villages, where sustained access to electricity and internet connection may be difficult. Job losses have been highest among women, with concerns about the increased burden of the care economy falling on them during the lockdown.
With these shifts in lifestyle patterns, it is essential to understand the factors likely to influence OTT consumption. Therefore, a further study in a pandemic context to assess these changing patterns of OTT consumption may be relevant to account for public policy formulations for some time.
Although COVID-19 may have impacted the ability of urban poor to access internet connectivity by making it less affordable for them, its effectiveness as a medium to reach the last mile is likely to stay relevant. As scholars have pointed out, in a pandemic, the importance of communication for providing accurate and guided information increases manifold, particularly to combat disease-related stigma. Systemic information about the usage and choices of digital platforms may help in the designing of effective communication strategies for reaching the underserved.
CONCLUSION THE NEW ENTERTAINMENT PARADIGM FOR THE URBAN POOR

CENTRE FOR POLICY RESEARCH (CPR), INDIA 52
REFERENCES
Cisco. (2020). Cisco Annual Internet Report (2018–2023) White Paper. Cisco. https://www.cisco.com/c/en/us/solutions/collateral/executive-perspectives/annual-internet-report/white-paper-c11-741490.html
Deloitte. (2015). Digital Media: Rise of On-Deman Content. Deloitte. https://www2.deloitte.com/content/dam/Deloitte/in/Documents/technology-media-telecommunications/in-tmt-rise-of-on-demand-content.pdf
ICEA-KPMG. (2020). Contributions of Smartphones to Digital Governance in India . ICEA. https://icea.org.in/wp-content/uploads/2020/07/Contribution-of-Smartphones-to-Digital-Governance-in-India-09072020.pdf
Kuriakose, F. (2016). Going beyond technological fixes. Business Line, The Hindu. https://www.thehindubusinessline.com/opinion/going-beyond-technological-fixes/article21755810.ece1
Ministry of Finance. (2019). Economic Survey 2018-19. Government of India. https://www.indiabudget.gov.in/budget2019-20/economicsurvey/doc/echapter.pdf
PRIA. (2013). Contribution of Urban Informal Settlement Dwellers to Urban Economy in India. PRIA. https://www.pria.org/knowledge_resource/1531717758_Urban%20Poor%20Economic%20Contribution%20-%20Final%20Report.pdf
Samtani, K., & Jindal, G. (2018). Entertainment Goes Online - A $5 Billion Opportunity. BCG. https://image-src.bcg.com/Images/Entertainment-Goes-Online_tcm21-208006.pdf
MoHUP. (2013). State of Slums in India-A statstical compendium 2013. http://nbo.nic.in/pdf/Slums_in_India_Compendium_English_Version.pdf
PTI. (2019). Internet Users in India to Reach 627 Million in 2019: Report. The Economic Times. https://economictimes.indiatimes.com/tech/internet/internet-users-in-india-to-reach-627-million-in-2019-report/articleshow/68288868.cms
GSMA & Dalberg. (2017). Accelerating affordable smartphone ownership in emerging markets. Dalberg. https://dalberg.com/wp-content/uploads/2017/07/accelerating-affordable-smartphone-ownership-emerging-markets-2017.pdf
ITU. (2014). Global ICT Statistics. ITU. https://www.itu.int/en/ITU-D/Statistics/Documents/facts/ICTFactsFigures2014-e.pdf
International Labour Organization (ILO). (2016). Non-Standard Employment around the World: Understanding challenges, Shaping Prospects. https://www.ilo.org/wcmsp5/groups/public/---dgreports/---dcomm/---publ/documents/publication/wcms_534326.pdf
Istrate, D.E., & Harris, J. (2017). The Future of Work: The Rise of the Gig Economy, the Future of Work. The National Association of Counties (NACo). https://www.naco.org/featured-resources/future-work-rise-gig-economy
Mastercard & Kaiser Associates. (2019). The Global Gig Economy: Capitalizing on a ~$500B Opportunity. Newsroom Mastercard. https://newsroom.mastercard.com/wp-content/uploads/2019/05/Gig-Economy-White-Paper-May-2019.pdf
IAMAI & IMRB Kantar Report. (2017). Internet in India in 2017. IMRB Kantar. https://www.mxmindia.com/wp-content/uploads/2018/02/Internet-in-india_10-1-18.compressed.pdf
Business Line. (2019) Indian start-up space to be on fire again this year. The Hindu Business line. https://www.thehindubusinessline.com/economy/indian-start-up-space-to-be-on-fire-again-this-year/article33611303.ece
PIB. (2018). Progress Report on Multimedia Campaigns under Swachh Bharat Mission. PIB. https://archive.pib.gov.in/4yearsofnda/Comprehensive-Materials/DWS.pdf
BCG. (2017). Decoding the Digital opportunity in retail. . BCG. https://image-src.bcg.com/BCG-RAI-Decoding-the-Digital-Opportunity-in-Retail-Feb-2017_tcm9-145420.pdf
PTI. (2014). Indian application market likely to touch Rs 3,800 crore mark by 2016. Economic Times. https://economictimes.indiatimes.com/tech/software/indian-application-market-likely-to-touch-rs-3800-crore-mark-by-2016/articleshow/34293747.cms?from=mdr
W3Techs. (2021). Usage statistics of content languages for websites. Retrieved from W3Techs Website: https://w3techs.com/technologies/overview/content_language
KPMG. (2017). Indian Languages-Defining India’s internet-A study by KPMG in India and Google. KPMG. https://assets.kpmg/content/dam/kpmg/in/pdf/2017/04/Indian-languages-Defining-Indias-Internet.pdf
Doval, P., ET. (2017). 90% of net users non-English. Economic Times. https://cio.economictimes.indiatimes.com/news/internet/http/timesofindia-indiatimes-com/business/india-business/90-of-new-net-users-non-english/articleshow/58371769-cms/58372722
Karlsson, M., Penteriani, G., Croxson, H., Stanek, A., Miller, R., Pema, D., & Chitiyo, F. (2017). Accelerating affordable smartphone ownership in emerging markets. GSMA. https://www.gsma.com/mobilefordevelopment/wp-content/uploads/2018/08/Accelerating-affordable-smartphone-ownership-in-emerging-markets-2017_we.pdf
Doval, ET. (2016). Reliance Jio fuels price war, Airtel, Vodafone cut data prices. The Economic Times. https://cio.economictimes.indiatimes.com/news/internet/reliance-jio-fuels-price-war-airtel-vodafone-cut-data-prices/53568505
Noshir, K., Madgavkar, A., Kshirsagar, A., Gupta, R., Manyika, J., Bahl, K., & Gupta, S. (2019). Digital India-Technology to transform a connected nation. Mckinsey. https://www.mckinsey.com/business-functions/mckinsey-digital/our-insights/digital-india-technology-to-transform-a-connected-nation#

CENTRE FOR POLICY RESEARCH (CPR), INDIA 53
Annexure: Top 20 cities in terms of internet users (IMRB Kantar I-Cube 2014)
CITIES INTERNET USERS 2014 POPULATION 2014 INTERNET PENETRATION
NORTH
Delhi 12150000 17800000 68%
Jaipur 2350000 3334000 70%
Lucknow 1950000 3162000 62%
Ludhiana 1230000 1790000 69%
Indore 1230000 2445598 50%
SOUTH
Chennai 5580000 7773773 72%
Bangalore 5990000 9742000 61%
Coimbatore 1460000 2353000 62%
Hyderabad 5080000 8400000 60%
Nagpur 1620000 2634351 61%
Kochi 1000000 2428000 41%
WEST
Mumbai 16400000 19099000 86%
Pune 3620000 5579001 65%
Ahmedabad 3720000 6928352 54%
Vadodara 1850000 1947666 95%
Surat 2970000 5401214 55%
EAST
Kolkata 6270000 14337700 44%
Patna 1200000 2182000 55%
Vishakhapatnam 1030000 1878000 55%
NORTH EAST
Guwahati 780000 1016000 77%

54
SCALING CITY INSTITUTIONS FOR INDIA (SCI-FI)The Water and Sanitation programme at the Centre for Policy Research (CPR) is a multi-disciplinary research, outreach and policy support initiative. The programme seeks to improve the understanding of the reasons for poor sanitation, and to examine how these might be related to technology and service delivery models, institutions, governance and financial issues, and socio economic dimensions. Based on research findings, it seeks to support national, state and city authorities to develop policies and programmes for intervention with the goal of increasing access to inclusive, safe and sustainable sanitation.
Dharma Marg, Chanakyapuri, New Delhi 110021 WWW.CPRINDIA.ORG
http://cprindia.org/projects/scaling-city-institutions-india-sanitation